
ABSTRACT
Cancer cell plasticity generates heterogeneous oncogenic subpopulations in tumors. How macroautophagy/autophagy, a catabolic system required for sustaining cell homeostasis, affects cancer cell plasticity, remains elusive. In this study, we report that MAP1LC3A/LC3A (microtubule associated protein 1 light chain 3 alpha), a key molecule in autophagy, is negatively associated with histological grade and distant metastasis of lung cancer. This is achieved in part, if not all, by maintaining the mitochondria and energy homeostasis to meet the proliferation demand of lung cancer cells driven by SOX2 (SRY-box transcription factor 2) signaling. Basal autophagy is preferentially active in SOX2-positive lung cancer cells with high-proliferative and low-invasive properties. The high-proliferative cancer cells exhibit higher oxygen consumption rate (OCR), elevated reactive oxygen species (ROS), and profound fragmented mitochondrial patterns compared to their high-invasive counterparts. SOX2 expression promotes LC3A expression and enhances proliferation but attenuates invasion in lung cancer cells. LC3A silencing enriches cells harboring low-proliferative and high-invasive features, concomitant with decreased OCR and ROS levels and reduced expression of SOX2. Our findings provide novel insights into how basal autophagy cross talks with SOX2 proliferation signaling to regulate mitochondrial metabolism and determines cancer cell plasticity with an impact on lung tumor progression.
Abbreviations
ATG14: autophagy related 14; CDH2: cadherin 2; ChIP-qPCR: chromatin immunoprecipitation quantitative polymerase chain reaction; CQ: chloroquine; ECAR: extracellular acidification rate; EMT: epithelial-mesenchymal transition; EPCAM: epithelial cell adhesion molecule; MAP1LC3A/LC3A: microtubule associated protein 1 light chain 3 alpha; MAP1LC3B/LC3B: microtubule associated protein 1 light chain 3 beta; MAP1LC3C/LC3C: microtubule associated protein 1 light chain 3 gamma; NDUFV2: NADH:ubiquinone oxidoreductase core subunit V2; OCR: oxygen consumption rate; ROS: reactive oxygen species; RT-qPCR: reverse-transcriptase quantitative polymerase chain reaction; SC: scrambled control; shRNA: short hairpin RNA; SNAI2: snail family transcriptional repressor 2; SOX2: SRY-box transcription factor 2; SQSTM1/p62: sequestosome 1; TGFB/TGF-β: transforming growth factor beta; TOMM20: translocase of outer mitochondrial membrane 20; ZEB1: zinc finger E-box binding homeobox 1
Introduction
Autophagy is a catabolic process involving the sequestration of damaged organelles or debris into double membrane vesicles for further degradation [Citation1]. Members of the autophagy-related human MAP1LC3/LC3 family, comprising LC3A, LC3B, and LC3C, are structural proteins in the membrane of the phagophore and autophagosome. Their maturation occurs through cleaving the proLC3 protein into LC3-I, a cytosolic form, which is then transported to an E2-like enzyme to produce membrane-bound LC3-II in the inner and outer phagophore membranes [Citation2]. Autophagy is hyperactive in some cancer cells for the maintenance of cellular homeostasis and energy balance [Citation3,Citation4]. Lung cancer cells exhibit high basal autophagic activity and are addicted to autophagy for tumorigenesis [Citation5,Citation6]. The association between cancer metastasis and autophagy remains controversial because some studies show that autophagy promotes cancer cell migration, whereas the others suggest that autophagy inhibits cancer dissemination [Citation7,Citation8].
Mitochondria generate energy through oxidative phosphorylation in cells, while the electron transport chain produces reactive oxygen species (ROS) to impair mitochondria in energetic cells [Citation9]. Mitophagy is a specific autophagy process for removing damaged or superfluous mitochondria, thus fine-tuning mitochondrial number, preserving energy metabolism, and preventing cell death from ROS production [Citation10,Citation11].
To retain cell function in responding to different stimuli, mitochondria are under dynamic morphological changes between fusion and fission. Fission splits mitochondria, creating new mitochondria to maintain bioenergetic qualities, whereas fusion joins two or more mitochondria to optimize energy production or compensate for cytotoxic damage [Citation12,Citation13]. Interference of fusion- or fission-associated proteins affects cancer cells’ proliferative or migrative abilities, indicating the involvement of mitochondria dynamics in tumorigenesis [Citation14,Citation15].
Cancer cell plasticity creates different phenotypic and oncogenic properties in cancer cells during tumor progression [Citation16]. Epithelial–mesenchymal transition (EMT) and its reverse process mesenchymal-epithelial transition (MET) are phenotypic traits of cancer cell plasticity generated by dynamic programs to acquire motility and proliferation benefits, respectively, during different steps of tumor progression [Citation17]. SOX2 (SRY-box transcription factor 2) is an important cell fate determining factor, controlling self-renewal in embryonic stem cells and lung progenitors, and its down-regulation initiates differentiation in these cells [Citation18–20]. SOX2 is highly expressed in lung cancer cells and exhibits oncogenic properties in affecting tumorigenesis and drug resistance [Citation21–24]. However, how SOX2 signaling cross talks with LC3-mediated autophagy to cope with distinct metabolic needs in cancer cell plasticity remains unknown.
Thus, this study aims to further our understanding regarding the role of LC3-mediated autophagy in SOX2 proliferation signaling in lung cancer. We characterized how LC3A links mitochondrial metabolism and degradation to SOX2-mediated proliferation and dissemination in lung cancer cells.
Results
LC3A expression is inversely associated with histological grade and distant metastasis of lung cancer
Lung cancer is under autophagy addiction, and LC3 molecules play important roles in autophagy [Citation25]. We observed that all three LC3 molecules were more highly expressed in adenocarcinoma than in squamous cell carcinoma from TCGA Lung cancer cohort (Fig. S1A). We found that only the high expression of LC3A was associated with well differentiated, low-grade non-small cell lung cancer from GSE43580 and GSE31908 databases (; Fig. S1B, S1C). Additionally, the expression of LC3A, but not LC3B or LC3C, was inversely correlated with distant metastasis in patients with lung adenocarcinoma from TCGA cohort (; Fig. S2). Alveolar type 2 cells are the main origin of lung adenocarcinoma [Citation26]. From single cell RNA-seq analysis of normal lung tissues, we observed that LC3A was differentially expressed in different cell types, with the highest expression in alveolar type 2 cells (Fig. S3). In contrast, LC3B was ubiquitously expressed in different cell types, and LC3C was barely detected in alveolar type 2 cells (Fig. S3). Moreover, intra-tumoral heterogeneous expression pattern of LC3A was detected in lung tumors (). To further study the biological significance of heterogeneous LC3A expression in lung cancer proliferation and invasion, we adopted a high-proliferative lung cancer cell line CL1-0 and its descendant CL1-5, which was selected by five consecutive passes through Boyden chamber invasion assays from CL1-0 cells for further functional analysis [Citation27]. Clonogenic and alamarBlue assays showed that CL1-0 cells exhibited better proliferative ability than CL1-5 cells, while cell-tracking migration and matrigel invasion analysis revealed that CL1-5 cells displayed higher dissemination ability than CL1-0 cells ( left, middle; Fig. S4A and S4B). RT-qPCR assays showed that CL1-0 cells exhibited higher LC3A levels than CL1-5 cells ( right). In contrast, there was no difference in LC3B expression of CL1-0 and CL1-5 cells while LC3C levels were too low to be detected in the cells (Fig. S4C). Meanwhile, long-term TGFB/TGF-β treatment promoted migration but inhibited growth in epithelial cells [Citation28,Citation29]. To generate lung cancer cells with proliferation and migration disparities, lung adenocarcinoma cell line H1650 was treated with TGFB for four weeks and named H1650-T. We observed that H1650-T cells, while displaying higher migrative ability, exhibited lower colony-forming features compared to parental H1650 cells ( left, middle). RT-qPCR assays showed that the LC3A level was lower in H1650-T than in H1650 cells ( right).
Figure 1. Differential LC3A expression and autophagic activity in lung cancer cells. (A) One-way ANOVA and Tukey’s multiple comparison analysis of LC3A expression with histological grades in non-small cell lung cancer (N = 109) from GSE43580 database. *p < 0.05, **p < 0.01, ***p < 0.001. (B) Chi-square correlation analysis of LC3A expression with distant metastasis in lung adenocarcinoma (N = 369) from TCGA-LUAD cohort. *p < 0.05. (C) Represented IHC images (upper) of heterogeneous LC3A expression in lung adenocarcinoma (case #1) and squamous cell carcinoma (case #2). Quantitative analysis (lower) of LC3A expression and heterogeneity of non-small cell lung cancer (N = 44). Scale bar: 200 μm. (D) Clonogenic (left) and cell-tracking migration (middle) assays of CL1-0 versus CL1-5 cells. RT-qPCR (right) of LC3A expression in CL1-0 or CL1-5 cells. ***p < 0.001. (E) Clonogenic (left) and cell-tracking migration (middle) assays of H1650 versus H1650-T cells. RT-qPCR (right) of LC3A expression in H1650 and H1650-T cells. **p < 0.01, ***p < 0.001. (F) Immunoblotting analysis of LC3A and GAPDH expression in CL1-0 and CL1-5 cells treated with or without chloroquine (CQ, 12.5 μM) for 24 h. (G) Immunofluorescence analysis to assess the expression of LC3A (green) in CL1-0 and CL1-5 cells treated with or without chloroquine (CQ, 25 μM) for 24 h. Nuclei and F-actin were stained with DAPI (blue) and phalloidin (red), respectively. Scale bar: 20 μm.
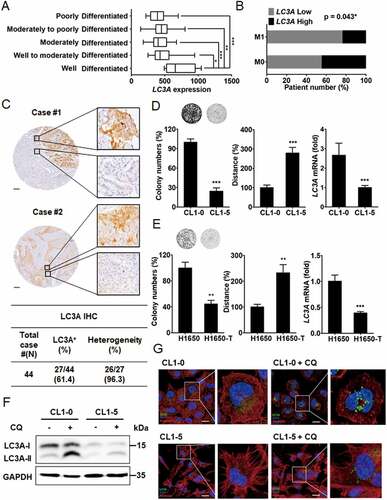
To monitor LC3A protein expression and autophagy activity in CL1-0 versus CL1-5 cells, we used chloroquine, an autophagy inhibitor preventing lysosomal protein degradation. Immunoblotting assays showed that LC3A-I, but not LC3A-II, was highly expressed in CL1-0 versus CL1-5 cells, whereas in the presence of chloroquine, CL1-0 exhibited a much higher LC3A-II level than CL1-5 cells (). Immunofluorescence staining further revealed that chloroquine treatment induced more LC3A-II autophagosome puncta formation in CL1-0 than in CL1-5 cells (). Together, these results suggest that basal autophagy is associated with high-proliferative and low-invasive features in lung cancer cell plasticity.
Down-regulation of LC3A reduces lung cancer cell growth
To identify the role of LC3A in lung cancer cell growth, RT-qPCR and immunoblotting analyses showed that LC3A expression was knocked down in CL1-0 cells ( left). Clonogenic assays showed that down-regulation of LC3A expression decreased colony formation of CL1-0 cells ( right). Similarly, knockdown of LC3A diminished cell growth in H1650 cells (). Cell cycle analysis showed that repression of LC3A with shRNAs decreased S phase but induced G1 phase in the cell cycle, whereas ANXA5/annexin V assays revealed that LC3A silencing did not affect apoptosis of CL1-0 cells (; Fig. S5A). These data support the conclusion that LC3A expression regulates cell proliferation in lung cancer.
Figure 2. LC3A expression is associated with lung cancer proliferation. (A) RT-qPCR (left upper) and immunoblotting analysis (left lower) of LC3A and GAPDH expression and clonogenic analysis (right) of CL1-0 cells transduced with the lentiviral vector encoding shLC3A (#1 and #2) or scrambled control (SC) for 14 days. shLC3A#1 and shLC3A#2 target different regions in LC3A mRNA. **p < 0.01, ***p < 0.001. (B) RT-qPCR (left upper) and immunoblotting analysis (left lower) of LC3A and GAPDH expression and clonogenic analysis (right) of H1650 cells transduced with the lentiviral vector encoding shLC3A or scrambled control (SC) for 14 days. *p < 0.05, **p < 0.01, ***p < 0.001. (C) Cell cycle analysis of CL1-0 cells transduced with the lentiviral vector encoding shLC3A or scrambled control (SC) for 14 days. Proportions of cell cycle phases were quantified in the table.
Cancer cell plasticity affects ROS production and mitochondrial dynamics
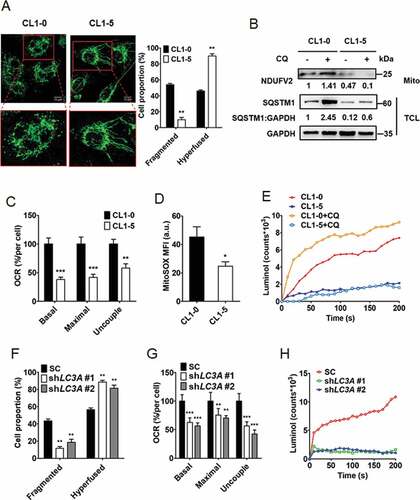
To verify the possible association of mitochondrial dynamics with cancer cell plasticity, we monitored mitochondrial dynamic patterns in CL1-0 and CL1-5 cells through TOMM20 (translocase of outer mitochondrial membrane 20) immunofluorescence staining. We found that while high-invasive CL1-5 cells mainly displayed hyperfused mitochondria patterns, high-proliferative CL1-0 cells exhibited more fragmented mitochondria patterns than CL1-5 cells, indicating the presence of differential mitochondrial dynamics in lung cancer cell plasticity (). To further examine the potential association of mitochondrial dynamics with autophagy in cancer cell plasticity, we extracted mitochondria from CL1-0 and CL1-5 cells and performed immunoblotting to check mitochondrial protein expression in the presence of chloroquine. Total cell lysate immunoblotting revealed that upon chloroquine treatment the SQSTM1/p62 level was enriched in CL1-0 but not CL1-5 cells, supporting the conclusion that autophagy is highly active in CL1-0 but not CL1-5 cells (). Mitochondrial immunoblotting showed that the expression of NDUFV2, a protein in mitochondria complex I, was accumulated by blocking autophagy with chloroquine in CL1-0 but not CL1-5 cells, indicating that autophagy-mediated mitochondrial degradation is active in CL1-0 but not CL1-5 cells (). Furthermore, the expression of NDUFV2 in CL1-0 cells was elevated by the short-term silencing of LC3A and/or chloroquine treatment (Fig. S5B). Next, to verify the possible link of mitochondrial dynamic patterns with oxygen respiration levels in lung cancer cell plasticity, the oxygen consumption rates (OCR) of CL1-0 and CL1-5 cells were measured. We found high-proliferative CL1-0 cells displayed higher OCR than high-invasive CL1-5 cells (). We further monitored the production of ROS in CL1-0 and CL1-5 cells by MitoSOX-based flow cytometry and luminol chemiluminescence assays. We observed that CL1-0 cells produced more ROS than CL1-5 cells (). Additionally, blocking autophagy with chloroquine induced ROS production in highly proliferative CL1-0 but not in highly invasive CL1-5 cells (). Since LC3A is differentially expressed in CL1-0 and CL1-5 cells, the effect of LC3A knockdown was tested on mitochondrial dynamics. We found that long-term silencing of LC3A enriched cells harboring fewer fragmented mitochondria patterns and more hyperfused patterns than the control CL1-0 cells (). OCR and luminol chemiluminescence assays revealed that LC3A knockdown enriched the cells with lower OCR and ROS production compared to the control CL1-0 cells (). To verify the effect of LC3A expression on cellular glycolysis, extracellular acidification rates (ECAR) were measured in LC3A silenced and control CL1-0 cells. We observed that LC3A knockdown did not affect ECAR in CL1-0 cells (Fig. S5C). These results suggest that differential LC3A expression in lung cancer cells may affect mitochondrial dynamics and ROS production.
Figure 3. Autophagy regulates mitochondrial dynamics and degradation as well as ROS production. (A) Representative confocal fluorescence images of mitochondrial morphology in CL1-0 (fragmented, left) and CL1-5 (hyperfused, right) cells stained with mitochondrial marker TOMM20. Scale bar: 10 μm. Proportions of mitochondrial phenotypes (fragmented and hyperfused) were quantified. **p < 0.01. (B) Immunoblotting analysis to assess NDUFV2 expression from mitochondria fraction (Mito) and SQSTM1 and GAPDH expression from total cell lysate (TCL) of CL1-0 and CL1-5 cells treated with or without chloroquine (CQ, 30 μM) for 24 h. (C) OCR analysis of CL1-0 and CL1-5 cells. **p < 0.01, ***p < 0.001. (D) MitoSOX flow cytometry analysis to detect ROS levels in CL1-0 and CL1-5 cells treated with or without chloroquine (CQ, 12.5 μM) for 24 h. *p < 0.05. (E) Luminol chemiluminescence analysis to assess ROS levels in CL1-0 and CL1-5 cells treated with or without chloroquine (CQ, 12.5 μM) for 24 h. (F) Quantitative analysis of mitochondrial morphologies in CL1-0 cells transduced with the lentiviral vector encoding shLC3A or scrambled control (SC) for 14 days. **p < 0.01. (G) OCR analysis of CL1-0 cells transduced with the lentiviral vector encoding shLC3A or scrambled control (SC) for 14 days. **p < 0.01, ***p < 0.001. (H) Luminol chemiluminescence analysis of CL1-0 cells transduced with the lentiviral vector encoding shLC3A or scrambled control (SC) for 14 days.
Autophagy regulates lung cancer cell plasticity
To verify whether LC3A expression regulates autophagy and affects lung cancer cell plasticity, we knocked down LC3A in CL1-0 cells (). Immunoblotting analysis showed that short-term knockdown of LC3A enhanced SQSTM1 expression, indicating that LC3A expression regulates autophagy flux in CL1-0 cells (). Clonogenic assays showed that long-term silencing of LC3A inhibited colony formation of CL1-0 cells (). Cell-tracking migration assays and invasion analysis showed that knockdown of LC3A enriched cells harboring high migratory and invasive properties (). To determine whether inhibition of other autophagy molecules in addition to LC3A could also affect lung cancer cell growth and invasion, LC3B and ATG14 (autophagy related 14) were knocked down in CL1-0 cells (Fig. S6A). Immunoblotting analysis revealed that short-term knockdown of LC3B or ATG14 enriched SQSTM1 expression, indicating their participation in autophagy flux regulation in lung cancer cells (Fig. S6B). Clonogenic assays showed that long-term knockdown of LC3B or ATG14 inhibited colony formation of CL1-0 cells, while invasion analysis revealed that suppression of their expression enhanced invasive ability (Fig. S6C and S6D). These data suggest that autophagy regulates cell plasticity in lung cancer.
Figure 4. LC3A-mediated autophagy is engaged in lung cancer cell plasticity. (A) RT-qPCR of LC3A expression in CL1-0 cells transduced with the lentiviral vector encoding shLC3A or scrambled control (SC) for 14 days. ***p < 0.001. (B) Immunoblotting analysis to assess LC3A, SQSTM1, and GAPDH expression in CL1-0 cells transduced with the lentiviral vector encoding shLC3A or scrambled control (SC) for 3 days. (C) Clonogenic assay of CL1-0 cells transduced with the lentiviral vector encoding shLC3A or scrambled control (SC) for 14 days. ***p < 0.001. (D) Cell-tracking migration (left) and matrigel invasion (right) assays of CL1-0 cells transduced with the lentiviral vector encoding shLC3A or scrambled control (SC) for 14 days. ***p < 0.001.
LC3A expression is positively associated with SOX2-proliferation signaling and inversely associated with EMT signature in lung cancer
To verify the engagement of SOX2 in LC3A expression and cancer cell plasticity, SOX2 and LC3A expression was monitored in CL1-0 and CL1-5 cells. We observed that CL1-5 cells, while exhibiting much less SOX2 expression, had lower LC3A levels than CL1-0 cells (). SOX2-negative CL1-5 cells displayed mesenchymal-like morphology compared with SOX2-positive CL1-0 cells, which exhibited epithelial-like phenotype (Fig. S7A). Additionally, CL1-5 cells exhibited lower expression of epithelial marker EPCAM (epithelial cell adhesion molecule), while having higher expression of mesenchymal markers SNAI2 (snail family transcriptional repressor 2), CDH2 (cadherin 2), and ZEB1 (zinc finger E-box binding homeobox 1) than CL1-0 cells (; Fig. S7B). To study the effect of endogenous SOX2 gene expression on cancer cell plasticity, CL1-5-S3 cells were generated by selection of EOS-S(4+) plasmids from CL1-5 cells [Citation30]. We observed that SOX2 enrichment in CL1-5-S3 cells not only enhanced LC3A expression but also promoted colony formation and reversed the mesenchymal-like phenotype, while invasion capabilities of CL1-5-S3 cells were lower than parental CL1-5 cells (, and Fig. S7A). Additionally, SOX2-negative CL1-5 also displayed higher expression of EMT markers than SOX2-positive CL1-0 and CL1-5-S3 cells (; Fig. S7B). To further determine the cell plasticity regulation of LC3A in SOX2-positive lung cancer cells, LC3A was knocked down in CL1-5-S3 cells (). We found that long-term silencing of LC3A in CL1-5-S3 cells decreased colony formation but promoted invasive and migrative ability (). These results conclude that LC3A regulates cancer cell plasticity in SOX2-positive lung cancer.
Figure 5. Association of LC3A levels with SOX2 and EMT markers expression in lung cancer. (A) RT-qPCR analysis to assess SOX2 and LC3A expression in CL1-0, CL1-5 and CL1-5-S3 cells. *p < 0.05, ***p < 0.001. (B) RT-qPCR analysis to assess EPCAM and SNAI2 expression in CL1-0, CL1-5 and CL1-5-S3 cells. **p < 0.01, ***p < 0.001. (C) Clonogenic (left), matrigel invasion (middle), and cell-tracking migration (right) analysis of CL1-0, CL1-5 and CL1-5-S3 cells. *p < 0.05, **p < 0.01, ***p < 0.001. (D) RT-qPCR of LC3A expression in CL1-5-S3 cells transduced with the lentiviral vector encoding shLC3A (+) or scrambled control (-) for 14 days. ***p < 0.001. (E) Clonogenic (left), matrigel invasion (middle), and cell-tracking migration (right) analysis of CL1-5-S3 cells transduced with the lentiviral vector encoding shLC3A (+) or scrambled control (-) for 14 days. ***p < 0.001. (F) Hierarchical clustering analysis of LC3A, SOX2, NBR1, epithelial marker (CDH1, EPCAM, and TJP3), and mesenchymal marker (CDH2, SNAI1, SNAI2, TWIST1, TWIST2, VIM, ZEB1, and ZEB2) expression in primary lung adenocarcinoma from TCGA-LUAD (N = 514). The heatmap was generated using Morpheus software.
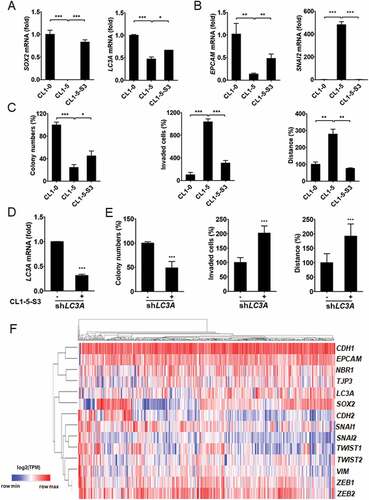
In addition, unsupervised classification of gene expression in lung adenocarcinoma further showed that LC3A and SOX2 expression was grouped with epithelial markers and was distant from mesenchymal markers from TCGA-LUAD cohort (). These findings suggest that SOX2 regulates LC3A expression and determines cell plasticity in lung cancer.
Crosstalk of SOX2 and LC3A expression in lung adenocarcinoma
To verify the crosstalk between SOX2 and LC3A-associated autophagy, we found that long-term silencing of LC3A was associated with reduced SOX2 expression in CL1-0 cells (). We further observed that H1650-T cells had lower SOX2 levels while having less LC3A expression than parental H1650 cells (). Meanwhile, ectopic expression of SOX2 promoted LC3A mRNA and protein levels in CL1-5 cells (). Bioinformatics analysis from the Encyclopedia of DNA Elements (ENCODE) identified the potential binding regions of SOX family proteins in the LC3A enhancer, and ChIP-qPCR confirmed that SOX2 preferentially bound to the specific region (Chr20: 34,514,946–34,515,016) of the LC3A enhancer in CL1-0 cells (). These findings indicate that SOX2 regulates LC3A expression in lung cancer.
Figure 6. SOX2 regulates LC3A in lung cancer cells and predicts patient prognosis in lung adenocarcinoma. (A) RT-qPCR (left) and immunoblotting (right) assays to assess SOX2 and GAPDH expression in CL1-0 cells transduced with the lentiviral vector encoding shLC3A or scrambled control (SC). ***p < 0.001. (B) RT-qPCR to assess SOX2 expression in H1650 versus H1650-T cells. ***p < 0.001. (C) RT-qPCR (left) and immunoblotting (right) assays to assess SOX2 and LC3A expression in CL1-5 cells transduced with the lentiviral vector encoding SOX2 cDNA (SOX2) or empty control (Ctrl). ***p < 0.001. (D) ChIP-qPCR analysis to access the occupancy of SOX2 at the indicated regions (1–6) along the LC3A enhancer (Chr20: 34,514,477–34,518,001) in CL1-0 cells. (E) Scatter plots of correlation between SOX2 and LC3A expression in primary lung adenocarcinoma from GSE27262 (left) and TCGA-LUAD (right), displaying positive correlations between SOX2 and LC3A. (F) Hierarchical clustering analysis of SOX2, LC3A, LC3B, and LC3C expression in primary lung adenocarcinoma from TCGA-LUAD (N = 514). (G) Kaplan–Meier analysis to assess the correlation of SOX2 (left) and LC3A (middle) expression with the overall survival of lung adenocarcinoma patients (N = 500) from TCGA-LUAD cohort. The overall survival analysis was further stratified by SOX2-high/LC3A-high and SOX2-low/LC3A-low signatures (right) for Kaplan–Meier analysis (N = 325). Different groups were compared using log-rank test. *p < 0.05.
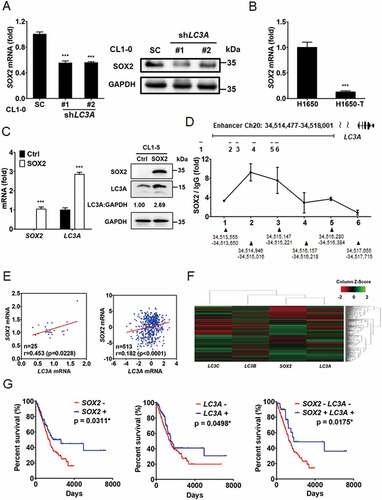
Furthermore, scatter plot correlation analysis and hierarchical clustering assays revealed a positive correlation between LC3A and SOX2 expression in primary lung adenocarcinoma from GSE27262 database and TCGA-LUAD cohort (). Survival analysis of lung adenocarcinoma patients showed that the expression of SOX2 or LC3A was associated with increased survival in patients from TCGA-LUAD cohort ( left and middle). Patients harboring a SOX2-low/LC3A-low signature had a worse prognosis ( right). These data support the conclusion that SOX2 and LC3A are involved in cancer progression.
Discussion
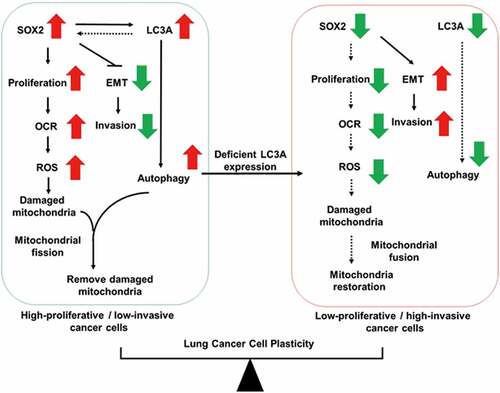
We have previously reported that lung cancer cell plasticity displays a negative correlation between cell proliferation and dissemination [Citation31]. Although autophagy addiction occurs in lung cancer, how the autophagy-mediated catabolic system regulates cancer cell plasticity is unknown. We found that high LC3A expression was inversely associated with grade and metastasis of lung tumors. We observed the intra-tumoral heterogeneous expression pattern of LC3A in lung tumors. By using pairs of lung adenocarcinoma cells to monitor the effect of LC3A heterogeneity on cancer cell plasticity, we observed that LC3A expression was necessary for growth of high-proliferative cells, in which mitochondrial dynamics and degradation as well as ROS production were regulated by LC3A-mediated autophagy. Inhibition of LC3A-mediated autophagy decreased cell proliferation and mitochondrial metabolism but enhanced invasive features. Our results supported the conclusion that LC3A serves as a critical regulator in linking autophagy-mediated mitochondrial metabolism and degradation to lung cancer cell plasticity ().
Figure 7. Model of the crosstalk between LC3A-mediated autophagy and SOX2 proliferation signaling in lung cancer. SOX2 signaling promotes proliferation but inhibits SNAI2 EMT signaling in lung cancer. SOX2-positive high-proliferative lung cancer cells exhibit higher oxygen consumption rate (OCR) and generate more reactive oxygen species (ROS), which cause mitochondrial damage and dysfunction. LC3A-mediated autophagy works with mitochondrial fission to remove damaged mitochondria (left). Deficient LC3A expression limits SOX2 proliferation signaling and tilts the balance toward the enrichment of low-proliferative/high-invasive cancer cells, which exhibit lower OCR and decreased ROS, concomitant with increased mitochondrial fusion for mitochondria restoration (right).
Cancer cell plasticity creates heterogeneous morphological and physiological features in cancer cells and affects tumor progression [Citation16]. Previously, we found that SOX2 signaling promotes proliferation but inhibits SNAI2-mediated invasion of lung cancer cells, whereas epigenetic silencing of SOX2 reverses these features and creates plasticity in lung cancer cells [Citation31]. It has been reported that basal autophagy is essential for deregulated growth of Ras-mutated lung tumors and pancreatic tumors, and inhibition of autophagy attenuates cancer cell proliferation and tumor growth [Citation5,Citation6,Citation32]. Some reports show that autophagy serves as a tumor suppressor by promoting cancer cell death [Citation33]. Similary, both pro-metastatic and anti-metastatic effects of autophagy have been reported. Autophagy could facilitate focal adhesion turnover or pro-invasive cytokine secretion, thus to enhance cancer cell migration and invasion [Citation34–36]. Recently, Marsh et al. have also shown that genetic ablation of autophagy, whereas eliciting basal cell differentiation and promoting dissemination of tumor cells, attenuated primary mammary tumor growth [Citation37]. These traits could be attributed to the expression of the autophagy cargo receptor NBR1, suggesting that autophagy can suppress cell dissemination and regulate cancer cell plasticity. It is possible that the role of autophagy in the heterogeneous tumor is complex and may differ depending on tumor cell context. Here, we not only reveal that basal autophagy is crucial for maintenance of SOX2-mediated cancer cell growth, but we also show that genetic silencing of LC3A tilts the cancer cell plasticity to enrich the cells with low SOX2 expression and low-proliferative/high-invasive features. Our findings demonstrate a critical role of basal autophagy in supporting SOX2-mediated proliferation, and thereby its expression regulates lung cancer cell plasticity ().
Autophagy is a cellular catabolic system that eliminates old or damaged molecules and organelles, including mitochondria, to sustain energy demands for proliferative cancer cells [Citation38]. Under oxidative phosphorylation, dysfunctional mitochondria lead to the accumulation of ROS, inducing oxidative pressure to cause cell death [Citation39]. A previous study showed that inhibition of autophagy in pancreatic tumors attenuates cancer cell proliferation with increased ROS and decreased mitochondrial oxidative phosphorylation [Citation32]. In addition, inhibition of mitochondrial oxidative phosphorylation promotes migration and invasion in lung cancer cells [Citation40]. Herein our data revealed that high-proliferative/low-invasive cancer cells exhibit higher basal autophagy activity accompanied with more OCR and ROS levels than their low-proliferative/high-invasive counterparts. Moreover, short-term chloroquine treatment inhibited mitophagy and induced more ROS release in high-proliferative/low-invasive cells but not in their low-proliferative/high-invasive counterparts. These data indicate the importance of the mitophagy system in the prevention of high-proliferative lung cancer cells from ROS-mediated death. Furthermore, we demonstrated that long-term silencing of LC3A expression in high-proliferative/low-invasive cells enriched cells harboring low OCR and ROS levels accompanied with low-proliferative and high-invasive features. Our data suggest that LC3A functions as a nodal regulator in linking cancer cell proliferation and ROS release to autophagy in high-proliferative cancer cells with strong demand for mitochondrial oxidative phosphorylation.
Mitochondrial dynamics, the shifting between fusion and fission types of mitochondrial morphology, corresponds to the functionality of mitochondria during proliferation, differentiation, and different physiological conditions [Citation41]. Moreover, mitochondrial fission is often observed in many lung cancer cells and can be promoted during K-Ras-mediated transformation of lung epithelial cells [Citation14]. Prevention of fission or inhibition of fusion halts the cell cycle in lung cancer cells, indicating a crucial role of fission in lung cancer cell proliferation [Citation42]. Here, we revealed that high-proliferative/low-invasive lung cancer cells displayed more fission phenotypes with fragmented mitochondria, whereas low-proliferative/high-invasive counterpart cells expressed more fusion phenotypes of hyperfused mitochondria, indicating that mitochondria dynamics correspond to functionality during cancer cell plasticity. Mitochondrial fission is recognized as a quality-control system whereby damaged mitochondria are fragmented and further eliminated by autophagy [Citation43]. In this study, we revealed that LC3A silencing tilted cancer cell plasticity and mitochondrial dynamics to enrich the cells harboring low-proliferative/high-invasive features and low-fragmented/high-hyperfused mitochondrial patterns, respectively. Recent studies also showed that the inhibition of mitochondrial fission promotes cell migration in thyroid cancer [Citation44], and the fusion of mitochondria inhibits cell proliferation in pancreatic cancer [Citation45,Citation46]. All of these data support the conclusion that autophagy affects mitochondrial dynamics and cancer cell plasticity in lung cancer.
Altogether, our findings indicate that LC3A-mediated autophagy crosstalks with SOX2 proliferation signaling to regulate mitochondrial metabolism and degradation, thereby determining cancer cell plasticity and affecting tumor progression. This study provides insights into the complexity of autophagy in tumor progression and suggests that LC3A could serve as a potential biomarker in lung cancer progression.
Material and methods
Cell culture
CL1-0, CL1-5, and CL1-5-S3 cells were established as previously described and were further certified via STR-PCR DNA profiling [Citation31]. H1650 cells were provided by Tsu-An Hsu (National Health Research Institutes, Taiwan) [Citation47]. All lung cancer cell lines were cultured in RPMI-1640 medium and supplemented with L-glutamine (4 mmol/L), sodium pyruvate (1 mmol/L), HEPES (10 mmol/L), and fetal bovine serum (10% FBS).
Chemicals and reagents
Recombinant human TGFB was purchased from Sino biological (10,804-HNAC). Chloroquine was obtained from Acros Organics, Thermo Fisher Scientific (AC455240250). RPMI-1640 (31,800–014) and FBS (10,437–028) were ordered from GIBCO-BRL.
Plasmid construction
shRNA clones of pLKO.1-shLC3A, pLKO.1-shLC3B and pLKO.1-shATG14 were obtained from the National RNAi Core Facility, Academia Sinica (Taipei, Taiwan). Detailed information about the shRNA clones is provided in Table S1. The transduction of EOS-S(4+) reporter plasmid was prepared as described previously [Citation30]. SOX2 expression vector was described previously [Citation24].
Reverse-transcriptase quantitative PCR assays (RT-qPCR)
RT-qPCR was performed with specific primers and TaqMan probes or probes from the Universal Probe Library (Roche Applied Science) in the StepOne Real-Time PCR system (Applied Biosystems Inc.) [Citation48]. RNA18S was used as a reference transcript. Primer sequences designed to detect specific genes and probes are listed in Table S2.
Clonogenic assay
Cells were seeded at a density of 1.0 × 10³/well in a 6-well culture plate in triplicate and cultured for 14 days. The surviving colonies were fixed and stained with 0.25% crystal violet solution (Thermo Fisher Scientific, C581-25). The area of stained colonies was quantified using ImageJ software.
Cell tracking time-lapse microscopy and matrigel invasion assay
Cell tracking time-lapse microscopy was performed as previously described [Citation49]. Briefly, cells were plated at a density of 4.0 × 10⁵ in a 6-cm culture plate, and cell movement was monitored and photographed at 10 min intervals for 24 h using a Lumascope 620 (Etaluma, Inc, Carlsbad, CA, USA). The average trajectory was measured by tracking five randomly selected cells and analyzed using ImageJ software. Matrigel invasion assay was performed using FluroBlok 24-multiwell cell culture insert system (BD Biosciences) as described previously [Citation31].
Chromatin immunoprecipitation quantitative PCR assays (ChIP-qPCR)
ChIP-qPCR was performed as previously described [Citation31]. Cells (4 × 10⁷) were collected, followed by ChIP assays with anti-SOX2 (Cell Signaling Technology, 23,064) or IgG (Genetex, GTX35035). Primer sequences to detect the SOX2 binding site along the LC3A enhancer are listed in Table S3.
Flow cytometry analysis
Cells were aliquoted 1 × 10⁶ cells/ml into tubes and fixed with ice cold methanol for 10 min at −20°C. Fixed cells were stained with propidium iodide/PI (APOLO biochemical, APL-JCPP-255,351) for cell cycle analysis [Citation49] or with MitoSOXTM Red (Thermo Fisher, M36008) for mitochondrial ROS assessment [Citation50] at room temperature for 30 min. Stained cells were further subjected to flow cytometry assays, according to the manufacturer’s instructions.
Luminol chemiluminescence analysis
The ROS production in lung cancer cell lines was measured via a modified chemiluminescence detection method as described previously [Citation51]. Briefly, 0.9 ml of cell lysate (5 × 10⁵ cells) was mixed with 0.1 ml of luminol (0.28 mM; Sigma, A4685), followed by ROS detection via a Chemiluminescence Analyzing System with the self-build software (CLA-FSL, Tohoku Electronic Inc. Co., Sendai, Japan).
Immunoblotting
Cells were harvested in RIPA lysis buffer supplemented with a protease inhibitor cocktail (Roche, 04693132001), and immunoblotting was performed with LC3A antibody (GeneTex, GTX61566 and GTX48634), SOX2 antibody (Millipore, MAB4343), SQSTM1/p62 antibody (GeneTex, GTX100685 and Abcam, ab56416), NDUFV2 antibody (Santa Cruz Biotechnology, sc-68,887), or GAPDH antibody (GeneTex, GTX100118).
Immunofluorescence (IF) staining
Immunostaining was performed with anti-LC3A (GeneTex, GTX61566) and anti-TOMM20 (Santa Cruz Biotechnology, sc-11,415) antibodies as previously described [Citation52]. Fluorescence images were acquired on a confocal microscope (Olympus, FV1000D, Tokyo, Japan). Classification of mitochondria morphology were based on the comparison of experimental cells with cells transformed with dominant mutants, such as DNM1L/Drp1K38A and DNM1LS637A. DNM1LK38A caused elongated mitochondria, while DNM1LS637A caused fragmented mitochondria. Mitochondria with clear networks were considered as tubular mitochondria. The percentages of mitochondria with the indicated morphologies were determined as percentages of the total number of cells counted (≥ 100 cells per experiment).
Immunohistochemistry (IHC) staining
The human lung cancer tissue array was obtained from SuperBioChips Laboratories (CC5). IHC was conducted with anti-LC3A antibody as previously described [Citation49]. The immunohistochemical staining intensities (0, 1, 2, and 3) and area (percentage) of LC3A expression in epithelial cancer cells of specimens were examined by pathologist Dr. Shien-Tung Pan and quantified via H-score assessment. The specimens with different staining intensities of LC3A expression were regarded as possessing LC3A heterogeneity.
Mitochondria isolation
Mitochondria were isolated as previously described [Citation53] with some modifications. 4 × 10⁷ cells were collected and homogenized in the mitochondria extraction buffer (250 mM sucrose [Sigma, S5391], 10 mM KCl [Merck, 104,933], 1.5 mM MgCl2 [Sigma, 20–303], 1 mM EDTA [Sigma, 20–158], 20 mM HEPES/KOH [Bionovas, AH0043-0250; Sigma, 757,551], pH 7, 1 mM DTT [Cyrus bioscience, 101–3483-12-3], 1 mM PMSF [Roche, PMSF-RO]). The pellet of homogenized mixture was collected after centrifugation and dissolved in solubilization buffer (50 mM NaCl [Avantor, JTB-3624-05], 50 mM imidazole hydrochloride [Sigma, I3386], 2 mM 6-aminocaproic acid [Sigma, A2504], 1 mM EDTA, 2.5% of DDM detergent [Sigma, D4641]). The supernatant of pellet-solubilization buffer mixture were further collected and subjected to immunoblotting.
Oxygen consumption rate (OCR) analysis
The oxygen consumption rate was assessed in Oxygraphy-2 K (OROBOROS Instruments, Innsbruck, Austria) as previously described [Citation54] with some modifications. Briefly, medium containing 1 × 10⁶ cells were injected into a glass chamber at 37°C with continuous stirring. The chambers were closed and recorded the oxygen consumption at 2 sec intervals until the consumption curve stabilized. The data were analyzed with DatLab software.
Public domain data and statistical analysis
The public gene expression profiling datasets and RNA-seq datasets used in this study were analyzed as described previously [Citation49]. The sources of these datasets are listed in Table S4. Association between the gene expression group and lung cancer types or metastatic status were calculated by Chi square test, with the median LC3A, LC3B and LC3C expression levels referred to cutoff points. Associations among various gene expressions were calculated by using Pearson correlation coefficient. Survival curves were generated with Prism 5.0 (GraphPad software Inc.) and estimated by the Kaplan–Meier method. The differences of survival between the high- and low gene–expressing groups were compared by log-rank test. Hierarchical clustering analysis of genes in patient cohort was generated by Morpheus software (software.broadinstitute.org/morpheus/) and ArrayMining [Citation55]. All statistical analyses were performed by using SPSS software, version 16 (SPSS Inc., Chicago, IL, USA).
Supplemental Material
Download MS Word (1.2 MB)Acknowledgments
We thank Prof. Hsiao-Sheng Liu (Kaohsiung Medical University, Taiwan) for critical reading of this manuscript and insightful comments.
Disclosure statement
No potential conflict of interest was reported by the author(s).
Supplementary material
Supplemental data for this article can be accessed here.
Additional information
Funding
References
- Mizushima N. Autophagy: process and function. Genes Dev. 2007;21(22):2861–2873.
- Koukourakis MI, Kalamida D, Giatromanolaki A, et al. Autophagosome proteins LC3A, LC3B and LC3C have distinct subcellular distribution kinetics and expression in cancer cell lines. Plos One. 2015;10(9):e0137675.
- Yang S, Kimmelman AC. A critical role for autophagy in pancreatic cancer. Autophagy. 2011;7(8):912–913.
- Karsli-Uzunbas G, Guo JY, Price S, et al. Autophagy is required for glucose homeostasis and lung tumor maintenance. Cancer Discov. 2014;4(8):914–927.
- Guo JY, Chen H-Y, Mathew R, et al. Activated Ras requires autophagy to maintain oxidative metabolism and tumorigenesis. Genes Dev. 2011;25(5):460–470.
- Guo JY, Karsli-Uzunbas G, Mathew R, et al. Autophagy suppresses progression of K-ras-induced lung tumors to oncocytomas and maintains lipid homeostasis. Genes Dev. 2013;27(13):1447–1461.
- Dower CM, Wills CA, Frisch SM, et al. Mechanisms and context underlying the role of autophagy in cancer metastasis. Autophagy. 2018;14(7):1110–1128.
- Kenific CM, Thorburn A, Debnath J. Autophagy and metastasis: another double-edged sword. Curr Opin Cell Biol. 2010;22(2):241–245.
- Sabharwal SS, Schumacker PT. Mitochondrial ROS in cancer: initiators, amplifiers or an Achilles‘ heel? Nat Rev Cancer. 2014;14(11):709–721.
- Vara-Perez M, Felipe-Abrio B, Agostinis P. Mitophagy in cancer: a tale of adaptation. Cells. 2019;8(5):493.
- Palikaras K, Lionaki E, Tavernarakis N. Mechanisms of mitophagy in cellular homeostasis, physiology and pathology. Nat Cell Biol. 2018;20(9):1013–1022.
- Westermann B. Mitochondrial fusion and fission in cell life and death. Nat Rev Mol Cell Biol. 2010;11(12):872–884.
- Youle RJ, van der Bliek AM. Mitochondrial fission, fusion, and stress. Science. 2012;337(6098):1062–1065.
- Serasinghe MN, Wieder S, Renault T, et al. Mitochondrial division is requisite to RAS-induced transformation and targeted by oncogenic MAPK pathway inhibitors. Mol Cell. 2015;57(3):521–536.
- Kashatus JA, Nascimento A, Myers L, et al. Erk2 phosphorylation of Drp1 promotes mitochondrial fission and MAPK-driven tumor growth. Mol Cell. 2015;57(3):537–551.
- Marusyk A, Polyak K. Tumor heterogeneity: causes and consequences. Biochim Biophys Acta. 2010;1805(1):105–117.
- Yuan S, Norgard RJ, Stanger BZ. Cellular plasticity in cancer. Cancer Discov. 2019;9(7):837–851.
- Zhang S, Cui W. Sox2 a key factor in the regulation of pluripotency and neural differentiation. World J Stem Cells. 2014;6(3):305–311.
- Huangfu D, Osafune K, Maehr R, et al. Induction of pluripotent stem cells from primary human fibroblasts with only Oct4 and Sox2. Nat Biotechnol. 2008;26(11):1269–1275.
- Gontan C, De Munck A, Vermeij M, et al. Sox2 is important for two crucial processes in lung development: branching morphogenesis and epithelial cell differentiation. Dev Biol. 2008;317(1):296–309.
- Hussenet T, Dali S, Exinger J, et al. SOX2 is an oncogene activated by recurrent 3q26.3 amplifications in human lung squamous cell carcinomas. PLOS ONE. 2010;5(1):e8960.
- Rudin CM, Durinck S, Stawiski EW, et al. Comprehensive genomic analysis identifies SOX2 as a frequently amplified gene in small-cell lung cancer. Nat Genet. 2012;44(10):1111–1116.
- Lu Y, Futtner C, Rock JR, et al. Evidence that SOX2 overexpression is oncogenic in the lung. Plos One. 2010;5(6):e11022.
- Chou YT, Lee CC, Hsiao SH, et al. The emerging role of SOX2 in cell proliferation and survival and its crosstalk with oncogenic signaling in lung cancer. Stem Cells. 2013;31(12):2607–2619.
- Schlafli AM, Adams O, Galván JA, et al. Prognostic value of the autophagy markers LC3 and p62/SQSTM1 in early-stage non-small cell lung cancer. Oncotarget. 2016;7(26):39544–39555.
- Sainz de Aja J, Dost AFM, Kim CF. Alveolar progenitor cells and the origin of lung cancer. J Intern Med. 2021;289(5):629–635.
- Chu YW, Yang PC, Yang SC, et al. Selection of invasive and metastatic subpopulations from a human lung adenocarcinoma cell line. Am J Respir Cell Mol Biol. 1997;17(3):353–360.
- Huang SS, Huang JS. TGF-beta control of cell proliferation. J Cell Biochem. 2005;96(3):447–462.
- Heldin CH, Landstrom M, Moustakas A. Mechanism of TGF-beta signaling to growth arrest, apoptosis, and epithelial-mesenchymal transition. Curr Opin Cell Biol. 2009;21(2):166–176.
- Hotta A, Cheung AY, Farra N, et al. Isolation of human iPS cells using EOS lentiviral vectors to select for pluripotency. Nat Methods. 2009;6(5):370–376.
- Lin SC, Chou YT, Jiang SS, et al. Epigenetic switch between SOX2 and SOX9 regulates cancer cell plasticity. Cancer Res. 2016;76(23):7036–7048.
- Yang S, Wang X, Contino G, et al. Pancreatic cancers require autophagy for tumor growth. Genes Dev. 2011;25(7):717–729.
- Yun CW, Lee SH. The roles of autophagy in cancer. Int J Mol Sci. 2018;19(11):3466.
- Sharifi MN, Mowers E, Drake L, et al. Autophagy promotes focal adhesion disassembly and cell motility of metastatic tumor cells through the direct interaction of paxillin with LC3. Cell Rep. 2016;15(8):1660–1672.
- Kenific CM, Stehbens SJ, Goldsmith J, et al. NBR1 enables autophagy-dependent focal adhesion turnover. J Cell Biol. 2016;212(5):577–590.
- Lock R, Kenific CM, Leidal AM, et al. Autophagy-dependent production of secreted factors facilitates oncogenic RAS-driven invasion. Cancer Discov. 2014;4(4):466–479.
- Marsh T, Kenific CM, Suresh D, et al. Autophagic degradation of NBR1 restricts metastatic outgrowth during mammary tumor progression. Dev Cell. 2020;52(5):591–604 e6.
- White E. The role for autophagy in cancer. J Clin Invest. 2015;125(1):42–46.
- Waris G, Ahsan H. Reactive oxygen species: role in the development of cancer and various chronic conditions. J Carcinog. 2006;5(1):14.
- Han SY, Jeong YJ, Choi Y, et al. Mitochondrial dysfunction induces the invasive phenotype, and cell migration and invasion, through the induction of AKT and AMPK pathways in lung cancer cells. Int J Mol Med. 2018;42(3):1644–1652.
- Trotta AP, Chipuk JE. Mitochondrial dynamics as regulators of cancer biology. Cell Mol Life Sci. 2017;74(11):1999–2017.
- Rehman J, Zhang HJ, Toth PT, et al. Inhibition of mitochondrial fission prevents cell cycle progression in lung cancer. FASEB J. 2012;26(5):2175–2186.
- van der Bliek AM, Shen QF, Kawajiri S. Mechanisms of mitochondrial fission and fusion. Cold Spring Harb Perspect Biol. 2013;5(6):a011072–a011072.
- Ferreira-da-Silva A, Valacca C, Rios E, et al. Mitochondrial dynamics protein drp1 is overexpressed in oncocytic thyroid tumors and regulates cancer cell migration. PLOS ONE. 2015;10(3):e0122308.
- Yu M, Nguyen ND, Huang Y, et al. Mitochondrial fusion exploits a therapeutic vulnerability of pancreatic cancer. JCI Insight. 2019;5(16):126915.
- Yu M, Huang Y, Deorukhkar A, et al. Mitochondrial fusion suppresses pancreatic cancer growth via reduced oxidative metabolism. bioRxiv. 2018. doi: 10.1101/279745.
- Vallette FM, Olivier C, Lézot F, et al. Dormant, quiescent, tolerant and persister cells: four synonyms for the same target in cancer. Biochem Pharmacol. 2019;162:169–176.
- Hwang W, Chiu YF, Kuo MH, et al. Expression of neuroendocrine factor VGF in lung cancer cells confers resistance to EGFR kinase inhibitors and triggers epithelial-to-mesenchymal transition. Cancer Res. 2017;77(11):3013–3026.
- Lee C-J, Sung P-L, Kuo M-H, et al. Crosstalk between SOX2 and cytokine signaling in endometrial carcinoma. Sci Rep. 2018;8(1):17550.
- Kauffman ME, Kauffman MK, Traore K, et al. MitoSOX-based flow cytometry for detecting mitochondrial ROS. React Oxyg Species (Apex). 2016;2(5):361–370.
- Hung G-D, Li P-C, Lee H-S, et al. Green tea extract supplementation ameliorates CCl4-induced hepatic oxidative stress, fibrosis, and acute-phase protein expression in rat. J Formos Med Assoc. 2012;111(10):550–559.
- Chou Y-T, Hsieh C-H, Chiou S-H, et al. CITED2 functions as a molecular switch of cytokine-induced proliferation and quiescence. Cell Death Differ. 2012;19(12):2015–2028.
- Xue YP, Kao MC, Lan CY. Novel mitochondrial complex I-inhibiting peptides restrain NADH dehydrogenase activity. Sci Rep. 2019;9(1):13694.
- Chen Y-C, Cheng T-H, Lin W-L, et al. Srv2 is a pro-fission factor that modulates yeast mitochondrial morphology and respiration by regulating actin assembly. iScience. 2019;11:305–317.
- Glaab E, Garibaldi JM, Krasnogor N. ArrayMining: a modular web-application for microarray analysis combining ensemble and consensus methods with cross-study normalization. BMC Bioinformatics. 2009;10(358):358.