
ABSTRACT
We recently identified FAM134B2, which is an N-terminal truncated reticulophagy receptor highly induced by starvation such as fasting of mice and treatment of mammalian cells with a starvation medium that does not contain amino acids, glucose and growth factors. However, which starvation signal mediates the induction of FAM134B2 is still obscure. In this study, we found that amino acid deficiency (AAD) could mimic the starvation condition to induce FAM134B2 expression. Unexpectedly, EIF2AK4/GCN2-mediated integrated signal response (ISR) and MTOR (mechanistic target of rapamycin kinase) signals, which constitute two major signaling pathways that respond to AAD, did not contribute to AAD-induced FAM134B2 induction. mRNA-seq and siRNA screenings identified two ISR-independent transcription factors, MEF2D (myocyte enhancer factor 2D) and NR4A1 (nuclear receptor subfamily 4 group A member 1), involved in AAD-induced FAM134B2 expression. AAD induces MEF2D, resulting in the induction of NR4A1, which in turn induces FAM134B2-mediated reticulophagy to maintain intracellular amino acid levels. In conclusion, the MEF2D-NR4A1-FAM134B2 cascade is a critical signal in amino acid homeostasis.
Abbreviations
AAD: amino acid deficiency; APOC3: apolipoprotein C3; BACH1: BTB domain and CNC homolog 1; CEBP: CCAAT enhancer binding protein; DDIT3/CHOP: DNA damage inducible transcript 3; EBSS: Earle’s Balanced Salt Solution; EIF2AK4/GCN2: eukaryotic translation initiation factor 2 alpha kinase 4; ER: endoplasmic reticulum; HisOH: histidinol; ISR: integrated stress response; MAP1LC3/LC3: microtubule associated protein 1 light chain 3; MEF2D: myocyte enhancer factor 2D; MTOR: mechanistic target of rapamycin kinase; NR4A1: nuclear receptor subfamily 4 group A member 1; RETREG1/FAM134B: reticulophagy regulator 1; RTN2: reticulon 2, TF: transcription factor; TFEB: transcription factor EB; ZBTB10: zinc finger and BTB domain containing 10
Introduction
Amino acid homeostasis is important for healthy cellular function, metabolism and growth. Autophagy is an intracellular recycling system in which cellular proteins and organelles are captured within a double membrane vesicle called an autophagosome prior to fusion with a lysosome [Citation1,Citation2]. Amino acids and autophagy are tightly regulated with each other. Autophagy is a major survival mechanism that recycles amino acids during starvation such as amino acid deficiency (AAD) [Citation3,Citation4]. Amino acids on the other hand inhibit autophagy. The amino acid regulation of autophagy occurs at the post-translational stage but also at transcriptional levels via two key signaling cascades: MTORC1 (mechanistic target of rapamycin complex 1) and the EIF2AK4/GCN2 (eukaryotic translation initiation factor 2 alpha kinase 4) pathways [Citation4].
Macroautophagy can be either nonselective or selective. Selectivity is mediated by autophagy receptors tethering cargo to the growing autophagosome membrane [Citation1,Citation5]. The endoplasmic reticulum (ER) is the largest multifunctional organelle and is the major site for protein and lipid synthesis as well as intracellular calcium storage [Citation6,Citation7]. To prevent the accumulation of toxic protein aggregates, the ER harbors a well-studied quality control pathway known as ER-associated degradation, in which misfolded ER proteins are extracted for destruction by the proteasome [Citation8,Citation9]. However, recent studies show that ER-selective autophagy, named reticulophagy, is also actively involved in quality control of the ER [Citation10,Citation11]. A number of ER-resident proteins [RETREG1/FAM134B1 (reticulophagy regulator 1), SEC62 (SEC62 homolog, preprotein translocation factor), RTN3L (full length reticulon 3), CCPG1 (cell cycle progression 1), ATL3 (atlastin GTPase 3) and TEX264 (testis expressed 264)] have been identified as contributing to reticulophagy by interacting with MAP1LC3/LC3 (microtubule associated protein 1 light chain 3) or GABARAP (GABA type A receptor-associated protein) present on the growing phagophore membrane [Citation12–18].
Although the recent identification of reticulophagy receptors advanced the understanding of reticulophagy, the transcriptional regulation of the process is largely not understood. We recently identified a novel N-terminal truncated isoform of RETREG1, FAM134B2, whose gene expression utilizes a distinct exon 1 and gene promoter from the full-length isoform, RETREG1 [Citation19]. Many peripheral tissues such as liver, pancreas, adipose tissue and skeletal muscle express only FAM134B2 but not RETREG1. Starvation markedly induces FAM134B2 gene expression in mouse peripheral tissues including the liver, which only expresses the FAM134B2 isoform [Citation19]. Starvation-induced hepatic FAM134B2 expression is mediated through the activation of CEBPB (CCAAT enhancer binding protein-β) [Citation19]. Interestingly, unlike the full-length isoform RETREG1, FAM134B2 regulates the autophagic degradation of secretory proteins synthesized in the ER, such as APOC3 (apolipoprotein C3), rather than that of nonspecific ER fragments. FAM134B2 is able to directly bind to both lipidated LC3B (LC3B-II) and APOC3, delivering them to lysosomes through an ATG7 (autophagy related 7) dependent manner [Citation19].
In our previous study, we found that treatment of HeLa cells with Earle’s Balanced Salt Solution (EBSS), a starvation medium that does not contain amino acids, glucose and growth factors induces FAM134B2 expression similar to fasting in vivo [Citation19]. However, whether the induction of FAM134B2 by starvation in cultured cells depends on CEBPB has not yet been confirmed. While insulin is a predominant factor that regulates hepatic autophagy in vivo, amino acids are the major regulator of starvation-induced autophagy in cultured cells [Citation20–22]. We therefore speculated that the regulation of FAM134B2 by starvation might occur differently between in vivo animals and cultured cells. Using sequential screening, we identified a transcriptional pathway that regulates AAD-induced FAM134B2-mediated selective autophagy and amino acid homeostasis.
Results
AAD induces FAM134B2 but not RETREG1 through a mechanism independent of CEBPs, EIF2AK4-ISR and MTORC1 signals
Consistent with our previous report [Citation19], treatment of HeLa cells with EBSS selectively increased levels of FAM134B2 but not RETREG1 (). In addition, immunoblot analysis shows that HeLa cells predominantly express FAM134B2 over RETREG1 (). Since amino acids are known to be a predominant regulator of autophagy in cultured cells [Citation22,Citation23], we next examined whether amino acid deficiency (AAD) induces FAM134B2 expression by treating HeLa cells with Leucine (Leu)-deficient media [Citation24,Citation25] or a Histidine antagonist, L-Histidinol [His(OH)] [Citation26,Citation27]. Leu deficiency and HisOH selectively increased levels of FAM134B2 but not RETREG1 (), along with increased expression of CEBPB, CEBPD and CEBPG (). We next examined whether AAD-induced FAM134B2 is mediated by CEBPB or other CEBPs that were induced by AAD, consistent with starvation-induced hepatic FAM134B2 in vivo [Citation19]. However, no CEBPs mediated AAD-induced FAM134B2 (). We next used a CEBP-RE luciferase reporter to examine whether CEBP is functional in HeLa cells. HisOH treatment significantly induced CEBP-responsive element-derived luciferase activity, which was blocked by CEBP siRNA pretreatment, suggesting that CEBPB activity was induced by HisOH treatment (Figure S1A).
Figure 1. Starvation and AAD induce FAM134B2 through a pathway independent of CEBPs, EIF2AK4 and MTOR. (A, B) RETREG1 and FAM134B2 mRNA expression in HeLa cells treated with EBSS or complete DMEM (CM). (C) FAM134B2 protein expression in HeLa cells treated with EBSS. HeLa cells were treated with EBSS for 6 h. (D, E) RETREG1 and FAM134B2 mRNA expression in HeLa cells treated with leucine-deficient media. HeLa cells were treated with DMEM lacking Leucine for 6 h. (F, G) RETREG1 and FAM134B2 mRNA expression in HeLa cells treated with a Histidine antagonist, HisOH. (H) CEBP mRNA expression in HeLa cells treated with HisOH. HeLa cells were treated with DMEM containing 2 mM HisOH for 6 h. (I) CEBP mRNA expression in HeLa cells treated with CEBP RNAi. (J) FAM134B2 mRNA expression in HeLa cells treated with CEBP RNAi in the presence of HisOH. HeLa cells were treated with 10 nM RNAi in the presence of RNAi Max for 16 h and then treated with 2 mM HisOH for 6 h. (K–M) EIF2AK4, FAM134B2 and DDIT3 expression in HeLa cells treated with EIF2AK4 RNAi and HisOH. HeLa cells were treated with 10 nM RNAi in the presence of RNAi Max for 16 h and then treated with 2 mM HisOH for 6 h. (N, O) FAM134B2 and DDIT3 expression in HeLa cells treated with ISRIB and HisOH. HeLa cells were treated with 200 nM ISRIB for 2 h and then treated with 2 mM HisOH for 6 h. (P) Effect of MTOR on the mRNA expression of FAM134B2. HeLa cells were treated with MTOR inhibitors [rapamycin (Rapa), 100 nM and Torin 1, 1 μM] for 6 h. ***P < 0.001.
![Figure 1. Starvation and AAD induce FAM134B2 through a pathway independent of CEBPs, EIF2AK4 and MTOR. (A, B) RETREG1 and FAM134B2 mRNA expression in HeLa cells treated with EBSS or complete DMEM (CM). (C) FAM134B2 protein expression in HeLa cells treated with EBSS. HeLa cells were treated with EBSS for 6 h. (D, E) RETREG1 and FAM134B2 mRNA expression in HeLa cells treated with leucine-deficient media. HeLa cells were treated with DMEM lacking Leucine for 6 h. (F, G) RETREG1 and FAM134B2 mRNA expression in HeLa cells treated with a Histidine antagonist, HisOH. (H) CEBP mRNA expression in HeLa cells treated with HisOH. HeLa cells were treated with DMEM containing 2 mM HisOH for 6 h. (I) CEBP mRNA expression in HeLa cells treated with CEBP RNAi. (J) FAM134B2 mRNA expression in HeLa cells treated with CEBP RNAi in the presence of HisOH. HeLa cells were treated with 10 nM RNAi in the presence of RNAi Max for 16 h and then treated with 2 mM HisOH for 6 h. (K–M) EIF2AK4, FAM134B2 and DDIT3 expression in HeLa cells treated with EIF2AK4 RNAi and HisOH. HeLa cells were treated with 10 nM RNAi in the presence of RNAi Max for 16 h and then treated with 2 mM HisOH for 6 h. (N, O) FAM134B2 and DDIT3 expression in HeLa cells treated with ISRIB and HisOH. HeLa cells were treated with 200 nM ISRIB for 2 h and then treated with 2 mM HisOH for 6 h. (P) Effect of MTOR on the mRNA expression of FAM134B2. HeLa cells were treated with MTOR inhibitors [rapamycin (Rapa), 100 nM and Torin 1, 1 μM] for 6 h. ***P < 0.001.](/cms/asset/85ef9248-8ec5-47b3-a336-7aee3cc440af/kaup_a_1968228_f0001_b.gif)
Since EIF2AK4 -mediated integrated stress response (ISR) and MTORC1 pathways are major cascades that regulate AAD-induced autophagy and autophagy-related gene expression [Citation4,Citation28,Citation29], we next examined whether these pathways contribute to AAD-induced FAM134B2. Unexpectedly, neither EIF2AK4 siRNA or ISRIB (ISR inhibitor) [Citation30] treatment affected AAD-induced FAM134B2 expression, whereas the induction of a major target of EIF2AK4-ISR, DDIT3/CHOP (DNA damage inducible transcript 3), by AAD was completely attenuated by EIF2AK4 siRNA or ISRIB treatment ). In addition, in contrast to AAD, treatment with MTORC1 inhibitors such as rapamycin and torin-1 significantly reduced levels of FAM134B2 mRNA (). These data suggest that AAD-induced FAM134B2 expression occurs via a novel EIF2AK4-ISR- and MTOR-independent transcriptional pathway.
RNA-seq, RT-qPCR analysis and RNAi screening identified 4 TFs that contribute to AAD-induced FAM134B2 expression
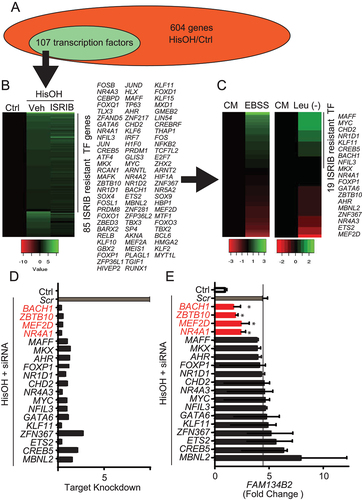
To identify a transcription factor responsible for AAD-induced FAM134B2, RNA from HeLa cells treated with HisOH was subjected to RNA-seq. HisOH treatment significantly increased levels of 604 genes including FAM134B2, 107 of which belonged to transcription factors (TF) (Table S4 and ). We next examined which TF occurred independently of ISR using RNA from HeLa cells treated with HisOH in the presence of ISRIB. Surprisingly, 85 out 107 TF were ISR-independently upregulated by HisOH ( and Table S5). We next screened whether the 85 ISR-independent TFs were induced by Leu deficiency or EBSS treatment. Based on the sequential screenings, 19 TF candidates that were ISR-independently induced by AAD were identified (). We purchased a Dharmacon custom RNAi library with 19 TFs. Treatment of HeLa cells with siRNAs effectively reduced the target gene expression by over 75% () and identified four TFs [MEF2D (myocyte enhancer factor 2D), NR4A1/Nur77 (nuclear receptor subfamily 4 group A member 1, ZBTB10 (zinc finger and BTB domain containing 10) and BACH1 (BTB domain and CNC homolog 1)] that contribute to AAD-induced FAM134B2 expression ().
Figure 2. Identification of transcription factors contributing to AAD-induced FAM134B2. (A) Transcription factors (TF) induced in HeLa cells treated with HisOH. HeLa cells (N = 3) were treated with DMEM containing 2 mM HisOH or without HisOH (Ctrl) for 6 h. Total RNA was subjected to RNA-seq (Table S2). (B) Effect of ISR inhibition on induced TF mRNA expression by HisOH. HeLa cells (N = 3) were treated with 200 nM ISRIB for 2 h and then treated with 2 mM HisOH for 6 h. (C) HisOH-induced TF mRNA expression in HeLa cells treated with EBSS, Leu-deficient DMEM or complete DMEM (CM). (D) TF mRNA expression in HeLa cells treated with RNAi. (E) FAM134B2 mRNA expression in HeLa cells treated with siRNAs. HeLa cells were treated with 10 nM RNAi in the presence of RNAi Max for 16 h and then treated with 2 mM HisOH for 6 h. *P < 0.05 vs. Scramble siRNA (Scr).
MEF2D-NR4A1 cascade regulates FAM134B2 expression
To examine whether 1) the four identified TFs selectively contribute to AAD-induced FAM134B2 and 2) the four identified TFs regulate each other, we analyzed FAM134B2 and the four TF proteins and gene expressions in the absence and presence of HisOH. All of the 4 TF siRNA significantly reduced AAD-induced FAM134B2 expression (). In the absence of HisOH, NR4A1 and BACH1 siRNA did not affect FAM134B2, while ZBTB10 siRNA drastically reduced basal FAM134B2 expression (). These data suggest that the effect of ZBTB10 on FAM134B2 expression is not specific to AAD. In addition, we found that MEF2D siRNA significantly reduced NR4A1 expression (), suggesting that MEF2D is an upstream TF of NR4A1. NR4A1, BACH1 and ZBTB10 did not affect the expression of the other TFs ().
Figure 3. MEF2D-NR4A1 knockdowns reduces AAD-induced FAM134B2. (A) NR4A1, MEF2D, BACH1 and FAM134B2 protein expression in HeLa cells. HeLa cells were treated with siRNAs in the presence of 2 mM HisOH. HeLa cells were treated with 10 nM siRNA using RNAi Max reagent and then treated with complete DMEM containing 2 mM HisOH for 6 h. (B) FAM134B2, (C) MEF2D, (D) NR4A1, (E) BACH1 and (F) ZBTB10 mRNA expression in HeLa cells treated with siRNAs. HeLa cells were treated with siRNAs in the presence of 2 mM HisOH. HeLa cells were treated with 10 nM siRNA using RNAi Max reagent and then treated with complete DMEM containing 2 mM HisOH for 6 h. ***P < 0.001 vs. HeLa cells treated with scramble control siRNA in the presence of HisOH. ###P < 0.001 vs. HeLa cells treated with scramble control siRNA in the absence of HisOH.
We next examined whether overexpression of the four TFs induces FAM134B2. Interestingly, MEF2D and NR4A1 overexpression drastically induced FAM134B2 but not RETREG1, whereas BACH1 and ZBTB10 overexpression did not affect FAM134B2 expression (). In addition, MEF2D overexpression significantly induced NR4A1 (). MEF2D and NR4A1 overexpression did not affect BACH1 and ZBTB10 expression (data not shown). We therefore next confirmed whether MEF2D-induced FAM134B2 expression occurs via NR4A1 induction. In the presence of NR4A1 siRNA, MEF2D overexpression no longer induced FAM134B2 expression (). MEF2D siRNA did not affect NR4A1-induced FAM134B2 expression (). We examined whether the MEF2D-NR4A1 pathway contributes to AAD-induced FAM134B2 in HEK293 cells. Similar to HeLa cells, HisOH treatment significantly increased mRNA levels of FAM134B2 but not RETREG1 in HEK293 cells (Figure S1B,C). MEF2D, NR4A1, CEBPB and TFEB (Transcription factor EB) siRNA treatments reduced the target gene by 86% 83%, 74% and 91%, respectively. MEF2D and NR4A but not CEBPB or TFEB siRNA treatment significantly blocked HisOH-induced FAM134B2 expression (Figure S1B,C).
Figure 4. Activation of the MEF2D-NR4A1 pathway induces FAM134B2 expression. (A) RETREG1, (B) FAM134B2, (C) MEF2D and (D) NR4A1 mRNA expression in HeLa cells overexpressing MEF2D, NR4A1, BACH1 or ZBTB10. HeLa cells were transfected with pcDNA3-MEF2D, -NR4A1, -BACH1 or -ZBTB10 for 16 h. mRNA RNA levels were analyzed with RT-qPCR analysis. (E) NR4A1 and (F) FAM134B2 mRNA in HeLa cells overexpressing MEF2D treated with NR4A1 siRNA. HeLa cells were treated with 10 nM NR4A1 siRNA using RNAi Max reagent for 24 h and then transfected with pcDNA3-NR4A1 for 16 h. (G) MEF2D and (H) FAM134B2 mRNA in HeLa cells overexpressing NR4A1 treated with MEF2D siRNA. HeLa cells were treated with 10 nM MEF2D siRNA using RNAi Max reagent for 24 h and then transfected with pcDNA3-MEF2D for 16 h. ***P < 0.001.
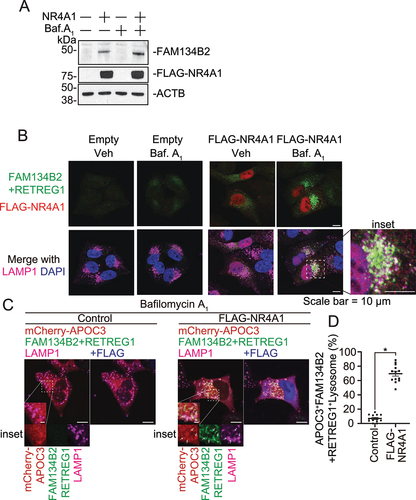
To identify where NR4A1 binds to the FAM134B2 gene, we performed a ChIP-qPCR assay in the entire 57kb FAM134B2 promoter, enhanced using HeLa cells overexpressing FLAG-NR4A1. Consistent with the previous genome-wide ChIP-seq study [Citation31], NR4A1 binds to the −40kb region of the FAM134B2 distal promoter (Figure S1D). The ChIP-qPCR showed that FLAG-NR4A1 and HisOH treatment significantly increased the recruitment of NR4A1 onto the distal region (Figure S1E,F). Furthermore, NR4A1 overexpression drastically increased levels of FAM134B2, which were further increased by bafilomycin A1 treatment (). These results suggest that the MEF2D-NR4A1 cascade induces FAM134B2 expression under AAD.
Figure 5. NR4A1 overexpression induces the FAM134B2-mediated ER-lysosomal degradation pathway. (A) Immunoblot analysis of FAM134B2 in NR4A1 overexpressed cells in the absence and presence of 200 nM bafilomycin A1 (Baf. A1) for 6 h. (B) Immunofluorescence of FAM134B2+RETREG1 (green), FLAG-NR4A1 (red), LAMP1 (magenta) and DAPI (blue) in control plasmid or FLAG-NR4A1 overexpressed HeLa cells treated with 200 nM bafilomycin A1 for 6 h. Scale indicates 10 μm in inset images. Inset indicates that NR4A1-induced FAM134B2 accumulated in LAMP1-positive lysosome. (C) Immunofluorescence of FAM134B2+RETREG1 (green), LAMP1 (magenta) and FLAG (blue) in mCherry-APOC3 (red) with control plasmid or FLAG-NR4A1 overexpressed HeLa cells treated with 200 nM bafilomycin A1 for 6 h. Scale: 10 μm, and 2 μm in inset images. Arrow indicates mCherry-APOC3 and RETREG1+FAM134B2-positive LAMP1. (D) Percentage of mCherry-APOC3 and RETREG1+FAM134B2-positive lysosomes in control vector or FLAG-NR4A1 expressed HeLa cells treated with bafilomycin A1 for 6 h (n = 13). *P < 0.05.
NR4A1 induces FAM134B2-mediated selective reticulophagy
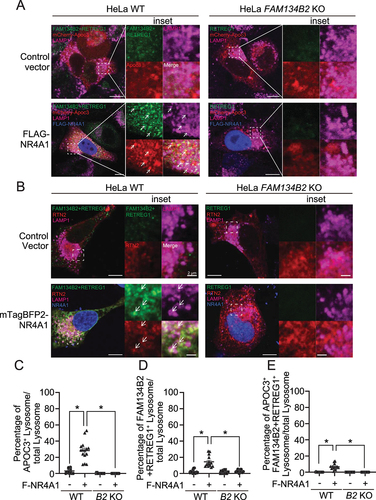
Since AAD induces FAM134B2 expression through the induction of the MEF2D-NR4A1 pathway, we next examined whether NR4A1 activates FAM134B2-mediated selective reticulophagy. As shown in , NR4A1 overexpression strongly induced FAM134B2 and delivered it to lysosomes. We have previously shown that APOC3 is one of the FAM134B2 substrates [Citation19]. Consistently, RETREG1+FAM134B2 dual deficiency blocked the delivery of APOC3 to lysosomes, which was recovered by the reconstitution of FAM134B2 wild-type but not FAM134B2 ΔLIR (lacking LC3 interaction region) mutant (Figure S2A–D). NR4A1 overexpression induced the delivery of APOC3 to lysosomes (). To demonstrate that NR4A1-mediated APOC3 and RTN2 (reticulon 2) delivery to lysosomes is dependent on the induction of FAM134B2, we generated FAM134B2 KO HeLa cells using a clustered regularly interspaced short palindromic repeats (CRISPR) system. In FAM134B2 KO cells, the delivery of APOC3 and RTN2 to lysosomes induced by NR4A1 was completely blocked ( and S3C).
Figure 6. NR4A1 activates FAM134B2-mediated reticulophagy. (A) Immunofluorescence of FAM134B2 (green), LAMP1 (magenta) and FLAG (blue) in mCherry-APOC3 (red) with control plasmid or FLAG-NR4A1 (F-NR4A1) overexpressed HeLa FAM134B2 KO cells treated with 200 nM bafilomycin A1 for 6 h. Arrow indicates mCherry-APOC3 and FAM134B2+RETREG1-positive LAMP1. (B) Immunofluorescence of FAM134B2+RETREG1 (green), LAMP1 (magenta) and mTagBFP2-NR4A1 (blue) in mScarlet-RTN2 (red) with control plasmid or mTagBFP2-NR4A1 overexpressed HeLa FAM134B2-RETREG1 dKO cells treated with 200 nM bafilomycin A1 for 6 h. Arrow indicates mScarlet-RTN2 and FAM134B2+RETREG1-positive LAMP1. Scale: 10 μm, and 2 μm in inset images. Percentage of (C) mCherry-APOC3 and Lysosome double positive, (D) FAM134B2+RETREG1 and lysosome double positive, and (E) mCherry-APOC3-FAM134B2-lysosome triple positive in control vector or FLAG-NR4A1 expressed HeLa WT or FAM134B2 KO (B2 KO) cells treated with bafilomycin A1 for 6 h (n = 12). Quantifications of the RTN2 experiment are shown in Figure S3A–C. *P < 0.05.
MEF2D-NR4A1-FAM134B2 pathway contributes to amino acid homeostasis
To study the role of the MEF2D-NR4A1-FAM134B2 pathway in amino acid homeostasis and AAD-induced cell death [Citation32,Citation33], MEF2D knockdown (KD), NR4A1 KD, FAM134B2+RETREG1 dual KO (dKO) and FAM134B2 KO cells (Figure S3H–J) were cultured under media lacking 4 amino acids (-Leu, -Glu, -Lys and -Met). Under AAD, MEF2D, NR4A1, RETREG1+FAM134B2 and FAM134B2 reduction significantly reduced cell viabilities by 27%, 38%, 32% and 36%, respectively (). In addition, MEF2D, NR4A1 and FAM134B2 reduction significantly reduced Leu, Glu, Lys and Met under AAD but not under complete DMEM media ( and Table S6).
Figure 7. MEF2D-NR4A1-FAM134B2 pathway contributes to amino acid homeostasis under AAD. (A, B) Wild-type, NR4A1 KD, MEF2D KD, RETREG1+ FAM134B2 dKO and FAM134B2 KO HeLa cells were plated at 15,000 cells/well and grown overnight. HeLa cells were starved under amino-acid deficient media lacking L-leucine, L-glutamate, L-methionine and L-lysine for 2 days. After addition of 10 μl CCK-8 to media, HeLa cells were incubated for 1 h at 37°C. Absorbance was measured at 450 nm by a 96-well microplate reader. Percent of cell viability was calculated against CCK8 absorbance of HeLa cells at day 0 (before amino acid deficiency) (n = 6, One-way ANOVA). ***P < 0.001. (C) Leu, (D) Met, (E) Glu, and (F) Lys contents in MEF2D KD, NR4A1 KD, and FAM134B2 KO HeLa cells under AAD. HeLa cells were starved under amino acid deficient media excluding L-leucine, L-glutamate, L-methionine and L-lysine for 2 days. Free amino acids were extracted with acetonitrile: methanol (1:1) containing 0.1 mM d10-Leu and analyzed with LC-MS/MS. *P < 0.05, **P < 0.01 and ***P < 0.001.
MEF2D-NR4A1-FAM134B2 pathway is PKC-dependent
Since MEF2-mediated induction of NR4A1 depends on intracellular calcium [Citation34,Citation35], we examined whether AAD-induced FAM134B2 is calcium-dependent. Treatment with BAFTA chelating cytosolic calcium completely blocked AAD-induced MEF2D, NR4A1 and FAM134B2 expression (). In addition, treatment with a SERCA inhibitor, thapsigargin, and an ionophore, ionomycin, which increase cytosolic calcium significantly, induced FAM134B2, whereas another ER stress inducer, tunicamycin, did not increase FAM134B2 (). Thapsigargin and tunicamycin treatment induced DDIT3 (). In fact, HisOH treatment increased levels of cytosolic Ca2+ (). These data demonstrate that AAD increases levels of cytosolic calcium, resulting in the induction of the MEF2D-NR4A1 pathway. We next examined whether two major PKC (Ca2+-dependent kinases, protein kinase C) or CAMK (calcium/calmodulin dependent protein kinase), contribute to AAD-induced FAM134B2 expression. Treatment with Go6983 (pan PKC inhibitor) but not KN-93 (CAMK inhibitor) inhibited HisOH-induced FAM134B2, MEF2D and NR4A1 expression, while HisOH-induced DDIT3 expression was not affected ().
Figure 8. AAD-induced FAM134B2 expression is calcium dependent. (A–C) FAM134B2, MEF2D and NR4A1 mRNA expression in HeLa cells treated with HisOH in the presence of BAPTA. HeLa cells were pretreated with 20 μM BAPTA-AM for 2 h and then treated with 2 mM HisOH for 6 h. (D, E) FAM134B2 and DDIT3 mRNA expression in HeLa cells treated with thapsigargin (TG), tunicamycin (TUN) and ionomycin (ION). HeLa cells were treated with 0.5 mM thapsigargin, tunicamycin and ionomycin for 6 h. (F) Measurement of cytosolic Ca2+ with Fluo-4 DirectTM. HeLa cells in a 96-well microplate were incubated with complete media and 2x Fluo-4 DirectTM reagent for 1 h, and then fluorescence was measured with a microplate reader at every 1 min. Cells were treated with ddH2O (Control) or 2 mM HisOH for 7 min after the start of the measurement. Data was expressed as the mean of fold value against average intensity at pretreatment (values from 0 to 4 min) ±SEM. (n = 4), G) FAM134B2, H) MEF2D, I) NR4A1 and J) DDIT3 expression in HeLa cells treated with HisOH in the presence of PKC and CAMK inhibitor. HeLa cells were pretreated with 10 μM Go6983 or KN-93 for 2 h and then treated with 2 mM HisOH for 6 h. *P < 0.05 and ***P < 0.001.
Discussion
We have previously reported that a novel truncated isoform of FAM134B, FAM134B2, is highly induced by starvation in the liver through the activation of CEBPB [Citation19]. Similar to in vivo, starvation induces FAM134B2 expression in HeLa cells associated with increased CEBPB expression. In this study unexpectedly, however, we found that in HeLa cells, starvation induces FAM134B2 independent of CEBPB and other CEBP isoforms. The difference in the regulation of FAM134B2 expression is probably due to distinct starvation signals between HeLa cells and the liver; glucagon/insulin and free fatty acids are major regulators in the expression of hepatic genes under starvation, while AAD is a major starvation signal in vitro. In fact, AAD is sufficient to induce FAM134B2 in HeLa cells.
Interestingly we found that EIF2AK4-ISR and MTORC1 which form two distinct signaling pathways that respond to AAD, do not contribute to FAM134B2 expression under AAD. Rather, four transcription factors, MEF2D, NR4A1, BACH1 and ZBTB10, regulate AAD-induced FAM134B2 expression. MEF2 has been shown to be the major transcription factor responsible for NR4A1 transcription [Citation35–37]. In fact, MEF2D was not able to induce FAM134B2 in the absence of NR4A1. MEF2D induces NR4A1, which is required for the induction of FAM134B2 under AAD. In contrast to MEF2D-NR4A1, BACH1 and ZBTB10 independently regulate FAM134B2 under AAD. Since the overexpression of BACH1 and ZBTB10 did not induce FAM134B2, this study was not able to determine how BACH1 and ZBTB10 induce AAD-induced FAM134B2 expression. We also found that increased intracellular calcium mediates AAD-induced FAM134B2 expression by activating PKC. Activated PKC induces MEF2D-NR4A1 expression. Further studies will be required for determining 1) how AAD increases levels of cytosolic calcium, 2) how PKC induces MEF2D and NR4A1 expression and 3) how BACH1 and ZBTB10 regulate FAM134B2 expression.
Under AAD, NR4A1 induces FAM134B2-mediated reticulophagy for cell survival by maintaining levels of amino acids. We previously reported that an APOC3 precursor localized in the ER is a major substrate for FAM134B2-mediated reticulophagy [Citation19]. To further support our previous observation, FAM134B2 KO HeLa cells were generated using CRISPR technique by targeting the exon 1 of the FAM134B2 gene. Similar to RETREG1 and FAM134B2 dual deficiency, FAM134B2 single deficiency blocked the delivery of APOC3 and RTN2 to lysosomes, which was restored by mouse FAM134B2 but not FAM134B2ΔLIR mutant reconstitution. In addition, NR4A1 overexpression induces not only the expression of FAM134B2 expression but also FAM134B2-mediated reticulophagy. Blocking the MEF2D-NR4A1-FAM134B2 pathway inhibits reticulophagy, resulting in the acceleration of AAD-induced cell death by reducing levels of essential amino acids, suggesting amino acid recycling. These results indicate that MEF2D-NR4A1-FAM134B2-mediated reticulophagy is critical to amino acid homeostasis.
The MEF2D-NR4A1 pathway is responsible for inducing 49 genes under AAD, which consist of 8% of AAD responsive genes (Figure S4 and Table S7–S9). Although it has not been examined whether the other NR4A1-MEF2D targets are involved in amino acid homeostasis, Metascape pathway analysis revealed that the NR4A1-MEF2D targets contribute to at least 25 cellular responses including advanced glycation endproduct-the receptor for advanced glycation endproducts (AGE-RAGE) signaling and inflammatory response. Since the MEF2-NR4A1 pathway has been shown to participate in a broad range of cellular processes and diseases such as T cell receptor stimulation (TCR), proliferation, differentiation, apoptosis, obesity, diabetes, atherosclerosis and inflammation [Citation35,Citation38–41], FAM134B2 and the identified 48 MEF2D-NR4A1 target genes shed light on the fundamental role of the MEF2D-NR4A1 pathway in the regulation of these processes.
In this study, we have identified that the MEF2D-NR4A1 pathway selectively activates FAM134B2-mediated reticulophagy under AAD. In addition to EIF2AK4-ISR and the MTOR pathway, the MEF2D-NR4A1-FAM134B2 pathway plays a critical role in amino acid homeostasis and cell survival under AAD by inducing degradation of ER proteins.
Materials and methods
Cell cultures
HeLa cells and HEK293T (ATCC, CRL-3216) cells were grown and maintained at 37°C in an atmosphere of 5% CO2 in DMEM (Gibco, 12800) containing 4500 mg/L glucose, 100 U/ml penicillin, and 100 μg/ml streptomycin and supplemented with 10% fetal bovine serum (FBS). For studies HeLa cells were treated with Earle’s Balanced Salt Solution (EBSS; Sigma-Aldrich, E2888), complete DMEM media containing 2 mM HisOH (Fisher Scientific, AC228830010) or amino-acid deficient DMEM media (Sigma-Aldrich, D9785) such as DMEM lacking leucine, lysine, glutamine, or methionine for 6 h. A dialyzed FBS was used for amino acid-deficient media. HeLa and HEK293 cells were treated with RNAi (10 nM, Horizon) using RNAi Max (Thermo Fisher Scientific, 13778) for 16 h. Ionomycin (Cayman Chemical, 10004974), thapsigargin (Cayman Chemical, 10522) and tunicamycin (Sigma-Aldrich, T7765) were used at 0.5 μM. BAPTA-AM (Cayman Chemical, 15551) was used at 20 μM. KN-93 phosphate (Cayman Chemical, 21472) and Go6983 (Cayman Chemical, 13311) were used at 10 μM. References of antibodies used in this study are summarized in .
Table 1. Antibodies used in this study
Preparation of lentiviral particles and CRISPR-Cas9 system-based gene knockout of FAM134B2
Scramble sgRNA, RETREG1-FAM134B2 [Citation19] and FAM134B2 gene sgRNAs (Table S1) in LentiCRISPRv2-Puro plasmid (Addgene, 98290) including the Cas9 coding sequence in the lentiviral sequence region, were generated as we previously described [Citation19]. HEK293T cells were seeded at 6 × 10⁵ cells/well in 6-well plates, grown overnight, and then transfected with 300 ng psPAX2 (Addgene, 12260), 100 ng pMD2.G (Addgene, 12259) and 400 ng of each sgRNA CRISPR-Cas9 lentivirus plasmid (plasmid amount rate 3:1:4) using Turbofect transfection reagent (Thermo Fisher Scientific, R0531). Media was changed to new media, and media containing lentiviral particles was collected 2 days later. Lentiviral media was centrifuged once at 1500 × g for 3 min and the supernatant was collected. HeLa cells were seeded in 6-well plates and infected 24 h later with each lentiviral media in the presence of 10 µg/ml polybrene. Cells were treated with 2 µg/ml puromycin for selection of infected cells. Total RNA of heterogeneous cells were collected and cDNA synthesis was conducted from the RNA template, followed by high resolution melting analysis with a StepOne Plus qPCR instrument (Applied Biosystems) to check for mutations occurring on regions around the FAM134B2 sgRNA target sequence. Heterogeneous cells with gene mutations were plated at 0.5 cells/well in a 96-well plate to obtain a single cell clone. Next, total RNA of each single cell-derived clone was collected to check for mutations using high resolution melting qRT-PCR, and each mutated sequence was analyzed by DNA sequencing (Eurofins Genomics Company). Protein from gene edited clones was prepared and analyzed by immunoblot analysis and RT-qPCR to determine whether gene knockout was complete.
Fluorescence microscopy analysis
Microscopy analysis was performed according to previous reports [Citation19,Citation42]. HeLa WT or RETREG1-FAM134B2 dKO or FAM134B2 KO cells were plated on Lab-Tek® chamber slides (Thermo Fisher Scientific, 154534) with poly-L-lysine coating. After 24 h, HeLa cells were transfected with pcDNA3.1 empty vector (control), FLAG-NR4A1, mTagBFP-NR4A1 or Fam134b2 WT or ΔLIR and mCherry-APOC3 using TurboFect Transfection Reagent (Thermo Fisher Scientific, R0531). After another 24 h, cells were treated with 200 nM bafilomycin A1 in complete media or EBSS for 6 h. Cells were fixed with 4% paraformaldehyde/PBS for 10 min. Fixed cells were washed with 1x PBS and quenched with 20 mM glycine-PBS for 10 min. Cells were permeabilized with 0.05% saponin-PBS for 30 min. HeLa cells were then blocked with 1% BSA-PBS for 10 min and incubated with FAM134B2-RETREG1, LAMP1, HA and FLAG M2 antibodies as primary antibodies for 1 h at room temperature. Cells were washed with 1x PBS and reacted with Alexa Fluor dye conjugated secondary antibody for 1 h at room temperature. Cells were washed with 1x PBS and mounted with VECTASHIELD® Antifade Mounting Medium with or without DAPI (VECTOR Laboratories, H-2000 or H-1900) on glass slides. Prepared samples were observed with an Olympus FluoView™ FV1000 confocal microscope (Olympus). Images were gained at 1024 × 1024 pixel resolution and used for measuring fluorescent puncta or areas. Quantification of data was performed using ImageJ software.
RNA-seq
Total RNAs were isolated using a Direct-zol kit. mRNA-seq library construction and sequencing were performed at BGI America (http://www.bgi.com) in accordance with the manufacturer’s instructions using a HiSeq2000 system (Illumina). The raw data are shown in Table S2.
ChIP analysis
The samples were prepared using SimpleChIP® Enzymatic Chromatin IP Kit (Magnetic Beads; Cell Signaling Technology, 9003) [Citation19,Citation43]. ChIP was performed using rabbit IgG control, FLAG or NR4A1 antibody. Eluted DNA was analyzed by qRT-PCR. The results are expressed as the percentage of antibody binding versus the amount of PCR product obtained using a standardized aliquot of input chromatin (% of input). The primers for the NR4A1 region of the human FAM134B2 promoter are shown in Table S1.
Amino acid analysis
Amino acids from cells (1 × 10⁶ cells) were extracted with 100 ul methanol: acetonitrile (1:1) containing 0.1 mM d10-Leu (Toronto Research Chemicals, L330638) as the internal standard. Amino acid analysis was performed by LC ESI-MS/MS using a Simadzu LC-20AD liquid chromatography (HPLC) system and an Applied Biosystems 3200 qTrap mass spectrometer with a turbo-iospray source (350°C). HPLC was performed on a HILIC-Z 100 × 2.1 mm column (Agilent Technology). Solvents A and B consisted of 20 mM ammonium acetate (pH3.0) and acetonitrile: water (9:1) containing 20 mM ammonium acetate, respectively. Amino acids were separated under gradient conditions (800 μl/min): 1000% solvent B followed by a 10 min linear gradient to 70% solvent A, and restored to 100% Solvent B by a 5-min linear gradient. Positive ion mode was used for amino acid analysis. Table S3 shows MS settings including Desolvation Potential and Collision Energy.
Cell viability assay
HeLa cells were plated in a poly-L-lysine coated 96-well microplate at 15,000 cells/well. After 24 h, HeLa cells were washed with 1x PBS and starved under amino acid deficient media (without Leu, Lys, Glu and Met; Sigma-Aldrich, D9785) with 1% dialyzed FBS for 48 h. Cells were treated with a Cell Counting Kit-8 (CCK8; GLPBIO, GK10001) at 37°C for 1 h and then absorbance was measured at 450 nm by using a TECAN Infinite F50 Microplate Reader (TECAN).
Intracellular calcium measurement with Fluo-4 DirectTM
HeLa cells were plated in a poly-L-lysine coated 96 well microplate at 30,000 cells/well. After 24 h, media was changed with 100 μl complete DMEM and then 100 μl 2 × Fluo-4 DirectTM reagent (Thermo Fisher Scientific, F10471) was added to each well. After 1 h incubation at 37°C, fluorescence of Fluo-4 (Excitation at 494 nm/ Emission at 516 nm) was measured every 1 min by using a BioTek Synergy2 Multi-Detection Microplate Reader (BioTek). At 5 min from the start of measurement, water (control) or 2 mM HisOH was added and measurement every 1 min was resumed.
Statistical analyses
Data were collected from more than 2 independent experiments and are reported as the mean ± SEM. Statistical analysis was performed using a 2-tailed Student’s t test for 2 group comparisons and a 1-way ANOVA with a Student-Newman post-hoc test. Significance was accepted at P < 0.05
Supplemental Material
Download Zip (10.5 MB)Acknowledgments
We thank Shohei Kohno for technical assistance. The authors’ work was supported by grants from R01HL117062, R01HL133545, R01DK124901 and R01HL132318 to M. Miyazaki.
Disclosure statement
No potential conflict of interest was reported by the author(s).
Supplementary material
Supplemental data for this article can be accessed here.
Additional information
Funding
Related Research Data
References
- Dikic I, Elazar Z. Mechanism and medical implications of mammalian autophagy. Nat Rev Mol Cell Biol. 2018 ;19:349–364.
- Nakatogawa H. Mechanisms governing autophagosome biogenesis. Nat Rev Mol Cell Biol. 2020;21:21439–21458.
- Saftig P, Puertollano R. How lysosomes sense, integrate, and cope with stress. Trends Biochem Sci. 2021;46:97–112.
- Broer S, Broer A. Amino acid homeostasis and signalling in mammalian cells and organisms. Biochem J. 2017;474:1935–1963.
- Kirkin V, Rogov VV. A diversity of selective autophagy receptors determines the specificity of the autophagy pathway. Mol Cell. 2019;76:268–285.
- Metcalf MG, Higuchi-Sanabria R, Garcia G, et al. Beyond the cell factory: homeostatic regulation of and by the UPR(ER). Sci Adv. 2020;6:eabb9614.
- Sicari D, Delaunay-Moisan A, Combettes L, et al. A guide to assessing endoplasmic reticulum homeostasis and stress in mammalian systems. FEBS J. 2020;287:27–42.
- Qi L, Tsai B, Arvan P. New insights into the physiological role of endoplasmic reticulum-associated degradation. Trends Cell Biol. 2017;27:430–440.
- Hwang J, Qi L. Quality control in the endoplasmic reticulum: crosstalk between ERAD and UPR pathways. Trends Biochem Sci. 2018;43:593–605.
- Hubner CA, Dikic I. ER-phagy and human diseases. Cell Death Differ. 2020;27:833–842.
- Chino H, Mizushima N. ER-phagy: quality control and turnover of endoplasmic reticulum. Trends Cell Biol. 2020;30:384–398.
- Chino H, Hatta T, Natsume T, et al. Intrinsically disordered protein TEX264 mediates ER-phagy. Mol Cell. 2019;74:909–921.
- An H, Ordureau A, Paulo JA, et al. TEX264 is an endoplasmic reticulum-resident ATG8-interacting protein critical for ER remodeling during nutrient stress. Mol Cell. 2019;74:891–908.
- Fumagalli F, Noack J, Bergmann TJ, et al. Translocon component Sec62 acts in endoplasmic reticulum turnover during stress recovery. Nat Cell Biol. 2016;18:1173–1184.
- Khaminets A, Heinrich T, Mari M, et al. Regulation of endoplasmic reticulum turnover by selective autophagy. Nature. 2015;522:354–358.
- Grumati P, Morozzi G, Holper S, et al. Full length RTN3 regulates turnover of tubular endoplasmic reticulum via selective autophagy. Elife. 2017;6:e25555.
- Smith MD, Harley ME, Kemp AJ, et al. CCPG1 is a non-canonical autophagy cargo receptor essential for ER-phagy and pancreatic ER proteostasis. Dev Cell. 2018;44:217–232.
- Chen Q, Xiao Y, Chai P, et al. ATL3 is a tubular ER-phagy receptor for GABARAP-mediated selective autophagy. Curr Biol. 2019;29:846–855.
- Kohno S, Shiozaki Y, Keenan AL, et al. An N-terminal-truncated isoform of FAM134B (FAM134B-2) regulates starvation-induced hepatic selective ER-phagy. Life Sci Alliance. 2019;2:e201900340.
- Kilberg MS, Balasubramanian M, Fu L, et al. The transcription factor network associated with the amino acid response in mammalian cells. Adv Nutr. 2012;3:295–306.
- Chaveroux C, Lambert-Langlais S, Cherasse Y, et al. Molecular mechanisms involved in the adaptation to amino acid limitation in mammals. Biochimie. 2010;92:736–745.
- Meijer AJ, Lorin S, Blommaart EF, et al. Regulation of autophagy by amino acids and MTOR-dependent signal transduction. Amino Acids. 2015;47:2037–2063.
- Naito T, Kuma A, Mizushima N. Differential contribution of insulin and amino acids to the mTORC1-autophagy pathway in the liver and muscle. J Biol Chem. 2013;288:21074–21081.
- Averous J, Lambert-Langlais S, Mesclon F, et al. GCN2 contributes to mTORC1 inhibition by leucine deprivation through an ATF4 independent mechanism. Sci Rep. 2016;6:27698.
- Chaveroux C, Sarcinelli C, Barbet V, et al. Nutrient shortage triggers the hexosamine biosynthetic pathway via the GCN2-ATF4 signalling pathway. Sci Rep. 2016;6:27278.
- Kilberg MS, Shan J, Su N. ATF4-dependent transcription mediates signaling of amino acid limitation. Trends Endocrinol Metab. 2009;20:436–443.
- Shan J, Lopez MC, Baker HV, et al. Expression profiling after activation of amino acid deprivation response in HepG2 human hepatoma cells. Physiol Genomics. 2010;41:315–327.
- Carroll B, Korolchuk VI, Sarkar S. Amino acids and autophagy: cross-talk and co-operation to control cellular homeostasis. Amino Acids. 2015;47:2065–2088.
- Koromilas AE. M(en)TORship lessons on life and death by the integrated stress response. Biochim Biophys Acta Gen Subj. 2019;1863:644–649.
- Sidrauski C, Acosta-Alvear D, Khoutorsky A, et al. Pharmacological brake-release of mRNA translation enhances cognitive memory. Elife. 2013;2:e00498.
- Liu X, Wang Y, Lu H, et al. Genome-wide analysis identifies NR4A1 as a key mediator of T cell dysfunction. Nature. 2019;567:525–529.
- Suraweera A, Munch C, Hanssum A, et al. Failure of amino acid homeostasis causes cell death following proteasome inhibition. Mol Cell. 2012;48:242–253.
- Parzych K, Chinn TM, Chen Z, et al. Inadequate fine-tuning of protein synthesis and failure of amino acid homeostasis following inhibition of the ATPase VCP/p97. Cell Death Dis. 2015;6:e2031.
- Blaeser F, Ho N, Prywes R, et al. Ca(2+)-dependent gene expression mediated by MEF2 transcription factors. J Biol Chem. 2000;275:197–209.
- Youn HD, Sun L, Prywes R, et al. Apoptosis of T cells mediated by Ca2+-induced release of the transcription factor MEF2. Science. 1999;286:790–793.
- Liu W, Youn HD, Liu JO. Thapsigargin-induced apoptosis involves Cabin1-MEF2-mediated induction of Nur77. Eur J Immunol. 2001;31:1757–1764.
- Mount MP, Zhang Y, Amini M, et al. Perturbation of transcription factor Nur77 expression mediated by myocyte enhancer factor 2D (MEF2D) regulates dopaminergic neuron loss in response to 1-methyl-4-phenyl-1,2,3,6-tetrahydropyridine (MPTP). J Biol Chem. 2013;288:14362–14371.
- Lith SC, van Os BW, Seijkens TTP, et al. ‘Nur’turing tumor T cell tolerance and exhaustion: novel function for Nuclear Receptor Nur77 in immunity. Eur J Immunol. 2020;50:1643–1652.
- Herring JA, Elison WS, Tessem JS. Function of Nr4a orphan nuclear receptors in proliferation, apoptosis and fuel utilization across tissues. Cells. 2019;8:1373.
- Zhao Y, Bruemmer D. NR4A orphan nuclear receptors: transcriptional regulators of gene expression in metabolism and vascular biology. Arterioscler Thromb Vasc Biol. 2010;30:1535–1541.
- Ranhotra HS. The NR4A orphan nuclear receptors: mediators in metabolism and diseases. J Recept Signal Transduct Res. 2015;35:184–188.
- Shiozaki Y, Miyazaki-Anzai S, Okamura K, et al. GPAT4-generated saturated LPAs induce lipotoxicity through inhibition of autophagy by abnormal formation of omegasomes. iScience. 2020;23:101105.
- Shiozaki Y, Okamura K, Kohno S, et al. The CDK9-cyclin T1 complex mediates saturated fatty acid-induced vascular calcification by inducing expression of the transcription factor CHOP. J Biol Chem. 2018;293:17008–17020.