
ABSTRACT
Cancer cell growth is dependent upon the sustainability of proliferative signaling and resisting cell death. Macroautophagy/autophagy promotes cancer cell growth by providing nutrients to cells and preventing cell death. This is in contrast to autophagy promoting cell death under some conditions. The mechanism regulating autophagy-mediated cancer cell growth remains unclear. Herein, we demonstrate that TSSC4 (tumor suppressing subtransferable candidate 4) is a novel tumor suppressor that suppresses cancer cell growth and tumor growth and prevents cell death induction during excessive growth by inhibiting autophagy. The oncogenic proteins ERBB2 (erb-b2 receptor tyrosine kinase 2) and the activation EGFR mutant (EGFRvIII, epidermal growth factor receptor variant III) promote cell growth and TSSC4 expression in breast cancer and glioblastoma multiforme (GBM) cells, respectively. In EGFRvIII-expressing GBM cells, TSSC4 knockout shifted the function of autophagy from a pro-cell survival role to a pro-cell death role during prolonged cell growth. Furthermore, the interaction of TSSC4 with MAP1LC3/LC3 (microtubule associated protein 1 light chain 3) via its conserved LC3-interacting region (LIR) contributes to its inhibition of autophagy. Finally, TSSC4 suppresses tumorsphere formation and tumor growth by inhibiting autophagy and maintaining cell survival in tumorspheres. Taken together, sustainable cancer cell growth can be achieved by autophagy inhibition via TSSC4 expression.
Abbreviations: 3-MA: 3-methyladenine; ACTB: actin beta; CQ: chloroquine; EGFRvIII: epidermal growth factor receptor variant III; ERBB2: erb-b2 receptor tyrosine kinase 2; GBM: glioblastoma multiforme; LIR: LC3-interacting region; MAP1LC3/LC3: microtubule Associated protein 1 light chain 3; TSSC4: tumor suppressing subtransferable candidate 4
Introduction
Cancer cells are characterized by abnormal growth regulated in part through two hallmarks of cancer; sustaining proliferative signaling and resisting cell death [Citation1]. Excessive proliferative signaling leads to cells becoming starved for energy and eventually undergoing cell death. Thus, the rate of cell growth must be controlled so that cell death will not override the overall effect of proliferation on cell growth.
One mechanism regulating cancer cell growth is autophagy. Autophagy (macroautophagy) is an intracellular catabolic process leading to the formation of the double-membrane autophagosomes. Autophagosomes are formed by autophagy proteins and characterized by the incorporation of MAP1LC3/LC3 (microtubule associated protein 1 light chain 3) into the phagophore membrane, the precursor of the autophagosome. Upon fusion with lysosomes, autophagosomes are transformed into autolysosomes where an autophagosome-enclosed cargo is degraded [Citation2,Citation3]. This provides cells with essential nutrients by degrading materials such as dysfunctional organelles and is a mechanism for supporting cancer cell growth. For example, the growth of tumors in an animal model can be inhibited by knockout of autophagy genes such as Rb1cc1/Fip200 [Citation4], Atg5 [Citation5], and Atg7 [Citation6]. A recent study reported that downregulation of different autophagy genes including ATG13, ULK1, ATG9A and ATG7 inhibited proliferation of cervical cancer cells [Citation7]. Autophagy acts as a double-edged sword where autophagy at physiological levels is a cell survival mechanism, but when autophagy is over-enhanced by severe stresses such as treatment with a chemotherapy drug, it can induce cell death. We have previously shown that, when cancer cells were treated under hypoxia, autophagy played a pro-cell survival role at an early time of hypoxia but switches to a pro-cell death role by inducing autosis (a type of autophagic cell death) during prolonged hypoxia [Citation8]. The role of autophagy in tumor growth in this context of the double-edged sword of cell survival and death has not been extensively investigated.
The TSSC4 (tumor suppressing subtransferable candidate 4) gene is located in an important region containing multiple tumor suppressor genes [Citation9], such as CDKN1C/p57/KIP2 [Citation10], PHLDA2/TSSC3 [Citation11], and H19 [Citation12]. TSSC4 expression is associated with Beckwith-Wiedemann syndrome, Wilms tumor, rhabdoid tumors, rhabdomyosarcoma, and lung, ovarian and breast cancers [Citation9,Citation13,Citation14]. The molecular and cellular mechanisms of TSSC4 in cancer is unknown.
In this study, we demonstrate that cancer cell growth is suppressed by TSSC4 inhibition of autophagy. TSSC4 inhibits autophagy through binding to LC3 preventing the formation of autophagosomes. This inhibition of cell growth at least partially prevents cell death caused by prolonged growth. This mechanism is especially important for cancer cells expressing oncogenic proteins where TSSC4 expression is upregulated and excessive cell growth is inhibited. Furthermore, cell growth is attenuated to prevent autophagy-mediated cell death though TSSC4 expression in tumorspheres. Finally, TSSC4 expression in cancer cells inhibits tumor growth in mice, supporting the role of TSSC4 as a novel tumor suppressor.
Results
Cancer cell growth is inhibited by TSSC4
Although the biological roles of TSSC4 are unknown, its expression in different tissues has been documented in literature databases. Upon exploration into the Oncomine databases, we found that TSSC4 mRNA levels were significantly upregulated in cancer tissues compared to that in their corresponding normal tissues (Figure S1A). Western blot showed that TSSC4 protein is expressed in different types of cancer cells (Figure S1B). The protein level of TSSC4 in the non-cancerous breast cell line MCF10A is lower than that in the breast cancer cell line MDA-MA-231, SKBR3 or MCF7 (Figure S1B), agreeing with the difference between the TSSC4 mRNA levels in cancer tissues and their corresponding normal tissues (Figure S1A).
To investigate the roles of TSSC4 in cancer, we measured the effects of TSSC4 modulation on cell growth of different types of cancer cells since abnormal cell growth is one of the most important features of cancer aggressiveness. Cell growth is defined as the increase in cell number through cell division and cell survival [Citation15]. Cell growth can be measured by different methods including counting cell numbers during growth [Citation4], measuring protein expression of the cell proliferation markers CCND1 (cyclin D1) [Citation4,Citation16] and PCNA (proliferating cell nuclear antigen) [Citation17], measuring colony numbers formed by individual cells [Citation18], and colorimetric assay of the proliferation marker bromodeoxyuridine (BrdU) [Citation19]. When cell growth was measured by counting cell numbers, TSSC4 knockdown increased cell growth by more than 50% in the breast cancer cell line MDA-Mb-231 (–B), the glioblastoma multiforme (GBM) cell lines U87 (–F) and U373 (Figure S2A–B), and the cervical cancer cell line HeLa (Figure S2C–D), respectively. Furthermore, in MDA-MB-231 cells, TSSC4 knockdown increased the protein levels of CCND1 and PCNA by 90% and 30%, respectively (), cell colony formation by 85% (), and proliferation measured by BrdU incorporation by 44% (). In U87 cells, TSSC4 knockdown increased the protein levels of CCND1 and PCNA by 110% and 40%, respectively (). In U373 and HeLa cells, TSSC4 knockdown increased the protein levels of CCND1 by 60% and 50%, respectively (Figures S2A,S2C). Conversely, when TSSC4 was overexpressed in MDA-MB-231 and U87 cells and cell growth was measured by counting cell numbers, cell growth was significantly suppressed by more than 25%, respectively (–B and D–E). These results are supported by the data with colony formation assay, western blotting of the proliferation marker CCND1, and proliferation assay by BrdU incorporation. In MDA-MB-231 cells, TSSC4 overexpression decreased CCND1 expression by 40% () and cell colony formation by 54% (), respectively. In U87 cells, TSSC4 overexpression decreased CCND1 expression by 30% () and proliferation measured by BrdU incorporation by 14% (), respectively. In the non-cancerous human embryonic kidney HEK293 cells, TSSC4 overexpression also inhibited cell growth (data not shown). These results support that TSSC4 inhibits cell growth.
Figure 1. Knockdown of TSSC4 promoted cancer cell growth. (A–D) Knockdown of TSSC4 increased cell growth in MDA-MB-231 cells. (E–F) Knockdown of TSSC4 increased cell growth in U87 cells. (A, E) Knockdown of TSSC4 by siRNA and expression of the proliferation markers PCNA and CCND1 were demonstrated by western blot. ACTB (actin beta) was used as a loading control (the same hereafter). (B, F) Cell growth was measured by counting the numbers of cells. (C) Cell growth was measured by counting the numbers of colonies formed by individual cells with example images of colonies shown. (D) Cell proliferation was measured by BrdU incorporation assay (OD450). The statistical significance is defined as: *p < 0.05, **p < 0.01, ***p < 0.001. Error bar stands for standard deviation (SD) (the same hereafter).
Figure 2. Overexpression of TSSC4 inhibited cell growth. Vector alone (HA) and TSSC4 (TSSC4-HA) were transfected into MDA-MB-231 and U87 cells and stable cell lines were generated, respectively. (A–C) Cell growth in MDA-MB-231 cells. (D–F) Cell growth in U87 cells. (A, D) TSSC4 overexpression and expression of the proliferation marker CCND1 were demonstrated by western blot. HA tag antibody was used to detect TSSC4 (TSSC4-HA). ACTB was used as a loading control. (B, E) Cell growth was measured by counting the numbers of cells. (C) Cell growth was measured by counting the numbers of colonies formed by individual cells with example images of colonies shown. (F) Cell proliferation was measured by BrdU incorporation assay (OD450).
TSSC4 inhibits autophagy
It is well known that basal levels of autophagy support cell survival [Citation20], and recent studies have demonstrated that autophagy can also promote cell growth [Citation7]. To explore the mechanisms for the inhibition of cell growth by TSSC4, we investigated whether TSSC4 can regulate autophagy. Functional autophagy is demonstrated by a positive autophagic flux which can be measured by western blotting the autophagy marker protein LC3-II or by quantifying the number of LC3 puncta (containing LC3-II) representing phagophores, autophagosomes or autolysosomes, in the absence and presence of a lysosomal inhibitor, such as chloroquine (CQ) [Citation21]. A higher level of LC3-II protein or a higher number of LC3 puncta per cell in the presence of CQ compared to that in its absence indicates a positive autophagic flux. When TSSC4 was knocked down in U87 cells, CQ addition increased LC3-II protein level up to two-fold in the control cells (siCon) and up to five-fold in the TSSC4 knockdown cells (siTSSC4), respectively (), indicating a positive autophagic flux in both types of cells. In the presence of CQ, the LC3-II protein level in the TSSC4 knockdown cells (siTSSC4) was two-fold of that in the control cells (siCon) (), suggesting that TSSC4 knockdown increased autophagy. These results were further supported by the data of mRFP-LC3 puncta analysis in U87 cells. CQ addition increased the number of mRFP-LC3 puncta per cell up to more than four-fold in the control cells (siCon) and up to more than eight-fold in the TSSC4 knockdown cells (siTSSC4), respectively (,C).
Figure 3. Knockdown of TSSC4 increased autophagy. TSSC4 knockdown by siRNA in U87 cells was demonstrated in . (A–C) Endogenous autophagy. (D–E) Autophagy induced by starvation of glucose and glutamine (No GP). (A, D) Autophagy was measured by western blotting the protein levels of the autophagy marker protein LC3-II. The lysosomal inhibitor chloroquine (CQ; 20 µM) was used to measure autophagic flux (the same hereafter). Cells were pre-treated with the autophagy inhibitor 3-methyladenine (3-MA) (2 mM) for 1 hour (H) before treatment with CQ for 24 h (the same hereafter). (B, C, E) Autophagy was measured by counting the numbers of LC3 puncta per cells. Cells stably expressing mRFP-LC3B were treated with and without CQ and 3-MA for 24 h. Then, numbers of mRFP-LC3 puncta (representing autophagosomes/autolysosomes) per cell were counted under fluorescence microscope visualization. (B) Examples of images showing mRFP-LC3 puncta. (C, E) Numbers of mRFP-LC3 puncta per cell. ACTB was used as the loading control for western blot.
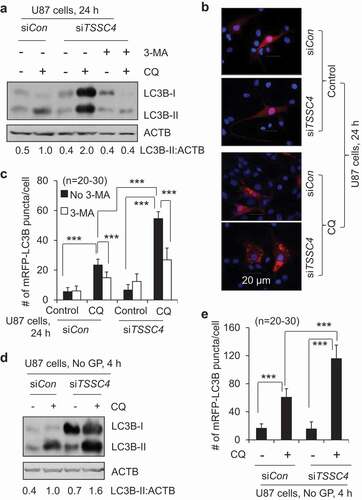
In the presence of CQ, the number of mRFP-LC3 puncta per cell in the TSSC4 knockdown cells (siTSSC4) was more than two-fold of that in the control cells (siCon) (,C). The autophagy inhibitor 3-methyladenine (3-MA), which inhibits class III phosphatidylinositol 3-kinase-BECN1 complex in the canonical autophagy pathway [Citation22], inhibited autophagy in control and TSSC4 knockdown cells by more than 30% (,C), suggesting that TSSC4 may regulate the canonical autophagy pathway. Autophagy induced by starvation of glucose and glutamine (No GP) was also increased by TSSC4 knockdown at least by 60% when measured by western blotting of LC3-II and quantification of mRFP-LC3 puncta in U87 cells (–E). Autophagy was also increased by TSSC4 knockdown in U373 cells and MDA-MB-231 cells by 30% and 20%, respectively (Figures S3A,S3B). These data support that TSSC4 is an autophagy inhibitor.
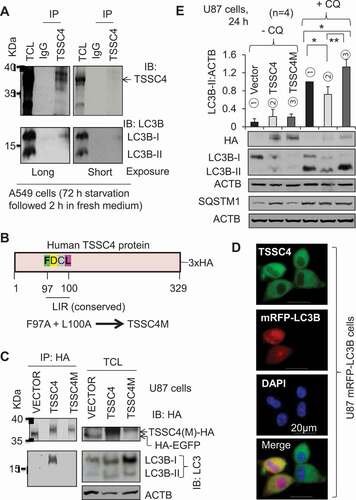
Some proteins can regulate autophagy by interacting with the autophagy marker protein LC3 via their LC3-interacting regions (LIRs) containing the motif [W/F/Y]XX[L/I/V] [Citation23,Citation24]. To study the underlying mechanism of TSSC4 inhibition of autophagy, we first investigated whether TSSC4 can interact with LC3. Immunoprecipitation (IP) experiments showed that endogenous TSSC4 protein can interact with LC3-I in starved A549 cells with and without changing to a refreshed medium, where high and low levels of LC3-I protein were observed, respectively ( and S4). We then investigated the amino acid sequences of TSSC4 proteins and found that the amino acid sequence of the human TSSC4 protein reveals two LIR motifs (YDTL21-24, FDCL97-100) among which, the FDCL97-100 motif is conserved in TSSC4 proteins across different organisms ( and S5). Therefore, we generated a mutant TSSC4 (TSSC4M) by replacing F97 and L100 with alanine (A) in the conserved motif of human TSSC4 protein which is tagged with human influenza hemagglutinin (HA) at its N terminus () to study its role in autophagy. When HA-tagged TSSC4 and TSSC4M were transfected into U87 cells, TSSC4-HA but not TSSC4M-HA and the HA-EGFP control, immunoprecipitated with LC3-I (), suggesting that TSSC4 can interact with LC3-I through its conserved LIR motif (FDCL). These observations are consistent with immunofluorescence data. In U87 cells, the endogenous TSSC4 was diffusely expressed in the cytoplasm and colocalized with the diffuse cytosolic LC3 (LC3-I), whereas the lipidated form of LC3 (LC3-II) located on autophagosomes or autolysosomes represented by LC3 puncta, did not colocalize with TSSC4 since TSSC4 did not form puncta ( and S6). It is known that many LC3-interacting proteins [Citation24], such as SQSTM1/p62 [Citation25], NBR1 (NBR1 autophagy cargo receptor) [Citation26] and BNIP3 (BCL2 interacting protein 3) [Citation27], will be brought into an autolysosome for degradation and when a lysosomal inhibitor was used to block the degradation process in autolysosome, the protein level of this cargo will be increased. In U87 cells, when the lysosomal inhibitor CQ was added, the protein levels of the HA-tagged TSSC4 and TSSC4M were not elevated at 24 h () and 18 h (Figure S7A), respectively; in contrast, the protein levels of SQSTM1 in the Vector alone cells and TSSC4M-expressing cells were significantly increased by CQ addition at 24 h, respectively (). The endogenous TSSC4 protein levels were also not increased by the addition of CQ in U87 cells at 18 h and in MDA-MB-231 cells at 4 h, 18 h, and 24 h (Figure S7A–B). These data indicate that TSSC4 and TSSC4M were not degraded by autophagy, consistent with the hypothesis that TSSC4 interacts with LC3-I in the cytosol but not with LC3-II on/in autophagosomes or autolysosomes. In U87 cells, autophagy was inhibited by 28% by TSSC4 overexpression but increased by 33% following TSSC4M expression (). This is supported by the changes of the autophagy substrate SQSTM1 protein levels, where, in vector-alone cells and TSSC4M-expressing cells but not in TSSC4-overexpressing cells, SQSTM1 protein levels were significantly increased by the addition of CQ, respectively (). Autophagy induced by starvation of glucose and glutamine was also inhibited by 30% by TSSC4 overexpression but not changed following TSSC4M expression in U87 cells (Figure S8A). Similar results were also observed in MDA-MB-231 cells where autophagy was inhibited by 20% following TSSC4 overexpression and increased by 60% following TSSC4M expression (Figure S9A). Taken together, TSSC4 interacts with LC3-I preventing the formation of LC3-II on/in autophagosome or autolysosome, resulting in autophagy inhibition.
Figure 4. TSSC4 inhibits autophagy by interacting with LC3. (A) Endogenous TSSC4 interacts with LC3-I in A549 cells. Cells were starved of nutrients (without changing medium) for 72 h. Then, cells were further incubated in fresh medium for 2 h before protein harvesting. Immunoprecipitation (IP) of TSSC4 was performed as described in the Materials and Methods section, followed by immunoblotting (IB) of TSSC4 and LC3. TCL, total cell lysate (the same hereafter). (B) A schematic presentation of human TSSC4 protein tagged with (3x) HA at its N-terminal which is encoded by the TSSC4 plasmid, EX-Z7596-M45 (TSSC4-(3x)HA/TSSC4). F97D98C99L100 is the conserved LC3-interacting region (LIR). The TSSC4 mutant, TSSC4M, was generated by changing F97 and L100 to alanine via site-directed mutagenesis. (C) TSSC4 interacts with LC3-I via its conserved LIR. Plasmids HA-EGFP (VECTOR), human TSSC4-HA (TSSC4), and its mutant TSSC4M-HA (TSSC4M), were transfected into U87 cells. Then protein lysates were made for immunoprecipitation (IP) of HA followed by immunoblotting (IB) of HA and LC3. (D) Immunofluorescence microscopy demonstrates the interaction between TSSC4 and LC3-I. U87 cells expressing mRFP-LC3B were performed for immunofluorescence of TSSC4 using the TSSC4 antibody. The diffused distribution of green fluorescence demonstrated TSSC4 expression in the cytosol. Diffused and puncta red fluorescence represent LC3-I (in the cytosol) and LC3-II (on autophagosomes/autolysosomes), respectively. The merged diffused yellow fluorescence demonstrated the interaction between TSSC4 and LC3-I in the cytosol. DAPI (4′,6-diamidino-2-phenylindole) was used to stain the nucleus (blue fluorescence). (E) Overexpression of TSSC4 but not TSSC4M inhibited autophagy. The empty Vector (HA), TSSC4 (TSSC4-HA), and TSSC4M (TSSC4M-HA, were transfected into U87 cells and stable cell lines were developed. Then, the endogenous/basal level of autophagy was measured by western blotting LC3-II and the autophagy substrate SQSTM1 in the absence and presence of CQ (20 µM).
TSSC4 inhibition of autophagy contributes to its inhibition of cell growth
To investigate whether TSSC4 inhibition of cell growth was due to its inhibition of autophagy, the effect of TSSC4M on cell growth was studied. In U87 and MDA-MB-231 cells, cell growth was significantly inhibited by more than 25% following TSSC4 overexpression but not significantly affected by TSSC4M expression, respectively (,C). Overexpression of TSSC4 but not TSSC4M inhibited proliferation (by 14%) as measured by BrdU incorporation assay in U87 cells (). The proliferation marker CCND1 was inhibited by 40% by TSSC4 but only by 10% by TSSC4M in MDA-MB-231 cells (). When cell growth was measured by colony formation assay, it was inhibited by 54% following TSSC4 overexpression but was only slightly inhibited by 14% following TSSC4M expression in MDA-MB-231 cells (Figure S9B). These data correlate with the observation that overexpression of TSSC4 but not TSSC4M inhibited autophagy ( and S9A). The autophagy inhibitor 3-MA inhibited autophagy (,C). It also inhibited cell growth, when measured by counting cell numbers, by more than 50% in U87 cells () and MDA-MB-231 cells (data not shown). In MDA-MB-231 cells, knockdown of the autophagy gene RB1CC1 or BECN1 decreased autophagy by 60% (Figure S10A–B), CCND1 protein level at least by 20% () and cell growth at least by 25% as measured by counting cell numbers () and by colony formation assay (Figure S10C), respectively. Thus, TSSC4 inhibits cell growth by inhibiting autophagy via interacting with LC3.
Figure 5. TSSC4 inhibition of cell growth is contributed by its inhibition of autophagy. Vector alone (HA), TSSC4 (TSSC4-HA) and its mutant TSSC4M (TSSC4M-HA) with two amino acids F97 and L100 in the conserved LC3-interacting region (LIR) (FDCL) being mutated to alanine, were transfected into cells and stable cell lines were generated. Cell death was measured by counting the numbers of cells (A, C, E). (A–B) Overexpression of TSSC4 but not its mutant TSSC4M inhibited cell growth in U87 cells. Expression of TSSC4, TSSC4M, was demonstrated by western blot (A). The autophagy inhibitor 3-MA (2 mM) was added on day 0 (A). (B) Cell proliferation was measured by BrdU incorporation assay (OD450). (C) Overexpression of TSSC4 but not its mutant TSSC4M inhibited cell growth in MDA-MB-231 cells. Expression of TSSC4, TSSC4M, and the proliferation marker CCND1 were demonstrated by western blot. TSSC4 and TSSC4 were identified by using HA tag antibody. (D–E) Knockdown of RB1CC1 or BECN1 by siRNAs inhibited cell growth in MDA-MB-231 cells. Knockdown of RB1CC1 or BECN1 as well as the knockown-affected CCND1 protein levels were demonstrated by western blot (D). ACTB was used as the loading control for western blot.
TSSC4 inhibition of autophagy contributes to its inhibition of tumorsphere formation
Tumorsphere formation in a suspension culture system can mimic the three-dimensional spatial conformation microenvironment of solid tumors that grow in vivo. To investigate the roles of TSSC4 in tumorsphere formation, we analyzed tumorsphere formation of GBM cells by monitoring the sizes and total numbers of tumorspheres, and the total numbers of cells in tumorspheres in U87 cells. Overexpression of TSSC4 decreased autophagy by 50%, whereas TSSC4M expression did not inhibit autophagy in tumorspheres (), consistent with the observations in U87 cells () and MDA-MB-231 cells (Figure S9A) grown in monolayer. The maximum size of tumorspheres was greatly reduced by overexpression of TSSC4 or TSSC4M (). The total number of tumorspheres and the total number of cells in tumorspheres were reduced by TSSC4 by 44% and 35%, respectively, but were increased by TSSC4M by more than 50%, respectively (,D), suggesting that TSSC4 suppresses tumorsphere formation likely by inhibiting autophagy. In the breast cancer MDA-MB-231 cells, the total number of tumorspheres was also reduced by TSSC4 overexpression by 33% which was partially reversed by the replacement of TSSC4 with TSSC4M to 19% inhibition, and the total number of tumorspheres was reduced by 3-MA by 39% and 42% in vector-alone cells and in TSSC4M cells, respectively (Figure S9C); whereas the sizes of tumorspheres were not significantly changed by TSSC4, TSSC4M or 3-MA (Figure S9D). These data support that TSSC4 inhibits autophagy contributing to its inhibition of tumorsphere formation.
Figure 6. TSSC4 inhibits tumorsphere formation by inhibiting autophagy. The effects of overexpression of TSSC4 and TSSC4M on tumorsphere formation were demonstrated in U87 cells. Stable expression of vector alone, TSSC4, and TSSC4M were shown in . Results were recorded on day 9 of tumorsphere growth. (A) Autophagy was inhibited by overexpression of TSSC4 but not by that of TSSC4M. Autophagy was measured by western blotting of LC3-II in protein lysates of tumorspheres that were pooled from multiple samples under a same condition. CQ (20 µM) was added one day before harvesting tumorspheres. ACTB was used as the loading control for western blot. (B) Example images of maximum sizes of tumorspheres. (C) Total number of tumorspheres per sample. (D) Total number of cells in tumorspheres per sample.
TSSC4 inhibition of autophagy contributes to its inhibition of tumor growth
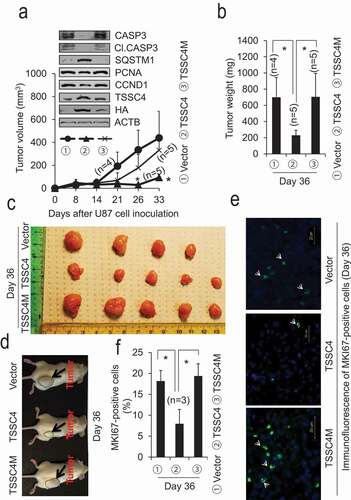
TSSC4 inhibition of cell growth and tumorsphere formation suggests its potential role as a tumor suppressor. To verify this hypothesis, we investigated the roles of TSSC4 and TSSC4M in tumor growth in an immunodeficient NOD-Prkdcscid-Il2rg/Il2rγtm1Wjl (NSG; il2rg null) mouse model. When vector (HA), TSSC4(-HA) and TSSC4M(-HA) U87 cells were subcutaneously injected into NSG mice, tumor growth was inhibited by TSSC4 but not by TSSC4M. Tumor volume and tumor weight were reduced by more than 66%, respectively, by TSSC4 overexpression but was not significantly affected by TSSC4M expression, on day 33 and day 36, respectively, post U87 cell inoculation (–D). Endogenous TSSC4 protein and overexpressed TSSC4 and TSSC4M proteins in tumor tissues were confirmed by western blot using TSSC4 and HA antibodies (). Consistent with the observations on tumor growth, protein levels of the proliferation markers CCND1 and PCNA in tumor tissues harvested on day 36 post U87 cell inoculation were decreased by TSSC4 overexpression but were not by TSSC4M expression (). The same phenomenon was also observed when proliferation marker MKI67 was measured by immunofluorescence where the proportion of MKI67-positive tumor cells was decreased by more than 50% by TSSC4 overexpression but was not significantly affected by TSSC4M expression (–F). Since a lysosomal inhibitor, for example chloroquine (CQ), was not used to treat mice for the determination of autophagic flux in tumors in our mouse model, the protein levels of the autophagy substrate SQSTM1 in tumor tissues were measured because SQSTM1 is degraded by a functional autophagy [Citation25]. The protein level of SQSTM1 was dramatically increased by TSSC4 overexpression but not by TSSC4M expression in tumor tissues harvested on day 36 post U87 cell inoculation (). This is consistent with the observation that SQSTM1 was significantly degraded by autophagy in vector-alone and TSSC4M-expressing cells, respectively, but not in TSSC4-overexpressing cells () and supports that autophagy was inhibited by TSSC4 but not by TSSC4M in tumors. Taken together, TSSC4 acts as a tumor suppressor by inhibiting autophagy.
Figure 7. Overexpression of TSSC4 but not TSSC4M in U87 cells inhibited tumor growth. Vector alone, TSSC4, and TSSC4M cells were subcutaneously injected into the immunodeficient NSG mice and tumor growth was monitored as described in the Materials and Methods section. A) Tumor volumes were measured on different days post cancer cell inoculation. Western blot showed the protein levels of TSSC4 (with HA or TSSC4 antibody), the proliferation markers PCNA and CCND1, the apoptosis proteins CASP3 and cleaved (Cl.) CASP3, and the autophagy substrate SQSTM1 in tumor tissues harvested on day 36 post cancer cell inoculation. When HA antibody was used, only overexpressed TSSC4 (TSSC4-HA) and TSSC4M (TSSC4M-HA) were detected. When TSSC4 antibody was used, both endogenous TSSC4 and overexpressed TSSC4 or TSSC4M were detected. (B) Quantification of tumor weights after tumors were dissected on day 36 post cancer cell inoculation. (C) Images of tumors on day 36 post cancer cell inoculation. (D) Example images of mice with tumors on day 36 post cancer cell inoculation. (E) Representative immunofluorescent images of the proliferation marker MKI67 (green, white arrow) in the cancer cells of tumor tissues on day 36 post cancer cell inoculation. (F) Quantification of the percentage of MKI67-positive cells in tumor tissues.
Oncogenic protein-driven cell growth is associated with increased TSSC4 expression and TSSC4 inhibition of autophagy and cell growth
One of the hallmarks of cancer is evading growth suppressors so that tumor suppressors are usually downregulated or inactivated in cancer cells [Citation1,Citation28,Citation29]. However, this hallmark seems to be contradicted by the finding in this study where TSSC4 is upregulated in cancer (Figure S1) but plays a growth suppressor role (). Hence, we investigated whether promotion of cancer cell growth could lead to TSSC4 upregulation and TSSC4 inhibition of cell growth. It is well known that expression of many oncogenic proteins can promote cell growth, among these proteins include the EGFR (epidermal growth factor receptor) family members ERBB2 and the EGFR mutant variant III (EGFRvIII) [Citation30,Citation31]. To investigate whether TSSC4 inhibits cell growth driven by EGFR receptor family members, we measured TSSC4 expression and cell growth in MDA-MB-231 and SKBR3 breast cancer cells expressing ERBB2 and in U373 glioblastoma cells expressing EGFRvIII. In the ERBB2-negative MDA-MB-231 cells, expression of ERBB2 promoted TSSC4 protein level and cell growth by 20% and 27%, respectively, and knockdown of TSSC4 in the ERBB2 expressing cells further increased cell growth by 31% (,B). This suggests that, when cell growth was promoted by ERBB2 expression, TSSC4 was upregulated and TSSC4 still inhibits cell growth. In the ERBB2-positive SKBR3 cells, knockout of ERBB2 decreased TSSC4 protein expression and cell growth by 60% and 32%, respectively (,E). Interestingly, overexpression of TSSC4 but not its mutant TSSC4M further decreased cell growth by 53% in the ERBB2 knockout cells (,E). Furthermore, TSSC4 knockout in SKBR3 cells increased cell growth by 56% (). These results indicate that TSSC4 controls the cell growth rate in ERBB2 expressing breast cancer cells: when ERBB2 expression is high, TSSC4 is upregulated to prevent cells from excessive growth, whereas when ERBB2 expression is downregulated, TSSC4 is downregulated to prevent cells from growth arrest. In these experiments (), TSSC4 downregulation promoting cell growth and overexpression of TSSC4 but not TSSC4M inhibiting cell growth are consistent with their promotion and inhibitory effects on autophagy (,S3 and S9A). Similar to the effects of ERBB2 expression, expression of EGFRvIII in U373 cells increased TSSC4 protein level and cell growth by 50% and 178%, respectively (–B). Knockout of TSSC4 in U373 EGFRvIII cells increased cell growth by more than 50% (–D) although growth rate has been significantly increased by EGFRvIII expression in U373 cells (). This is consistent with the observation that TSSC4 knockout increased autophagy by 70% (). Conversely, the autophagy inhibitor 3-MA inhibited cell growth by more than 50% in both the control and TSSC4 knockout cells (). Furthermore, knockdown of the autophagy gene RB1CC1 in the control U373 EGFRvIII cells or the TSSC4 knockout U373 EGFRvIII cells inhibited cell growth by more than 20%, respectively (). The effect of RB1CC1 in autophagy was confirmed, where its knockdown inhibited autophagy by 40% in the TSSC4 knockout U373 EGFRvIII cells (Figure S11), which also further supports that TSSC4 may regulate the canonical autophagy pathway. Tumorsphere formation by TSSC4 knockout was also determined in U373 EGFRvIII cells. TSSC4 knockout in tumorspheres increased autophagy by 780% which was then inhibited by the autophagy inhibitor 3-MA by 51% (). The maximum size of tumorspheres was dramatically increased by TSSC4 knockout which was then significantly reduced by 3-MA treatment (). The total number of tumorspheres and the total number of cells in tumorspheres were increased by TSSC4 knockout by 65% and 46%, respectively, which were then inhibited by 3-MA treatment by 47% and 44%, respectively (–D). In the breast cancer SKBR3 cells, TSSC4 knockout also increased the maximum size of tumorspheres (Figure S12A) and the total number of tumorspheres by 154% (Figure S12B), respectively.
Figure 8. ERBB2 increases TSSC4 expression which inhibits cell growth in breast cancer cells. (A–B) ERBB2 expression increases TSSC4 protein level and cell growth in MDA-MB-231 cells and TSSC4 knockdown in the ERBB2 expressing cells further increases cell growth. (A) Western blot showed expression of ERBB2 and TSSC4, and knockdown of TSSC4. (B) cell growth was measured by cell counting. (C–F) Effects of ERBB2 knockout and TSSC4 overexpression or knockout on cell growth in SKBR3 cells. (C) Western blot showed ERBB2 knockout and TSSC4 expression. (D) Western blot showed expression of Vector (HA), TSSC4 (TSSC4-HA) and TSSC4M (TSSC4M-HA) in SKBR3 ERBB2 knockout cells (NIC-ERBB2). (E) Effects of ERBB2 knockout and TSSC4/TSSC4M overexpression on cell growth that was measured by cell counting. (F) Effect of TSSC4 knockout on cell growth. Western blot showed TSSC4 knockout. NIC-Con, Control cells; NIC-TSSC4, cells with TSSC4 knockout (the same hereafter). ACTB was used as the loading control for western blot.
Figure 9. TSSC4 regulates cell growth in EGFRvIII-expressing U373 glioblastoma (GBM) cells. (A) Western blot showed that expression of EGFRvIII increased the activity of EGFR tyrosine kinase and the level of TSSC4 protein. Phosphorylation of EGFR at Y1068 (P-EGFR, P-EGFRvIII), a major site for EGFR autophosphorylation, represents the activation of EGFR tyrosine kinase. (B) Expression of EGFRvIII increased cell growth in U373 cells. Cell growth was measured by cell counting. (C–D) Knockout of TSSC4 increased cell growth, where the autophagy inhibitor 3-MA (2 mM) decreased growth in control and TSSC4 knockout cells, respectively. Cell growth was measured by cell counting (C) and colony formation assay with example images of colonies shown (D). Western blot demonstrated TSSC4 knockout by CRISPR/Cas-9 technique. NIC-Con, Control cells; NIC-TSSC4, cells with TSSC4 knockout (the same hereafter). (E) TSSC4 knockout increased autophagy which was measured by western blotting of KC3-II in the absence and presence of CQ (20 μM). (F) Knockdown of RB1CC1 inhibited cell growth in control and TSSC4 knockout U373 EGFRvIII cells. Cell growth was measured by cell counting. Western blot demonstrated knockdown of RB1CC1. ACTB was used as the loading control for western blot.
Figure 10. Effect of TSSC4 knockout on tumorsphere formation in U373 EGFRvIII cells. TSSC4 knockout was demonstrated in . Results were recorded on day 10 of tumorsphere growth. (A) TSSC4 knockout increased autophagy in tumorspheres. Autophagy was measured by western blotting LC3-II in protein lysates of tumorspheres that were pooled from multiple samples under a same condition. CQ (20 µM) was added one day before harvesting tumorspheres, and 3-MA (2 mM) was added on day 2 of tumorsphere growth. ACTB was used as the loading control for western blot. (B) Example images of maximum sizes of tumorspheres. (C) Total number of tumorspheres per sample. (D) Total number of cells in tumorspheres per sample.
Oncogenic protein-driven tumor growth is increased by TSSC4 knockout
The oncogenic proteins ERBB2 and EGFRvIII increased TSSC4 expression and cell growth in MDA-MB-231 breast cancer cells (–B) and U373 GBM cells (–B), respectively. Furthermore, TSSC4 knockout increased cell growth and tumorsphere formation in U373 EGFRvIII cells (–D and 10) and ERBB2-expressing SKBR3 cells ( and S12), respectively. To investigate whether oncogenic protein-driven tumor growth is also increased by TSSC4 knockout, control and TSSC4 knockout U373 EGFRvIII cells were subcutaneously injected into the immunodeficient NSG mice as described in the Materials and Methods section and in . As expected, TSSC4 knockout increased tumor growth of U373 EGFRvIII cells.
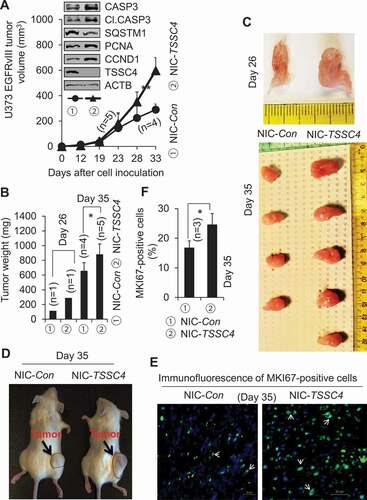
Tumor volume and tumor weight were increased by more than 30%, respectively, by TSSC4 knockout on day 33 and day 26 and 35, respectively, post U373 cell inoculation (–D). TSSC4 knockout in tumor tissues was confirmed by western blot using TSSC4 antibody (). Consistent with the observations of tumor growth, protein levels of the proliferation markers CCND1 and PCNA in tumor tissues harvested on day 35 post U373 cell inoculation were increased by TSSC4 knockout (). The same phenomenon was also observed when proliferation marker MKI67 was measured by immunofluorescence where the proportion of MKI67-positive tumor cells was increased by more than 40% by TSSC4 knockout (–F). The protein level of SQSTM1 was decreased by TSSC4 knockout in tumor tissues harvested on day 35 post U373 cell inoculation (), suggesting that autophagy was increased by TSSC4 knockout in tumors. These results further support that TSSC4 acts as a tumor suppressor by inhibiting autophagy even when it was upregulated in cancer cells with increased cell growth rate by expression of an oncogenic protein.
Figure 11. Knockout of TSSC4 in U373 EGFRvIII cells increased tumor growth. Control (NIC-Con) and TSSC4 knockout (NIC-TSSC4) cells were subcutaneously injected into the immunodeficient NSG mice and tumor growth was monitored as described in the Materials and Methods section. (A) Tumor volumes were measured on different days post cancer cell inoculation. Western blot showed the protein levels of TSSC4, the proliferation markers PCNA and CCND1, the apoptosis proteins CASP3 (caspase 3) and cleaved (Cl.) CASP3, and the autophagy substrate SQSTM1 in tumor tissues harvested on day 35 post cancer cell inoculation. (B) Quantification of tumor weights after tumors were dissected on day 26 and day 35 post cancer cell inoculation, respectively. (C) Images of tumors on day 26 and day 35 post cancer cell inoculation. (D) Example images of mice with tumors on day 35 post cancer cell inoculation. (E) Representative immunofluorescent images of the proliferation marker MKI67 (green, white arrow) in the cancer cells of tumor tissues on day 35 post cancer cell inoculation. (F) Quantification of the percentage of MKI67-positive cells in tumor tissues.
Cell death induced during cancer cell growth is inhibited by TSSC4
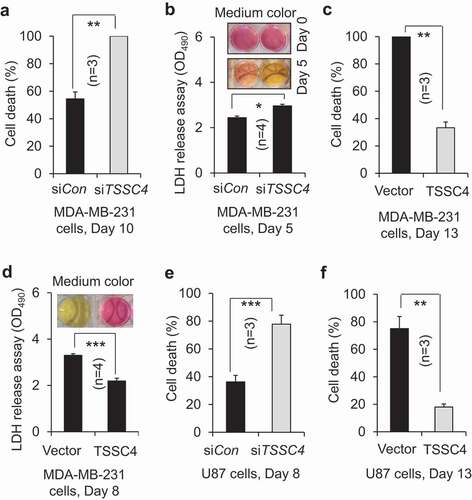
Tumor growth is mainly controlled by two factors: proliferation which increases cell number, and cell death which decreases cell number. It was proposed that tumor suppressors can act as metabolic regulators to benefit tumor growth when fast growing tumors face challenges in the limitation of nutrient and oxygen availability in the in vivo tumor microenvironment [Citation28]. During cell growth, the increase of cell numbers leads to consumption of nutrients such as glucose in medium increasing cell death [Citation32]. Thus, we hypothesized that cancer cells upregulate the TSSC4 tumor suppressor to prevent cell death caused by excessive growth. To investigate the effect of TSSC4 on cell death induced during cell growth, cancer cells were grown for a prolonged periods of time without changing medium. Cell death was measured by trypan blue exclusion assay and LDH (lactate dehydrogenase) release assay. When cell die, LDH is released into growth medium, which can be measured by colorimetric assay [Citation33]. The characteristic Warburg effect makes cancer cells produce a high level of lactic acid catalyzed by LDH [Citation34]. This changes the phenol red-containing growth medium from red color to yellow color [Citation35]. Fast growing cells will produce more lactic acid, lead to higher cell death, more LDH release into the growth medium and therefore higher intensity of yellow color of growth medium, compared to slow growing cells. TSSC4 knockdown increased cell death from 54% to 100% in MDA-MB-231 cells () and from 36% to 78% in U87 cells (), respectively, when cell death was measured by trypan blue staining. In MDA-MB-231 cells, TSSC4 knockdown increased LDH release by 20% which is supported by the color change of phenol red-containing growth medium, where the release of lactic acid from dead cells changed the medium color from red to yellow (). Conversely, when TSSC4 was overexpressed, cell death was reduced from 100% to 33% in MDA-MB-231 cells () and from 75% to 18% in U87 cells (), respectively. In MDA-MB-231 cells, TSSC4 overexpression decreased LDH release by 34% which is supported by the color change of growth medium, the intensity of red color was much higher in the medium of cells with TSSC4 overexpression than that in the medium of cells with vector-alone (). These data support that TSSC4 inhibits cell death during cell growth.
Figure 12. TSSC4 regulates cell death caused by excessive growth. The same number of cells (starting number of cells) was grown in 3 ml of complete medium in each well of 6-well plates without changing medium. Then, cell death was measured by counting the percentage of dead cells after cells were stained with trypan blue (A, C, E, F) or by LDH (lactate dehydrogenase) release assay (absorbance at 490 nm (OD490)) (B, D). The result of LDH release assay was supported by the color change of the phenol red-containing growth medium from red to yellow caused by the release of lactic acid, the end product of the LDH catalyzed reaction (B, D). (A–B) TSSC4 knockdown increased cell death in MDA-MB-231 cells. The starting number of cells on day 0 was 0.2 × 10⁶. Knockdown of TSSC4 was demonstrated in Figure 1A. (C–D) Overexpression of TSSC4 decreased cell death in MDA-MB-231 cells. The starting number of cells on day 0 was 0.5 × 10⁶. Overexpression of TSSC4 was demonstrated in Figure 2A. (E) TSSC4 knockdown increased cell death in U87 cells. The starting number of cells on day 0 was 0.4 × 10⁶. Knockdown of TSSC4 was demonstrated in Figure 1E. (F) Overexpression of TSSC4 decreased cell death in U87 cells. The starting number of cells on day 0 was 0.3 × 10⁶. Overexpression of TSSC4 was demonstrated in Figure 2D.
To investigate whether TSSC4 inhibition of cell death during growth is due to its inhibition of autophagy, the role of TSSC4M in cell death was studied. In MDA-MB-231 cells, cell death was inhibited by 54% (on day 6) and 52% (on day 8) by TSSC4 overexpression but was not changed by TSSC4M expression between day 3 and day 8 (). This is supported by the LDH release assay, where LDH release was inhibited by 34% by TSSC4 overexpression but was not significantly affected by TSSC4 expression, which is supported by the color change of growth media, the intensity of red color in the medium of cells with TSSC4 overexpression was much higher than that in the medium of cells with vector-alone or with TSSC4M expression (). In U87 tumorsphere cells, cell death tended to be reduced by TSSC4 overexpression but was increased by more than 180% by TSSC4M expression (). As autophagy was inhibited by TSSC4 overexpression but not by TSSC4M (), these observations indicate that TSSC4 inhibition of cell death during growth is contributed to by its inhibition of autophagy. This conclusion is also true during tumor growth in vivo, where the protein levels of CASP3 (caspase 3) and cleaved CASP3, which is indicative of apoptosis, were significantly higher in vector-alone and TSSC4M-expressing U87 tumors than that in TSSC4-overexpressing U87 tumors, respectively (). This is further supported by the knockdown of autophagy genes. In MDA-MB-231 cells, knockdown of RB1CC1 or BECN1 inhibited autophagy (Figure S10A–B), respectively, and cell death on day 6 by 40% (), respectively. Furthermore, knockdown of RB1CC1 or BECN1 also inhibited LDH release on day 6 by 20%, respectively, which is supported by the color change of growth media, where the intensity of red color in the medium of cells with RB1CC1 or BECN1 knockdown was higher than that in the medium of cells with control siRNA (). In U373 cells, knockdown of the autophagy gene ATG5 inhibited autophagy by 40% (Figure S13A), cell growth on day 10 by 48% (Figure S13B) and cell death during growth on day 8 by 30% (Figure S13C). In contrast, TSSC4 knockdown in U373 cells increased autophagy and cell death during cell growth on day 8 by 30% (Figures S3A and S13C), respectively. We then treated the control and TSSC4 knockout U373 EGFRvIII cells with the autophagy inhibitor 3-MA on day 0 and day 4, respectively; and cell death was measured on day 3 and day 7, 3 days after 3-MA treatment, respectively. On day 3, only about 6% of cell death was detected in both the control and TSSC4 knockout cells and 3-MA added on day 0 decreased cell death to less than 2% in each type of cells (). In contrast, on day 7, cell death remained at about 6% in the control cells, but it was increased to 53% in the TSSC4 knockout cells (). When 3-MA was added in the control cells on day 4, cell death was increased from 6% to 46% on day 7 (); this supports that autophagy played a pro-survival role after day 3. In contrast, when 3-MA was added in the TSSC4 knockout cells on day 4, cell death was decreased from 53% to 27% on day 7 (); this indicates that autophagy played a pro-cell death role after day 3. Since TSSC4 knockout increased autophagy (), cell death might be shifted to autophagy-promoted cell death after a prolonged time in growth media. Furthermore, in U373 EGFRvIII cells, TSSC4 knockout increased cell death in tumorspheres from 12% to 23% which was then inhibited by 3-MA treatment by 31% (), indicating that TSSC4 knockout led to autophagy-promoted cell death in tumorspheres. TSSC4 knockout in U373 EGFRvIII cells significantly increased the protein levels of the CASP3 and cleaved CASP3 in growing tumors (). These results further support that TSSC4 inhibits tumorsphere formation and cell death in tumorspheres and growing tumors by inhibiting autophagy in cancer cells overexpressing an oncogenic protein.
Figure 13. TSSC4 inhibition of cell death during prolonged growth is contributed by its inhibition of autophagy. Cell death was measured by trypan blue staining (A, C, D) and by LDH release assay of absorbance at 490 nm (OD490) with example images of the phenol red-containing growth medium colors (B, E). (A–B) Cell death was decreased by overexpression of TSSC4 but not by that of TSSC4M in MDA-MB-231 cells. The starting number of cells on day 0 was 0.1 × 10⁶ (A). Cell death was measured on day 3, 6, and 8. Overexpression of TSSC4 or TSSC4M was demonstrated in Figure 5C. (C) Effects of overexpression of TSSC4 and TSSC4M on cell death in U87 tumorspheres. Overexpression of TSSC4 or TSSC4M was demonstrated in Figure 5A. (D–E) Cell death was decreased by knockdown of RB1CC1 or BECN1. Cell death was measured on day 3 and 6. Knockdown of RB1CC1 or BECN1 was demonstrated in Figure 5D.
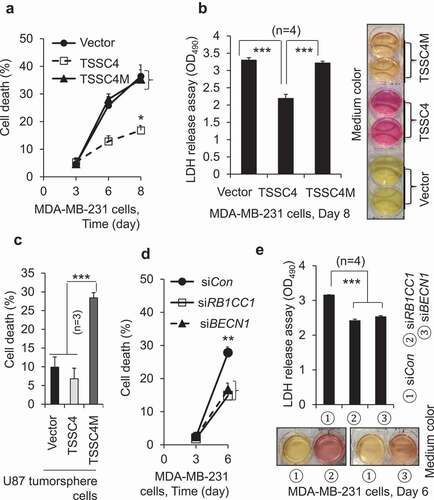
Figure 14. Effects of TSSC4 knockout on cell death during prolonged growth in the absence and presence of 3-MA in U373 EGFRvIII cells. (A) Cell death in monolayer cells. The starting number of cells on day 0 was 0.2 × 10⁶. The autophagy inhibitor 3-MA (2 mM) was added on day 0 and day 4 for the cell death assays on day 3 and day 7, respectively. (B) Cell death in tumorspheres. The autophagy inhibitor 3-MA was added on day 2 of tumorsphere growth. Cell death was measured by trypan blue staining. TSSC4 knockout was demonstrated in Figure 9C.
Discussion
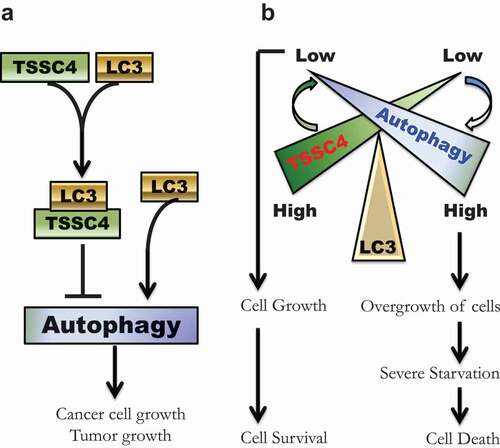
The rapid growth of cancer cells leads to nutrient deprivation in their microenvironment [Citation36,Citation37], which can cause cell death. The TSSC4 gene was first isolated in 1999 [Citation9] and is expressed at high levels in fast growing cancers but its biological functions have been largely unknown. We have now identified TSSC4 as a novel tumor suppressor that regulates cell growth and acts as a novel inhibitor of autophagy. Specifically, TSSC4 is upregulated and inhibits cancer cell and tumor growth mediated at least in part by downregulation of autophagy. Indeed, autophagy-promoted cancer cell growth has been demonstrated in vitro and in transgenic animal models [Citation4–6,Citation38,Citation39]. The TSSC4-regulated reduction in cancer cell and tumor growth is accompanied by a decrease in cell death during growth through TSSC4 interaction with LC3 via its conserved LC3-interacting region (LIR) inhibiting autophagy (). Taken together, our findings provide evidence for TSSC4 being a novel tumor suppressor and an autophagy inhibitor that benefits sustainable cancer cell growth by limiting the extent of cell death induced by prolonged cell growth ().
Figure 15. Schematic illustrations of the inhibition of autophagy by TSSC4 and a potential role of TSSC4 in cancer cell growth and growth-associated cell death. (A) A graphic model shows TSSC4 inhibition of autophagy. TSSC4 interacts with the cytosolic LC3-I via its conserved LIR (FDCL). This can prevent the formation of the autophagosome/ autolysosome-bound LC3-II leading to inhibition of autophagy, cell growth and tumor growth. (B) A graphic model illustrates a potential role of TSSC4 in cancer cell growth and growth-associated cell death. When TSSC4 level is high, its interaction with LC3 suppresses autophagy at a low level which promotes cancer cell growth but not overgrowth. Thus, severe starvation might be avoided or delayed, and most cancer cells generated from cell growth will survive. Conversely, when TSSC4 is low, more LC3 will be free from binding to TSSC4. This can significantly increase autophagy levels leading to overgrowth of cancer cells. The rapid growth of cancer cells would quickly deprive the nutrients in their microenvironment resulting in starvation-induced cell death.
Autophagy plays a double-edged sword by either promoting cell growth and cell survival or cell death depending upon the context [Citation2,Citation40]. It has been widely accepted that autophagy can play a pro-cell survival role; however, under certain circumstances, autophagy-induced cell death does exist [Citation41]. Our previous studies showed that autophagic cell death can be induced by oxidative stress [Citation42,Citation43] and prolonged treatment of cancer cells with hypoxia [Citation8,Citation44]. Autophagic cell death can also be induced by many other treatments such as knockdown of PKM/PKM2 (pyruvate kinase M1/2) in prostate cancer cells [Citation45], a combination of curcumin and gefitinib in gefitinib-resistant non-small-cell lung cancer cells [Citation46], arsenic trioxide in osteosarcoma cells [Citation47] and glioma cells [Citation48], and lapatinib in hepatocellular carcinoma [Citation49]. Under hypoxia, autophagy at a low level plays a cancer cell survival role initially but over time hypoxic cell death is dependent on autophagy increase due to that the level of autophagy was enhanced [Citation8]. A similar context could be described during cancer cell growth, where the low level of autophagy maintained by the presence of TSSC4 played a pro-cell survival role whereas the enhanced level of autophagy induced by TSSC4 downregulation played a pro-cell death role. This exact context that occurs in tumors will be the focus of future investigations.
Autophagy regulators can execute their functions by directly interacting with an autophagy protein. Most of these regulators interact with an autophagy protein in the upstream of the classical autophagy pathway [Citation50–52]. For example, BCL2 inhibits autophagy by interacting with BECN1 [Citation53]. Activation of MTOR (mechanistic target of rapamycin) complex 1 (MTORC1) inhibits autophagy by interacting with ULK1 (unc-51 like autophagy activating kinase 1) complex [Citation54–56]. Activation of PRKAA1/AMPKa1 (protein kinase AMP-activated catalytic subunit alpha 1) can increase autophagy by interacting with the ULK1 complex [Citation57,Citation58]. Many proteins have the potential to interact with LC3, a characteristic protein in the downstream of the autophagy pathway, via their LC3-interacting regions (LIRs) [Citation24]. These proteins include some members of the core autophagy machinery such as ULK1 and ATG4B (autophagy related 4B cysteine peptidase), and autophagy receptors that participate in selective autophagy and will be degraded in the autolysosome, such as SQSTM1, NBR1, CALCOCO2/NDP52 and BNIP3. In this study, we discovered that TSSC4 is a novel autophagy inhibitor that interacts with LC3, downstream in the autophagy pathway. In contrast to the known LC3-interacting autophagy receptors, this newly identified LC3-interacting protein TSSC4 inhibits the autolysosome function indicating a novel mechanism in negatively regulating autophagy downstream of BECN1.
Cancer cells usually become more aggressive by overexpression or activating mutations of oncogenic proteins promoting cell growth. For example, the EGFR family members EGFR and ERBB2 can promote cancer cell growth and disease progression. EGFR family members are overexpressed or mutated in many types of cancers, especially in breast, ovarian and non-small cell lung cancers [Citation59]. As the most potent oncogene of the EGFR family members, ERBB2 is overexpressed in the tumors of many types of cancers to promote metastasis and cell growth [Citation60–62]. Immunohistochemistry (IHC) analysis shows that ERBB2 protein is expressed in the tumor tissues of 11–25% of breast cancer, 12–14% of esophageal cancer, 8–70% of bladder cancer, 7–34% of gastric adenocarcinomas, 2.8% of cervical cancer, 1.6–5% of colorectal cancer, and 1–9% chlolangiocarcinomas [Citation63]. Overexpression or activating mutations of EGFR have been observed in many types of solid tumors such as lung cancer, breast cancer, and GBMs [Citation64]. The most common mutation of EGFR is EGFRvIII which leads to the constitutive tyrosine kinase activation of EGFR, present in 25–64% of GBMs [Citation65], 20–78% of breast tumor tissues [Citation65], and 16–39% of non-small-cell lung cancer (NSCLC) [Citation65,Citation66], respectively. Activation of the tyrosine kinase of ERBB2 and EGFR can stimulate cell growth [Citation60,Citation67] but was reported to suppress autophagy through the interactions between ERBB2 and BECN1 [Citation68] and between EGFR and BECN1 [Citation8,Citation69], respectively. Our recent study demonstrated that ERBB2 actually promotes autophagy [Citation25] and another study reported that EGFRvIII also promotes autophagy [Citation70], which are consistent with the notion that autophagy promotes cell growth. We have now shown that ERBB2 or EGFRvIII increase TSSC4 expression which suppresses autophagy via TSSC4-LC3 interaction, preventing over-activation of autophagy which can promote cell death. The function of endogenous level of autophagy in U373 EGFRvIII cells was shifted from pro-cell survival to pro-cell death when TSSC4 was knocked out (). In U373 EGFRvIII tumorspheres, cell death was increased by TSSC4 knockout which was then inhibited by the autophagy inhibitor 3-MA (), suggesting the cell death-promoting role of autophagy.
Besides ERBB2 and EGFRvIII, gain-of-function mutations of RAS (HRAS, NRAS, or KRAS) increase cell proliferation, aggressiveness, and metastasis as well as worse prognosis in various types of tumors and hematopoietic malignancies [Citation71,Citation72]. RAS can modulate autophagy through several signaling pathways and conversely, autophagy can promote RAS-driven cancer growth and invasion [Citation73]. MYC/C-MYC, MYCN, and MYCL are deregulated in more than 50% of human cancers contributing to poor prognosis [Citation74]. MYC proteins play a role in metabolism re-programming and tumor growth and may suppress lysosomal biogenesis to regulate autophagy [Citation75]. The mechanisms underlying EGFR family members-regulated TSSC4 expression and the role of TSSC4 in cancer cells overexpressing or having activating mutations of RAS or MYC oncogenic proteins will be the focus of future investigations.
Taken together, we demonstrated a biological role of TSSC4 where it can play a double-edged sword in cancers by acting as a novel tumor suppressor to suppress cell growth, tumorsphere formation and tumor growth, and by protecting cancer cells from excessive growth mediated cell death. Importantly, this provides sustainable cancer cell growth mainly through TSSC4 inhibition of autophagy. Furthermore, to our knowledge, TSSC4 is the first LC3-interacting protein that prevents autophagy downstream of the classical autophagy pathway. This provides new insight into treatment strategies where the balance between tumor cell growth and cell death can be disturbed through regulators of autophagy.
Materials and methods
Reagents and antibodies
Trypan blue solution (T8154), sodium orthovanadate (S6508), 3-methyladenine (3-MA; M9281), chloroquine diphosphate (C6628), and phosphatase inhibitor cocktails 2 and 3 (P5726, P0044) were purchased from Sigma-Aldrich, protease inhibitor cocktail (11,836,153,001) from Roche Diagnostics, and Pierce™ Protein G Magnetic Beads (88,847) and Pierce™ Anti-HA Magnetic Beads (88,836) from Thermo Fisher Scientific. The siRNAs against TSSC4 (siTSSC4) (sc-96,923), RB1CC1/FIP200 (sc-38,211), BECN1 (sc-29,797) and ATG5 (sc-41,445), and Control siRNA-A (siCon) (sc-37,007) were purchased from Santa Cruz Biotechnology.
Primary antibodies: anti-CCND1 (55,506), anti-PCNA (2586), anti-MKI67/ki67(9449), anti-EGFR (2232), anti-phospho-EGFR (Y1068) (2234), anti-ERBB2 (2165), anti-RB1CC1/FIP200 (12,436), anti-BECN1 (3738), anti-ATG5 (2630), anti-LC3B (2775S), anti-SQSTM1/p62 (88,588), anti-CASP3/caspase 3 (9661) and rabbit IgG control (2729) were purchased from Cell Signaling Technology, anti-TSSC4 (sc-136,945) and ant-HA probe (sc-7392) from Santa Cruz Biotechnology, and anti-ACTB/actin beta from Sigma-Aldrich (A3853). Secondary antibodies: goat anti-rabbit IgG (H+L)-HRP conjugate (170–6515) and goat anti-mouse IgG (H+L)-HRP conjugate (170–6516) were obtained from Bio-Rad Laboratories.
Cell culture
The glioblastoma cell lines U87, U373, and U373 EGFRvIII and the breast cancer cell lines MDA-MB-231 and SKBR3, and the non-small-cell lung cancer cell line A549, which are maintained in the Research Institute of Oncology and Hematology at Cancer Care Manitoba and have been used in our previous publications [Citation8,Citation25], were grown in Gibco DMEM, high glucose medium (Thermo Fisher Scientific, 11,965,092) supplemented with 100 units of penicillin per mL plus 100 µg of streptomycin per mL (Life Technologies, 15,140–122) and 5% fetal bovine serum, in a humidified 5% CO2, 37°C incubator.
Western blot analysis and immunoprecipitation (IP)
Western blot was described in our previous publication [Citation76]. Immunoprecipitation (IP) is also similar to that in our previous work [Citation8]. Total cell lysate (TCL) was generated by lysis of cells with NP40 (Sigma-Aldrich, I8896) protein lysis buffer containing 0.5% NP40, 250 mM NaCl, 50 mM Tris HCl, pH 7.4, 50 mM NaF, 15 mM sodium pyrophosphate, 1 mM glycerophosphate, 1 mM Na3VO4, 500 nM okadaic acid [Sigma-Aldrich, O7885], 20 μg/ml aprotinin [Sigma-Aldrich, A1153], 0.7 μg/ml pepstatin A [Sigma-Aldrich, P5318], 5 μg/ml leupeptin [Sigma-Aldrich, L2884], 1 mM phenylmethanesulfonyl fluoride (PMSF) [Sigma-Aldrich, 93,482] [Citation77]), with the addition of protease inhibitor cocktail, phosphatase inhibitor cocktails 2 and 3. Western blot was performed by following the principle of linear range of detection which means that the range of protein sample loaded on the SDS-PAGE gel gives a linear relationship between the amount of total proteins and the band intensity of a target protein on the membrane transferred from the gel [Citation78]. In this study, the combined linear range of detection was applied to detect a target protein (for example, TSSC4 or LC3-II) by using an amount of total proteins that produces signals on transfer membrane within a linear range of detection both for the target protein and the housekeeping protein ACTB. Using our system, we found that a range of 2–40 µg total proteins made all proteins (including ACTB) (from different cell lines) western blotted in this study fit in a linear range of detection. The western blot data were generated by using 4–20 µg total proteins. Immunoprecipitation (IP) is similar to that in our previous work [Citation8]. TCL containing 200 µg protein was incubated with anti-TSSC4 or anti-HA antibody at 4°C overnight. Then 100 μl of protein G magnetic beads or anti-HA magnetic beads was added to the mixture of protein lysate and a primary antibody, followed by incubation at 4°C overnight. The IP complex was washed 4 times with NP40 lysis buffer. The pellet was re-suspended with protein loading dye and then followed by immunoblotting. ImageJ program was used to quantify the intensity of western blot protein bands. To quantify the band intensity of a protein, an area covering the entire protein band of a sample with the maximum area of protein band will be used for all samples and their individual backgrounds on a same gel. The actual protein band intensity of a sample is obtained by subtracting its background at the upper or lower side of the sample. The relative protein band intensity of a sample is calculated by dividing its corresponding ACTB band intensity.
Measurement of cell growth by counting cell numbers
Same number of cells and 3 ml of complete growth medium were added in each well of 6-well plates on day 0. Then, cells in each well were collected by trypsinization and counted under a microscope at different time points.
BrdU cell proliferation assay
Cell proliferation was measured by bromodeoxyuridine (BrdU) incorporation assay using the BrdU cell proliferation ELISA kit (ab126556) purchased from Abcam [Citation79]. As a thymidine anolog, BrdU is incorporated into newly synthesized DNA of proliferating cells, which is then identified by BrdU antibody and measured by colorimetric assay of absorbance at 450 nm (OD450) following the manufacturer’s instructions. A high value of OD450 corresponds to a high percentage of BrdU-positive cells, representing a high rate of cell proliferation.
Measurement of cell growth by colony formation assay
Increase of cell numbers during cell growth can be analyzed by counting the numbers of colonies formed from individual cells as described in a clonogenic assay [Citation8,Citation80]. Briefly, 1,000 cells and 3 ml of complete medium were added in each well of 6-well plates. Then, cells were allowed to grow to form colonies each of which has at least 30 cells. Medium was removed, and cells were gently rinsed twice in PBS, fixed and stained in a mixture of 0.5% crystal violet and 6% glutaraldehyde for at least 2 h. The mixture of crystal violet and glutaraldehyde was gently removed and cells were washed at least 4 times in tap water. Finally, colony number in each well was counted after the plates containing cell colonies were thoroughly air-dried.
Immunofluorescence microscopy
Immunofluorescence microscopy was performed similar to that previously described [Citation8]. U87 cells expressing mRFP-LC3B (1 × 10⁵ per well) were added on round cover slips and treated in 6-well plates. Then, cells were fixed in 3.7% formaldehyde in phosphate-buffered saline (PBS; Thermo Fisher Scientific, SH30013.03) for 1 h, blocked in a blocking buffer containing 5% bovine serum albumin (Sigma-Aldrich, A2058) and 0.3% Triton X-100 (Sigma-Aldrich, T-6878) in PBS for 1 h and washed three times in PBST (PBS with 0.1% Tween-20 [Sigma-Aldrich, P2287]) at room temperature, followed by incubation with TSSC4 primary antibody (with a dilution of 1:100) at 4°C overnight. On the second day, cells on coverslips were washed 3 times in PBST and incubated with fluorescent conjugated secondary antibody (Alexa Fluor 488-conjugated donkey anti-rabbit; Life Technologies, A-21206) for 2 h. Then, cover slips with attached cells were mounted on a glass slide using VECTASHIELD Antifade Mounting Medium with 4′,6-diamidino-2-phenylindole (DAPI; Vector Laboratories, H-1200). Cells were visualized and images were captured using an Olympus BX51 fluorescent microscope (Melville, NY, USA) with a Photometrics Coolsnap cf® camera (Roper Scientific, Tucson, AZ, USA). Immunofluorescence of paraffin-embedded tumor tissues was described in our previous publication [Citation81].
Measurement of autophagy
During autophagy, the cytosolic form of LC3, LC3-I, is converted to its lipidated form, LC3-II, in phagophore membranes. Then, LC3-II in the inner membrane of autophagosomes will be degraded in the autolysosome. To detect a functional autophagy, autophagic flux was measured by western blot and fluorescence microscopy. The protein level of LC3-II, in the absence and presence of a lysosomal inhibitor chloroquine (CQ, 20 µM; Sigma-Aldrich, C6628), was measured by western blot. An increase in the level of LC3-II in the presence of CQ compared to that in its absence indicates a positive autophagic flux. Another method to measure autophagy is to quantify number of autophagosomes or autolysosomes by fluorescent microscopy. Cells were transfected with pmRFP-LC3B plasmid (Addgene, 21,075; deposited by Tamotsu Yoshimori) [Citation82] and grown on cover slips. Then, the expression of LC3 (red color) was observed with a fluorescence microscope. The diffused red fluorescent color represents LC3-I and the mRFP-LC3 red puncta represent LC3-II-located autophagosomes or autolysosomes. Autophagy was quantified by counting the number of mRFP-LC3 puncta per cell. CQ was used to measure autophagic flux. When the autophagy inhibitor 3-MA was used, cells were pre-incubated with it for 1 h before treatment. When cells were treated with starvation of glucose and glutamine (No GP), growth medium was removed and cells were incubated with No GP medium which was made by using the Dulbecco’s Modified Eagle’s Medium without glucose, L-glutamine, phenol red, sodium pyruvate and sodium bicarbonate (Sigma-Aldrich, D5030).
Gene knockdown by RNA interference (RNAi)
Knockdown of TSSC4, RB1CC1/FIP200, BECN1 or ATG5 was performed by using siRNAs from Santa Cruz Biotechnology. Control siRNA and the siRNAs targeting different autophagy genes were transfected into cells using Lipofectamine 2000 (Invitrogen, 11,668–019). Gene knockdown was confirmed by western blot. TSSC4 siRNA is a pool of two target-specific 19–25 nt siRNAs against human TSSC4 gene, each of the siRNAs targeting human RB1CC1/FIP200, BECN1 and ATG5 genes is a pool of three target-specific 19–25 nt siRNAs.
Generation of gene knock-out cell lines using CRISPR-Cas9 gene editing
The double nickase Clustered Regularly Interspaced Short Palindromic Repeats-CRISPR associated protein 9 (CRISPR-Cas9) plasmids designed by Santa Cruz Biotechnology were used to knock out TSSC4 and ERBB2 in cells. TSSC4 double nickase plasmid (sc-410,490-NIC) (NIC-TSSC4), ERBB2 double nickase plasmid (sc-400,138-NIC) (NIC-ERBB2), and the control double nickase plasmid (sc-437,281) (NIC-Con) were transfected into U373 EGFRvIII or SKBR3 cells using Lipofectamine 2000. Then, stable cell lines were developed with puromycin selection followed by single colony pickup. TSSC4 or ERBB2 knockout was verified by western blot.
Generation of stable cell lines expressing TSSC4 or ERBB2 plasmids
Human ERBB2 plasmid (16,257) [Citation83] was purchased from Addgene (deposited by Mien-Chie Hung). Human TSSC4 plasmid (EX-Z7596-M45) (TSSC4-(3x)HA/TSSC4) and it empty control vector (EX-NEG-M45) ((3x)HA/Vector), and HA-EGFP plasmid (EX-EGFP-M06) (3xHA-EGFP/VECTOR) were purchased from GeneCopoeia. The TSSC4 mutant (F97A-D98-C99-L100A) (TSSC4M-(3x)HA/TSSC4M) was generated by site-directed mutagenesis using the Phusion Site-Directed Mutagenesis Kit (F541) from Thermo Fisher Scientific. Amino acid replacements were confirmed by DNA sequencing and off-target mutations were not found in the open reading frame (ORF) of TSSC4. These plasmids were transfected into cells using Lipofectamine 2000 and stable cells were generated by treating cells with G418 (geneticin; Thermo Fisher Scientific, 11,811,023).
Analysis of cell death by trypan blue exclusion assay
Cell death was measured by flow cytometry as previously described [Citation76] or by counting the percentage of dead cells [Citation84] after trypan blue staining. Trypan blue is excluded from live cells but penetrates into dead cells giving a red fluorescence that can be quantified by flow cytometry. Under a microscope, live cells have a clear cytoplasm but dead cells have a blue cytoplasm following trypan blue staining.
Analysis of cell death by LDH release assay
Cell death was also measured by using the LDH assay kit (cytotoxicity) (Abcam, ab65393) as described in our previous publication [Citation33]. LDH (lactate dehydrogenase) is a stable cytosolic enzyme inside the cell, which is released into the cell growth medium upon damage of the plasma membrane due to cell death. The released LDH participates in enzymatic reactions and is measured by colorimetric assay of absorbance at 490 nm (OD490) following the manufacturer’s instructions. A high value of OD490 corresponds to a high percentage of cell death.
Measurement of tumorsphere formation
Tumorspheres were enriched by growing cells in Corning Ultra-Low Attachment 24-well plates (Fisher Scientific, 07–200-84). One thousand cells per well were seeded for the measurements of tumorsphere size, total number of tumorspheres, total number of cells in tumorspheres and cell death in tumorspheres. Four thousand cells per well were seeded for the collection of proteins in tumorspheres for western blot. The ready-to-use brain cancer stem cell serum-free undifferentiation medium (M36110-37 U) and breast cancer stem cell culture serum-free medium (M36102-29) were purchased from Celprogen.
Measurement of tumor growth in mice
All animal experiments were approved by the University of Manitoba Animal Care Committee. NOD.Cg-PrkdcscidIl2rgtm1Wjl/SzJ immunodeficient (NSG) mice (005557) [Citation1] were purchased from Jackson Laboratories and housed under specific pathogen free conditions in the Research Institute of Oncology and Hematology at Cancer Care Manitoba. Female mice 6- to 8-weeks old were anaesthetized using Isoflurane immediately prior to cancer cell injection. Cancer cells were suspended in Matrigel (50%; Avantor, CACB354234) following the protocol in the literature [Citation85,Citation86] and 1 × 10⁶ cells were injected subcutaneously into the dorsal right flank of each mouse. Volumetric measurements of palpable tumors were obtained by caliper every 2–3 days using the formula 4/3π × ([length/2] × [width/2] × [height/2]). At the humane endpoints or planned endpoints, mice were killed and tumors were isolated from mice by dissection. Then tumors were weighted, rapidly frozen in liquid nitrogen followed by grinding with a ceramic mortar and pestle on dry ice before protein lysates of tumor tissues were made in NP40 lysis buffer as described above, or fixed in 3.7% formaldehyde and embedded in paraffin for sectioning [Citation86].
Statistical analysis
All data were created by at least 3 independent triplicate experiments. Data were represented as means ± standard deviation (SD) (n ≥ 3). The Student t test with two-tailed distribution and unequal variances was performed for statistical analysis. A value of p < 0.05 is considered to be statistically significant. *p < 0.5; **p < 0.01; ***p < 0.001.
Supplemental Material
Download Zip (4.4 MB)Acknowledgments
We thank Manitoba Tumor Bank supported by the CancerCare Manitoba Foundation for performing the sectioning of tumor tissues and Andrea Fristensky for her help in sectioning the paraffin-embedded tumor tissues. We would like to thank Dr. Shujun Huang for her help in bioinformatics, Dr. Afshin Raouf for providing the MCF10A cell line, Dr. D Neil Watkins for reading the manuscript. This work was supported by a grant from CancerCare Manitoba Foundation and the NATURAL SCIENCES AND ENGINEERING RESEARCH COUNCIL of Canada (NSERC) awarded to S.B.G.
Disclosure statement
No potential conflict of interest was reported by the author(s).
Supplementary materials
Supplemental data for this article can be accessed here.
Additional information
Funding
Related Research Data
References
- Hanahan D, Weinberg RA. Hallmarks of cancer: the next generation. Cell. 2011;144(5):646–674.
- Chen Y, Klionsky DJ. The regulation of autophagy - unanswered questions. J. Cell Sci. 2011;124(Pt 2):161–170.
- Cheng Y, Ren X, Hait WN, et al. Therapeutic targeting of autophagy in disease: biology and pharmacology. Pharmacoll. Rev. 2013;65(4):1162–1197.
- Wei H, Wei S, Gan B, et al. Suppression of autophagy by FIP200 deletion inhibits mammary tumorigenesis. Genes Dev. 2011;25(14):1510–1527.
- Yang A, Rajeshkumar NV, Wang X, et al. Autophagy is critical for pancreatic tumor growth and progression in tumors with p53 alterations. Cancer Discov. 2014;4(8):905–913.
- Poillet-Perez L, Xie X, Zhan L, et al. Autophagy maintains tumour growth through circulating arginine. Nature. 2018;563(7732):569–573.
- Li Z, Tian X, Ji X, et al. ULK1-ATG13 and their mitotic phospho-regulation by CDK1 connect autophagy to cell cycle. PLoS Biol. 2020;18(6):e3000288.
- Chen Y, Henson ES, Xiao W, et al. Tyrosine kinase receptor EGFR regulates the switch in cancer cells between cell survival and cell death induced by autophagyin hypoxia. Autophagy. 2016;12(6):1029–1046.
- Lee MP, Brandenburg S, Landes GM, et al. Two novel genes in the center of the 11p15 imprinted domain escape genomic imprinting. Hum Mol Genet. 1999;8(4):683–690.
- Matsuoka S, Edwards MC, Bai C, et al. p57KIP2, a structurally distinct member of the p21CIP1 Cdk inhibitor family, is a candidate tumor suppressor gene. Genes Dev. 1995;9(6):650–662.
- Dai H, Huang Y, Li Y, et al. TSSC3 over-expression associates with growth inhibition, apoptosis induction and enhances chemotherapeutic effects in human osteosarcoma. Carcinogenesis. 2012;33(1):30–40.
- Hao Y, Crenshaw T, Moulton T, et al. Tumour-suppressor activity of H19 RNA. Nature. 1993;365(6448):764–767.
- Joyce JA, Schofield PN. Genomic imprinting and cancer. Mol Pathol. 1998;51(4):185–190.
- Prawitt D, Enklaar T, Klemm G, et al. Identification and characterization of MTR1, a novel gene with homology to melastatin (MLSN1) and the trp gene family located in the BWS-WT2 critical region on chromosome 11p15.5 and showing allele-specific expression. Hum Mol Genet. 2000;9(2):203–216.
- Nature (https://www.nature.com/). Nature research. 2021. Available from: https://www.nature.com/subjects/cell-growth#~text=Cell%20growth%20usually%20refers%20to,the%20absence%20of%20cell%20division.
- Musgrove EA, Caldon CE, Barraclough J, et al. Cyclin D as a therapeutic target in cancer. Nat Rev Cancer. 2011;11(8):558–572.
- Juríková M, Danihel Ľ, Polák Š, et al. Ki67, PCNA, and MCM proteins: markers of proliferation in the diagnosis of breast cancer. Acta Histochem. 2016;118(5):544–552.
- Karakuş F, Eyol E, Yılmaz K, et al. Inhibition of cell proliferation, migration and colony formation of LS174T Cells by carbonic anhydrase inhibitor. Afr Health Sci. 2018;18(4):1303–1310.
- Luo X, Shen S, Yi S, et al. Screening of differentially expressed miRNAs in tensile strain treated HepG2 cells by miRNA microarray analysis. Mol Med Rep. 2020;21(6):2415–2426.
- Guo JY, White E. Autophagy, Metabolism, and Cancer. Cold Spring Harb Symp Quant Biol. 2016;81:73–78.
- Yoshii SR, Mizushima N. Monitoring and measuring autophagy. Int J Mol Sci. 2017;18(9):1865.
- Mizushima N, Yoshimori T, Levine B. Methods in mammalian autophagy research. Cell. 2010;140(3):313–326.
- Birgisdottir ÅB, Lamark T, Johansen T. The LIR motif - crucial for selective autophagy. J Cell Sci. 2013;126(Pt 15):3237–3247.
- Wild P, McEwan DG, Dikic I. The LC3 interactome at a glance. J Cell Sci. 2014;127(Pt 1):3–9.
- Chen Y, Wang R, Huang S, et al. Erb-b2 Receptor Tyrosine Kinase 2 (ERBB2) Promotes ATG12-Dependent Autophagy Contributing to Treatment Resistance of Breast Cancer Cells. Cancers (Basel). 2021;13(5):1038.
- Kirkin V, Lamark T, Sou YS, et al. A role for NBR1 in autophagosomal degradation of ubiquitinated substrates. Mol Cell. 2009;33(4):505–516.
- Nollet EA, Cardo-Vila M, Ganguly SS, et al. Androgen receptor-induced integrin α6β1 and Bnip3 promote survival and resistance to PI3K inhibitors in castration-resistant prostate cancer. Oncogene. 2020;39(31):5390–5404.
- Jones RG, Thompson CB. Tumor suppressors and cell metabolism: a recipe for cancer growth. Genes Dev. 2009;23(5):537–548.
- Senga SS, Grose RP. Hallmarks of cancer-the new testament. Open Biol. 2021;11(1):200358.
- Hsu JL, Hung MC. The role of HER2, EGFR, and other receptor tyrosine kinases in breast cancer. Cancer Metastasis Rev. 2016;35(4):575–588.
- Keller S, Schmidt MHH. EGFR and EGFRvIII promote angiogenesis and cell invasion in glioblastoma: combination Therapies for an Effective Treatment. Int J Mol Sci. 2017;18(6):1295.
- Elstrom RL, Bauer DE, Buzzai M, et al. Akt stimulates aerobic glycolysis in cancer cells. Cancer Res. 2004;64(11):3892–3899.
- Ma S, Henson ES, Chen Y, et al. Ferroptosis is induced following siramesine and lapatinib treatment of breast cancer cells. Cell Death Dis. 2016;7(7):e2307.
- Jiang B. Aerobic glycolysis and high level of lactate in cancer metabolism and microenvironment. Genes Dis. 2017;4(1):25–27.
- Sonveaux P, Végran F, Schroeder T, et al. Targeting lactate-fueled respiration selectively kills hypoxic tumor cells in mice. J Clin Invest. 2008;118(12):3930–3942.
- Heinecke JL, Ridnour LA, Cheng RY, et al. Tumor microenvironment-based feed-forward regulation of NOS2 in breast cancer progression. Proc Natl Acad Sci U S A. 2014;111(17):6323–6328.
- Lee SY, Ju MK, Jeon HM, et al. Regulation of tumor progression y programmed necrosis. Oxid Med Cell Longev. 2018;2018:3537471.
- Tang MC, Wu MY, Hwang MH, et al. Chloroquine enhances gefitinib cytotoxicity in gefitinib-resistant non small cell lung cancer cells. Plos One. 2015;1093(3):e0119135.
- Zhang J, Mao S, Wang L, et al. MicroRNA 154 functions as a tumor suppressor in bladder cancer by directly targeting ATG7. Oncol Rep. 2019;41(2):819–828.
- White E, DiPaola RS. The double-edged sword of autophagy modulation in cancer. Clin Cancer Res. 2009;15(17):5308–5316.
- Clarke PG, Puyal J. Autophagic cell death exists. Autophagy. 2012;8(6):867–869.
- Chen Y, McMillan-Ward E, Kong J, et al. Mitochondrial electron-transport-chain inhibitors of complexes I and II induce autophagic cell death mediated by reactive oxygen species. J Cell Sci. 2007;120(Pt 23):4155–4166.
- Chen Y, McMillan-Ward E, Kong J, et al. Oxidative stress induces autophagic cell death independent of apoptosis in transformed and cancer cells. Cell Death Differ. 2008;15(1):171–182.
- Azad MB, Chen Y, Henson ES, et al. Hypoxia induces autophagic cell death in apoptosis-competent cells through a mechanism involving BNIP3. Autophagy. 2008;4(2):195–204.
- Dey P, Kundu A, Sachan R, et al. PKM2 knockdown induces autophagic cell death via AKT/mTOR pathway in human prostate cancer cells. Cell Physiol Biochem. 2019;52(6):1535–1552.
- Chen P, Huang HP, Wang Y, et al. Curcumin overcome primary gefitinib resistance in non-small-cell lung cancer cells through inducing autophagy-related cell death. J Exp Clin Cancer Res. 2019;38(1):254.
- Wu B, Tan M, Cai W, et al. Arsenic trioxide induces autophagic cell death in osteosarcoma cells via the ROS-TFEB signaling pathway. Biochem. Biophys. Res. Commun. 2018;496(1):167–175.
- Kanzawa T, Zhang L, Xiao L, et al. Arsenic trioxide induces autophagic cell death in malignant glioma cells by upregulation of mitochondrial cell death protein BNIP3. Oncogene. 2005;24(6):980–991.
- Chen YJ, Chi CW, Su WC, et al. Lapatinib induces autophagic cell death and inhibits growth of human hepatocellular carninoma. Oncotarget. 2014;5(13):4845–4854.
- He C, Levine B. The Beclin 1 interactome. Curr Opin Cell Biol. 2010;22(2):140–149.
- Liang C. Negative regulation of autophagy. Cell Death Differ. 2010;17(12):1807–1815.
- Sarkar S. Regulation of autophagy by mTOR-dependent and mTOR-independentpathways: autophagy dysfunction in neurodegenerative diseases and therapeutic application of autophagy enhancers. Biochem Soc Trans. 2013;41(5):1103–1130.
- Liang XH, Kleeman LK, Jiang HH, et al. Protection against fatal Sindbis virus encephalitis by beclin, a novel Bcl-2-interacting protein. J Virol. 1998;72(11):8586–8596.
- Ganley IG, Lam Du H, Wang J, et al. ULK1.ATG13.FIP200 complex mediates mROR signaling and is essential for autophagy. J. Biol. Chem. 2009;284(18):12297–12305.
- Hosokawa N, Hara T, Kaizuka T, et al. Nutrient-dependent mTORC1 association with the ULK1-Atg13-FIP200 complex required for autophagy. Mol Biol Cell. 2009;20(7):1981–1991.
- Jung CH, Jun CB, Ro SH, et al. ULK-Atg13-FIP200 complexes mediate mTOR signaling to the autophagy machinery. Mol Biol Cell. 2009;20(7):1992–2003.
- Egan DF, Shackelford DB, Mihaylova MM, et al. Phosphorylation of ULK1 (hATG1) by AMP-activated protein kinase connects energy sensing to mitophagy. Science. 2011;331(6016):456–461.
- Kim J, Kundu M, Viollet B, et al. AMPK and mTOR regulate autophagy through direct phosphorylation of Ulk1. Nat Cell Biol. 2011;13(2):132–141.
- Wang Z. ErbB receptors and cancer. Methods Mol Biol. 2017;1652:3–35.
- Iqbal N, Iqbal N. Human epidermal growth factor receptor 2 (HER2) in cancers: overexpression and therapeutic implications. Mol. Biol. Int. 2014;2014:852748.
- Janser FA, Tschan MP, Langer R. The role of autophagy in HER2-targeted therapy. Swiss Med Wkly. 2019;149:w20138.
- Yu D, Hung MC. Overexpression of ErbB2 in cancer and ErbB2-targeting strategies. Oncogene. 2000;19(53):6115–6121.
- Yan M, Schwaederle M, Arguello D, et al. HER2 expression status in diverse cancers: review of results from 37,992 patients. Cancer Metastasis Rev. 2015;34(1):157–164.
- Thomas R, Weihua Z. Rethink of EGFR in cancer with its kinase independent function on board. Front Oncol. 2019;9:800.
- Gan HK, Cvrljevic AN, Johns TG. The epidermal growth factor receptor variant III (EGFRvIII): where wild things are altered. FEBS J. 2013;280(21):5350–5370.
- Zhang X, Chang A. Molecular predictors of EGFR-TKI sensitivity in advanced non-small cell lung cancer. Int J Med Sci. 2008;5(4):209–217.
- Wee P, Wang Z. Epidermal growth factor receptor cell proliferation signaling pathways. Cancers (Basel). 2017;9(5):52.
- Han J, Hou W, Lu C, et al. Interaction between Her2 and Beclin-1 proteins underlies a new mechanism of reciprocal regulation. J Biol Chem. 2013;288(28):20315–20325.
- Wei Y, Zou Z, Becker N, et al. EGFR-mediated Beclin 1 phosphorylation in autophagy suppression, tumor progression, and tumor chemoresistance. Cell. 2013;154(6):1269–1284.
- Jutten B, Keulers TG, Peeters HJM, et al. EGFRvIII expression triggers a metabolic dependency and therapeutic vulnerability sensitive to autophagy inhibition. Autophagy. 2018;14(2):283–295.
- Fernández-Medarde A, Santos E. Ras in cancer and developmental diseases. Genes Cancer. 2011;2(3):344–358.
- Gimple RC, Wang X. RAS: striking at the core of the oncogenic circuitry. Front Oncol. 2019;9:965.
- Schmukler E, Kloog Y, Pinkas-Kramarski R. Ras and autophagy in cancer development and therapy. Oncotarget. 2014;5(3):577–586.
- Chen H, Liu H, Qing G. Targeting oncogenic Myc as a strategy for cancer treatment. Signal Transduct Target Ther. 2018;3(1):5.
- Stine ZE, Walton ZE, Altman BJ, et al. MYC, metabolism, andcancer. Cancer Discov. 2015;5(10):1024–1039.
- Chen Y, Azad MB, Gibson SB. Superoxide is the major reactive oxygen species regulating autophagy. Cell Death Differ. 2009;16(7):1040–1052.
- Kothari S, Cizeau J, McMillan-Ward E, et al. BNIP3 plays a role in hypoxic cell death in human epithelial cells that is inhibited by growth factors EGF and IGF. Oncogene. 2003;22(30):4734–4744.
- Taylor SC, Berkelman T, Yadav G, et al. A defined methodology for reliable quantification of Western blot data. Mol Biotechnol. 2013;55(3):217–226.
- Zhang S, Yang Z, Bao W, et al. SNX10 (sorting nexin 10) inhibits colorectal cancer initiation and progression by controlling autophagic degradation of SRC. Autophagy. 2020;16(4):735–749.
- Franken NA, Rodermond HM, Stap J, et al. Clonogenic assay of cells in vitro. Nat Protoc. 2006;1(5):2315–2319.
- Burton TR, Henson ES, Azad MB, et al. BNIP3 acts as transcriptional repressor of death receptor-5 expression and prevents TRAIL-induced cell death in gliomas. Cell Death Dis. 2013;4(4):e587.
- Campbell RE, Tour O, Palmer AE, et al. A monomeric red fluorescent protein. Proc Natl Acad Sci U S A. 2002;99(12):7877–7882.
- Li YM, Pan Y, Wei Y, et al. Upregulation of CXCR4 is essential for HER2-mediated tumor metastasis. Cancer Cell. 2004;6(5):459–469.
- Strober W. Trypan blue exclusion test of cell viability. Curr Protoc Immunol. 2015;111(1):A3.B.1–A3.B.3.
- Reuter J. Subcutaneous injection of tumor cells. Bio-101. 2011;e166.
- Chen Y, Wei H, Liu F, et al. Hyperactivation of mammalian target of rapamycin complex 1 (mTORC1) promotes breast cancer progression through enhancing glucose starvation-induced autophagy and Akt signaling. J Biol Chem. 2014;289(2):1164–1173.