
ABSTRACT
Dysregulation of macroautophagy/autophagy contributes to the delay of wound healing in diabetic skin. N6-methyladenosine (m6A) RNA modification is known to play a critical role in regulating autophagy. In this study, it was found that SQSTM1/p62 (sequestosome 1), an autophagy receptor, was significantly downregulated in two human keratinocyte cells lines with short-term high-glucose treatment, as well as in the epidermis of diabetic patients and a db/db mouse model with long-term hyperglycemia. Knockdown of SQSTM1 led to the impairment of autophagic flux, which was consistent with the results of high-glucose treatment in keratinocytes. Moreover, the m6A reader protein YTHDC1 (YTH domain containing 1), which interacted with SQSTM1 mRNA, was downregulated in keratinocytes under both the acute and chronic effects of hyperglycemia. Knockdown of YTHDC1 affected biological functions of keratinocytes, which included increased apoptosis rates and impaired wound-healing capacity. In addition, knockdown of endogenous YTHDC1 resulted in a blockade of autophagic flux in keratinocytes, while overexpression of YTHDC1 rescued the blockade of autophagic flux induced by high glucose. In vivo, knockdown of endogenous Ythdc1 or Sqstm1 inhibited autophagy in the epidermis and delayed wound healing. Interestingly, we found that a decrease of YTHDC1 drove SQSTM1 mRNA degradation in the nucleus. Furthermore, the results revealed that YTHDC1 interacted and cooperated with ELAVL1/HuR (ELAV like RNA binding protein 1) in modulating the expression of SQSTM1. Collectively, this study uncovered a previously unrecognized function for YTHDC1 in modulating autophagy via regulating the stability of SQSTM1 nuclear mRNA in diabetic keratinocytes.
Abbreviations: ACTB: actin beta; AGEs: glycation end products; AL: autolysosome; AP: autophagosome; ATG: autophagy related; AKT: AKT serine/threonine kinase; ANOVA: analysis of variance; BECN1: beclin 1; Co-IP: co-immunoprecipitation; DEGs: differentially expressed genes; DM: diabetes mellitus; ELAVL1: ELAV like RNA binding protein 1; FTO: FTO alpha-ketoglutarate dependent dioxygenase; G: glucose; HaCaT: human keratinocyte; GO: Gene Ontology; GSEA: Gene Set Enrichment Analysis; HE: hematoxylin-eosin; IHC: immunohistochemical; IRS: immunoreactive score; KEAP1: kelch like ECH associated protein 1; KEGG: Kyoto Encyclopedia of Genes and Genomes; m6A: N6-methyladenosine; M: mannitol; MANOVA: multivariate analysis of variance; MAP1LC3: microtubule associated protein 1 light chain 3; MAP1LC3B: microtubule associated protein 1 light chain 3 beta; MeRIP: methylated RNA immunoprecipitation; METTL3: methyltransferase 3, N6-adenosine-methytransferase complex catalytic subunit; MTOR: mechanistic target of rapamycin kinase; MTORC1: mechanistic target of rapamycin complex 1; NBR1: NBR1 autophagy cargo receptor; NFE2L2: nuclear factor, erythroid 2 like 2; NG: normal glucose; NHEK: normal human epithelial keratinocyte; OE: overexpressing; p-: phospho-; PI: propidium iodide; PPIN: Protein-Protein Interaction Network; RBPs: RNA binding proteins; RIP: RNA immunoprecipitation; RNA-seq: RNA-sequence; RNU6–1: RNA, U6 small nuclear 1; ROS: reactive oxygen species; siRNAs: small interfering RNAs; SQSTM1: sequestosome 1; SRSF: serine and arginine rich splicing factor; T2DM: type 2 diabetes mellitus; TEM: transmission electron microscopy; TUBB: tubulin beta class I; WT: wild-type; YTHDC1: YTH domain containing 1.
Introduction
Diabetes is a severe threat to global public health, bringing with it risks for serious to life-threatening complications. Diabetic foot, with a global prevalence of 6.3% [Citation1], is one of the severe and chronic complications of diabetes. It has been estimated that a lower limb is lost to amputation every 30 seconds as a consequence of diabetic foot complications [Citation2]. It is known that diabetic foot displays significant delays in wound healing. To reduce the risks to diabetic patients, and also to ease the economic impact to society, promoting wound healing in diabetic foot is an important area of focus. Exploring the mechanism of diabetic foot non-healing can help find more effective treatments to promote wound healing.
The epidermis plays a key role in skin wound healing. In the proliferative phase of skin wound healing, cells from the epidermis start proliferating and migrate into the wound bed to close the wound [Citation3]. However, a previous related study found that the epidermis of skin tissue from diabetic patients was significantly thinner than that from control subjects [Citation4]. Epidermis thinning may be a critical factor in the delay of diabetic wound healing. Keratinocytes are the main components of the epidermis. In diabetic wounds, keratinocytes are characterized by decreased proliferation and impaired migration [Citation5]. Impaired physiologic functions of keratinocytes induced by a high-glucose environment contribute to the delayed healing of diabetic wounds [Citation6]. Previous studies have demonstrated the acute and chronic effects of hyperglycemia on the development of impaired diabetic wound healing. As an acute effect of hyperglycemia, short-term (24 h or 72 h) stimulation of keratinocytes with mid-high glucose (12 mM) or high glucose (25 mM) containing medium hampered the migration ability of cells [Citation7]. Furthermore, impaired epidermal functions such as decreased epidermal lipid synthesis and antimicrobial peptide expression, factors that may contribute to the delayed wound healing, have been observed in a spontaneous type 2 diabetes mellitus (T2DM) rat model (Otsuka Long-Evans Tokushima Fatty rats) with chronic hyperglycemia [Citation8].
SQSTM1 is a multifunctional protein that plays critical roles in a number of cellular functions, including macroautophagy/autophagy and apoptosis [Citation9,Citation10]. Serving as a pivotal signaling hub, SQSTM1 mediates the activation of MTOR (mechanistic target of rapamycin kinase) complex 1 (MTORC1), the KEAP1 (kelch like ECH associated protein 1)-NFE2L2 (nuclear factor, erythroid 2 like 2) pathway, and selective autophagy [Citation11]. Due to the crucial role of SQSTM1 in cellular functions, SQSTM1 participates in multiple metabolic diseases, such as T2DM, obesity, and nonalcoholic fatty liver disease. It has been suggested that SQSTM1 is involved in diabetic complications, and this may occur through autophagy [Citation12]. However, the role of SQSTM1 in diabetic skin remains unclear.
During the process of autophagy, SQSTM1 is a vital protein marker that serves as a selective autophagy receptor [Citation13]. It acts as a link between MAP1LC3/LC3 (microtubule associated protein 1 light chain 3) and ubiquitinated substrates. Autophagy is an essential cellular process that plays a pivotal role in regulating cellular balance and physiology. Dysregulation of autophagy contributes to the pathogenesis of skin diseases, as well as delays in wound healing [Citation14]. It has been reported that the high-glucose environment of diabetes causes dysregulation of autophagy [Citation15,Citation16]. A previous study proved that high glucose inhibits autophagy of keratinocytes, which delays diabetic wound healing [Citation17]. A recent study found that autophagy deficiency in keratinocytes inhibits wound closure in vivo [Citation18]. Besides, augmentation of autophagy has been shown to play a protective role in burn wounds in rats [Citation19]. However, the mechanism by which autophagy dysregulation affects wound healing has not yet been clarified. Notably, previous studies have shown that autophagy can be induced by osmotic stress such as 0.8 M (800 mM) sucrose or 0.4 M (400 mM) NaCl in mouse embryonic fibroblasts or the human T24 cell line [Citation20]. Osmotic stress induced by high concentrations of mannitol (mannitol = 50 mM), but not lower concentrations (mannitol = 25 mM), has also been shown to increase the MAP1LC3/LC3-I to MAP1LC3/LC3-II conversion in the human colon tumor cell line HCT116 and in human cervical cancer cell line HeLa cells [Citation21]. Whether metabolic or osmotic effects induced by hyperglycemia play a critical role in the pathophysiology of wound healing and the dysregulated autophagy in diabetic skin remains undetermined.
Nevertheless, it has been proven that high glucose inhibits autophagy of keratinocytes, which delays diabetic wound healing [Citation17]. A recent study found that autophagy deficiency in keratinocytes inhibits wound closure in vivo [Citation18]. Besides, augmentation of autophagy plays a protective role in burn wounds in rats [Citation19]. Long-term hyperglycemia induced elevated production of reactive oxygen species (ROS) and increased formation of glycation end products (AGEs) [Citation22], leading to a compounded interaction with autophagy [Citation23] and contributing to the impaired function of keratinocytes [Citation24,Citation25]. However, the mechanism by which autophagy dysregulation affects wound healing has not yet been clarified. Generally, the expression level of SQSTM1 is regulated by autophagy. Upregulation of SQSTM1 results from inhibition of autophagy, while downregulation of SQSTM1 results from activation of autophagy [Citation26]. In turn, autophagy could also be modulated by the regulation of SQSTM1. SQSTM1 binds to arginylated substrates and induces autophagy [Citation27,Citation28]. Depletion of SQSTM1 inhibits MAP1LC3/LC3 recruitment to autophagosomes and impedes autophagosome formation in HeLa cells [Citation29]. Whether SQSTM1 contributes to the dysregulation of autophagy in diabetic skin wound healing remains unknown. Understanding the mechanism of modulating of autophagy in keratinocytes is key to finding new therapeutic targets for wound healing of diabetic skin.
m6A is the most common modification found in transcripts. m6A affects a large part of RNA metabolism such as splicing, stability, translation of mRNA, and maturation of miRNA [Citation30]. Emerging evidence suggests that m6A modification affects cell death and survival, including cell apoptosis and autophagy [Citation31]. It has been reported that m6A writer METTL3 (methyltransferase 3, N6-adenosine-methytransferase complex catalytic subunit) and eraser ALKBH5 (alkB homolog 5, RNA demethylase) regulate autophagy via m6A modification of TFEB mRNA in hypoxia/reoxygenation-treated cardiomyocytes [Citation32]. Another m6A eraser, FTO (FTO alpha-ketoglutarate dependent dioxygenase), plays a critical role in regulating autophagy and adipogenesis through targeting Atg5 (autophagy related 5) and Atg7 (autophagy related 7) in preadipocytes [Citation33]. Moreover, FTO and m6A reader YTHDF2 (YTH N6-methyladenosine RNA binding protein 2) regulate autophagy by targeting autophagic genes [Citation34]. In Leydig cells, m6A modification reduces testosterone synthesis through the regulation of autophagy [Citation35]. However, the relationship between m6A and autophagy still needs further investigation. In peripheral blood samples from T2DM patients and diabetic rats, m6A contents were found to be lower than those from the control groups [Citation36]. Therefore, in the current study it was hypothesized that m6A might play a role in regulating autophagy in keratinocytes of diabetic skin.
In this study, RNA-sequence (RNA-seq) analysis found that SQSTM1 mRNA was downregulated in high-glucose-treated keratinocytes. Knockdown of SQSTM1 led to impairment of autophagic flux and inhibition of the KEAP1-NFE2L2 pathway. It was determined that m6A levels was decreased in the keratinocytes treated with high glucose compared with the mannitol group. Moreover, the m6A reader protein YTHDC1, which interacts with SQSTM1 mRNA, was decreased in the keratinocytes treated with high glucose, as well as in the epidermis of both diabetic patients and db/db mice. Knockdown of YTHDC1 resulted in a blockade of autophagic flux and significantly affected the biological functions of keratinocytes, whereas the downregulation of SQSTM1 and blockade of autophagic flux could be reversed by YTHDC1 overexpression. In vivo, knockdown of endogenous Ythdc1 or Sqstm1 resulted in the inhibition of autophagy and delays in wound healing. Interestingly, knockdown of YTHDC1 drove SQSTM1 mRNA degradation in the nucleus, while not affecting SQSTM1 mRNA stability in cytoplasm. The results showed that YTHDC1 interacted and cooperated with ELAVL1 in the regulation of SQSTM1 expression. Overall, this study revealed a novel role of YTHDC1 in modulating autophagy via regulating the stability of SQSTM1 nuclear mRNA.
Results
SQSTM1 was a crucial gene in high-glucose-treated HaCaT cells
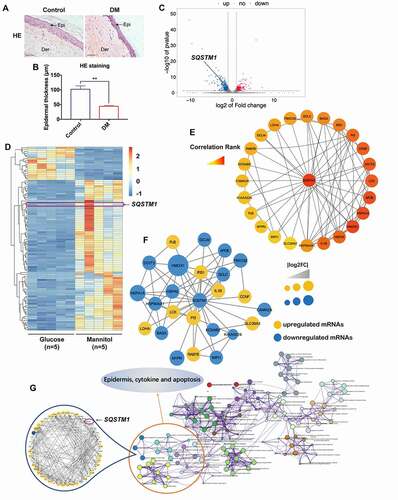
In a recent related study, it was first confirmed that the epidermis of skin tissues from diabetic patients was significantly thinner than that from the control group (). In order to find the mechanism of epidermis thinning in diabetic skin, high glucose was used as a treatment on a human keratinocyte cell line (HaCaT cells) in the study. Taking into consideration that high concentrations of glucose could introduce additional hyperosmotic stress to the cells, mannitol was used as an osmotic control to high glucose. mRNA profiles of HaCaT cells treated with high glucose (30 mM) or mannitol (30 mM: 5.6 mM of glucose + 24.4 mM of mannitol) for 48 h were generated by RNA-seq using Illumina Novaseq™ 6000. A volcano plot and heat map were generated with the results (). A total of 369 upregulated mRNAs and 550 downregulated mRNAs were profiled (log2 FC > 1, FDR < 0.05). Gene Ontology (GO) and Kyoto Encyclopedia of Genes and Genomes (KEGG) pathway analyses were performed on the differentially expressed genes (DEGs). The top 20 significant GO and KEGG terms using the Metascape Database (http://metascape.org/gp/index.html#/main/step1) [Citation37] are shown in Figure S1A, and the top 15 significant GO terms and KEGG pathways are displayed in Figure S1B. Additionally, Gene Set Enrichment Analysis (GSEA) showed that four important KEGG pathways, systemic lupus erythematosus, graft versus host disease, asthma, and leishmania infection, were enriched in high-glucose-treated HaCaT cells (Figure S1C). To pinpoint the crucial gene in these differentially expressed genes, several analyses were conducted. The DEGs were analyzed with the cyto-Hubba plug-in of Cytoscape software, which found that SQSTM1 was a potential key target gene with a high correlation rank for regulating other important genes in high-glucose-treated HaCaT cells (). Moreover, Protein-Protein Interaction Network (PPIN) data from the STRING database (https://string-db.org/cgi/input.pl) [Citation38] was analyzed using the MCODE algorithm with high-glucose-induced DEGs. As shown in , the highest scored gene module including SQSTM1 was obtained. Additionally, a part of the visible pathway that tightly correlated with the epidermis, cytokines, and apoptosis from the KEGG pathway network was illustrated by analyzing the Metascape database (). After submitting the enriched genes to the STRING database, 48 PPI nodes were obtained with a confidence threshold greater than 0.4, and SQSTM1 was found to be one of the PPI nodes that was closely associated with the others. Overall, the RNA-seq analysis results suggested that the differential expression of SQSTM1 in high-glucose-treated HaCaT cells may play a crucial role in hyperglycemia-induced effects on epidermal keratinocytes.
Figure 1. SQSTM1 was a crucial gene in high-glucose-treated keratinocytes. (A and B) representative HE staining of the diabetic skin tissues (DM) and the control (control). Scale bar: 100 μm. Epidermal thicknesses were analyzed. The data are presented as the mean ± s.d. and analyzed by student’s t-test (n = 3 per group). **P < 0.01. (C) Volcano plot revealed 369 upregulated genes and 550 downregulated genes in HaCaT cells treated with high glucose (30 mM) or mannitol (osmotic control) for 48 h (n = 5). The green dot indicates the position of SQSTM1. (D) heat map showed differentially expressed genes in HaCaT cells treated with mannitol or glucose. (E) the cytoHubba plug-in of cytoscape software was used to find the potential key target in HaCaT cells treated with high glucose. (F) PPIN showed interactions between SQSTM1 and other differentially expressed genes in the cluster. (G) the genes enriched in the pathway of epidermis, cytokines and apoptosis were selected to construct the PPI network based on the STRING database for modules with a threshold value>0.4.
High glucose induced downregulation of SQSTM1 and inhibition of autophagy in keratinocytes
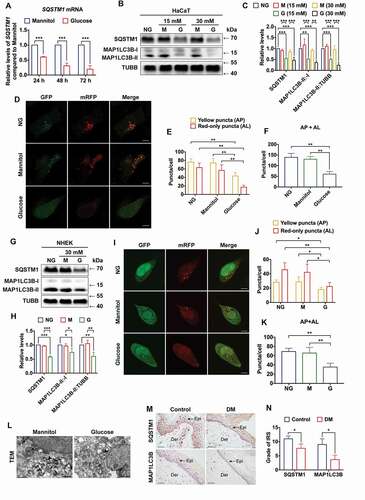
To verify the results of RNA-seq, the expression level of SQSTM1 mRNA was examined in high-glucose-treated HaCaT cells. As shown in , SQSTM1 mRNA was downregulated in a time-dependent manner. Because SQSTM1 plays a critical role in the regulation of selective autophagy, the effect of high glucose on autophagy in HaCaT cells was examined next. To ascertain the osmotic and metabolic effects of high glucose on the expression levels of SQSTM1 and MAP1LC3B/LC3B, the most commonly analyzed isoform of MAP1LC3/LC3, HaCaT cells were treated with normal glucose (NG) and different concentrations of glucose and osmotic control (mannitol). It was shown that hyperosmotic stress had no detectable effect on the expression level of SQSTM1, the MAP1LC3B/LC3B-II:-I ratio, or the MAP1LC3B/LC3B-II:TUBB (tubulin beta class I) ratio. In contrast, short-term high-glucose treatment resulted in significant decreases of SQSTM1 expression level, the MAP1LC3B/LC3B-II:-I ratio, and the MAP1LC3B/LC3B-II:TUBB ratio (). In addition to the expression levels of SQSTM1 and MAP1LC3B/LC3B, AKT (AKT serine/threonine kinase) and MTOR (mechanistic target of rapamycin kinase) signaling pathway were also measured in high-glucose-treated HaCaT cells. The results showed that the AKT-MTOR pathway, which suppresses autophagy, was activated in short-term high-glucose-stimulated HaCaT cells, compared with the mannitol (osmotic control) group (Figure S2A-C). Next, the autophagic flux was measured with the transfection of tandem mRFP-GFP-MAP1LC3B/LC3B. As expected, there were fewer autophagosomes and autolysosomes in HaCaT cells treated with short-term high glucose, compared with the normal glucose and the osmotic control, suggesting that the autophagic flux was impaired in high-glucose-treated HaCaT cells (). To further confirm these findings, the expression levels of SQSTM1, MAP1LC3B/LC3B, and the autophagic flux were measured in an additional keratinocyte cell line, normal human epithelial keratinocytes (NHEK). Consistent with the results in HaCaT cells, the expression levels of SQSTM1, as well as the MAP1LC3B/LC3B-II:-I ratio and the MAP1LC3B/LC3B-II:TUBB ratio, were all reduced in short-term high-glucose-treated NHEK as compared with the normal-glucose group and the mannitol group (). Autophagic flux was also reduced in the NHEK cells only after high-glucose treatment but remained unaltered in the normal-glucose group and the mannitol group (). Taking the above results into consideration, transmission electron microscopy (TEM) was conducted to further monitor levels of autophagy. It was found that the autophagic activity in HaCaT cells was significantly inhibited under the chronic effects of hyperglycemia (). Moreover, to investigate the long-term effects of hyperglycemia on autophagy, the expression levels of SQSTM1 and MAP1LC3B/LC3B were examined in both the diabetic and non-diabetic human skin samples by immunohistochemical (IHC) staining. In accordance with the results in HaCaT cells and NHEK cells, reduced expression of both SQSTM1 and MAP1LC3B/LC3B was found in the epidermis of diabetic skin (). Taken together, these results indicated that both short-term and long-term hyperglycemia induced decreased expression levels of SQSTM1 and inhibition of autophagy in keratinocytes.
Figure 2. High glucose induced downregulation of SQSTM1 and impairment of autophagic flux in keratinocytes. (A) RT-qPCR analysis of SQSTM1 mRNA expression levels in HaCaT cells treated with high glucose (30 mM of glucose) or mannitol (5.6 mM of glucose + 24.4 mM of mannitol) for 24, 48, and 72 h (n = 3 independent experiments). ACTB (actin beta) was used as an internal control. (B and C) western blot analysis of SQSTM1, MAP1LC3B/LC3B-I, MAP1LC3B/LC3B-II) expression levels in HaCaT cells treated with NG (normal glucose: 5.6 mM of glucose), G (mid-high glucose: 15 mM of glucose; high glucose: 30 mM of glucose), or M (15 mM: 5.6 mM of glucose + 9.4 mM of mannitol; 30 mM: 5.6 mM of glucose + 24.4 mM of mannitol) for 72 h. Quantification results of SQSTM1 protein expression, MAP1LC3B/LC3B-II:-I ratio and MAP1LC3B/LC3B-II:TUBB ratio levels are shown (n = 3 independent experiments). (D, E and F) the HaCaT cells were infected with adenovirus harboring tandem fluorescent mRFP-GFP-MAP1LC3B/LC3B for 24 h, followed by treatment with NG, high glucose (30 mM), or mannitol (osmotic control) for an additional 72 h. Representative images of the HaCaT cells expressing mRFP-GFP-MAP1LC3B/LC3B are shown. Green: GFP puncta, red: mRFP puncta, scale bar: 10 μm. Semi-quantitative analysis of autophagosomes (AP, yellow puncta in merged images) and autolysosomes (AL, red-only puncta in merged images) in high-glucose-treated HaCaT cells. n = 10 randomly selected fields/conditions from 3 independent experiments. (G and H) western blot analysis of SQSTM1, MAP1LC3B/LC3B-I, MAP1LC3B/LC3B-II expression levels in the NHEK cells treated with NG (normal glucose: 5.6 mM of glucose), G (high glucose: 30 mM of glucose), or M (mannitol osmotic control: 30 mM = 5.6 mM of glucose + 24.4 mM of mannitol). Quantification results of SQSTM1 protein expression, MAP1LC3B/LC3B-II:-I ratio and MAP1LC3B/LC3B-II:TUBB ratio levels are shown (n = 3 independent experiments). (I, J and K) the NHEK cells were infected with adenovirus harboring tandem fluorescent mRFP-GFP-MAP1LC3B/LC3B for 24 h, followed by treatment with NG, high glucose (30 mM) or mannitol (osmotic control) for an additional 72 h. Representative images of the NHEK cells expressing mRFP-GFP-MAP1LC3B/LC3B are shown. Green: GFP puncta, red: mRFP puncta, scale bar: 10 μm. Semi-quantitative analysis of autophagosomes (AP, yellow puncta in merged images) and autolysosomes (AL, red-only puncta in merged images) in high-glucose-treated NHEK. n = 10 randomly selected fields/condition from 3 independent experiments. (L) TEM analysis of HaCaT cells treated with high glucose (30 mM) or mannitol (osmotic control) for 72 h. Arrow heads indicate autophagosomes. Arrows indicate autolysosomes and/or lysosomes. Scale bar: 1.0 μm. (M, N) IHC analysis of SQSTM1 and MAP1LC3B/LC3B in skin tissues of diabetic patients and the control group. Scale bar: 100 μm. Quantitative analysis of SQSTM1 and MAP1LC3B/LC3B protein (brown color) levels in the epidermis was performed according to the IRS (n = 3). The data were presented as mean ± s.d. and analyzed by Student’s t-test (A and N), or one-way ANOVA with Fisher’s LSD post hoc analysis (C, F, H and K), or one-way MANOVA with Fisher’s LSD post hoc analysis (E and J). *P < 0.05, **P < 0.01, ***P < 0.001.
Decrease of SQSTM1 blocked autophagic flux in HaCaT cells
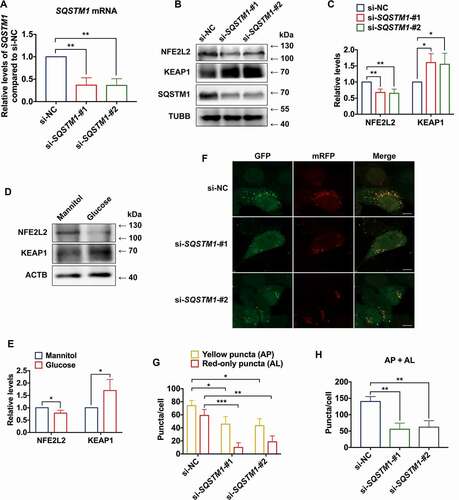
To investigate the role of SQSTM1 in autophagy, small interfering RNAs (siRNAs) were used to knock down SQSTM1 in HaCaT cells. First, the knockdown efficiency of siRNAs was verified (). Selective autophagy and the KEAP1-NFE2L2 system are two major stress response pathways which are coupled via SQSTM1 [Citation11]. A previous study found that depletion of SQSTM1 results in an increase of KEAP1 protein levels and a concomitant decrease of NFE2L2 protein levels [Citation39]. Moreover, knockout of NFE2L2 was shown to reduce expression of autophagic genes in a mouse model [Citation40]. Thus, the current study explored the effect of SQSTM1 on the KEAP1-NFE2L2 pathway in HaCaT cells. Upon knockdown of SQSTM1, the level of KEAP1 protein was found to be upregulated, while the level of NFE2L2 protein was downregulated compared to the control (). Moreover, consistent results of KEAP1 and NFE2L2 protein levels in high-glucose-treated HaCaT cells were obtained (). Furthermore, knockdown of SQSTM1 resulted in inhibition of autophagosome formation and impairment of autophagic flux (). These data implied that SQSTM1 was a critical gene playing regulatory roles in autophagy.
Figure 3. Decrease of SQSTM1 blocked autophagic flux in keratinocytes. (A) RT-qPCR analysis of SQSTM1 mRNA expression levels in control and SQSTM1 knockdown HaCaT cells (n = 3 independent experiments). (B, C) western blot analysis of SQSTM1, KEAP1, and NFE2L2 expression levels in control and SQSTM1 knockdown HaCaT cells. Quantification results of protein expression are shown (n = 3 independent experiments). (D, E) western blot analysis of KEAP1 and NFE2L2 expression levels in HaCaT cells treated with high glucose (30 mM) or mannitol (osmotic control) for 72 h. Quantification results of protein expression are shown (n = 3 independent experiments). (F, G, and H) the HaCaT cells were infected with adenovirus harboring tandem fluorescent mRFP-GFP-MAP1LC3B/LC3B for 24 h, followed by transfection with siRNAs in normal-glucose culture medium. Representative images of the HaCaT cells expressing mRFP-GFP-MAP1LC3B/LC3B are shown. Green: GFP puncta, red: mRFP puncta, scale bar: 10 μm. Semi-quantitative analysis of autophagosomes (AP, yellow puncta in merged images) and autolysosomes (AL, red-only puncta in merged images). n = 10 randomly selected fields/conditions from 3 independent experiments. The data were presented as mean ± s.d. and analyzed by student’s t-test (E), or one-way ANOVA with Fisher’s LSD post hoc analysis (A, C, and H), or one-way MANOVA with Fisher’s LSD post hoc analysis (G). *P < 0.05, **P < 0.01, ***P < 0.001.
m6A reader protein YTHDC1 interacted with SQSTM1 mRNA and was reduced in high-glucose-treated keratinocytes
We next sought to analyze the cytoplasmic and nuclear mRNA level of SQSTM1 in high-glucose-treated HaCaT cells. To investigate the metabolic effect of high glucose, mannitol was used as an osmotic control. As shown in , the expression levels of SQSTM1 mRNA were downregulated in both the cytoplasm and nucleus. As a quality control of the separation of cytoplasmic and nuclear RNA, the enrichment of ACTB (actin beta) mRNA in the cytoplasmic fraction and RNU6–1/U6 (RNA, U6 small nuclear 1) in the nuclear fraction was also confirmed (Figure S3A and S3B). Previous findings have demonstrated that m6A participates in post-transcriptional gene regulation in the nucleus [Citation41]. Thus, RNA dot blot was used to examined m6A levels in HaCaT cells. It was observed that m6A levels were significantly decreased in HaCaT cells following short-term high-glucose treatment (). Then, total cellular RNA was used in immunoprecipitation with m6A antibody to determine whether SQSTM1 mRNA contained m6A modification. Results of Methylated RNA immunoprecipitation (MeRIP)-qPCR showed that SQSTM1 mRNA could be pulled down by m6A antibody ().
Figure 4. m6A reader protein YTHDC1 interacted with SQSTM1 mRNA in keratinocytes. (A) RT-qPCR analysis of SQSTM1 mRNA expression levels in cytoplasm and nucleus of HaCaT cells treated with high glucose (30 mM) or mannitol (osmotic control) for 72 h (n = 3 independent experiments). (B) RNA dot blot analysis of m6A levels in HaCaT cells treated with high glucose (30 mM) or mannitol (osmotic control) for 72 h. Methylene blue staining served as a loading control. (C) MeRIP-qPCR analysis of m6A levels of SQSTM1 mRNA in HaCaT cells treated with normal glucose (n = 3 independent experiments). (D and E) RIP-qPCR and RNA affinity-isolation analysis of the interaction between YTHDC1 protein and SQSTM1 mRNA in HaCaT cells treated with normal glucose (n = 3 independent experiments). (F and G) western blot analysis of YTHDC1 expression levels in HaCaT cells treated with different concentrations of glucose or mannitol (osmotic control) for 48 and 72 h. Quantification results of YTHDC1 protein expression are shown (n = 3 independent experiments). (H and I) western blot analysis of YTHDC1 expression levels in the NHEK cells treated with normal glucose, mannitol (30 mM osmotic control), or high glucose (30 mM) for 72 h. Quantification results of protein expression are shown (n = 3 independent experiments). (J, K) IHC analysis of YTHDC1 in skin tissues of diabetic patients and the control group. Scale bar: 100 μm. Quantitative analysis of YTHDC1 protein (brown color) levels in the epidermis was performed according to the IRS (n = 3 per group). The data were presented as mean ± s.d. and analyzed by student’s t-test (A, C, D, and K) or one-way ANOVA with Fisher’s LSD post hoc analysis (G and I). *P < 0.05, **P < 0.01, ***P < 0.001.
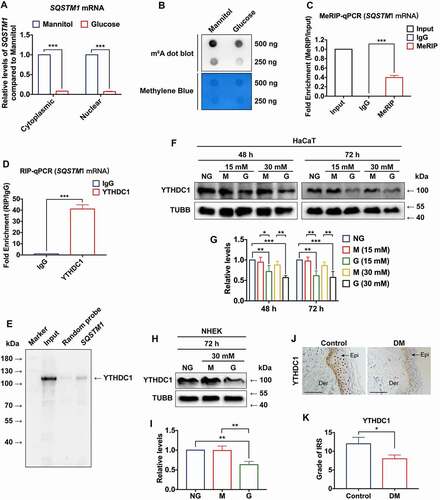
Among various kinds of m6A readers, the nuclear reader YTHDC1 has been suggested to play multiple roles, including regulating mRNA splicing, expediting mRNA export, and accelerating decay of transcripts [Citation42]. Thus, this study hypothesized that YTHDC1 participates in the regulation of SQSTM1 expression in HaCaT cells. First, tests were performed to determine whether YTHDC1 protein interacted with SQSTM1 mRNA. RNA Immunoprecipitation (RIP)-qPCR experiments revealed that the YTHDC1 protein could interact with SQSTM1 mRNA (). To further confirm this result, RNA affinity isolation was conducted, which verified that SQSTM1 mRNA interacted with the YTHDC1 protein (). Then, we considered whether dysregulation of YTHDC1 contributed to the decrease of SQSTM1 induced by high glucose in HaCaT cells. To investigate this assumption, the expression of YTHDC1 was evaluated in HaCaT cells treated with different concentrations of glucose and mannitol (osmotic control) for 48 and 72 h. Compared with the normal glucose and osmotic control groups, the expression level of YTHDC1 was notably downregulated in the short-term mid-high- and high-glucose-treated groups (). Similarly, short-term high-glucose treatment resulted in the downregulation of YTHDC1 in NHEK cells (). Then, the protein levels of YTHDC1 in human skin tissues were measured. The results of IHC staining showed that the levels of YTHDC1 were decreased in the epidermis of diabetic skin under the chronic effects of hyperglycemia (). These results demonstrated that the m6A reader YTHDC1, which interacted with SQSTM1 mRNA, was decreased in keratinocytes under both short-term and long-term hyperglycemia.
YTHDC1 regulated SQSTM1 expression and autophagic flux in high-glucose-treated keratinocytes
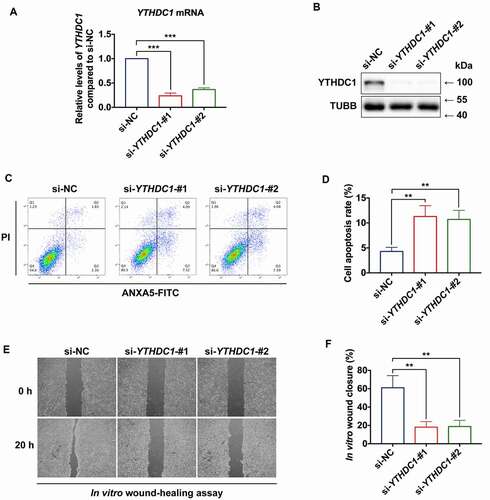
To examine the functional role of YTHDC1 in the keratinocytes, siRNA-based strategy was used to knock down endogenous YTHDC1 in HaCaT cells (). Lowered YTHDC1 expression in HaCaT cells resulted in increased apoptosis rates (). Moreover, wound-healing capacity was reduced in HaCaT cells transfected with si-YTHDC1, compared with the si-NC group ().
Figure 5. YTHDC1 affects biological functions of keratinocytes. (a and b) RT-qPCR and western blot analysis of YTHDC1 expression levels in control and YTHDC1 knockdown HaCaT cells 48 h after siRNA transfection (n = 3 independent experiments). (C and D) flow cytometry analysis was used to determine cell apoptosis rates of control and YTHDC1 knockdown HaCaT cells 48 h after siRNA transfection. Quantification of cell apoptosis rates is shown (n = 3 independent experiments). (E and F) representative images of in vitro wound-healing assays in HaCaT cells transfected with si-YTHDC1 or si-NC (control siRNA). HaCaT cells were scratched 48 h after siRNA transfection. Images were captured at 0 h and 24 h after the scratch. Semi-quantitative analysis of wound-healing assays is shown (n = 3 independent experiments). The data in A, D, and F were presented as mean ± s.d. and analyzed by one-way ANOVA with Fisher’s LSD post hoc analysis. **P < 0.01, ***P < 0.001.
It was anticipated that YTHDC1 might play a role in regulating the expression of SQSTM1. To further elucidate their relationship, the effect of YTHDC1 on SQSTM1 was examined. Knockdown of YTHDC1 resulted in a significant decrease of SQSTM1 mRNA and protein expression level, as well as MAP1LC3B/LC3B-II:-I ratio (). The effect of YTHDC1 knockdown on other autophagy genes was also investigated, and similar decreases of NFE2L2, beclin 1 (BECN1), NBR1 autophagy cargo receptor (NBR1), ATG7, and autophagy related 12 (ATG12) mRNA levels were found (Figure S4A). Moreover, it was observed that the numbers of autophagosomes and autolysosomes were decreased in HaCaT cells transfected with siRNAs against YTHDC1, which indicated that knockdown of YTHDC1 impaired autophagic flux ().
Figure 6. Decreased of YTHDC1 reduced SQSTM1 expression and impaired autophagic flux. (A) RT-qPCR analysis of SQSTM1 mRNA expression levels in control and YTHDC1 knockdown HaCaT cells (n = 3 independent experiments). (B and C) western blot analysis of YTHDC1, MAP1LC3B/LC3B-I, and MAP1LC3B/LC3B-II expression levels in control and YTHDC1 knockdown HaCaT cells. Quantification results of SQSTM1 protein expression, MAP1LC3B/LC3B-II:-I ratio, and MAP1LC3B/LC3B-II:ACTB ratio levels are shown (n = 3 independent experiments). (D, E, and F) the HaCaT cells were infected with adenovirus harboring tandem fluorescent mRFP-GFP-MAP1LC3B/LC3B for 24 h, followed by transfection with siRNAs. Representative pictures of the HaCaT cells expressing mRFP-GFP-MAP1LC3B/LC3B are shown. Green: GFP puncta, red: mRFP puncta, scale bar: 10 μm. Semi-quantitative analysis of autophagosomes (AP, yellow puncta in merged images) and autolysosomes (AL, red-only puncta in merged images). n = 10 randomly selected fields/condition from 3 independent experiments. (G) western blot analysis of YTHDC1, SQSTM1, MAP1LC3B/LC3B-I and MAP1LC3B/LC3B-II expression levels in HaCaT cells overexpressing YTHDC1 (OE-YTHDC1) and the control (OE-Control) with treatment of normal glucose, high glucose (30 mM), or mannitol (30 mM osmotic control) for 72 h. (H) quantification results of YTHDC1 and SQSTM1 protein expression, MAP1LC3B/LC3B-II:-I ratio and MAP1LC3B/LC3B-II:TUBB ratio levels are shown (n = 3 independent experiments). (I, J, and K) the HaCaT cells overexpressing YTHDC1(OE-YTHDC1) and the control (OE-Control) were infected with adenovirus harboring tandem fluorescent mRFP-GFP-MAP1LC3B/LC3B for 24 h, followed by treatment with normal glucose, high glucose (30 mM), or mannitol (30 mM osmotic control) for an additional 72 h. Representative images of the HaCaT cells expressing mRFP-GFP-MAP1LC3B/LC3B are shown. Green: GFP puncta, red: mRFP puncta, scale bar: 20 μm. Semi-quantitative analysis of autophagosomes (AP, yellow puncta in merged images) and autolysosomes (AL, red-only puncta in merged images). n = 10 randomly selected fields/conditions from 3 independent experiments. The data were presented as mean ± s.d. and analyzed by one-way ANOVA with Fisher’s LSD post hoc analysis (A, C, F, H, and K) or one-way MANOVA with Fisher’s LSD post hoc analysis (E and J). *P < 0.05, **P < 0.01, ***P < 0.001.
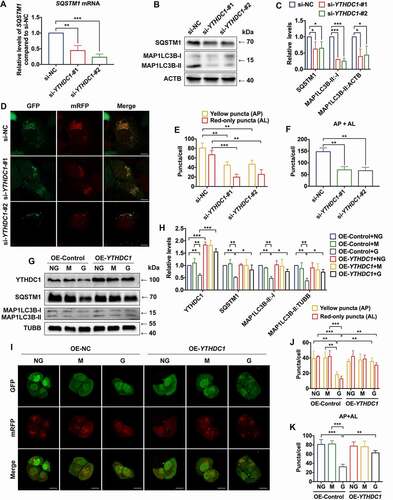
Next, to directly examine the functional role of YTHDC1 in regulating SQSTM1 expression in high-glucose-treated keratinocytes, overexpression of YTHDC1 was achieved by lentiviral vector-mediated transduction in HaCaT cells. The results showed that high glucose induced downregulation of YTHDC1, SQSTM1 and the MAP1LC3B/LC3B-II:-I ratio in HaCaT cells, which could be reversed by YTHDC1 overexpression (). Moreover, reduced autophagic flux was shown in the high-glucose-treated HaCaT cells, which was also rescued by overexpression of YTHDC1 (). Collectively, these results suggested that decrease of YTHDC1 contributed to the reduction of SQSTM1 expression, as well as the blockade of autophagic flux in high-glucose-treated keratinocytes. In conclusion, these data suggested that knockdown of YTHDC1 affected biological functions of keratinocytes, including an increase in apoptosis rates and impairment of wound-healing capacity.
Knockdown of YTHDC1 accelerated SQSTM1 mRNA degradation and impaired autophagic flux
It has been reported that YTHDC1 mediates the nuclear export of mRNA with m6A modification. Therefore, the expression levels of SQSTM1 mRNA with isolation of nuclear and cytoplasmic RNA were evaluated. Surprisingly, the results showed that knockdown of YTHDC1 decreased SQSTM1 mRNA in both the nucleus and cytoplasm (), but did not affect relative expression levels of ACTB and RNU6–1 mRNA in the nucleus and cytoplasm (). Whether the stability of SQSTM1 mRNA was affected by knockdown of YTHDC1 in the nucleus and cytoplasm was further tested. Actinomycin D was used to inhibit transcription in HaCaT cells. Intriguingly, knockdown of YTHDC1 drove SQSTM1 mRNA degradation in the nucleus but did not affect SQSTM1 mRNA stability in cytoplasm (). These data revealed a new role for YTHDC1 in maintaining stability of mRNA modified with m6A in the nucleus.
Figure 7. YTHDC1 cooperated with ELAVL1 in regulating expression of SQSTM1. (A) RT-qPCR analysis of SQSTM1 mRNA expression levels in the cytoplasm and nucleus of control and YTHDC1 knockdown HaCaT cells (n = 3 independent experiments). (B and C) the distribution of ACTB and RNU6–1/U6 mRNA in the cytoplasm and nucleus of control and YTHDC1 knockdown HaCaT cells (n = 3 independent experiments). (D and E) control and YTHDC1 knockdown HaCaT cells were treated with actinomycin D (5 μg/mL) for 0, 3, 6 h. The expression levels of SQSTM1 mRNA in the cytoplasm and nucleus were analyzed by RT-qPCR (n = 3 independent experiments). (F and G) Co-IP analysis of the interaction between YTHDC1 and ELAVL1 from HaCaT lysate. (H and I) RNA affinity-isolation and RIP-qPCR analysis of the interaction between ELAVL1 protein and SQSTM1 mRNA (n = 3 independent experiments). (J and K) RT-qPCR and western blot analysis of ELAVL1 expression levels in control and ELAVL1 knockdown HaCaT cells (n = 3 independent experiments). (L) RT-qPCR analysis of SQSTM1 mRNA expression levels in control and ELAVL1 knockdown HaCaT cells (n = 3 independent experiments). The data were presented as mean ± s.d. and analyzed by student’s t-test in (I) or one-way ANOVA with Fisher’s LSD post hoc analysis in (A), (D), (E), (J), and (L). *P < 0.05, **P < 0.01, ***P < 0.001 as compared with the si-NC groups.
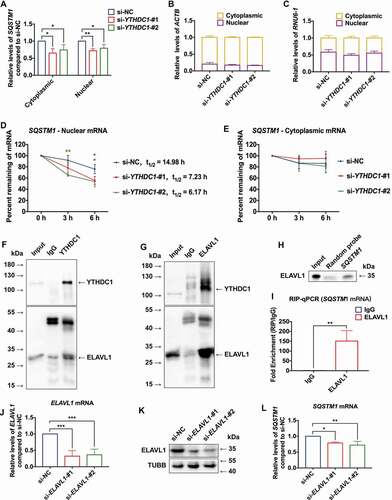
A recent study has shown that the functional effects of m6A may vary according to binding of one or more specific RNA binding proteins (RBPs) [Citation43]. ELAVL1 is known to be an RNA stabilizer protein, which could interact with mRNA containing m6A modification [Citation44,Citation45]. However, the relationship between ELAVL1 and m6A remains controversial. A previous study showed that ELAVL1 can positively regulated SQSTM1 expression at the posttranscriptional level [Citation46]. Thus, this study considered whether YTHDC1 may cooperate with ELAVL1 in the regulation of SQSTM1 expression. To examine this hypothesis, co-immunoprecipitation (Co-IP) was performed using antibodies against YTHDC1 and ELAVL1, respectively. Consistently, ELAVL1 could be affinity isolated with YTHDC1, and vice versa (), which suggested that YTHDC1 could interact with ELAVL1. Besides, the results of RNA affinity isolation and RIP-qPCR showed that ELAVL1 could interact with SQSTM1 mRNA (). Then, the effect of knockdown of ELAVL1 in HaCaT cells was investigated. The knockdown efficiency of siRNAs against ELAVL1 is shown in . RT-qPCR analyses revealed that knockdown of ELAVL1 resulted in decreases of SQSTM1 mRNA expression levels (), while little effect was observed on the expression levels of other autophagy genes (Figure S4B). These data demonstrated that YTHDC1 interacted and cooperated with ELAVL1 in regulating the expression of SQSTM1 in keratinocytes.
Downregulation of YTHDC1 reduced autophagy in the keratinocytes and delayed wound healing in mice
To provide evidence for the in vivo role of YTHDC1 and SQSTM1 in diabetic wound healing under the chronic effects of hyperglycemia, BKD-Leprem2Cd479/Nju (db/db) mice, a diabetic mouse model, and age-matched wild-type (WT) mice were examined. The peripheral blood glucose of db/db mice was significantly increased (hyperglycemia) compared with WT mice (Figure S5A). The weight of the mice in each group is shown in Figure S5B. Histological examination revealed thinner epidermises in the db/db mice, compared with the age-matched WT mice (Figure S5C and S5D). Considering that long-term hyperglycemia triggers increases of ROS and AGEs, which are known to interact with autophagy, the skin tissues were examined by the fluorescent probe DCFH-DA or immunohistochemical staining to detect ROS and AGEs levels. The results showed increased levels of both ROS and AGEs in the epidermises of db/db mice (Figure S5E-H). Next, the expression levels of YTHDC1, SQSTM1 and MAP1LC3B/LC3B) were examined in the diabetic and normal skin tissues by immunohistochemical staining. As shown in , downregulation of YTHDC1, SQSTM1 and MAP1LC3B/LC3B) was detected in the db/db mice compared with the age-matched WT mice. Notably, the wound healing rate in db/db mice was significantly delayed as compared with the WT mice (WT: 80.499 ± 2.426%; db/db: 56.884 ± 7.486%; ). To examine the functional roles of YTHDC1 and SQSTM1 in skin wound healing, siRNA-based strategy was used to knock down endogenous Ythdc1 and Sqstm1 genes in the skin of the mice (), as described in a previous related study [Citation47]. Compared with the WT-si-NC group, the expression levels of YTHDC1, SQSTM1, and MAP1LC3B/LC3B proteins were downregulated in the WT-si-Ythdc1 group after siRNA injection (). In the WT-si-Sqstm1 group, the expression levels of SQSTM1 and MAP1LC3B/LC3B proteins were also downregulated as compared with the WT-si-NC group (). Delayed wound healing was observed in the skin of mice injected with si-Ythdc1 or si-Sqstm1 (WT-si-NC: 78.822 ± 2.386%; WT-si-Ythdc1: 71.100 ± 1.888%; WT-si-Sqstm1: 70.176 ± 1.789%; ).
Figure 8. Decreased YTHDC1 inhibited autophagy in keratinocytes and delayed diabetic wound healing in mice. (A and B) immunohistochemical staining and analysis of YTHDC1, SQSTM1, and MAP1LC3B/LC3B protein expression in the skin tissues of db/db mice and WT mice. Scale bar: 100 μm. Quantitative analysis of YTHDC1, SQSTM1, and MAP1LC3B/LC3B protein (brown color) levels in the epidermis was performed according to the IRS (n = 7 per group). (C and D) representative images of cutaneous wounds of db/db mice and WT mice on day 0, 2, 4, 6, and 8 after wound generation by surgical excision. Rates of wound closure were quantified by using imageJ software and were expressed by the percentage of closed wound area (n = 7 per group). (E) illustration of experimental timeline for the siRNA injection and wound healing model of mice. (F and G) immunohistochemical staining and analysis of YTHDC1, SQSTM1, and MAP1LC3B (LC3B) protein expression in skin tissues of mice injected with control siRNA, Ythdc1 siRNA or Sqstm1 siRNA. Epi: epidermis, Der: dermis. Scale bar: 100 μm. Quantitative analysis of YTHDC1, SQSTM1, and MAP1LC3B/LC3B protein (brown color) levels in the epidermis was performed according to the IRS (n = 6 or 7 per group). (H and I) representative images of cutaneous wounds of mice injected with siRNAs on day 0, 2, 4, 6, and 8 after wound generation by surgical excision. Rates of wound closure were quantified by using imageJ software and were expressed by the percentage of closed wound area (n = 6 or 7 per group). The data were presented as mean ± s.d. (B and G) or mean ± SEM (D and I) and analyzed by student’s t-test (B and D) or one-way ANOVA with Fisher’s LSD post hoc analysis (G and I). *P < 0.05, **P < 0.01, ***P < 0.001.
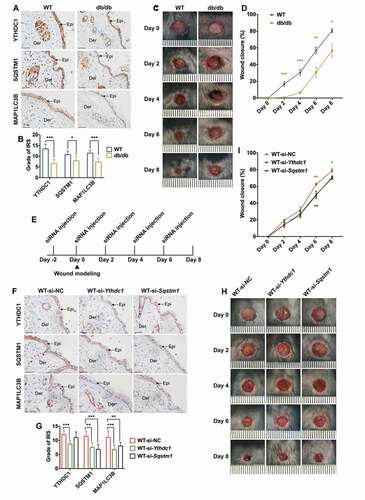
In summary, the in vivo data indicated that the expression levels of YTHDC1 and SQSTM1 were both decreased in the epidermis of diabetic mice under the chronic effects of hyperglycemia. Knockdown of endogenous Ythdc1 in the skin of mice resulted in the downregulation of the SQSTM1 and MAP1LC3B/LC3B proteins. Moreover, reduction of endogenous Ythdc1 or Sqstm1 expression resulted in delayed wound healing.
Discussion
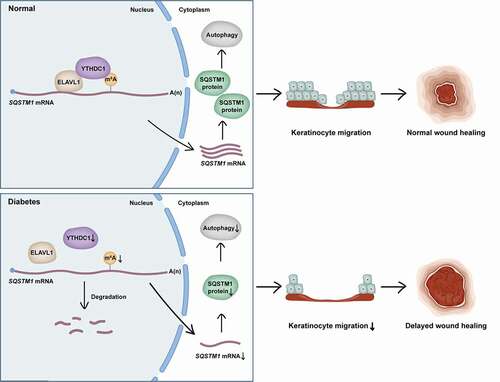
Here, this study revealed a previously unrecognized function of the m6A reader protein YTHDC1 in the modulation of autophagy. First, analysis found that short-term high-glucose treatment resulted in a decrease of SQSTM1 and impairment of autophagic flux in keratinocytes. Then it was demonstrated that the decrease of SQSTM1 blocked autophagic flux in keratinocytes. Furthermore, downregulation of YTHDC1 was identified to be responsible for the decrease of SQSTM1 and the blockade of autophagic flux in keratinocytes treated with high glucose. Knockdown of YTHDC1 was observed to affect the biological functions of keratinocytes, including by increasing apoptosis rates and impairing migration ability. Interestingly, this study revealed that downregulation of YTHDC1 induced decreased expression levels of SQSTM1 via acceleration of SQSTM1 nuclear mRNA decay, which led to impairment of autophagic flux. Moreover, ELAVL1 was shown to regulate the expression of SQSTM1, interacting and cooperating with YTHDC1. In vivo, decreased levels of SQSTM1 and MAP1LC3B/LC3B were also observed in the epidermises of diabetic mice and patients, a possible result from the chronic effect of hyperglycemia. Knockdown of endogenous Ythdc1 in the epidermis of mice resulted in the downregulation of the SQSTM1 and MAP1LC3B/LC3B proteins and delayed wound healing. Taken together, this study provided evidence that the decrease of the m6A reader YTHDC1 inhibited autophagy via acceleration of SQSTM1 nuclear mRNA decay in keratinocytes of diabetic skin, resulting in impaired migration abilities of keratinocytes and delayed wound healing ().
Figure 9. Proposed working model of YTHDC1 in regulation of autophagy in keratinocytes of diabetic skin. YTHDC1 interacted and cooperated with ELAVL1 in regulating the expression of SQSTM1 in keratinocytes. In diabetes, downregulation of YTHDC1 induced decreased expression levels of SQSTM1 via acceleration of SQSTM1 nuclear mRNA decay, which led to the impairment of autophagic flux and keratinocyte migration, eventually resulting in delayed wound healing.
Wound healing is a coordinated process that involves different kinds of cells, including immune cells, fibroblasts, vascular endothelial cells, and keratinocytes [Citation3,Citation5,Citation48]. During the inflammation phase of wound healing, monocytes are recruited to the wound site and differentiate into macrophages, which facilitate the clearance of pathogens [Citation48]. In the proliferative phase of wound healing, fibroblasts enter the wound bed and secrete extracellular matrix proteins into the granulation tissue [Citation49]. Endothelial progenitor cells are required for the neovascularization of the wound, while endothelial cells contribute to vasoconstriction and vasodilation [Citation5]. Moreover, it is important that keratinocytes proliferate and migrate to the wound for re-epithelialization [Citation50,Citation51]. In diabetic skin, dysfunction or the concerted interactions between various cell types has been observed. For example, the transition from the pro- to anti-inflammatory state of infiltrated macrophages is impeded [Citation52], local angiogenesis is impaired [Citation53], and the proliferation and migration of fibroblasts and keratinocytes is also inhibited [Citation54]. However, the underlying mechanisms of these dysfunctions are still largely unknown. This study put forward a critical role of m6A reader in regulating autophagy and wound healing, the dysfunction of which resulted in delayed wound healing of diabetic skin.
First, SQSTM1 was found to be a crucial gene in high-glucose-treated keratinocytes. SQSTM1 is an autophagy receptor that interacts directly with selected cargoes [Citation55]. However, the role of SQSTM1 in the regulation of autophagy remains controversial. Loss of SQSTM1 has been demonstrated to inhibit autophagosome formation and impair autophagy [Citation29]. Interestingly, the splicing variant of SQSTM1, which lacks the KEAP1-interacting region, could negatively regulate the KEAP1-NFE2L2 pathway [Citation56]. A previous study found that knockdown of SQSTM1 results in elevated levels of KEAP1 but decreased levels of NFE2L2 [Citation57]. This study confirmed that the KEAP1-NFE2L2 pathway was inhibited in keratinocytes transfected with si-SQSTM1. These findings were consistent with the results in keratinocytes treated with high glucose, compared with the osmotic control. The NFE2L2 protein has been reported to be downregulated in the skin tissues of diabetic patients [Citation58], whereas activation of the NFE2L2 pathway could significantly improve diabetic wound healing [Citation59]. However, the mechanism of reduced NFE2L2 expression in diabetic skin has not been clarified. In this study, the decrease of SQSTM1 was found to contribute to the reduction of NFE2L2 in high-glucose-treated keratinocytes, providing an additional insight for the regulatory mechanism of NFE2L2 downregulation in diabetic skin. It has been reported that increasing amounts of KEAP1 protein inhibits the interaction between SQSTM1 and MAP1LC3B/LC3B. One possible explanation is the close proximity of the MAP1LC3/LC3-interacting region (LIR) and the KEAP1 binding region (KIP) within SQSTM1 [Citation60]. Furthermore, this study found that knockdown of SQSTM1 resulted in inhibition of autophagosome formation and impairment of autophagic flux. Supporting these findings, previous studies reported that depletion of SQSTM1 abolished the formation of autophagosomes [Citation29,Citation61]. This study revealed the effect of SQSTM1 on autophagy from the post-transcriptional regulation in keratinocytes treated with high glucose.
Autophagy plays diverse roles in various cells of diabetic skin. A previous related study showed that AGEs triggered autophagy in human skin fibroblasts cells [Citation62]. A recent study showed that high glucose suppresses keratinocyte migration through inhibition of autophagy [Citation17]. Consistent with that study, the current study observed that autophagy was inhibited in high-glucose-treated keratinocytes. Importantly, this study reported that downregulation of SQSTM1 resulting from the decrease of m6A reader YTHDC1 played a determining role in the inhibition of autophagy in diabetic keratinocytes. This novel finding that revealed a previously unidentified role of the m6A reader YTHDC1 and its dysregulation in diabetic wound healing. In this study, further in vivo and in vitro evidences was provided supporting the mechanistic roles of YTHDC1 in regulating SQSTM1 and autophagy, as well as its functional role in wound healing. Although osmotic stress (≥50 mM) has been reported to induce autophagy in cells [Citation20,Citation21], this study showed that mannitol at various concentrations (15 and 30 mM) did not result in detectable changes in autophagy markers (MAP1LC3B/LC3B-II, MAP1LC3B/LC3B-I, SQSTM1), YTHDC1 expression, and autophagic flux in the keratinocytes as compared with normal glucose control, while increased glucose concentrations (15 and 30 mM) both showed significant reductions of the MAP1LC3B/LC3-II:-I ratio, SQSTM1 and YTHDC1 expression, as well as blockade of autophagic flux. The data therefore suggested that the metabolic but not osmotic effect of hyperglycemia plays a critical role in the pathophysiology of keratinocytes in diabetic skin. Furthermore, the decrease of YTHDC1 expression and autophagy was not only shown in cultured keratinocytes with short-term high-glucose treatment, but was also observed in the epidermis of diabetic mice and patients with chronic hyperglycemia.
SQSTM1-MTORC1-autophagy is crucial in driving the effects of SQSTM1 on the metabolic process. Reduction of SQSTM1 could reactivate the MTORC1 pathway, resulting in downregulation of autophagy [Citation63]. The MTOR signaling pathway, which promotes anabolic metabolism and inhibits autophagy induction, was activated in high-glucose-treated keratinocytes, as well as in the diabetic skin of rats and patients [Citation64,Citation65]. The current study confirmed that the AKT:MTOR signaling pathway was activated by high-glucose treatment in keratinocytes. It also verified that high glucose impaired autophagic flux in keratinocytes. A previous study reported that autophagy is defective in diabetic skin, thereby inhibiting the proliferation and migration of keratinocytes [Citation66]. In addition, autophagy might be a therapeutic target in diabetic skin wound healing. It was reported that autophagy is shown to be activated in response to glucose withdrawal via activation of PRKAA2/AMPK (protein kinase AMP-activated catalytic subunit alpha 2) and inactivation of MTOR [Citation67]. Besides, directed migratory speed could be enhanced via inducing autophagic activity in keratinocytes driven by electric fields [Citation68]. A recent study has also revealed the critical role of keratinocyte autophagy in facilitating wound healing via regulating CCL2 (C-C motif chemokine ligand 2) expression in a mouse model [Citation18]. Therefore, moderately improving autophagic activity may be a new strategy to promote diabetic wound healing. In agreement with previous findings [Citation69], the results of this study showed elevated ROS levels in the skin tissues of db/db mice. A significantly higher level of AGEs was also found in the serum of db/db mice [Citation70]. It has been reported that the level of AGEs accumulation is higher in the skin tissues of diabetic patients than in a nondiabetic group [Citation71]. The results of this study also suggested that the level of AGEs in the epidermis was higher in the db/db mice compared with the WT mice. It is generally accepted that ROS and AGEs could induce autophagy [Citation72–74]. On the other hand, autophagy helps to reduce oxidative damage in the stressed cells [Citation23], while inhibition of autophagy results in more ROS accumulation [Citation75,Citation76]. Moreover, autophagy activators have been found to reduce AGEs levels in human keratinocytes [Citation77]. Collectively, the data from this study indicated increased levels of ROS and AGEs in the epidermis of db/db mice that is associated with long-term hyperglycemia. However, the possible effect of ROS and/or AGEs on YTHDC1 expression is still unclear and requires further investigation.
In this study, the m6A level of mRNA in keratinocytes treated with high glucose was shown to be decreased in comparison with the control groups. These findings were consistent with previous studies. In one study, low m6A contents were detected in the RNA of peripheral blood samples from T2DM patients and diabetic rats, compared with the control groups [Citation36]. Moreover, in other research, upregulation of FTO induced by high glucose was found to possibly be responsible for low m6A contents in T2DM patients [Citation78]. YTHDC1 is a nuclear m6A reader mediating mRNA metabolism, and it could regulate mRNA splicing through competitively bingding to the pre-mRNA splicing factor SRSF3 (serine and arginine rich splicing factor 3) and SRSF10 (serine and arginine rich splicing factor 10) [Citation79,Citation80]. YTHDC1 can also interact with SRSF3 to mediate nuclear export of N6-methyladenosine methylated mRNAs [Citation81]. A recent study showed that knockout of Ythdc1 exhibits early mouse embryonic lethality, similarly to Mettl3 knockout, which implies that YTHDC1 may play a critical role in cell survival [Citation82]. The results of the current study suggested that knockdown of YTHDC1 affected biological functions of keratinocytes. Cell dysfunction and impairment of autophagy resulting from the decrease of YTHDC1 in keratinocytes might contribute to the epidermis thinning in diabetic skin.
The findings of the current study demonstrated a role for YTHDC1 in regulating nuclear mRNA stability. Recently, YTHDC1 has been revealed to interact with components of the nuclear exosome targeting (NEXT) and to trigger decay of chromosome-associated regulatory RNAs (carRNAs) through NEXT [Citation82]. Interestingly, the current study identified another role of YTHDC1 in regulating nuclear RNA stability. Knockdown of YTHDC1 drove SQSTM1 nuclear mRNA degradation in keratinocytes, which indicated a new role for YTHDC1 in maintaining mRNA stability in the nucleus. It is known that m6A modification contributes to mRNA stability [Citation83]. YTHDF proteins (YTHDF1, 2, and 3), which are m6A readers of the YTH (YT521-B homology) domain family, can work together to destabilize the same subset of transcripts [Citation84]. Besides, the insulin like growth factor 2 mRNA binding proteins (IGF2BPs) have been revealed to be m6A readers, which promote stability [Citation85]. In addition, a recent study revealed an important role of YTHDC2 (YTH domain containing 2), another YTHDC proteins, in regulating mRNA stability [Citation86]. However, the relationship between YTHDC1 and autophagy genes had not yet been studied. This study indicated a novel role of YTHDC1 in maintaining the stability of SQSTM1 mRNA in nucleus, as well as in modulating autophagy levels.
ELAVL1 has been identified as an RNA stabilizer protein, which has also been reported to positively affect SQSTM1 expression at post-transcriptional levels in a human retinal pigment epithelial cell line [Citation46,Citation87]. ELAVL1 and m6A modification might have mutual interdependency in regulating mRNA stability [Citation88]. A previous study found that ELAVL1 is significantly associated with m6A bait in an RNA affinity chromatography approach used to identify novel m6A-binding proteins [Citation45]. In gastric cancer cells, silencing of the m6A writer METTL3 results in reduced affinity of ELAVL1 to ZMYM1 (zinc finger MYM-type containing 1) mRNA, whereas overexpression of METTL3 leads to a reversed result [Citation89]. The current study found evidence that ELAVL1 could interact and cooperate with the m6A reader YTHDC1 in modulating SQSTM1 expression. Additionally, a recent study reported that the functional effects of m6A on downstream processes can be highly heterogeneous and depend on the binding of specific RBPs [Citation43]. For example, YTHDC1 can interact with and recruit demethylases KDM3B (lysine demethylase 3B) to m6A RNA associated chromatin regions, resulting in demethylation of the dimethylation of histone H3 at lysine 9 (H3K9me2) and that promotes gene expression [Citation90]. In the current study, it was found that YTHDC1 could interact with ELAVL1 in regulating SQSTM1 mRNA stability, suggesting that the function of YTHDC1 may vary depending on the RBPs with which it interacts. Notably, it was found that while knockdown of YTHDC1 resulted in a decrease of autophagy gene expression, including NFE2L2, BECN1, NBR1, ATG7, and ATG12 mRNAs, knockdown of ELAVL1 showed little effect on the mRNA levels of these autophagy genes. These data indicated the specificity of ELAVL1 in regulating SQSTM1 mRNA, while other unidentified RBPs in addition to ELAVL1 may participate in the regulation of other autophagy genes by YTHDC1.
The current study revealed that downregulation of SQSTM1 and the m6A reader YTHDC1 played critical roles in the dysregulation of autophagy in keratinocytes under both the acute and chronic effects of hyperglycemia. However, further exploration is needed to illustrate the mechanism for the interaction between YTHDC1 and ELAVL1 in regulating mRNA stability. In conclusion, this study identified a novel role of YTHDC1 in enhancing nuclear mRNA stability of SQSTM1. The expression of YTHDC1 was downregulated in the keratinocytes of the diabetic epidermis, resulting in decreased stability of SQSTM1 nuclear mRNA, thereby impairing autophagic flux and delaying wound healing. Overall, this study revealed potential therapeutic strategies for targeting autophagy and m6A reader proteins in promoting wound healing of diabetic skin.
Materials and methods
Cell culture
The human keratinocyte (HaCaT) cell line was purchased from Procell Life Science & Technology (CL-0090) and cultured with Minimum Essential Medium (MEM; Procell Life Science & Technology, PM150410) containing 10% fetal bovine serum (Gibco, A3160802). Normal human epithelial keratinocytes (NHEK) were purchased from Beijing Beina Chuanglian Biotechnology Institute (BNCC340593) and cultured with Minimum Essential Medium with Earle’s Balanced Salts (MEM/EBBS; Hyclone, SH30024.01) containing 10% fetal bovine serum (Gibco, A3160802). Cells were incubated in humidified condition of 37°C with 95% air and 5% CO2. For experiments, HaCaT cells or NHEK were treated with different concentrations of glucose (Sigma-Aldrich, G6152; normal glucose: 5.6 mM of glucose; mid-high glucose: 15 mM of glucose; high glucose: 30 mM glucose). Mannitol (Sigma-Aldrich, M4125; 15 mM: 5.6 mM of glucose + 9.4 mM of mannitol; 30 mM: 5.6 mM of glucose + 24.4 mM of mannitol) was used as the osmotic control for mid-high glucose and high glucose.
Human tissue samples and ethics statement
Diabetic perilesional skin tissues were obtained from patients undergoing amputation surgery. Control (healthy) skin tissues were collected from the lower leg of patients without diabetes undergoing reconstruction due to foot injury. Tissues were rapidly fixed in 4% paraformaldehyde for 24 h, and then embedded in paraffin. The study protocol was in accordance with the principles of the Helsinki Declaration II and was approved by the Institutional Review Board of the Sun Yat-sen Memorial Hospital of Sun Yat-sen University.
In vivo wound healing model
Seven-to-8-week-old male type-2 diabetic mice (BKD-Leprem2Cd479/Nju, db/db) and age-matched wild-type (WT) mice were purchased from GemPharmatech, Co., Ltd. (T002407). Two days before generating the skin wounds (day −2), a 6-mm skin biopsy punch was used to mark a circle on the backs of the mice. Then, the WT-si-NC, WT-si-Ythdc1 and WT-si-Sqstm1 groups were intracutaneously injected with corresponding siRNAs (si-NC, si-Ythdc1, or si-Sqstm1, 2.5 nmol) on the circle. Two days later (day 0), circular full-thickness skin wounds were made with a 6-mm skin biopsy punch and skin tissues from the wounds were harvested. On days 0, 2, 4, and 6 after wound modeling, WT-si-NC, WT-si-Ythdc1 and WT-si-Sqstm1 groups were intracutaneously injected with corresponding siRNAs (si-NC, si-Ythdc1, or si-Sqstm1) on the edge of the circular wounds. Wound areas were quantified by using ImageJ software with photos taken on days 0, 2, 4, 6, and 8 after wound modeling. Wound healing rate was calculated as previously reported: (initial area – final area)/initial area × 100% [Citation4]. siRNAs were designed and synthesized by Guangzhou RiboBio Co., Ltd. All animal experiments were approved by the Institutional Animal Care and Use Committee (IACUC), Sun Yat-sen University; approval number: SYSU-IACUC-2021-000238.
RNA–seq analysis
HaCaT cells were treated with high glucose (30 mM) or osmotic control (30 mM: 5.6 mM of glucose + 24.4 mM of mannitol) for 48 h (n = 5). Total RNA was extracted using RNAiso Plus (TaKaRa, 9109). Magnetic beads connected to Oligo (dT) were used to enrich the eukaryotic mRNA. After being fragmented, mRNA was converted into individual cDNA libraries. RNA-seq was carried out using Illumina Novaseq™ 6000. Gene abundances were quantified by FPKM (fragments per kilobase of exon model per million mapped reads). For differential and significant gene expression analysis, false discovery rate (FDR) < 0.05 and log 2 (fold change) ≥ 1 were used as the thresholds.
RT-qPCR
Total RNA was extracted using RNAiso Plus (TaKaRa, 9109). Complementary DNA (cDNA) was synthesized using 500 ng RNA samples with PrimeScript RT Master Mix (TaKaRa, RR036A) according to the manufacturer’s protocol. TB Green Premix Ex Taq II (TaKaRa, RR820A) was used for quantitative real-time PCR (qPCR) conducted on a LightCycler 480 II real-time PCR instrument (Roche). Gene expression changes were analyzed by the 2−ΔΔCt method and normalized to ACTB. The sequences of primers used are presented in .
Table 1. Primer sequences
Western blot
Protein was extracted using cell lysis buffer (Cell Signaling Technology, 9803S) containing protease and phosphatase inhibitor cocktail. Protein samples were heated with NuPAGE LDS Sample Buffer (Invitrogen, NP0007) at 95°C for 10 min. Proteins were separated in SDS-PAGE gels and transferred to polyvinylidene fluoride (PVDF) membranes (Millipore, IPVH00010). Then, the membranes were blocked with 5% nonfat milk (Sangon Biotech, A600669) in TBST (TBS, Boster Biological Technology, AR0031; Tween-20, Solarbio, T8220) at 25°C for 1 h. Primary antibodies were incubated at 4°C overnight. Secondary antibodies were incubated at 25°C for 1 h. Protein bands were detected using BeyoECL Star Kit (Beyotime Biotechnology, P0018AS). Primary antibodies used in the experiment are listed in .
Table 2. Primary antibodies used in this study
TEM
The culture medium was removed and the cells were fixed with 2.5% glutaraldehyde at 25°C for 5 min. Cells were scraped from the plates and collected by centrifugation at 500 × g for 5 min. The cell pellets were fixed with 2.5% glutaraldehyde in darkness at 25°C for 30 min. After being embedded in 1% agarose, cells or tissues were post-fixed in 1% osmium tetroxide for 2 h. Next, the cells or tissues were dehydrated with ethanol and acetone, and then embedded in epoxy resin (SPI, 90,529–77–4). Blocks were cut into semithin sections and stained with ethanolic uranyl acetate and lead citrate. The morphology of autophagic structures was investigated by TEM at 8.0 kV.
Autophagic flux
Autophagic flux was measured using tandem mRFP-GFP-MAP1LC3B/LC3B (Hanbio, HBAD-1007). HaCaT cells were infected with tandem mRFP-GFP-MAP1LC3B/LC3B adenovirus before treatment with high glucose/mannitol or transfection with siRNAs. Cells were fixed with 4% paraformaldehyde for 15 min. Nuclei were stained with DAPI for 5 min. The fluorescence images were acquired using a confocal laser-scanning microscope.
RNA interference
Knockdown of RNA in HaCaT cells was realized by transfection with siRNAs synthesized by Suzhou GenePharma. Cells grown in six-well plates were transfected with 200 pmol siRNAs using lipofectamine RNAiMAX transfection reagent (Invitrogen, 13,778,150) according to the manufacturer’s instructions. The sequences of siRNAs are presented in .
Table 3. siRNA sequences
YTHDC1 overexpression in HaCaT cells
The coding sequence of human YTHDC1 (NM_001031732) was subcloned into GV358 lentiviral vector (designed and constructed by Genechem) using endonucleases AgeI/AgeI-based strategy (New England Biolabs, R0552S). Empty lentiviral vector was used as the negative control. After 48 h of viral transduction, cells were selected with 2 μg/mL puromycin.
RNA dot blot
Total RNA was isolated using RNAiso Plus (TaKaRa, 9109) and spotted onto nylon membranes (Millipore, INYC00010). Then the membranes were crosslinked by ultraviolet (UV). After being dyed with methylene blue, the membranes were washed with ethanol. Blocking buffer (5% milk in phosphate-buffered saline with 0.1% Tween 20) was used to block the membranes for 1 h. The membranes were incubated with anti-m6A antibody at 4°C overnight. Secondary antibodies were incubated at 25°C for 1 h. Protein bands were detected using a BeyoECL Star Kit (Beyotime Biotechnology, P0018AS). Primary antibodies used in the experiment are listed in .
RIP
For each RIP reaction, 107 HaCaT cells were harvested and washed with PBS (Hyclone, SH30256.01B). After centrifugation, the pellets were resuspended in IP lysis buffer (Beyotime Biotechnology, P0013) containing protease inhibitor cocktail and RNase inhibitors (TaKaRa, 2313A). Magnetic beads protein A/G (MedChemExpress, HY-K0202) were incubated with 5 μg antibody at 25°C for 1 h. Normal rabbit IgG was used as a negative control RIP reaction. The supernatant of cell lysate was collected after centrifugation. Next, 10% of the lysate was used as input and kept at −80°C. The remaining lysate was added to the beads-antibody complex in immunoprecipitation buffer, and then incubated at 4°C overnight. After washing with RIP buffer, 10% of the beads were collected during the last wash to test the efficiency of immunoprecipitation by western blot. Then, the beads were resuspended with proteinase K buffer and incubated at 55°C for 30 min with shaking. RNAiso Plus (TaKaRa, 9109) was used to purify RNA according to manufacturer’s protocol. RT-qPCR was conducted as described above. RNA enrichment was normalized to the input control. Primary antibodies used in the experiment are listed in .
MeRIP-qPCR
Total RNA was extracted using RNAiso Plus (TaKaRa, 9109) and treated with recombinant DNase I (TaKaRa, 2270A) according to manufacturer’s protocol. A Magna MeRIP m6A Kit (Millipore, 17–10,499) was used to monitor the status of m6A in mRNA. Anti-m6A antibody (or normal IgG as negative control RIP reaction) was incubated with Magna ChIP Protein A/G Magnetic Beads at 25°C for 30 min. For each immunoprecipitation, 300 μg total RNA was prepared. Then, 30 μg of total RNA was collected as input and kept at −80°C. The remaining RNA was incubated with beads-antibody complex at 4°C overnight. Next, the RNA was eluted twice with elution buffer containing 20 mM N6-Methyladenosine, 5ʹ-monophosphate sodium salt (m6A). The input of RNA and eluted RNA was purified by RNAiso Plus. RT-qPCR was conducted as described above.
RNA affinity isolation
The 5ʹ end biotinylated RNA probes complementary to YTHDC1 mRNA were incubated with streptavidin magnetic beads (MedChemExpress, HY-K0208) at 25°C for 1 h. Cell lysate was prepared with IP lysis buffer (Beyotime Biotechnology, P0013). Then the cell lysate was mixed with RNA-bound beads thoroughly and incubated at 4°C overnight. Samples were eluted and analyzed by western blot as described above. Biotin-labeled probes were purchased from RiboBio, China. The sequences of probes used are presented as follows: SQSTM1, 5ʹ-TCCGATGTCATAGTTCTTGG-3ʹ; Random probe, 5ʹ-TTCTTACTACGTGAGGTCGT-3ʹ.
Co-IP
For each Co-IP reaction, 107 HaCaT cells were harvested and washed with PBS. After centrifugation, the pellets were resuspended with IP lysis buffer (Beyotime Biotechnology, P0013) containing protease inhibitor cocktail. Magnetic beads protein A/G (MedChemExpress, HY-K0202) were incubated with 1 μg YTHDC1 or ELAVL1 antibody at 25°C for 1 h. Normal rabbit IgG was used as a negative control IP reaction. The supernatant of cell lysate was collected after centrifugation. Then, 10% of the lysate was collected as input. The remaining lysate was added to the beads-antibody complex in IP buffer, and then incubated at 4°C overnight. After washing with IP buffer, the beads were resuspended with loading buffer (1×) and heated at 95°C for 10 min. Western blot was conducted as described above. Primary antibodies used in the experiment are listed in .
Hematoxylin-eosin (HE) staining
Skin tissues were fixed with 4% paraformaldehyde before embedding. Tissues were sliced up and stained with hematoxylin-eosin. Epidermal thickness was measured using ImageJ.
Immunohistochemical (IHC) staining
Skin tissues were fixed in 4% paraformaldehyde solution for 24 h. Sections were prepared after being embedded in paraffin. The slides were baked at 65°C for 2 h before deparaffinization, and then rehydrated in distilled water for 10 min. For antigen retrieval, slides were submerged in EDTA (pH 8.0; ZSGB-BIO, ZLI-9067) at 95°C for 20 min. After being blocked with immunol staining blocking buffer (Beyotime Biotechnology, P0260) at 25°C for 30 min, the slides were incubated with primary antibodies at 4°C overnight. Then, the slides were incubated with secondary antibody at 37°C for 1 h. Images were captured by a Nikon Ni-U camera (Nikon). Five fields were observed for each section. Scoring was conducted according to the immunoreactive score (IRS) standard as previously reported [Citation91]. Primary antibodies used in the experiment are listed in .
Reactive oxygen species (ROS) detection
Skin tissues were embedded with optimal cutting temperature embedding medium at −80°C as soon as they were harvested. Fresh tissues were used for detection within 24 h. After being sliced up into 12-μm sections, tissues were washed with PBS (Hyclone, SH30256.01B) and incubated with fluorescent probe DCFH-DA at 37°C for 20 min. Nuclei were stained with DAPI for 5 min. The fluorescence images were captured using a fluorescence microscope.
Nuclear and cytoplasmic RNA isolation
Cells cultured in 6-well plates were trypsinized and then collected. The PARIS Kit (Invitrogen, AM1921) was applied to isolate the nuclear and cytoplasmic RNA fractions according to the manufacturer’s protocol. RNA was purified using RNAiso Plus (TaKaRa, 9109).
Actinomycin D treatment
A total of 5 mg actinomycin D (APExBIO Technology, A4448) was dissolved in 1 mL DMSO to a concentration of 5 mg/mL. Then, 5 μg/mL (diluted 1:1000) of actinomycin D was added to cells to inhibit mRNA transcription. Cells were collected at 0, 3, and 6 h. RNA was extracted and used for RT-qPCR.
Wound-healing assay
HaCaT cells were seeded in 6-well plates and transfected with siRNAs. After 48 h, the attached cells were scratched with a 200-μl pipette tip. Images were captured at 0 h using a microscope. Then, the cells were cultured at 37°C with 5% CO2 for 20 h, at which time another set of images of the same wounds was captured. The wound widths were measured with ImageJ software (National Institutes of Health, Bethesda, MD, USA) and were normalized and presented as a percentage of the wound measured at 0 h.
Cell apoptosis
To examine cell apoptosis, HaCaT cells were seeded in plates and transfected with siRNAs for 48 h. Then, cells were trypsinized and collected by centrifugation. After washing with PBS, the cells were resuspended with binding buffer. Cells were stained with ANXA5/annexin V and propidium iodide (PI) for 15 min in darkness before flow cytometry analysis.
Antibody
The primary antibodies used in this study are listed in .
Statistical analysis
Data are presented as the mean ± s.d. or mean ± SEM. Statistical analyses were performed using IBM SPSS Statistics 23.0 software. Results were analyzed using the Student’s t-test, one-way analysis of variance (ANOVA), or one-way multivariate analysis of variance (MANOVA) followed by Fisher’s least significant difference (LSD) post hoc analysis. P < 0.05 was considered statistically significant. *P < 0.05, **P < 0.01, ***P < 0.001, ns: no significance.
Supplemental Material
Download Zip (4.4 MB)Acknowledgments
We would like to express our deep gratitude to Prof. Phei Er Saw for writing guidance. We thank the two anonymous reviewers for their insightful comments and constructive suggestions on the prior versions of this manuscript. We also thank everyone who has given us help in the Department of Endocrinology and our laboratory.
Disclosure statement
No potential conflict of interest was reported by the author(s).
Supplementary material
Supplemental data for this article can be accessed here.
Additional information
Funding
Related Research Data
References
- Zhang P, Lu J, Jing Y, et al. Global epidemiology of diabetic foot ulceration: a systematic review and meta-analysis (dagger). Ann Med. 2017;49(2):106–116.
- International Diabetes Federation. IDF diabetes atlas. 9th ed. Brussels (BE): International Diabetes Federation; 2019.
- Rognoni E, Watt FM. Skin cell heterogeneity in development, wound healing, and cancer. Trends Cell Biol. 2018;28(9):709–722.
- Wang W, Yang C, Wang XY, et al. MicroRNA-129 and −335 promote diabetic wound healing by inhibiting Sp1-Mediated MMP-9 expression. Diabetes. 2018;67(8):1627–1638.
- den Dekker A, Davis FM, Kunkel SL, et al. Targeting epigenetic mechanisms in diabetic wound healing. Transl Res. 2019;204:39–50.
- Hu SC, Lan CE. High-glucose environment disturbs the physiologic functions of keratinocytes: focusing on diabetic wound healing. J Dermatol Sci. 2016;84(2):121–127.
- Lan CC, Wu CS, Kuo HY, et al. Hyperglycaemic conditions hamper keratinocyte locomotion via sequential inhibition of distinct pathways: new insights on poor wound closure in patients with diabetes. Br J Dermatol. 2009;160(6):1206–1214.
- Park HY, Kim JH, Jung M, et al. A long-standing hyperglycaemic condition impairs skin barrier by accelerating skin ageing process. Exp Dermatol. 2011;20(12):969–974.
- Moscat J, Diaz-Meco MT. p62 at the crossroads of autophagy, apoptosis, and cancer. Cell. 2009;137(6):1001–1004.
- Nezis IP, Stenmark H. p62 at the interface of autophagy, oxidative stress signaling, and cancer. Antioxid Redox Signal. 2012;17(5):786–793.
- Katsuragi Y, Ichimura Y, Komatsu M. p62/SQSTM1 functions as a signaling hub and an autophagy adaptor. FEBS J. 2015;282(24):4672–4678.
- Long M, Li X, Li L, et al. Multifunctional p62 effects underlie diverse metabolic diseases. Trends Endocrinol Metab. 2017;28(11):818–830.
- Rogov V, Dotsch V, Johansen T, et al. Interactions between autophagy receptors and ubiquitin-like proteins form the molecular basis for selective autophagy. Mol Cell. 2014;53(2):167–178.
- Yu T, Zuber J, Li J. Targeting autophagy in skin diseases. J Mol Med (Berl). 2015;93(1):31–38.
- Condello M, Pellegrini E, Caraglia M, et al. Targeting Autophagy to overcome human diseases. Int J Mol Sci. 2019;20(3):3.
- Galluzzi L, Bravo-San Pedro JM, Levine B, et al. Pharmacological modulation of autophagy: therapeutic potential and persisting obstacles. Nat Rev Drug Discov. 2017;16(7):487–511.
- Li L, Zhang J, Zhang Q, et al. High glucose suppresses keratinocyte migration through the inhibition of p38 MAPK/Autophagy pathway. Front Physiol. 2019;10:24.
- Qiang L, Yang S, Cui YH, et al. Keratinocyte autophagy enables the activation of keratinocytes and fibroblasts and facilitates wound healing. Autophagy. 2020:1–16. doi:https://doi.org/10.1080/15548627.2020.1816342
- Xiao M, Li L, Hu Q, et al. Rapamycin reduces burn wound progression by enhancing autophagy in deep second-degree burn in rats. Wound Repair Regen. 2013;21(6):852–859.
- Tamura N, Kageyama S, Komatsu M, et al. Hyperosmotic stress induces unconventional Autophagy independent of the Ulk1 Complex. Mol Cell Biol. 2019;39:16.
- Pena-Oyarzun D, Troncoso R, Kretschmar C, et al. Hyperosmotic stress stimulates autophagy via polycystin-2. Oncotarget. 2017;8(34):55984–55997.
- Giacco F, Brownlee M, Schmidt AM. Oxidative stress and diabetic complications. Circ Res. 2010;107(9):1058–1070.
- Scherz-Shouval R, Elazar Z. Regulation of autophagy by ROS: physiology and pathology. Trends Biochem Sci. 2011;36(1):30–38.
- Dunnill C, Patton T, Brennan J, et al. Reactive oxygen species (ROS) and wound healing: the functional role of ROS and emerging ROS-modulating technologies for augmentation of the healing process. Int Wound J. 2017;14(1):89–96.
- Zhu P, Yang C, Chen LH, et al. Impairment of human keratinocyte mobility and proliferation by advanced glycation end products-modified BSA. Arch Dermatol Res. 2011;303(5):339–350.
- Klionsky DJ, Abdelmohsen K, Abe A, et al. Guidelines for the use and interpretation of assays for monitoring autophagy. Autophagy. 2016;12(1):1–222. 3rd.
- Zhang Y, Mun SR, Linares JF, et al. Mechanistic insight into the regulation of SQSTM1/p62. Autophagy. 2019;15(4):735–737.
- Zhang Y, Mun SR, Linares JF, et al. ZZ-dependent regulation of p62/SQSTM1 in autophagy. Nat Commun. 2018;9(1):4373.
- Bjorkoy G, Lamark T, Brech A, et al. p62/SQSTM1 forms protein aggregates degraded by autophagy and has a protective effect on huntingtin-induced cell death. J Cell Biol. 2005;171(4):603–614.
- Huang J, Yin P. Structural insights into N(6)-methyladenosine (m(6)A) modification in the transcriptome. Genomics Proteomics Bioinformatics. 2018;16(2):85–98.
- Chen J, Wang C, Fei W, et al. Epitranscriptomic m6A modification in the stem cell field and its effects on cell death and survival. Am J Cancer Res. 2019;9(4):752–764.
- Song H, Feng X, Zhang H, et al. METTL3 and ALKBH5 oppositely regulate m(6)A modification of TFEB mRNA, which dictates the fate of hypoxia/reoxygenation-treated cardiomyocytes. Autophagy. 2019;15(8):1419–1437.
- Wang X, Wu R, Liu Y, et al. m(6)A mRNA methylation controls autophagy and adipogenesis by targeting Atg5 and Atg7. Autophagy. 2020;16(7):1221–1235.
- Jin S, Zhang X, Miao Y, et al. m(6)A RNA modification controls autophagy through upregulating ULK1 protein abundance. Cell Res. 2018;28(9):955–957.
- Chen Y, Wang J, Xu D, et al. m(6)A mRNA methylation regulates testosterone synthesis through modulating autophagy in Leydig cells. Autophagy. 2021;17(2):457–475.
- Shen F, Huang W, Huang JT, et al. Decreased N(6)-methyladenosine in peripheral blood RNA from diabetic patients is associated with FTO expression rather than ALKBH5. J Clin Endocrinol Metab. 2015;100(1):E148–54.
- Zhou Y, Zhou B, Pache L, et al. Metascape provides a biologist-oriented resource for the analysis of systems-level datasets. Nat Commun. 2019;10(1):1523.
- Szklarczyk D, Gable AL, Lyon D, et al. STRING v11: protein-protein association networks with increased coverage, supporting functional discovery in genome-wide experimental datasets. Nucleic Acids Res. 2019;47(D1):D607–D613.
- Copple IM, Lister A, Obeng AD, et al. Physical and functional interaction of sequestosome 1 with Keap1 regulates the Keap1-Nrf2 cell defense pathway. J Biol Chem. 2010;285(22):16782–16788.
- Tang Z, Hu B, Zang F, et al. Nrf2 drives oxidative stress-induced autophagy in nucleus pulposus cells via a Keap1/Nrf2/p62 feedback loop to protect intervertebral disc from degeneration. Cell Death Dis. 2019;10(7):510.
- Roundtree IA, Evans ME, Pan T, et al. Dynamic RNA modifications in gene expression regulation. Cell. 2017;169(7):1187–1200.
- Shi H, Wei J, Where HC. When, and how: context-dependent functions of RNA methylation writers, readers, and erasers. Mol Cell. 2019;74(4):640–650.
- Zhang Z, Luo K, Zou Z, et al. Genetic analyses support the contribution of mRNA N(6)-methyladenosine (m(6)A) modification to human disease heritability. Nat Genet. 2020;52(9):939–949.
- Brennan CM, Steitz JA. HuR and mRNA stability. Cell Mol Life Sci. 2001;58(2):266–277.
- Dominissini D, Moshitch-Moshkovitz S, Schwartz S, et al. Topology of the human and mouse m6A RNA methylomes revealed by m6A-seq. Nature. 2012;485(7397):201–206.
- Marchesi N, Thongon N, Pascale A, et al. Autophagy stimulus promotes early HuR protein activation and p62/SQSTM1 protein synthesis in ARPE-19 cells by triggering Erk1/2, p38(MAPK), and JNK Kinase Pathways. Oxid Med Cell Longev. 2018;2018:4956080.
- Li N, Luo HC, Ren M, et al. Efficiency and safety of beta-CD-(D3)7 as siRNA carrier for decreasing matrix metalloproteinase-9 expression and improving wound healing in diabetic rats. ACS Appl Mater Interfaces. 2017;9(20):17417–17426.
- Rodrigues M, Kosaric N, Bonham CA, et al. Wound healing: a cellular perspective. Physiol Rev. 2019;99(1):665–706.
- Guo S, Dipietro LA. Factors affecting wound healing. J Dent Res. 2010;89(3):219–229.
- Gurtner GC, Werner S, Barrandon Y, et al. Wound repair and regeneration. Nature. 2008;453(7193):314–321.
- Falanga V. Wound healing and its impairment in the diabetic foot. Lancet. 2005;366(9498):1736–1743.
- Boniakowski AE, Kimball AS, Jacobs BN, et al. Macrophage-mediated inflammation in normal and diabetic wound healing. J Immunol. 2017;199(1):17–24.
- Okonkwo UA, DiPietro LA. Diabetes and wound angiogenesis. Int J Mol Sci. 2017;18:7.
- Brem H, Tomic-Canic M. Cellular and molecular basis of wound healing in diabetes. J Clin Invest. 2007;117(5):1219–1222.
- Lamark T, Svenning S, Johansen T. Regulation of selective autophagy: the p62/SQSTM1 paradigm. Essays Biochem. 2017;61(6):609–624.
- Kageyama S, Saito T, Obata M, et al. Negative regulation of the Keap1-Nrf2 pathway by a p62/Sqstm1 splicing variant. Mol Cell Biol. 2018;38:7.
- Li T, Jiang D, Wu K. p62 promotes bladder cancer cell growth by activating KEAP1/NRF2-dependent antioxidative response. Cancer Sci. 2020;111(4):1156–1164.
- Lee YJ, Kwon SB, An JM, et al. Increased protein oxidation and decreased expression of nuclear factor E2-related factor 2 protein in skin tissue of patients with diabetes. Clin Exp Dermatol. 2015;40(2):192–200.
- Long M, Rojo de la Vega M, Wen Q, et al. An essential role of NRF2 in diabetic wound healing. Diabetes. 2016;65(3):780–793.
- Jain A, Lamark T, Sjottem E, et al. p62/SQSTM1 is a target gene for transcription factor NRF2 and creates a positive feedback loop by inducing antioxidant response element-driven gene transcription. J Biol Chem. 2010;285(29):22576–22591.
- Haidar M, Asselbergh B, Adriaenssens E, et al. Neuropathy-causing mutations in HSPB1 impair autophagy by disturbing the formation of SQSTM1/p62 bodies. Autophagy. 2019;15(6):1051–1068.
- Sun K, Wang W, Wang C, et al. AGEs trigger autophagy in diabetic skin tissues and fibroblasts. Biochem Biophys Res Commun. 2016;471(3):355–360.
- Moscat J, Diaz-Meco MT. Feedback on fat: p62-mTORC1-autophagy connections. Cell. 2011;147(4):724–727.
- Kim YC, Guan KL. mTOR: a pharmacologic target for autophagy regulation. J Clin Invest. 2015;125(1):25–32.
- Wu LY, Li M, Qu ML, et al. High glucose up-regulates semaphorin 3A expression via the mTOR signaling pathway in keratinocytes: a potential mechanism and therapeutic target for diabetic small fiber neuropathy. Mol Cell Endocrinol. 2018;472:107–116.
- Sil P, Wong SW, Martinez J. More than skin deep: autophagy is vital for skin barrier function. Front Immunol. 2018;9:1376.
- Russell RC, Yuan HX, Guan KL. Autophagy regulation by nutrient signaling. Cell Res. 2014;24(1):42–57.
- Yan T, Jiang X, Lin G, et al. Autophagy is required for the directed motility of keratinocytes driven by electric fields. FASEB J. 2019;33(3):3922–3935.
- Lan CC, Wu CS, Huang SM, et al. High-glucose environment enhanced oxidative stress and increased interleukin-8 secretion from keratinocytes: new insights into impaired diabetic wound healing. Diabetes. 2013;62(7):2530–2538.
- Kim JH, Yoon NY, Kim DH, et al. Impaired permeability and antimicrobial barriers in type 2 diabetes skin are linked to increased serum levels of advanced glycation end-product. Exp Dermatol. 2018;27(8):815–823.
- Niu Y, Cao X, Song F, et al. Reduced dermis thickness and AGE accumulation in diabetic abdominal skin. Int J Low Extrem Wounds. 2012;11(3):224–230.
- Azad MB, Chen Y, Gibson SB. Regulation of autophagy by reactive oxygen species (ROS): implications for cancer progression and treatment. Antioxid Redox Signal. 2009;11(4):777–790.
- Park E, Chung SW. ROS-mediated autophagy increases intracellular iron levels and ferroptosis by ferritin and transferrin receptor regulation. Cell Death Dis. 2019;10(11):822.
- Mei YM, Li L, Wang XQ, et al. AGEs induces apoptosis and autophagy via reactive oxygen species in human periodontal ligament cells. J Cell Biochem. 2019.
- Yamauchi S, Mano S, Oikawa K, et al. Autophagy controls reactive oxygen species homeostasis in guard cells that is essential for stomatal opening. Proc Natl Acad Sci U S A. 2019;116(38):19187–19192.
- Li Q, Yin Y, Zheng Y, et al. Inhibition of autophagy promoted high glucose/ROS-mediated apoptosis in ADSCs. Stem Cell Res Ther. 2018;9(1):289.
- Laughlin T, Tan Y, Jarrold B, et al. Autophagy activators stimulate the removal of advanced glycation end products in human keratinocytes. J Eur Acad Dermatol Venereol. 2020;34(Suppl 3):12–18.
- Yang Y, Shen F, Huang W, et al. Glucose is involved in the dynamic regulation of m6A in patients with type 2 diabetes. J Clin Endocrinol Metab. 2019;104(3):665–673.
- Yang Y, Hsu PJ, Chen YS, et al. Dynamic transcriptomic m(6)A decoration: writers, erasers, readers and functions in RNA metabolism. Cell Res. 2018;28(6):616–624.
- Xiao W, Adhikari S, Dahal U, et al. Nuclear m(6)A reader YTHDC1 regulates mRNA splicing. Mol Cell. 2016;61(4):507–519.
- Roundtree IA, Luo GZ, Zhang Z, et al. YTHDC1 mediates nuclear export of N(6)-methyladenosine methylated mRNAs. In: Elife. 2017. p. 6.
- Liu J, Dou X, Chen C, et al. N (6)-methyladenosine of chromosome-associated regulatory RNA regulates chromatin state and transcription. Science. 2020;367(6477):580–586.
- Wang X, Lu Z, Gomez A, et al. N6-methyladenosine-dependent regulation of messenger RNA stability. Nature. 2014;505(7481):117–120.
- Lee Y, Choe J, Park OH, et al. Molecular mechanisms driving mRNA degradation by m(6)A modification. Trends Genet. 2020;36(3):177–188.
- Huang H, Weng H, Sun W, et al. Recognition of RNA N(6)-methyladenosine by IGF2BP proteins enhances mRNA stability and translation. Nat Cell Biol. 2018;20(3):285–295.
- Zhou B, Liu C, Xu L, et al. N(6) -methyladenosine reader protein YT521-B homology domain-containing 2 suppresses liver steatosis by regulation of mRNA stability of Lipogenic Genes. Hepatology. 2021;73(1):91–103.
- Grammatikakis I, Abdelmohsen K, Gorospe M. Posttranslational control of HuR function. Wiley Interdiscip Rev RNA. 2017;8:1.
- Visvanathan A, Patil V, Arora A, et al. Essential role of METTL3-mediated m(6)A modification in glioma stem-like cells maintenance and radioresistance. Oncogene. 2018;37(4):522–533.
- Yue B, Song C, Yang L, et al. METTL3-mediated N6-methyladenosine modification is critical for epithelial-mesenchymal transition and metastasis of gastric cancer. Mol Cancer. 2019;18(1):142.
- Li Y, Xia L, Tan K, et al. N(6)-Methyladenosine co-transcriptionally directs the demethylation of histone H3K9me2. Nat Genet. 2020;52(9):870–877.
- Zhang J, Yang C, Wang C, et al. AGE-induced keratinocyte MMP-9 expression is linked to TET2-mediated CpG demethylation. Wound Repair Regen. 2016;24(3):489–500.