
ABSTRACT
Mitophagy is a selective autophagy mechanism for eliminating damaged mitochondria and plays a crucial role in the immune evasion of some viruses and bacteria. Here, we report that Mycobacterium bovis (M. bovis) utilizes host mitophagy to suppress host xenophagy to enhance its intracellular survival. M. bovis is the causative agent of animal tuberculosis and human tuberculosis. In the current study, we show that M. bovis induces mitophagy in macrophages, and the induction of mitophagy is impaired by PINK1 knockdown, indicating the PINK1-PRKN/Parkin pathway is involved in the mitophagy induced by M. bovis. Moreover, the survival of M. bovis in macrophages and the lung bacterial burden of mice are restricted by the inhibition of mitophagy and are enhanced by the induction of mitophagy. Confocal microscopy analysis reveals that induction of mitophagy suppresses host xenophagy by competitive utilization of p-TBK1. Overall, our results suggest that induction of mitophagy enhances M. bovis growth while inhibition of mitophagy improves growth restriction. The findings provide a new insight for understanding the intracellular survival mechanism of M. bovis in the host.
Abbreviations: BMDM: mouse bone marrow-derived macrophage; BNIP3: BCL2/adenovirus E1B interacting protein 3; BNIP3L/NIX: BCL2/adenovirus E1B interacting protein 3-like; BCL2L13: BCL2-like 13 (apoptosis facilitator); CCCP: carbonyl cyanide m-cholorophenyl hydrazone; FUNDC1: FUN14 domain-containing 1; FKBP8: FKBP506 binding protein 8; HCV: hepatitis C virus; HBV: hepatitis B virus; IFN: interferon; L. monocytogenes: Listeria monocytogenes; M. bovis: Mycobacterium bovis; Mtb: Mycobacterium tuberculosis; Mdivi-1: mitochondrial division inhibitor 1; PINK1: PTEN-induced putative kinase 1; TBK1: TANK-binding kinase 1; TUFM: Tu translation elongation factor, mitochondrial; TEM: transmission electron microscopy
Introduction
Mycobacterium bovis (M. bovis) is an ancient successful intracellular bacterium. It not only infects a range of animal species (i.e., cattle, other domestic hosts, and wildlife) and causes animal tuberculosis, but also infects humans through contaminated air and unpasteurized dairy products, causing tuberculosis [Citation1,Citation2]. As the first line of defense against Mycobacterium tuberculosis (Mtb) infection, macrophages also provide a major niche for persistent survival of Mtb in the host [Citation3]. Similar to Mtb, M. bovis also primarily infects macrophages after invading into the host. Upon Mtb infection, multiple cellular signaling pathways in macrophages are triggered to initiate specific immune responses for the elimination of invading pathogen [Citation3]. Xenophagy is one of the important innate immune mechanisms of macrophages to inhibit the intracellular survival of pathogens including Mtb [Citation4]. In turn, Mtb has developed numerous exquisite strategies to counteract the bactericidal activities of the host immune responses. Some of these mechanisms are mediated by factors released by Mtb, others rely on host components, which are used to facilitate the survival of Mtb and to avoid host immune clearance [Citation5]. Hence, studying how M. bovis exploits host components for immune evasion will contribute to a better understanding of the pathogenesis of M. bovis.
Mitophagy is a type of selective autophagy that targets damaged mitochondria. Mitophagy plays an important role in maintaining cellular homeostasis and sustaining organelles’ quality and function by clearing defective mitochondria [Citation6]. In recent years, increasing studies reported that some viruses can directly or indirectly trigger mitophagy, and regulate the mitophagy process through different strategies, thereby weakening the innate immune response and enabling the virus to promote continuous infection [Citation7]. Matrix protein M of human parainfluenza virus type 3 directly interact with TUFM (Tu translation elongation factor, mitochondrial) and autophagy protein LC3 to induce mitophagy, thereby inhibiting host type I interferon (IFN) response [Citation8]. Besides, hepatitis C virus (HCV) indirectly promotes mitophagy and inhibits host cell apoptosis via eliminating damaged mitochondria to facilitate virus survival and replication [Citation9]. In 2019, a study demonstrated that Listeria monocytogenes (L. monocytogenes) induced the oligomerization of NLRX1 to promote its LC3-interacting region motif to bind with MAP1LC3/LC3, thereby triggering mitophagy, disrupting host cell homeostasis to evade host killing [Citation10]. However, it is still unknown whether M. bovis induces host cell mitophagy.
Increasing evidence illustrated that the signaling pathways for the regulation of mitophagy are classified as ubiquitin-dependent or ubiquitin-independent. Ubiquitin-dependent process is a major mechanism underlying mitophagy, this process involves two key proteins: PINK1 (PTEN-induced putative kinase 1) and E3 ubiquitin ligase PRKN/Parkin, refer to as PINK1-PRKN-mediated mitophagy. Moreover, PINK1-PRKN-mediated mitophagy requires ubiquitin-binding autophagy receptors such as SQSTM1/p62 (sequestosome 1), OPTN (optineurin), and CALCOCO2/NDP52 (calcium binding and coiled-coil domain 2) [Citation11]. Conversely, SQSTM1, OPTN and CALCOCO2 are also involved in selective autophagy against intracellular microbes (xenophagy) [Citation12,Citation13]. Previous studies reported that autophagy adaptors are phosphorylated by TBK1 (TANK-binding kinase 1) and recruited to ubiquitinated bacteria or mitochondria to facilitate autophagosome formation during xenophagy and mitophagy [Citation14,Citation15]. Heo et al., observed that TBK1 activity was necessary for effective recruitment of OPTN and CALCOCO2 to damaged mitochondria. They demonstrate that although there is some functional redundancy among autophagy adaptors, efficient elimination of damaged mitochondria requires TBK1 and OPTN [Citation16]. Furthermore, recent study showed that TBK1-mediated phosphorylation of autophagy adaptors generates a signal amplification loop operating in mitophagy [Citation15]. In addition, it has been shown that STING1-mediated TBK1 activation is required for autophagy in response to Mtb DNA [Citation17]. Likewise, in our previous study, we observed that TBK1 silencing inhibits maturation of autophagosomes and increases M. bovis survival [Citation18]. The above studies suggest that TBK1 plays a key role in both mitophagy and xenophagy. However, the potential role of TBK1 molecule in the crosstalk between mitophagy and xenophagy during M. bovis infection is still unclear.
Early studies showed that some viruses or bacteria employ host mitophagy to survive [Citation8–10]. In addition, our previous study suggests that infection with M. bovis induces mitochondrial damage in macrophages [Citation19]. These published data drive us to investigate the following questions: 1) Does M. bovis induce mitophagy? 2) If it does, what role of mitophagy plays in the survival of M. bovis? And 3) What is the mechanism by which mitophagy affects the survival of M. bovis? Clarifying these questions will provide new insights for understanding the intracellular survival mechanism of M. bovis in the host.
In the current study, we found that M. bovis infection induced mitophagy in macrophages and the inhibition of mitophagy reduced the survival of M. bovis. Further, we demonstrated that the induction of mitophagy inhibited the xenophagy by competitive utilizing p-TBK1 during M. bovis infection. In vivo study, we observed that the inhibition of mitophagy mediated by inhibitor Mdivi-1 reduced the lung bacterial burden of M. bovis mice. Collectively, these results indicate that induction of mitophagy might be one of the strategies for M. bovis to evade the immune response. The findings provide a new insight for understanding the intracellular survival mechanism of M. bovis in the host.
Results
M. bovis infection induces mitophagy in murine macrophages
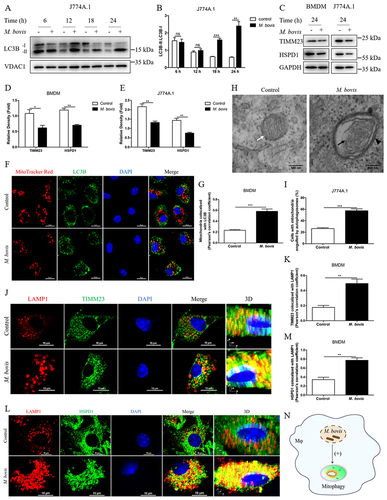
To investigate the induction of mitophagy during M. bovis infection in macrophages. We assessed the protein level of LC3B in mitochondrial fraction of M. bovis-infected J774A.1. We observed that a majority of LC3B protein enriched in the mitochondrial fraction of infected cells was LC3B-II at 18 and 24 h post-infection (,B). Moreover, we found that M. bovis induced a decrease in the protein levels of the mitochondrial inner membrane protein TIMM23 and matrix protein HSPD1/HSP60 in mouse bone marrow-derived macrophage (BMDM) and J774A.1 cells at 24 h post-infection (). Confocal microscopy analysis revealed that M. bovis infection increased the colocalization of mitochondria with endogenous LC3B in BMDM (). Transmission electron microscopy (TEM) showed that mitochondria with broken cristae were enclosed by a characteristic double-membrane autophagosomes in M. bovis-infected cells (). Mitochondria with intact cristae were distributed in the cytoplasm of uninfected cells (). To further strengthen this observation, we analyzed the colocalization of mitochondrial proteins and lysosome marker LAMP1 in BMDM by using confocal microscopy. The results showed that M. bovis infection obviously increased the colocalization of TIMM23 and LAMP1 (), as well as HSPD1 and LAMP1 (). Collectively, the above findings suggest that M. bovis infection induces mitophagy ().
Figure 1. M. bovis induces mitophagy in murine macrophages. (A) J774A.1 were infected with M. bovis (MOI = 10), cells were collected at 6, 12, 18, and 24 h post-infection and obtained mitochondrial fraction, the expression of LC3B in the mitochondrial fraction was detected by western blot. (B) Quantification of LC3-II:LC3B-I. (C-E) BMDM and J774A.1 were infected with M. bovis (MOI = 10), the protein expression levels of TIMM23 and HSPD1 were analyzed by western blot at 24 h post-infection. (F) Confocal microscopy analyzed the colocalization of endogenous LC3B (green) with mitochondria (red) in BMDM after M. bovis infection for 24 h at MOI of 10. Scale bar: 10 μm. (G) Quantification of Pearson’s colocalization coefficient between LC3B and mitochondria. (H) J774A.1 were fixed and processed for transmission electron microscope observation at 24 h after M. bovis (MOI = 10) infection, black arrow indicates damaged mitochondrion, black arrowhead indicates autophagosome with enclosing double membrane, white arrow indicates healthy mitochondrion. Scale bar: 500 nm. (I) Quantification of cells with autophagosome/autolysosome-engulfed mitochondria in H. Sixty cells were counted in each group from three different experiments. (J and L) Confocal microscopy analyzed the colocalization of the mitochondrial markers TIMM23 (green) and HSPD1 (green) with the lysosome marker LAMP1 (red) in BMDM after M. bovis infection for 24 h at MOI of 10. Scale bar: 10 μm. (K and M) Quantification of Pearson’s colocalization coefficient between mitochondrial proteins and LAMP1. (N) Schematic illustration of the results of Figure 1. Data shown as means ± SEM from three independent experiments. Statistical analysis was done by using Unpaired t-test (two-tailed). *p < 0.05, **p < 0.01, ***p < 0.001, ns, not significant.
PINK1-PRKN-mediated mitophagy is a major mechanism underlying mitophagy. PINK1 is usually cleaved by proteases in healthy mitochondria. However, following mitochondrial damage, the process of PINK1’s cleavage is abrogated and full-length PINK1 accumulates on the surface of mitochondria, then PINK1 recruits PRKN to the mitochondrial surface, thereby initiates mitophagy [Citation20]. Hence, we investigated the proteolysis of PINK1 and mitochondrial translocation of PRKN during M. bovis infection by utilizing purified mitochondrial fraction. As shown in , western blot analysis of M. bovis-infected cells exhibited an increase in full-length PINK1 and a decrease in cleaved-PINK1 level at 18 and 24 h post-infection (). We also observed that PRKN was highly enriched in the mitochondrial fraction of M. bovis-infected cells (). To exclude the possibility that the mitochondrial fraction may be contaminated by cytosolic components, we performed a western blot assay to detect cytosolic protein. The results revealed that cytosolic protein TUBA/α-tubulin was not detected in the mitochondrial fraction of the macrophages ().
Figure 2. M. bovis infection induces PINK1-PRKN-mediated mitophagy. (A) J774A.1 were infected with M. bovis (MOI = 10), cells were collected at 6, 12, 18, and 24 h post-infection and obtained mitochondrial fraction, the protein expression of full-length PINK1, cleaved-PINK1 and PRKN in the mitochondrial fraction were detected by western blot. (B) Quantification of full-length PINK1 expression. (C) Quantification of cleaved-PINK1 expression. (D) Quantification of PRKN expression. (E) Mitochondrial and cytosolic fractions were blotted using the indicated antibodies. (F) BMDM were transfected with Pink1 siRNA (25 nM) and negative control siRNA (25 nM) for 48 h and then infected with M. bovis (MOI = 10), the protein level of PINK1 was detected by western blot at 24 h post-infection. (G) Quantification of PINK1:GAPDH. (H) BMDM were transfected with Pink1 siRNA (25 nM) and negative control siRNA (25 nM) for 48 h and then infected with M. bovis (MOI = 10), the colocalization of LC3B (red) with mitochondrial marker HSPD1 (green) was analyzed by confocal microscopy at 24 h post-infection. Scale bar: 10 μm. (I) Quantification of Pearson’s colocalization coefficient between LC3B and HSPD1. (J) The colocalization of LAMP1 (red) with mitochondrial marker HSPD1 (green) was analyzed by confocal microscopy at 24 h post-infection. Scale bar: 10 μm. (K) Quantification of Pearson’s colocalization coefficient between LAMP1 and HSPD1. (L) Schematic illustration of the results of Figure 2. Data are representatives from at least three independent experiments (mean ± SEM). Unpaired t-test (two-tailed) was used to measure significance. **p < 0.01, ***p < 0.001, ns, not significant.
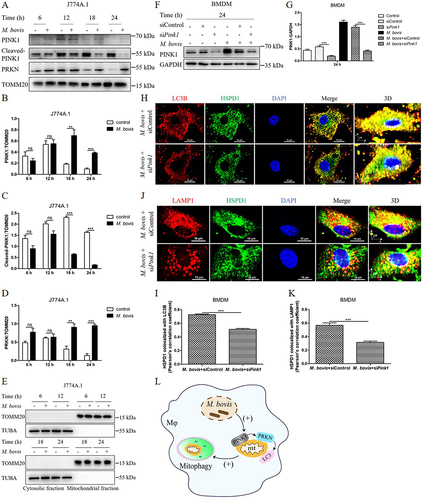
Next, to further determine the role of the PINK1 in M. bovis-induced mitophagy, we used small interference RNA (siRNA) to knockdown the expression of PINK1 in BMDM (Fig. S1A and S1B). After transfection with Pink1 siRNA (25 nM) and negative control siRNA (25 nM) for 48 h, BMDM were infected with M. bovis, we observed the protein expression level of PINK1 significantly decreased at 24 h post-infection (). Meanwhile, we detected the cell viability of macrophages transfected with different concentrations of Pink1 siRNA. The data showed that the cell viability did not significantly reduce even if transfected with 100 nM Pink1 siRNA (Fig. S1C). Furthermore, after transfection with Pink1 siRNA for 48 h, BMDM were infected with M. bovis, we observed the colocalization of mitochondria with LC3B and lysosome marker LAMP1 at 24 h post-infection. Confocal microscopy analysis revealed that the colocalization of HSPD1 and LC3B was reduced after downregulating PINK1 expression (). Similarly, the colocalization of HSPD1 and LAMP1 in BMDM transfected with Pink1 siRNA was also decreased (). Altogether, these results indicate that PINK1-PRKN pathway involves in the mitophagy induced by M. bovis ().
M. bovis induces mitophagy to promote its intracellular survival
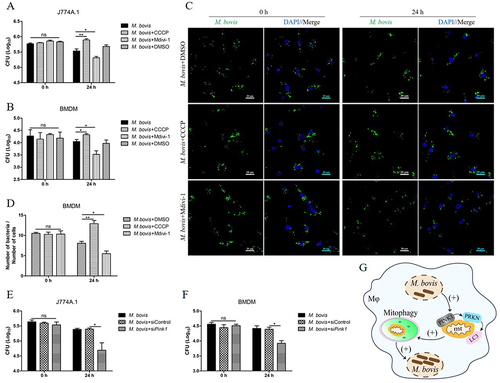
To evaluate the effect of mitophagy on the intracellular survival of M. bovis. We treated cells with carbonyl cyanide m-cholorophenyl hydrazone (CCCP) and mitochondrial division inhibitor 1 (Mdivi-1) for the induction or inhibition of mitophagy respectively as described previously [Citation10,Citation21–23]. We first assessed the viability of cells after treatment with different concentrations of CCCP (Fig. S2A) and Mdivi-1(Fig. S2B) and then verified the effect of CCCP and Mdivi-1 treatment on the lipidation LC3B in uninfected macrophages (Fig. S2C and S2D). Next, J774A.1 and BMDM were treated with DMSO (0.2%), CCCP (10 μM) and Mdivi-1 (20 μM) for 2 h and then infected with M. bovis. At 24 h post-infection, we found that Mdivi-1 suppressed while CCCP increased the total viable count of M. bovis in both J774A.1() and BMDM (). To further verify this observation, we analyzed the number of M. bovis in BMDM at 0 h and 24 h after infection by using confocal microscopy. The results revealed that there was no significant difference in the number of M. bovis in each group at 0 h post-infection, while the number of M. bovis was enhanced by CCCP treatment and was reduced by Mdivi-1 treatment in BMDM (). Moreover, J774A.1 and BMDM were transfected with Pink1 siRNA (25 nM) and negative control siRNA (25 nM) for 48 h, then infected with M. bovis. At 24 h post-infection, we observed that knockdown PINK1 expression notably inhibited the intracellular survival of M. bovis (). These results suggest that M. bovis-induced mitophagy is beneficial for its intracellular survival ().
Figure 3. The induction of mitophagy enhances the intracellular survival of M. bovis. (A and B) J774A.1 and BMDM were treated with DMSO (0.2%), CCCP (10 μM) or Mdivi-1 (20 μM) for 2 h and then infected with M. bovis at MOI of 10 for 24 h. Intracellular M. bovis load were measured by colony-forming units (CFU). (C) BMDM were treated with DMSO (0.2%), CCCP (10 μM) or Mdivi-1 (20 μM) for 2 h, then infected with M. bovis (MOI = 10). Intracellular M. bovis load was analyzed by confocal microscopy at 0 h and 24 h post-infection. (D) The ratio of bacteria number to cells number. One hundred cells in 10 fields were counted in each group. (E and F) J774A.1 and BMDM were transfected with Pink1 siRNA (25 nM) and negative control siRNA (25 nM) for 48 h and then infected with M. bovis (MOI = 10). Intracellular M. bovis load were measured by CFU at 0 h and 24 h post-infection. (G) Schematic illustration of the results of Figure 3. Data shown as means ± SEM from three independent experiments. Statistical analysis was done by using Unpaired t-test (two-tailed). *p < 0.05, **p < 0.01, ns, not significant.
Induction of mitophagy by M. bovis prevents xenophagy in macrophage
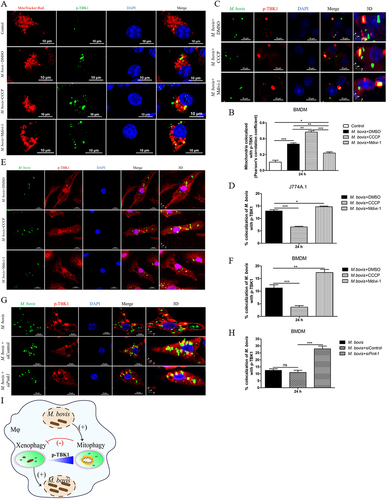
Xenophagy is a crucial immune defense mechanism in macrophage against intracellular bacteria [Citation24]. Hence, we investigated the effect of mitophagy activation on xenophagy during M. bovis infection. First, the colocalization of LC3B and mitochondria after CCCP or Mdivi-1 treatment was analyzed by using confocal microscopy. We found that M. bovis-induced increase in the colocalization of LC3B and mitochondria could be blocked by Mdivi-1 (,B), proving that Mdivi-1 can inhibit mitophagy. CCCP treatment significantly enhanced the colocalization of LC3B and mitochondria induced by M. bovis (), indicating that CCCP can activate mitophagy. Next, we observed the colocalization of LC3B and LAMP1 with M. bovis. Confocal microscopy analysis revealed that Mdivi-1 enhanced while CCCP suppressed the colocalization of LC3B and LAMP1 with M. bovis (). To further strengthen this observation, we observed the colocalization of LAMP1 with M. bovis in BMDM transfected with Pink1 siRNA. The results showed that knockdown PINK1 expression increased the colocalization of LAMP1 and M. bovis (). These data suggest that M. bovis induces mitophagy to suppress xenophagy ().
Figure 4. The induction of mitophagy inhibits the host xenophagy which targets to degrade M. bovis. (A) Confocal microscopy analysis of LC3B (green) colocalization with mitochondria (MitoTracker red) in BMDM treated with DMSO (0.2%), CCCP (10 μM) or Mdivi-1 (20 μM) for 2 h and then infected with M. bovis (MOI = 10) for 24 h. Scale bar: 10 μm. (B) Quantification of Pearson’s colocalization coefficient between LC3B and mitochondria. (C) Confocal microscopy analysis of LC3B (red) colocalization with M. bovis (green) in J774A.1. Scale Bar: 10 µm. (D) The percentage of the colocalization of M. bovis with LC3B. (E) The colocalization of LAMP1 (red) with M. bovis (green) was analyzed by confocal microscopy at 24 h post-infection. Scale bar: 20 μm. (F) The percentage of the colocalization of M. bovis with LAMP1. (G) BMDM were transfected with Pink1 siRNA (25 nM) and negative control siRNA (25 nM) for 48 h and then infected with M. bovis (MOI = 10). Confocal microscopy analysis of LAMP1 (red) colocalization with M. bovis (green) at 24 h post-infection. Scale Bar: 10 µm. (H) The percentage of the colocalization of M. bovis with LAMP1 in G. (I) Schematic illustration of the results of Figure 4. Data are representatives from three independent experiments (mean ± SEM). The data was analyzed by using Unpaired t-test (two-tailed). *p < 0.05, **p < 0.01, ***p < 0.001. ns, not significant.
M. bovis-induced mitophagy to suppress xenophagy by competitive utilizing p-TBK1 in macrophages
Next, we sought to examine the interconnecting key elements between mitophagy and xenophagy during M. bvois infection. Mitophagy and xenophagy are both selective autophagy, the two processes both require the autophagy adaptors such as SQSTM1, OPTN and CALCOCO2 [Citation11,Citation12,Citation25]. Previous studies show that TBK1 activity is necessary for efficient recruitment of autophagy adaptors to ubiquitinated bacteria and damaged mitochondria [Citation15–18]. Therefore, we further investigated whether p-TBK1 might be a crucial molecule competed by mitophagy and xenophagy during M. bovis infection. Firstly, we conducted confocal microscopy to observe the colocalization of p-TBK1 with mitochondria in BMDM. We found that M. bovis-induced increase in the colocalization of p-TBK1 with mitochondria could be promoted by CCCP and blocked by Mdivi-1 (), proving that the recruitment of p-TBK1 to mitochondrial induced by M. bovis is due to induction of mitophagy. Next, we analyzed the colocalization of p-TBK1 and M. bovis in J774A.1 and BMDM. Confocal microscopy analysis revealed that the colocalization of p-TBK1 and M. bovis could be inhibited by CCCP and increased by Mdivi-1 treatment both in J774A.1() and BMDM (). To further validate this observation, we observed the colocalization of p-TBK1 and M. bovis in BMDM transfected with Pink1 siRNA. We found that the colocalization of p-TBK1 and M. bovis was remarkable increased after down-regulating PINK1 expression (). Taken together, our data suggest that mitophagy suppresses xenophagy by competitive utilizing p-TBK1 in macrophages infected with M. bovis ().
Figure 5. The activation of mitophagy decreases the colocalization of M. bovis with p-TBK1. (A) Confocal microscopy analysis of p-TBK1 (green) colocalization with mitochondria (MitoTracker red) in BMDM treated with DMSO (0.2%), CCCP (10 μM) or Mdivi-1 (20 μM) for 2 h and then infected with M. bovis (MOI = 10) for 24 h. Scale bar: 10 μm. (B) Quantification of Pearson’s colocalization coefficient between p-TBK1 and mitochondria. (C and E) J774A.1 and BMDM were treated with DMSO (0.2%), CCCP (10 μM) or Mdivi-1 (20 μM) for 2 h and then infected with M. bovis (MOI = 10) for 24 h. The colocalization of M. bovis (green) with p-TBK1 (red) was analyzed by confocal microscopy. Scale bar: 10 µm. (D and F) The percentage of the colocalization of M. bovis with p-TBK1. (G) BMDM were transfected with Pink1 siRNA (25 nM) and negative control siRNA (25 nM) for 48 h, then infected with M. bovis (MOI = 10). Confocal microscopy analysis of p-TBK1 (red) colocalization with M. bovis (green) at 24 h post-infection. Scale Bar: 10 µm. (H) Quantification of G. (I) Schematic illustration of the results of Figure 5. Data are representative of three independent experiments and are shown as the mean ± SEM. Unpaired t-test (two-tailed) was used to measure significance. *p < 0.05, **p < 0.01, ***p < 0.001. ns, not significant.
The effect of mitophagy on the severity of M. bovis pathogenesis in mice
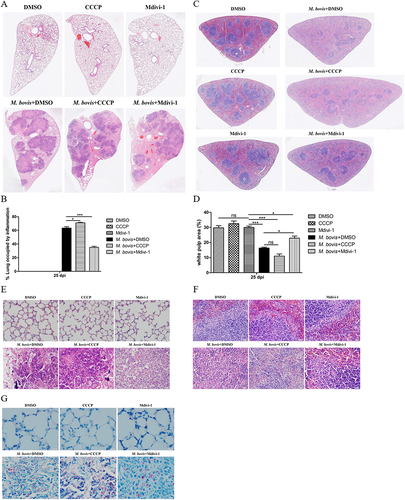
Our in vitro experiments revealed that the induction of mitophagy inhibits the bactericidal ability of macrophages to eliminate intracellular M. bovis. Next, we infected mice with pathogenic M. bovis and after one week of infection, mice were continuously treated with DMSO (10%, diluted in PBS) or Mdivi-1 (25 mg/kg body weight) or CCCP (5 mg/kg body weight) via intraperitoneal (i.p.) route for 14 days. Mice were sacrificed at 25 days after infection (). The body weight and the weight of lungs and spleens of mice revealed that CCCP continuous injection exacerbated the degree of pathogenesis of M. bovis, while Mdivi-1 continuous injection alleviated the degree of pathogenesis of M. bovis in mice compared to DMSO treated mice (). In addition, gross pathological observation showed that CCCP aggravated the development of lesions in the lungs of infected mice as compared to the DMSO and Mdivi-1 treated mice, lungs of CCCP-treated mice with M. bovis infection presented large and fused nodular lesions (). Similarly, M. bovis-infected mice with CCCP continuous injection showed enlarged spleen compared to mice treated with DMSO and Mdivi-1 (). Consistent with in vitro results, we found that lung bacterial load was reduced by Mdivi-1 continuous injection and increased by CCCP continuous injection (). Histopathological observation, quantitative analysis of the inflammation area of left lung’s lobe of infected mice revealed that CCCP continuous injection significantly increased the percentage of inflammation area. Mdivi-1 continuous injection obviously reduced the area percentage of lung occupied by inflammatory lesions compared to DMSO treatment group (,B). Furthermore, we observed that although the areas of spleens white pulp of all infected mice were reduced compared to uninfected mice, the areas of white pulp of infected mice with Mdivi-1 continuous injection were significantly increased compared to M. bovis-infected mice treated with DMSO (). At high magnification, lung lesions from CCCP treated mice showed necrosis and calcification (), the white pulp and red pulp of spleens were replaced by lots of macrophages, epithelioid cells and lymphocytes (). In addition, a clearly inflammatory foci were observed in the liver sections of mice treated with CCCP (Fig. S3A), indicating the lesions were more severe in CCCP continuous injection group. Interestingly, lung sections from Mdivi-1-treated mice showed comparatively less severe lesions with reduced necrosis (). In addition, a significant increase in the dissemination of M. bovis bacilli were observed in the Ziehl-Neelsen stained sections of lung from mice treated with CCCP in comparison to DMSO and Mdivi-1 treated mice (). Moreover, we observed that the protein level of HSPD1 of the lung of M. bovis-infected mice was reduced by CCCP injection and was increased by Mdivi-1 injection, compared with DMSO treatment (Fig. S4A and S4B), indicating CCCP injection can induce mitophagy and Mdivi-1 injection can inhibit mitophagy of mice. Notably, no histological lesions were observed in the H&E staining sections of kidneys, heart and small intestine of DMSO, CCCP, and Mdivi-1 treated mice (Fig. S3B-D). Collectively, these findings suggest that the severity of mice pathological lesions caused by M. bovis infection could be exacerbated by CCCP continuous injection and alleviated by Mdivi-1 continuous injection.
Figure 6. The effect of mitophagy on the severity of M. bovis pathogenesis in mice. (A) C57BL/6 mice were infected with M. bovis at 200 CFU via the intranasal route, after 7 days of infection, mice were treated with DMSO (n = 5) (10%) or Mdivi-1(n = 5) (25 mg/kg body weight) or CCCP (n = 5) (5 mg/kg body weight) via intraperitoneal (i.p.) injection for 14 days. On days 25 after infection, animals were sacrificed and different organs were collected. (B) The change of body weight of uninfected and M. bovis-infected mice. (C and D) The ratio of lung and spleen weight to the total body weight were calculated at day 25 post-infection. (E and F) The representative images of lung and spleen showed the gross pathological changes of uninfected and M. bovis-infected mice. (G) Lung bacterial burdens were determined at day 25 post infection by plating lung homogenates on 7H10 agar plates. Statistical significance was determined by using Unpaired t-test (two-tailed). *p < 0.05, **p < 0.01, ***p < 0.001, ns, not significant.
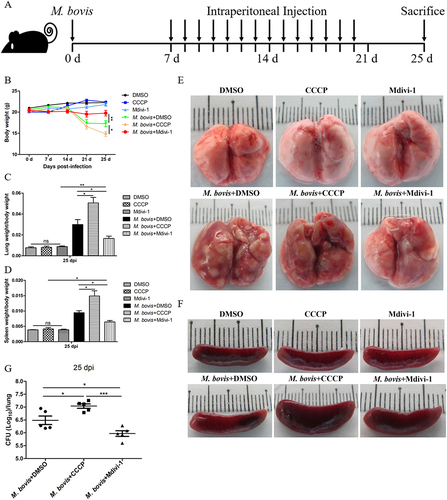
Figure 7. The effect of mitophagy on the histopathological lesions of lung and spleen in M. bovis-infected mice. (A) The representative images of left lung lobe showed histopathological changes of uninfected and M. bovis-infected mice. (B) The percentage of lung’s area occupied by inflammatory lesions were quantified by Image J software. (C) The representative histopathological changes in the spleen tissues of uninfected and M. bovis-infected mice. (D) The percentage area of white pulp of spleen was measured by Image J software. (E and F) Higher magnification of H&E staining sections of lung and spleen showed M. bovis induced lesions. Scale bar: 20 µm. (G) M. bovis (red color) in the lung sections were indicated by Ziehl-Neelsen staining. Scale bar: 10 µm. Statistical analysis was done by using Unpaired t-test (two-tailed). *p < 0.05, ***p < 0.001, ns, represent not significant.
Discussion
In recent years, accumulating evidences suggest that mitophagy is regulated by various pathogens in an attempt to deviate the protective immune response of the host and to establish an infection [Citation26]. It has been reported that some pathogens can directly or indirectly trigger mitophagy, including hepatitis B virus (HBV) [Citation27], human parainfluenza virus type 3 [Citation8], human herpesvirus 8 [Citation28], and L. monocytogenes [Citation10]. Here, we demonstrate that M. bovis also can induce mitophagy in murine macrophages. This was shown by an increased accumulation of lipidated LC3B in mitochondrial fraction and a significant increase in the colocalization of mitochondria with LC3B and LAMP1 in M. bovis-infected BMDM. To further enhance our observation, we conducted transmission electron microscopy of M. bovis-infected cells. The ultrastructural analysis clearly shows that M. bovis induces the formation of mitophagosomes in infected macrophages. This finding fills a research gap in the study of mitophagy in Mycobacterium infection and enriches research data on pathogen-induced mitophagy.
In general, mitophagy regulatory pathways are classified as ubiquitin-dependent (PINK1-PRKN-mediated) or ubiquitin-independent (receptor-dependent) [Citation29]. PINK1-PRKN-mediated pathway is a major mechanism for the regulation of mitophagy. Additionally, several LC3-interacting region containing mitophagy receptors also directly induce ubiquitin-independent mitophagy, including BNIP3 (BCL2/adenovirus E1B interacting protein 3) [Citation30], BNIP3L/NIX (BCL2/adenovirus E1B interacting protein 3-like) [Citation31], FUNDC1 (FUN14 domain-containing 1) [Citation32], BCL2L13 (BCL2-like 13(apoptosis facilitator)) [Citation33], and FKBP8 (FKBP506 binding protein 8) [Citation34] in mammals. Early studies reported that HBV and HCV induced PRKN-dependent mitophagy [Citation9,Citation27]. Measles virus of the Edmonston strain triggered SQSTM1-mediated mitophagy [Citation35]. While matrix protein M of human parainfluenza virus type 3 directly interact with TUFM and LC3 to induce PINK1-PRKN-independent mitophagy [Citation8]. Furthermore, L. monocytogenes induced mitophagy neither use the PINK1-PRKN pathway nor require ubiquitin-independent mitophagy receptors (BNIP3L, BNIP3 and FUNDC1), however, it requires NLRX1, a novel mitophagy receptor for the induction of mitophagy [Citation10]. While human herpesvirus 8 activated mitophagy is BNIP3L-mediated mitophagy [Citation28]. The above studies suggested that the mechanism of mitophagy induced by various nature of pathogens is different and the molecular mechanism of mitophagy is complex. It has been shown that HCV and HBV infection stimulated the gene expression of PRKN, PINK1, and induced the recruitment of PRKN to the mitochondria [Citation9,Citation27]. In our study, western blot analysis revealed that the accumulation of full-length PINK1 on mitochondria was significantly increased at 24 h after M. bovis infection, and the recruitment of PRKN to mitochondria was also obviously augmented. Confocal microscopy analysis indicated that the colocalization of mitochondrial protein HSPD1 with LC3B and LAMP1 were both significantly reduced in BMDM transfected with Pink1 siRNA with infection of M. bovis. Since we observed that the colocalization of mitochondria with LC3B and LAMP1 was significantly reduced but not completely blocked after down-regulating PINK1 expression, Hence, although our results indicate that the PINK1-PRKN pathway is involved in the mitophagy induced by M. bovis, it does not exclude the possibility that other ubiquitin-independent autophagy pathway might involve in M. bovis-induced mitophagy. In the current study, we mainly focus on the role of mitophagy in the pathogenesis of M. bovis.
Here, we found that CCCP treatment obviously enhanced while Mdivi-1 treatment reduced the survival of intracellular M. bovis in J774A.1 and BMDM. Our findings are consistent with a previous study reported that Mdivi-1 reduced while CCCP increased L. monocytogenes survival in mouse peritoneal macrophages [Citation10]. M. bovis and L. monocytogenes both are intracellular bacteria, studying how these intracellular pathogens employ host cell mitophagy pathways is central to understanding infectious disease. In line with the results of mitophagy inhibitor Mdivi-1treatment, we found that siRNA-mediated PINK1 knockdown also decreased the intracellular survival of M. bovis. The data indicate that induction of mitophagy is beneficial to the intracellular survival of M. bovis. Moreover, the intracellular survival of M. bovis did not increase in J774A.1 and BMDM without inhibitor treatment and Pink1 siRNA transfection, this is due to although M. bovis utilizes numerous exquisite strategies (such as induces mitophagy, inhibits phagosome maturation [Citation36], and induces detrimental type I IFN secretion [Citation37]) to evade or circumvent host immune responses, the host also initiates multiple protective immune responses to kill the pathogen [Citation38].
Some studies have shown that viruses control the mitophagy process through different strategies to favor viral proliferation and persistent infection [Citation7]. Although different pathogens tend to exploit similar pathways in the host for immune evasion, the mechanism in which they employ host pathways usually differs [Citation39]. HBV and HCV induced mitophagy to prevent host cell apoptosis to facilitate virus survival and persistent infection [Citation9,Citation27]. Measles virus of the Edmonston strain triggers SQSTM1-mediated mitophagy to suppress type I IFN production to enhance viral replication [Citation35]. And, L. monocytogenes induced mitophagy decreases mitochondrial ROS production to promote its survival [Citation10]. Notably, we observed that the induction of mitophagy suppressed the colocalization of LC3B and LAMP1 with M. bovis by using confocal microscopy, suggesting that M. bovis induces mitophagy to promote its intracellular survival by inhibiting xenophagy. Further, our results speculate that there may exist crosstalk between mitophagy and xenophagy because both are selective autophagy.
TBK1 is an important signaling molecule in cells that promotes the response to pathogens infection by phosphorylating IRF3 to trigger IFN production and recruitment of autophagy adaptors for selective autophagy regulation [Citation40]. Recently, a study demonstrated that TBK1 was activated during xenophagy and mitophagy, and that the activation of TBK1was regulated by TBC1D9 (TBC1 domain family member 9), a novel regulator of autophagy [Citation41]. Notably, in our previous study, we found that M. bovis infection of murine macrophages increased the Mir199a expression which dampened TBK1 expression resulting in decreased xenophagy and increased M. bovis survival in the infected cells [Citation18]. Above previous studies show that TBK1 plays an important role in the xenophagy. Interestingly, we found that the activation of mitophagy significantly reduced the colocalization of p-TBK1 with M. bovis, and inhibition of mitophagy increased the colocalization of p-TBK1 with M. bovis. This finding suggests that TBK1 is a key molecule competed by xenopahgy and mitophagy during M. bovis infection. The increase in Mir199a expression and the induction of mitophagy are both immune evasion strategies adopted by M. bovis to prevent xenophagy by reducing the colocalization with p-TBK1.
Previous study has shown that Mdivi-1 suppresses while CCCP increases L. monocytogenes titer in both liver and spleen of infected mice [Citation10]. Similarly, we found that CCCP treatment increased while Mdivi-1 treatment reduced M. bovis load in the lungs of infected mice. We try to observe the bacterial load in the lungs of pink1 KO mice. Owing to the 12-week age difference between the pink1 KO mice, resulting in large differences within the group and no statistical difference was observed, but the bacterial load in the lungs still showed the decreasing tendency (Fig. S5). In addition to age differences, we cannot exclude the possibility of other mechanisms of mitophagy participating besides PINK1-PRKN-mediated signaling. Furthermore, we observed that the inhibition of mitophagy caused by Mdivi-1 treatment or Pink1 siRNA transfection consistently increased the xenophagy of the host and reduced the intracellular survival of M. bovis. In addition, we observed that Mdivi-1treatment alleviates the severity of lesions in the lung and spleen of mice infected with M. bovis. Meanwhile, we found no toxic effects of CCCP or Mdivi-1 treatment in the liver and kidney of uninfected mice. The results from in vivo studies provide persuasive evidence that the induction of mitophagy by M. bovis is beneficial for its pathogenesis and persistent survival. Thus, anti-tuberculosis drugs combine with mitophagy inhibitors (e.g., Mdivi-1) might provide a useful new insight for developing efficient therapeutic strategies against M. bovis infection.
In conclusion, our results indicate that M. bovis infection induces mitophagy in murine macrophages, and induction of mitophagy enhances M. bovis growth while inhibition of the mitophagy improves growth restriction. Meanwhile, this study provides a unique insight into the probable involvement of M. bovis-induced mitophagy in facilitating the pathogenesis of tuberculosis. Collectively, these findings provide a new insight for understanding the intracellular survival mechanism of M. bovis in the host.
Materials and methods
Ethics statement
All experiments protocols and procedures were carried out according to the protocols for the care of laboratory animals, Ministry of Science and Technology People’s Republic of China, and approved according to animal care and use committee (IACUC) protocols (20,110,611–01) at the China Agricultural University, Beijing. Animal experiments proposal was approved by The Laboratory Animal Ethical Committee of China Agricultural University (AW02110202-2).
Reagents and antibodies
Chemical reagents used in this study were CCCP (C2759) from Sigma-Aldrich and Mdivi-1 (BMLCM127-0050) from Enzo Life Sciences. Primary antibodies used in the current study including: Anti-PINK1 (BC100-494) antibody was purchased from Novus Biologicals; Rabbit anti-PRKN/Parkin polyclonal antibody (14,060-1-AP), TIMM23 monoclonal antibody (67,535-1-Ig), HSPD1 monoclonal antibody (66,041-1-Ig), rabbit anti-TOMM20 polyclonal antibody (11,802-1-AP), VDAC1/Porin polyclonal antibody (55,259-1-AP), anti-GAPDH rabbit polyclonal antibody (10,494-1-AP) and LC3B-specific antibody (18,725-1-AP) were purchased from Proteintech; Anti-phospho-TBK1/NAK (Ser172) (D52 C2) antibody (5483) was obtained from Cell Signaling Technology; Rabbit polyclonal TUBA/α-tubulin antibody (AF0001) and PINK1 rabbit polyclonal antibody (AF7755) were purchased from Beyotime biotechnology, the rabbit anti-LC3B antibody (L7543) was purchased from Sigma-Aldrich, rabbit anti-LAMP1 antibody (ab24170) was purchased from Abcam. Other reagents: recombinant murine CSF1/M-CSF (315–02) was purchased from Peprotech Technology; cell mitochondria isolation kit (C3601) was obtained from Beyotime biotechnology; MitoTrackerTM Red CMXRos (M7512) and Alexa FluorTM 488 caboxylic acid succinimidyl ester (A20000) were purchased from Invitrogen. On-target plus mouse Pink1 siRNA (Gene ID: 68,943) was purchased from Horizon Discovery. HiperFect Transfection Reagent (301,705) was obtained from Qiagen. BBL Middlebrook OADC enrichment (211,886) was purchased from Becton, Dickinson and company. Alexa Fluor 488 AffiniPure donkey anti-rabbit IgG (H + L) (34206ES60), Alexa Fluor 488 AffiniPure donkey anti-mouse IgG (H + L) (34106ES60), Alexa Fluor 594 AffiniPure donkey anti-rabbit IgG (H + L) (33112ES60) were purchased from Yeasen.
Cells culture
We used murine macrophages (J774A.1 and BMDM) in the present experiments. J774A.1 were obtained from Cell Culture Center, Xiehe Medical University (Beijing China). J774A.1 were cultured in cell culture flask in DMEM supplemented with 10% FBS and 1% penicillin-streptomycin at 37°C in 5% CO2 incubator. BMDM were prepared and cultured as described previously [Citation42]. In brief, BMDM were isolated from femurs and tibias of 6–8 weeks old C57BL/6 mice, and were cultured in RPMI 1640 basic medium (ThermoFisher scientific, C22400500BT) supplemented with 10 ng/ml of CSF1/M-CSF, 10% FBS and 1% penicillin-streptomycin. The primary macrophages (BMDM) were cultured in round shape cell culture dish. After 5–7 days of culture, the adherent BMDM were collected for further experiments. Cells were transferred to cell culture plates for 12–16 h before experiments.
Bacterial culture and infection
We used M. bovis C68004 strain in our current study. The C68004 strain of M. bovis was obtained from the China Institute of Veterinary Drug Control (CVCC, China) and was maintained in DifcoTM Middlebrook 7H9 broth (Becton, Dickinson and Company, 271,310) supplemented with 10% oleic acid-albumin-dextrose-CAT (catalase) (OADC) (Becton, Dickinson and Company, 212,351), 0.05% Tween-80 (Sigma, P1754) and sodium pyruvate (Biodee, DE-0342A) at 4 mg/mL at 37°C [Citation43]. The bacteria were grown for 2–3 weeks before being used for cell infection. BMDM and J774A.1 were seeded in 24-well plates (1 × 10⁵ cells/well) for 12–16 h. After that, macrophages were infected at a multiplicity of infection (MOI) 10:1 (bacteria/cell) with live M. bovis in the antibiotic-free cell culture medium. Following incubation for 4 h at 37°C with 5% CO2, each well was washed three times with warm sterile phosphate-buffered saline (PBS; Solarbio, P1020) to remove the extracellular bacteria. After washing, cells were cultured in fresh DMEM or RPMI 1640 basic medium supplemented with 2% FBS for the specified time periods.
Animal model of infection
Animal model 1: six- to eight-weeks-old female C57BL/6 mice (n = 36) were purchased from SPF (Beijing) Biotechnology Co.,Ltd and housed in the biosafety level III laboratory animal facility of China Agricultural University. Mice were first randomly divided into two groups: one group of mice were intranasally (i.n.) treated with PBS considered as control group, another group of mice were infected intranasally with 200 viable colony-forming units (CFUs) of M. bovis referred to as the infected group. Next day, three infected mice were sacrificed for evaluation of viable bacteria in the lungs. Here, we observed an average of 167 CFU on day one post-infection (Fig. S4C). After seven days, control group mice were randomly divided into 3 groups: (1) mice were intraperitoneal (i.p) injected with 50 µl dimethyl sulfoxide (DMSO) which was diluted in PBS (making the final concentration of 10%), (2) mice were injected i.p. with CCCP at a dose of 5 mg/kg body weight, (3) mice were injected i.p. with 25 mg/kg body weight Mdivi-1. Similarly, M. bovis-infected mice were also divided into 3 groups and injected i.p. with DMSO, CCCP, or Mdivi-1. The dose for CCCP and Mdivi-1 used in our current animal study was reported by previous studies [Citation10,Citation21–23]. The body weight of mice in all experimental groups were calculated on weekly basis.
Animal model 2: six- to eight-weeks-old female C57BL/6 mice were purchased from SPF (Beijing) Biotechnology Co., Ltd. pink1 KO mice were previously described [Citation44,Citation45]. The mice were housed in the biosafety level III laboratory animal facility of China Agricultural University. Wild-type mice were randomly divided into two groups: one group of mice were intranasally (i.n.) treated with PBS considered as control group, another group of mice and pink1 KO mice were infected intranasally with 200 viable CFUs of M. bovis called as infected group. After M. bovis infection for 24 h, one mouse in each infection group was sacrificed randomly, lung bacterial burdens were determined by plating lung homogenates on 7H10 agar plates (Becton, Dickinson and Company, 262,710). We observed an average of 210 CFU on day one post-infection (Fig. S6). On days 25 after infection, animals were sacrificed and different organs were collected.
Transmission electron microscopy
J774A.1 were infected with M. bovis for the indicated time period and then washed twice with PBS before collecting. After harvesting, the cells were fixed in 2.5% glutaraldehyde in 0.1 M sodium cacodylate buffer (pH 7.4) for 1 hour at 4°C. The cells were rinsed in sodium cacodylate buffer and then fixed in 1% osmium tetroxide for 1 h followed by dehydration with acetone. The cells pellet was infiltrated with resin (EM-bed 812; Electron Microscopy Sciences, 14,900) and polymerized overnight at 60°C. After that, 70-nm ultrathin sections were obtained on a Leica Ultracut UCT ultramicrotome (Vienna) and contrast stained use uranyl acetate and lead citrate [Citation46]. Finally, the samples were observed under transmission electron microscopy (Hitachi Limited) and captured the images.
siRNA transfection
Mouse Pink1-targeting siRNA oligonucleotides (ON-TARGET plus SMART pool) were from Horizon Discovery. The sequences of each siRNA oligonucleotide are as follows:
mPink1 J-044666-05, 5ʹ-GCGAAGCCAUCUUAAGCAA-3ʹ;
mPink1 J-044666-06, 5ʹ-GUACACUGUUCCUCGUUAU-3ʹ;
mPink1 J-044666-07, 5ʹ-GAUGAUCGCCUGGCUCUUG-3ʹ;
mPink1 J-044666-08, 5ʹ-GGCCAUCGCCUAUGAAAUC-3ʹ.
Cells were allowed to attach overnight in 24-well plates at a density of 1 × 10⁵ cells each well. The following day, Pink1 siRNA and negative control siRNA were transfected into J774A.1 and BMDM cells at 25 nM final concentration using HiperFect Transfection Reagent according to the manufacturer’s instructions. The transfection medium was replaced with fresh complete medium after 24 h to reduce cytotoxicity. The cells were transfected for 48 h before next experiment. The efficiency of PINK1 silencing was quantified via western blot analysis.
Immunofluorescence assay
BMDM and J774A.1 cells were grown on coverslips in 24-well cell culture plates overnight. The cells were treated with DMSO (0.2%), CCCP (10 μM), or Mdivi-1 (20 μM) for 2 h, or transfected with Pink1 siRNA (25 nM) and negative control siRNA (25 nM) for 48 h, and then infected with M. bovis (MOI = 10). After 4 h of infection, the cells were washed with warm PBS thrice and incubated in fresh medium for indicated time periods. Cells were washed twice with PBS and then fixed with 4% paraformaldehyde for 30 min, then permeabilized with immunostaining permeabilization buffer with X-100 (Beyotime biotechnology, P0096) for 5–10 min at room temperature. The blocking of the cells was done with Immuno-staining Blocking Buffer (Beyotime biotechnology, P0102) for 1 h at room temperature and then incubated with indicated primary antibodies for overnight at 4°C [Citation46]. After rinsing in PBS, cells were stained with secondary antibodies for 1 h at 37°C, and washed with PBS for five times, 5 min each. After, washing the coverslips were mounted on microscopy glass slides with fluorescent antifading buffer (Bioworld Technology, BD5014). MitoTrackerTM Red CMXRos (Invitrogen, M7512) was used to stain mitochondria in live cells before fixation. The staining of M. bovis bacilli with fluorescent substance was performed as described previously [Citation47]. Images were visualized under a magnification of 100X (oil immersion lens) using a Nikon A1HD25 confocal microscope, approximately 10–15 unique images were captured at random. Quantification of images were conducted with ImageJ software.
Enumeration of viable bacteria
For viable M. bovis bacilli enumeration, J774A.1 and BMDM cells were seeded in 24-well cell culture plates (1 × 10⁵ cells in each well) overnight. Cells were treated with DMSO (0.2%), CCCP (10 μM), or Mdivi-1 (20 μM) for 2 h, or transfected with Pink1 siRNA (25 nM) and negative control siRNA (25 nM) for 48 h, and then infected with M. bovis (MOI = 10) for 4 h, then washed with warm PBS three times to remove extracellular bacteria. After washing fresh media was added and the time period after washing was counted as zero h post-infection. The cells were lysed with 0.1% Triton X-100 at zero h and 24 h post-infection. For in-vivo experiments lung tissues were aseptically removed after sacrificing mice to enumerate viable M. bovis. Superior lobes of right lung tissues were lysed with small ceramic beads in PBS, in a tissue homogenizer apparatus (Shang hai Jing xin Company, JXFSTPRP-24 L, China) in accordance with the guidelines of manufacturer. For all tissue and cell samples, the lysate was serially diluted tenfold in sterilized PBS and was inoculated onto Middlebrook 7H10 agar plates supplemented with OADC and incubated at 37°C. The number of colonies was enumerated two-three weeks after incubation.
Cell viability assay
The viability of cells was determined by using MTS (Promega, G3582) or CCK8 assay kit (Beyotime biotechnology, C0038) as described previously [Citation48]. Briefly, cells were cultured in 96-well plates overnight before treatment. Cells were treated with different concentrations of CCCP and Mdivi-1 for 6 h, or transfected with different concentrations Pink1 siRNA for 48 h. MTS reagent (20 µl) or CCK8 (10 µl) was added in each well, and then cells were incubated at 37°C for 2 h. OD values were quantified via measuring the absorbance at 490 nm or 450 nm wavelength.
Histopathological analysis
Gross and histological analysis were carried out to evaluate the effect of CCCP and Mdivi-1 treatment on different organs of uninfected and M. bovis-infected mice. Organs such as lungs, spleen, liver, kidneys, heart and small intestine from the sacrificed animals were collected under a sterile environment as soon as possible. For gross pathological evaluation, lung and spleen were weighed and clear images were captured at 25 days post-infection. For histological study, tissues were fixed in 10% formaldehyde solution, embedded in paraffin, and cut into 3-μm-thick tissue sections using a microtome (Leica RM2235; Leica, Buffalo Grove, IL, USA). Tissues were mounted on glass slides, deparaffinized, and stained with hematoxylin and eosin (H&E; Solarbio, G1120) or Ziehl-Neelsen (ZN; Leagene Biotechnology, DM0036) for visualizing the acid-fast M. bovis bacilli. Sections stained with H&E or ZN methods were observed under low (10× or 20×) and high magnification (40× or 100×) by using an Olympus DP72 microscope fitted with a DS-Ri2 camera (Olympus). Scanning sections of lung and spleen were obtained by VENTANA DP200 slide scanner (Roche).
Mitochondria isolation
Mitochondrial isolation from cultured macrophages was performed by using commercial mitochondria isolation kit (Beyotime biotechnology, C3601) as per the manufacturer’s protocol.
Western blot analysis
For whole-cell protein extraction, cells were washed three times with PBS and solubilized in RIPA buffer (Beyotime biotechnology, P0013B) containing protease and phosphatase inhibitors (Beyotime biotechnology, P1046) for 10–15 min on ice. After centrifugation, 5xSDS (20%) loading buffer was added followed by boiling for 10 min. Proteins were separated with 12% SDS-PAGE and were transferred onto PVDF membranes (Merck Millipore Ltd, ISEQ00010). Then PVDF membranes were blocked with 5% DifcoTM skim milk for 1 h at 37°C. After that, membranes were incubated with specific primary antibodies for 12–18 h at 4°C. The following day, membranes were washed three times with TBST (Solarbio, T1081), each time for 10 min, and then incubated with secondary antibodies for 60 min at 37°C in shaking incubator. Afterward, membranes were again rinsed five times with TBST at 37°C, each time for 10 min. The protein signals were observed via chemiluminescence detection kit and the intensity was analyzed by using the ImageJ software.
Statistical analysis
All cell experiments were performed on three separate occasions. Results are expressed as means ± SEM. Statistical significance was determined by using Unpaired t-test (two-tailed), *p < 0.05, **p < 0.01, ***p < 0.001, ns represents not significant.
Supplemental Material
Download MS Word (7 MB)Acknowledgments
We thank China Agricultural University for providing the Biosafety Level-3 Laboratory for experiments regarding M. bovis culture and animal experiments. Thanks to Prof. Kui Zhu of China Agricultural University for his valuable comments on our experiments. This work was supported by National Natural Science Foundation of China (Project No. 32172800, 31873005); China Agriculture Research System (Project No. CARS-36); the National Key Research and Development Program (Project No. 2017YFD0500901); the MoSTRCUK international cooperation project (Project No. 2013DFG32500); and the High-end Foreign Experts Recruitment Program (Project No. GDW20151100036, GDW20161100071).
Disclosure statement
No potential conflict of interest was reported by the author(s).
Supplementary material
Supplemental data for this article can be accessed here
Additional information
Funding
Related Research Data
References
- Olea-Popelka F, Muwonge A, Perera A, et al. Zoonotic tuberculosis in human beings caused by Mycobacterium bovis-a call for action. Lancet Infect Dis. 2017;17:e21–e5.
- Pesciaroli M, Alvarez J, Boniotti MB, et al. Tuberculosis in domestic animal species. Res Vet Sci. 2014;97(Suppl):S78–85.
- Xu G, Wang J, Gao GF, et al. Insights into battles between Mycobacterium tuberculosis and macrophages. Protein Cell. 2014;5:728–736.
- Khaminets A, Behl C, Dikic I. Ubiquitin-dependent and independent signals in selective autophagy. Trends Cell Biol. 2016;26:6–16.
- Jayachandran R, BoseDasgupta S, Pieters J. Surviving the macrophage: tools and tricks employed by Mycobacterium tuberculosis. Curr Top Microbiol Immunol. 2013;374:189–209.
- Green Douglas R, Levine B. To be or not to be? How selective autophagy and cell death govern cell fate. Cell. 2014;157:65–75.
- Zhang L, Qin Y, Chen M. Viral strategies for triggering and manipulating mitophagy. Autophagy. 2018;14:1665–1673.
- Ding B, Zhang L, Li Z, et al. The matrix protein of human parainfluenza virus type 3 induces mitophagy that suppresses interferon responses. Cell Host Microbe. 2017;21:538–47 e4.
- Kim SJ, Syed GH, Khan M, et al. Hepatitis C virus triggers mitochondrial fission and attenuates apoptosis to promote viral persistence. Proc Natl Acad Sci U S A. 2014;111:6413–6418.
- Zhang Y, Yao Y, Qiu X, et al. Listeria hijacks host mitophagy through a novel mitophagy receptor to evade killing. Nat Immunol. 2019;20:433–446.
- Lazarou M, Sliter DA, Kane LA, et al. The ubiquitin kinase PINK1 recruits autophagy receptors to induce mitophagy. Nature. 2015;524:309–314.
- Stolz A, Ernst A, Dikic I. Cargo recognition and trafficking in selective autophagy. Nat Cell Biol. 2014;16:495–501.
- Thurston TL, Ryzhakov G, Bloor S, et al. The TBK1 adaptor and autophagy receptor NDP52 restricts the proliferation of ubiquitin-coated bacteria. Nat Immunol. 2009;10:1215–1221.
- Pilli M, Arko-Mensah J, Ponpuak M, et al. TBK-1 promotes autophagy-mediated antimicrobial defense by controlling autophagosome maturation. Immunity. 2012;37:223–234.
- Richter B, Sliter DA, Herhaus L, et al. Phosphorylation of OPTN by TBK1 enhances its binding to Ub chains and promotes selective autophagy of damaged mitochondria. Proc Natl Acad Sci U S A. 2016;113:4039–4044.
- Moore AS, Holzbaur EL. Dynamic recruitment and activation of ALS-associated TBK1 with its target optineurin are required for efficient mitophagy. Proc Natl Acad Sci U S A. 2016;113:E3349–58.
- Watson RO, Bell SL, MacDuff DA, et al. The cytosolic sensor cGAS detects Mycobacterium tuberculosis DNA to induce type i interferons and activate autophagy. Cell Host Microbe. 2015;17:811–819.
- Wang J, Hussain T, Yue R, et al. MicroRNA-199a inhibits cellular autophagy and downregulates IFN-beta expression by targeting TBK1 in Mycobacterium bovis infected cells. Front Cell Infect Microbiol. 2018;8:238.
- Liao Y, Hussain T, Liu C, et al. Endoplasmic reticulum stress induces macrophages to produce IL-1beta during Mycobacterium bovis infection via a positive feedback loop between mitochondrial damage and inflammasome activation. Front Immunol. 2019;10:268.
- Jin SM, Youle RJ. PINK1- and Parkin-mediated mitophagy at a glance. J Cell Sci. 2012;125:795–799.
- He L, Meng W, Zhao Z. Parkin-dependent mitophagy is required for the inhibition of ATF4 on NLRP3 inflammasome activation in cerebral ischemia-reperfusion injury in rats. Cells. 2019;8:897.
- Mizumura K, Cloonan SM, Nakahira K, et al. Mitophagy-dependent necroptosis contributes to the pathogenesis of COPD. J Clin Invest. 2014;124:3987–4003.
- Yang H, Shen H, Li J, et al. SIGMAR1/Sigma-1 receptor ablation impairs autophagosome clearance. Autophagy. 2019;15:1539–1557.
- Kimmey JM, Stallings CL. Bacterial pathogens versus autophagy: implications for therapeutic interventions. Trends Mol Med. 2016;22:1060–1076.
- Zhang R, Varela M, Vallentgoed W, et al. The selective autophagy receptors optineurin and p62 are both required for zebrafish host resistance to mycobacterial infection. PLoS Pathog. 2019;15:e1007329.
- Cho DH, Kim JK, Jo EK. Mitophagy and Innate Immunity in Infection. Mol Cells. 2020;43:10–22.
- Kim SJ, Khan M, Quan J, et al. Hepatitis B virus disrupts mitochondrial dynamics: induces fission and mitophagy to attenuate apoptosis. PLoS Pathog. 2013;9:e1003722.
- Vo MT, Smith BJ, Nicholas J, et al. Activation of NIX-mediated mitophagy by an interferon regulatory factor homologue of human herpesvirus. Nat Commun. 2019;10:3203.
- Youle RJ, Narendra DP. Mechanisms of mitophagy. Nat Rev Mol Cell Biol. 2011;12:9–14.
- Zhang H, Bosch-Marce M, Shimoda LA, et al. Mitochondrial autophagy is an HIF-1-dependent adaptive metabolic response to hypoxia. J Biol Chem. 2008;283:10892–10903.
- Sandoval H, Thiagarajan P, Dasgupta SK, et al. Essential role for Nix in autophagic maturation of erythroid cells. Nature. 2008;454:232–235.
- Liu L, Feng D, Chen G, et al. Mitochondrial outer-membrane protein FUNDC1 mediates hypoxia-induced mitophagy in mammalian cells. Nat Cell Biol. 2012;14:177–185.
- Murakawa T, Yamaguchi O, Hashimoto A, et al. Bcl-2-like protein 13 is a mammalian Atg32 homologue that mediates mitophagy and mitochondrial fragmentation. Nat Commun. 2015;6:7527.
- Bhujabal Z, Birgisdottir AB, Sjottem E, et al. FKBP8 recruits LC3A to mediate Parkin-independent mitophagy. EMBO Rep. 2017;18:947–961.
- Xia M, Gonzalez P, Li C, et al. Mitophagy enhances oncolytic measles virus replication by mitigating DDX58/RIG-I-like receptor signaling. J Virol. 2014;88:5152–5164.
- Mehra A, Zahra A, Thompson V, et al. Mycobacterium tuberculosis type VII secreted effector EsxH targets host ESCRT to impair trafficking. PLoS Pathog. 2013;9:e1003734.
- Mayer-Barber KD, Andrade BB, Oland SD, et al. Host-directed therapy of tuberculosis based on interleukin-1 and type I interferon crosstalk. Nature. 2014;511:99–103.
- Liu CH, Liu H, Ge B. Innate immunity in tuberculosis: host defense vs pathogen evasion. Cell Mol Immunol. 2017;14:963–975.
- Ogawa M, Mimuro H, Yoshikawa Y, et al. Manipulation of autophagy by bacteria for their own benefit. Microbiol Immunol. 2011;55:459–471.
- Weidberg H, Elazar Z. TBK1 mediates crosstalk between the innate immune response and autophagy. Sci Signal. 2011;4:pe39.
- Nozawa T, Sano S, Minowa-Nozawa A, et al. TBC1D9 regulates TBK1 activation through Ca2+ signaling in selective autophagy. Nat Commun. 2020;11:770.
- Jordao L, Bleck CK, Mayorga L, et al. On the killing of mycobacteria by macrophages. Cell Microbiol. 2008;10:529–548.
- Bange FC, Brown AM, Jacobs WR Jr. Leucine auxotrophy restricts growth of Mycobacterium bovis BCG in macrophages. Infect Immun. 1996;64:1794–1799.
- Tang C, Han H, Yan M, et al. PINK1-PRKN/PARK2 pathway of mitophagy is activated to protect against renal ischemia-reperfusion injury. Autophagy. 2018;14:880–897.
- Xiong H, Wang D, Chen L, et al. Parkin, PINK1, and DJ-1 form a ubiquitin E3 ligase complex promoting unfolded protein degradation. J Clin Invest. 2009;119:650–660.
- West AP, Khoury-Hanold W, Staron M, et al. Mitochondrial DNA stress primes the antiviral innate immune response. Nature. 2015;520:553–557.
- Chunfa L, Xin S, Qiang L, et al. The central role of IFI204 in IFN-beta release and autophagy activation during Mycobacterium bovis infection. Front Cell Infect Microbiol. 2017;7:169.
- Song Y, Hussain T, Wang J, et al. Mitochondrial transcription factor a regulates Mycobacterium bovis-induced IFN-beta production by modulating mitochondrial DNA replication in macrophages. J Infect Dis. 2020;221:438–448.