
ABSTRACT
Altered glutamine metabolism is an important aspect of cancer metabolic reprogramming. The GLS isoform GAC (glutaminase C), the rate-limiting enzyme in glutaminolysis, plays a vital role in cancer initiation and progression. Our previous studies demonstrated that phosphorylation of GAC was essential for its high enzymatic activity. However, the molecular mechanisms for GAC in maintaining its high enzymatic activity and protein stability still need to be further clarified. FAIM/FAIM1 (Fas apoptotic inhibitory molecule) is known as an important anti-apoptotic protein, but little is known about its function in tumorigenesis. Here, we found that knocking down FAIM induced macroautophagy/autophagy through suppressing the activation of the MTOR pathway in lung adenocarcinoma. Further studies demonstrated that FAIM could promote the tetramer formation of GAC through increasing PRKCE/PKCε-mediated phosphorylation. What’s more, FAIM also stabilized GAC through sequestering GAC from degradation by protease ClpXP. These effects increased the production of α-ketoglutarate, leading to the activation of MTOR. Besides, FAIM also promoted the association of ULK1 and MTOR and this further suppressed autophagy induction. These findings discovered new functions of FAIM and elucidated an important molecular mechanism for GAC in maintaining its high enzymatic activity and protein stability.
Introduction
Metabolic reprogramming is now recognized as one of the hallmarks of cancer [Citation1]. The metabolic differences between tumor cells and normal cells provide a potential strategy for targeted cancer therapy. Glutaminolysis is one of the key metabolic changes in cancer cells which provide nitrogen and carbon for the biosynthesis of macromolecules to promote the rapid proliferation of cancer cells [Citation2,Citation3]. Glutaminase is the initial metabolic enzyme in glutaminolysis which catalyzes the conversion of glutamine to glutamate and ammonia. There are two glutaminase isoforms encoded by different genes in human cells: the kidney-type glutaminase encoded by GLS and the liver-type glutaminase encoded by GLS2 [Citation4]. Interestingly, these two isoforms have contrasting functions in tumorigenesis. GLS promotes tumor progression, whereas GLS2 functions as a tumor suppressor [Citation5,Citation6]. A splice variant of GLS, named GAC (glutaminase C), is the main isoform and mainly accounts for the glutaminase activity in cancer cells [Citation7–10]. Until now, numerous studies including our previous studies have demonstrated that GLS is indispensable for tumor initiation and progression, and inhibition of glutaminase activity or glutaminase depletion blocks cancer cell growth [Citation10–13].
In cancer cells, GLS can be regulated at the transcription and post-translational modification level. MYC/c-Myc can increase the expression of GLS through suppressing MIR23A and MIR23B, thus promoting the proliferation of prostate cancer and B lymphoma cells [Citation14]. In breast cancer cells, activated JUN/c-jun induces GAC expression by directly binding to the GLS promoter region [Citation15]. SIRT5 can stabilize GAC expression through desuccinylation, thereby protecting it from ubiquitin-mediated degradation [Citation1616]. However, in certain types of cancer cells, the expression of GLS can not fully illustrate the dependence of cancer cells on glutamine metabolism [Citation10,Citation17,Citation18]. Our previous study first demonstrates that glutaminase activity, not its expression level, plays a vital role in breast cancer progression [Citation11]. After that, our group achieves another important finding that phosphorylation of GAC is the main reason for its highly enzymatic activity in cancer cells [10]. These two studies together demonstrate that phosphorylation-mediated highly enzymatic activity is another critical reason for glutamine addiction in cancer. But how the phosphorylation affects GAC activity still remains unclear. Tetramer formation of GAC is the premise of its enzymatic activity and a unique catalytic property of GLS is its potent activation by phosphate, and phosphate activation correlates with the association of inactive dimers to form active tetramers [Citation19,Citation20]. However, until now, little is known about the regulation mechanism for tetramer formation of GAC in cancer cells. It is reported that mutation of the potential acetylation site on GAC significantly increases catalytic efficiency and promotes the formation of tetramer in the absence of phosphate [Citation21,Citation22]. This indicates that post-translational modifications of GAC may be important for the active tetramer formation.
FAIM/FAIM1 (Fas apoptotic inhibitory molecule) is an anti-apoptotic protein that is first identified in B cell receptor (BCR)-activated B cells [Citation23]. FAIM is initially demonstrated to antagonize FAS-mediated apoptosis. FAIM can increase the expression of CFLAR/c-FLIP to block CASP8 (caspase 8) activation and thereby inhibit apoptosis [Citation24]. Besides, FAIM also interacts with XIAP and maintains its stability through inhibiting its auto-ubiquitination, thus protecting cells from apoptosis [Citation25,Citation26]. But until now, little is known about the exact molecular mechanism of FAIM in cancer progression. In our present study, we discovered that FAIM was overexpressed in lung adenocarcinoma cells and closely related to patients’ survival. Interestingly, we found that knocking down FAIM suppressed cell proliferation through inducing autophagy, not apoptosis. The exact molecular mechanism was that FAIM regulated the tetramer formation of GAC through increasing PRKCE-mediated phosphorylation at S314 and sequestered GAC from degradation by CLPP, thus increasing the production of α-ketoglutarate, leading to the activation of MTOR and suppression of autophagy. Furthermore, FAIM could also promote the association of ULK1 and MTOR in the cytoplasm, and this further suppressed autophagy induction. Thus, these findings offer a new mechanism for FAIM in regulating glutaminolysis in lung adenocarcinoma and shed new light on the therapeutic strategy for lung cancer treatment.
Results
FAIM is overexpressed in lung adenocarcinoma and correlated with poor survival of lung adenocarcinoma patients
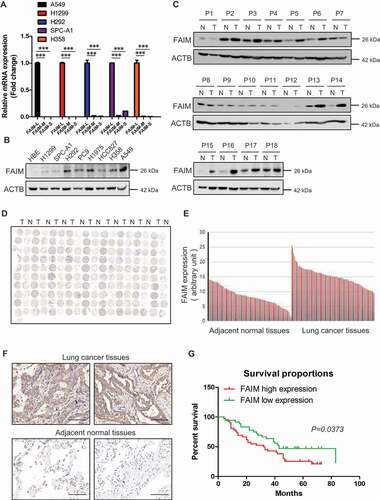
FAIM contains three isoforms including FAIM-L (isoform a), FAIM-M (isoform b) and FAIM-S (isoform c). To explore the function of FAIM in lung adenocarcinoma, we first detected the expression of the three isoforms in lung adenocarcinoma cells. showed that the expression of FAIM-L was much higher than the other two isoforms, indicating that FAIM-L was the main isoforms of FAIM in lung adenocarcinoma. Hereafter, we used FAIM to represent FAIM-L in our manuscript. We next examined the protein expression of FAIM in lung adenocarcinoma cells. showed that cancer cells expressed high levels of FAIM while the signal was almost undetectable in human bronchial epithelial cells. We also detected the expression of FAIM in 18 lung adenocarcinoma patients using western blot. Most of the cancer tissues showed higher expression of FAIM than adjacent normal tissues (). To further confirm this result, we examined the expression of FAIM using a lung adenocarcinoma tissue microarray which included lung cancer tissues and adjacent normal tissues from 90 patients. showed that cancer tissues expressed significantly higher levels of FAIM compared with adjacent normal tissues and this was further validated by quantification of the staining (). Representative staining of cancer and adjacent normal tissues are presented in , the expression levels of FAIM (brown) were higher in cancer tissues with only weak or no expression in adjacent normal tissues. Statistical analysis of the quantified staining results from cancer tissues divided the cancer samples into two groups depending upon the expression of FAIM. Survival of the patients was then correlated to the FAIM levels. As shown in , patients with low levels of FAIM exhibited better survival than patients with high levels of FAIM (P = 0.0373). These results indicated that FAIM was overexpressed in lung adenocarcinoma and closely related to cancer progression and patients’ survival.
Figure 1. FAIM is overexpressed in lung adenocarcinoma and correlates with poor survival of lung adenocarcinoma patients. (A) The mRNA level of FAIM isoforms in lung adenocarcinoma cell lines (A549, H1299, H292, SPC-A1, H358) were determined by Q-PCR using specific primers. Data represent the average of three independent experiments (mean ± SD). ***, P < 0.001. (B) The protein expression of FAIM in lung adenocarcinoma cell lines (H1299, SPC-A1, H292, PC9, H1975, HCC827, H358, A549) and human bronchial epithelial cells (HBE) were determined by western blot with the indicated antibodies. (C) FAIM expression in tumor tissues (T) and adjacent normal tissues (N) from 18 NSCLC patients were determined by western blot with the indicated antibodies. (D) Immunohistochemical staining of a representative lung adenocarcinoma tissue microarray with FAIM antibody. T, tumor tissue; N, adjacent normal tissue. (E) Quantification of the immunohistochemical (IHC) staining shown in Figure 1D. (F) Microscopy evaluation of IHC staining of two representative tumor tissues and adjacent normal tissues shown in Figure 1D with FAIM antibody (brown) and hematoxylin counterstain (blue). Scale bars: 100 μm. (G) Kaplan-Meier survival curve of 90 lung adenocarcinoma patients. Patients were divided into two groups according to the average staining density of FAIM in cancer tissues of the tissue array (High expression: n = 42, low expression: n = 48, Log-rank (Mantel-Cox) test was used for the statistical analysis).
FAIM knockdown inhibits proliferation of lung adenocarcinoma cells and promotes lung differentiation events in xenograft models
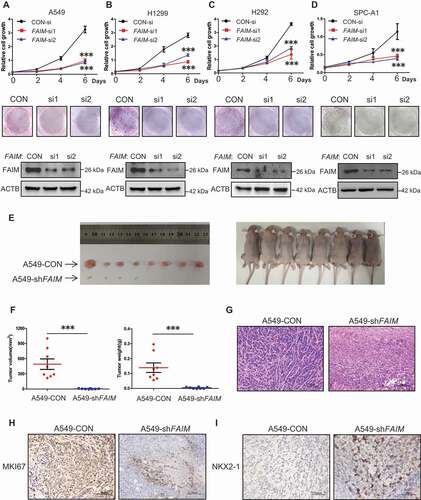
The overexpression of FAIM in lung adenocarcinoma impelled us to define the function of FAIM in lung adenocarcinoma cells. FAIM was knocked down by specific siRNAs and cell proliferation assay was performed in lung adenocarcinoma cells. -D showed that knocking down FAIM significantly decreased the proliferation rate and attenuated the colony-forming ability of cancer cells. Using flow cytometry, we examined cell cycle progression after FAIM knockdown. Figure S1A showed that knocking down FAIM arrested cell cycle at G2/M phase in lung adenocarcinoma cells. CDK1-CCNB1 (cyclin B1) is the key kinase complex during G2-M transition [Citation27]. We discovered that knockdown of FAIM significantly reduced the protein expression of CDK1 and CCNB1 (Figure S1B). These results indicated that knocking down FAIM could arrest cell cycle at G2/M phase and inhibit cell proliferation. We next detected the effects of FAIM knockdown on tumorigenesis in vivo. From xenograft models, we observed that the xenografts of A549 cells with FAIM knockdown (A549-shFAIM) showed dramatically reduced volume and weight compared with those of A549 control cells (A549-CON), and the cells with FAIM knockdown even could not form obvious xenografts in some models (). HE staining for two types of tumors showed that the tumor caused by A549-CON cells showed several characteristics, i.e. heterogeneous in cell size with many giant cells, disordered nucleoplasm ratio, and pathological fission, indicative of very poor differentiation. However, the tumor cells derived from FAIM knockdown were much uniform in size and with morphology suggestive of high degree of differentiation (). Using immunohistochemistry, we found that the staining of FAIM was very weak in tumor formed by A549-shFAIM cells, while the staining was strong in tumor formed by A549-CON cells, indicating that FAIM was successfully knocked down in tumor formed by A549-shFAIM (Figure S2). We next detected the expression of genes indicating the differentiation states of lung adenocarcinoma using immunohistochemistry. MKI67/Ki67 is widely used as a proliferation marker in pathological examination [Citation28]. We found that the tumor formed by A549-CON was MKI67 positive whereas the staining was much weaker in tumor derived from A549-shFAIM (). The expression of NKX2-1/TTF-1 (NK2 homeobox 1) is frequently suppressed in high grade lung adenocarcinoma [Citation29]. The staining in tumor formed by A549-CON was very weak, however, a positive staining of NKX2-1 was observed in the tumor formed by A549-shFAIM (). These results indicated that FAIM knockdown inhibited the proliferation of lung adenocarcinoma cells and promoted lung cancer differentiation.
Figure 2. FAIM knockdown inhibits proliferation of lung adenocarcinoma cells and promotes lung differentiation events in xenograft models. (A-D) The lung adenocarcinoma cells A549(A), H1299(B), H292(C), SPC-A1(D) were cultured in RPMI 1640 with 10% FBS, cells were transfected with control siRNA (CON-si) or FAIM siRNAs (FAIM-si1, FAIM-si2). Twenty-four h later, cells were seeded in 24-well plates at 5000 cells per well in 0.5 ml complete culture medium. At indicated time, cells were fixed in 3.7% formaldehyde and stained with 0.1% crystal violet. Data represent the average of three independent experiments (mean ± SD). ***, P < 0.001 (upper panel). The lung adenocarcinoma cells were transfected with indicated siRNAs and 500 cells were seeded in 6-well plate. 10 days later, cells were fixed in 3.7% formaldehyde and stained with 0.1% crystal violet and the photographs were taken (middle panel). The knockdown efficiency of FAIM was detected by western blot using the indicated antibodies (bottom panel). (E) A549 control cells (A549-CON) and FAIM knockdown stable cell lines (A549-shFAIM) were subcutaneously injected into the flanks of nude mice. Four weeks later, tumors were dissected out and photomicrographs were taken. (F) The weights and volume of tumors in Figure 2E were measured. The p value was calculated by paired t-test, ***, P < 0.001. (G) Photomicrographs of hematoxylin-eosin (HE) staining for tumors induced by A549-CON cells and A549-shFAIM cells. Scale bars: 100 μm. (H and I) Immunohistochemical staining in tumors induced by A549-CON cells and A549-shFAIM cells for MKI67 (H) and NKX2-1 (I). Scale bars: 100 μm.
Knocking down FAIM suppresses cancer cell proliferation through inducing autophagy
Previous studies have demonstrated that FAIM is an anti-apoptotic protein [23–25], we speculated that knocking down FAIM inhibited cell proliferation through inducing apoptosis. Flow cytometry was used to analyze the apoptosis of the cells with FAIM knockdown. Unexpectedly, knocking down FAIM did not significantly induce apoptosis (Figure S3A and S3B). This indicated that FAIM suppressed cell proliferation through other mechanisms. We next detected the autophagic process, which is another type of programmed cell death. ,B showed that knocking down FAIM significantly increased the LC3B puncta, the typical symbol for autophagy [Citation30], and addition of lysosomal inhibitor-CQ (chloroquine) further increased the number of the cells with LC3 puncta, indicating the increased autophagic flux when knocking down FAIM. We next detected the autophagic markers using western blot. As shown in and S4A, FAIM knockdown increased the expression of LC3B-II and decreased SQSTM1 expression. The inhibitory phosphorylation on Ser757 of ULK1 also decreased remarkably. Addition of CQ could further increase the expression of LC3B-II in cells with FAIM knockdown, this further indicated that autophagic flux was increased in cells with FAIM knockdown ( and S4B). These results demonstrated that knocking down FAIM induced autophagy instead of apoptosis. To further confirm these results, we examined the expression of the autophagic markers in vivo using tumor tissues in . The tumor with FAIM knockdown showed increased expression LC3B-II and decreased expression of SQSTM1 compared with control tumor (Figure S4C). From immunohistochemistry assay, we discovered that the staining of LC3B was stronger and the SQSTM1 staining was much weaker in tumor with FAIM knockdown than those in control tumor (Figure S4D). These results proved that knocking down FAIM induced autophagy in vivo.
Figure 3. Knocking down FAIM suppresses cancer cell proliferation through inducing autophagy. (A and B) A549 (A) and H1299 (B) cells were transfected with control siRNA (CON-si) or FAIM siRNAs (FAIM-si1, FAIM-si2). Forty-two h later, the cells were treated with or without 20 μM chloroquine (CQ) for 6 h. Immunofluorescence was performed using LC3B antibody and then analyzed by fluorescence microscopy (Olympus IX83). Scale bar: 30 μm (Left panel). The cell numbers with LC3B puncta were counted under 200× magnification. *, P < 0.05; **, P < 0.01; ***, P < 0.001 (Right panel). (C) A549 cells were transfected with control siRNA (CON-si) or FAIM siRNAs (FAIM-si1, FAIM-si2). Forty-eight h later, the cells were lysed and western blot was performed to detect the expression of the indicated proteins. (D) A549 cells were transfected with control siRNA (CON-si) or FAIM siRNAs (FAIM-si1, FAIM-si2). Forty-two h later, the cells were treated with or without 20 μM chloroquine (CQ) for 6 h. Western blot was used to detect the expression of the indicated proteins. (E and F) A549 (E) and H1299 (F) cells were transfected with control siRNA (CON-si) or FAIM siRNAs (FAIM-si1, FAIM-si2). Twenty-four h later, cells were seeded in 24-well plates at 5000 cells per well in 0.5 ml complete culture medium treat with or without Chloroquine (CQ). On the 6th day, cells were fixed in 3.7% formaldehyde and stained with 0.1% crystal violet. Data represent the average of three independent experiments (mean ± SD). **, P < 0.01.
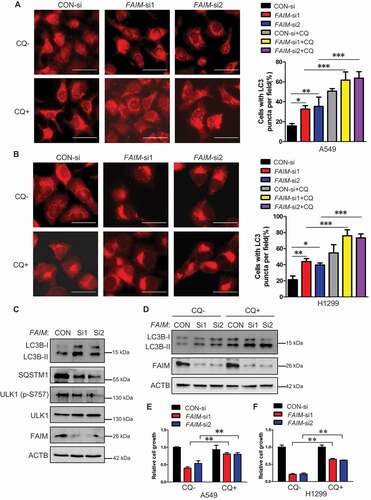
In order to clarify if the inhibition on cell proliferation caused by FAIM knockdown was mediated by autophagy, we assessed cell proliferation after FAIM knockdown with or without adding the autophagy inhibitor-chloroquine (CQ). The results showed that CQ treatment significantly alleviated the inhibitory effects of FAIM knockdown on cell proliferation (). Similar results were also obtained when combined knocking down FAIM and the key autophagic protein-BECN1 (Figures S4E and S4F). These results demonstrated that knocking down FAIM suppressed cell proliferation through inducing autophagy.
FAIM regulates autophagy through modulating the activation of the MTOR pathway
The MTOR pathway plays a vital role in autophagy induction [Citation31,Citation32]. In and S4A, we found an obvious reduction on the phosphorylation level of ULK1 at Ser757, which is regulated by MTORC1 [32]. Thus we examined the effects of FAIM expression on the activation of MTORC1 pathway. Overexpression of FAIM increased the phosphorylation of MTORC1 substrate RPS6KB1/S6K1, while knocking down FAIM significantly decreased the phosphorylation of RPS6KB1 (-C). We further demonstrated these results by examining the localization of MTOR on lysosome. showed that knocking down FAIM reduced the translocation of MTOR to the lysosome, as determined by the decreased colocalization of MTOR with CD63, the lysosomal marker.
Figure 4. FAIM regulates autophagy through modulating the activation of MTOR pathway. (A) A549 cells were transfected with pcDNA3.1-HA empty vector or pcDNA3.1-HA-FAIM. Forty-eight h later, the cells were lysed and western blot was performed to detect the expression of the indicated proteins. (B) A549 cells were transfected with control siRNA or FAIM siRNAs. Forty-eight h later, the cells were lysed and western blot was performed to detect the expression of the the indicated proteins. (C) A549 control cells and FAIM knockdown stable cell lines were lysed and western blot was performed to detect the expression of the indicated proteins. (D) Immunofluorescence was performed using the indicated antibodies in A549 control cells and FAIM knockdown stable cell lines. Scale bar: 30 μm. (E) A549 cells were transfected with pcDNA3.1-HA empty vector or pcDNA3.1-HA-FAIM. Forty-eight h later, the cells were lysed and the production of α-ketoglutarate (α-KG) was measured. Data represent the average of three independent experiments (mean ± SD). *, P < 0.05. (F) A549 cells were transfected with control siRNA or FAIM siRNAs. Forty-eight h later, the cells were lysed and the production of α-ketoglutarate (α-KG) was measured. Data represent the average of three independent experiments (mean ± SD). *, P < 0.05. (G) A549 cells transfected with control siRNA or FAIM siRNAs were treated with or without 5 mM dimethyl α-ketoglutarate. Forty-eight h later, the cells were lysed and western blot was performed to detect the expression of the indicated proteins. (H) A549 control cells and FAIM knockdown stable cell lines were treated with or without 5 mM dimethyl α-ketoglutarate. Forty-eight h later, the cells were lysed and western blot was performed to detect the expression of the indicated proteins. (I) A549 cells transfected with control siRNA or FAIM siRNAs were treated with or without dimethyl α-ketoglutarate. Immunofluorescence was performed using LC3B antibody and analyzed by fluorescence microscopy (Olympus IX83). Scale bar: 30 μm (Upper panel). The cell numbers with LC3B puncta were counted under 200× magnification. **, P < 0.01; ***, P < 0.001 (Bottom panel). (J) A549 control cells and FAIM knockdown stable cell lines were treated with or without dimethyl α-ketoglutarate. Immunofluorescence was performed using LC3B antibody and analyzed by fluorescence microscopy (Olympus IX83). Scale bar: 30 μm (Upper panel). The cell numbers with LC3B puncta were counted under 200× magnification. ***, P < 0.001 (Bottom panel).
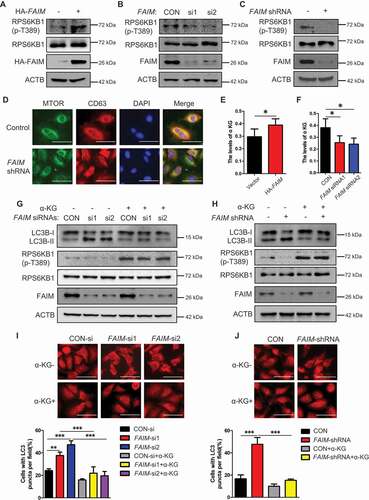
In our previous study, we demonstrate that inhibition of glutaminolysis by glutaminase inhibitor-968 induces autophagy in NSCLC cells [12]. Another study shows that glutaminolysis can activate MTORC1 signaling by increasing α-ketoglutarate (α-KG) production, leading to suppression of autophagy [Citation33]. Thus, we detected the effects of FAIM on the production of α-KG. showed that overexpressing FAIM significantly increased the production of α-KG, while FAIM knockdown decreased α-KG production. We next examined if the induction of autophagy caused by FAIM knockdown was mediated by α-KG. From , we could see that addition of α-KG significantly increased the expression of phosphorylated RPS6KB1 at Thr389, indicating the activation of MTOR pathway. The increased expression of autophagic marker LC3B-II caused by FAIM knockdown could be relieved when α-KG was added. Overexpression of FAIM significantly reduced the expression of LC3B-II, however, addition of α-KG in FAIM overexpressing cells did not reduced the expression of LC3B-II significantly as in control cells (Figure S5). The reason might be that overexpression of FAIM produced enough α-KG to suppress basal autophagy to a very low level. Under this condition, addition of extra α-KG could not induce a further reduction on the expression of LC3B-II. We also found that the increased LC3B puncta induced by FAIM knockdown could be suppressed when α-KG was added (). These results indicated that the autophagy induced by FAIM knockdown was regulated by α-KG production.
FAIM regulates the tetramer formation of GAC
Because the autophagy induced by FAIM knocking down was related to α-KG production, we wondered whether there was some relationship between FAIM and glutaminolysis. As we know, GAC plays a vital role in tumor glutaminolysis. Thus, we detected the effects of FAIM on GAC activity. Overexpressing FAIM enhanced GAC activity and knocking down FAIM decreased its activity (,B). GAC is a mitochondrial enzyme, interestingly, FAIM also clearly located in mitochondria (). Immunoprecipitation was performed and demonstrated that FAIM could interact with GAC ( and S6A). We also detected the effects of FAIM on GLUD1 (glutamate dehydrogenase 1), another important enzyme in glutamine metabolism [Citation34]. However, FAIM did not interact with GLUD1, and had no effects on its protein expression (Figures S6B and S6C). This indicated that the influence of FAIM on glutaminolysis mainly relied on GAC. Tetramer formation is essential for GAC activity, therefor we examined if FAIM could regulate the tetramer formation of GAC. Blue Native Gel Electrophoresis was used to detect the tetramer formation. As shown in , the overexpression of FAIM increased the tetramer formation of GAC, but knocking down FAIM significantly decreased the tetramer form of GAC. In A549 stable cell lines with FAIM knockdown, the tetramer formation of GAC also decreased remarkably (). These results indicated that FAIM regulated the tetramer formation of GAC.
Figure 5. FAIM regulates the tetramer formation of GAC. (A) A549 cells were transfected with empty vector or pcDNA3.1-HA-FAIM and mitochondria were isolated and glutaminase activity was measured. Data represent the average of three independent experiments (mean ± SD). **, P < 0.01. (B) A549 cells were transfected with control siRNA or FAIM siRNAs. Forty-eight h later, mitochondria were isolated and glutaminase activity was measured. Data represent the average of three independent experiments (mean ± SD). *, P < 0.05. (C and D) Mitochondria were isolated from A549 (C) and H1299 cells (D). The expression of mitochondria and cytosolic proteins were detected by western blot. (E) A549 cells were transfected with empty vector or pcDNA3.1-HA-FAIM and immunoprecipitation was performed followed by western blot. (F) A549 cells were transfected with indicated plasmids. The cells were lysed and analyzed using 4–16% Native PAGE, followed by immunoblot analysis. (G) A549 cells were transfected with the indicated siRNAs. The cells were lysed and analyzed using 4–16% Native PAGE, followed by immunoblot analysis. (H) A549 control cells and FAIM knockdown stable cell lines were lysed and analyzed using 4–16% Native PAGE, followed by immunoblot analysis. (I) A549 cells were transfected with pcDNA3.1-V5-GAC (WT GAC) or pcDNA3.1-V5-GAC mutants (GACS314A, GACS314D), then analyzed using 4–16% Native PAGE, followed by immunoblot analysis. (J) A549 cells were transfected with the indicated plasmids. The cells were lysed and analyzed using 4–16% Native PAGE, followed by immunoblot analysis. (K) A549 cells were co-transfected with the indicated plasmid and siRNAs. The cells were lysed and analyzed using 4–16% Native PAGE, followed by immunoblot analysis. (Figure F-K: GAC-T: GAC tetramer; GAC-M: GAC monomer). (L) A549 cells were co-transfected with pcDNA3.1-V5-GAC and the indicated siRNAs. Forty-eight h later, the cells were lysed and immunoprecipitation was performed followed by western blot. (M) A549 cells were transfected with indicated plasmids. Forty-eight h later, the cells were lysed and immunoprecipitation was performed. The expression of the indicated proteins was examined by western blot.
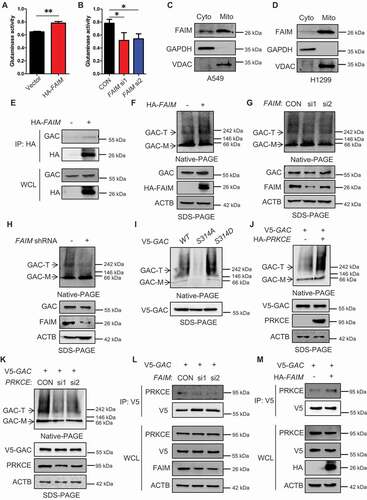
Our previous study find that phosphorylation of GAC at Ser314 enhances its enzymatic activity in cancer cells [10]. We next wanted to know if GAC phosphorylation could affect its tetramer formation. There were significant tetramer bands in GAC wild-type, however, the GAC bands at high molecular weights could hardly be seen in GACS314A mutant representing non-phosphorylation at Ser314, while GACS314D representing consistent phosphorylation at Ser314 formed GAC tetramer more significantly than GAC wild-type (). This result indicated that GAC phosphorylation at Ser314 was closely related to tetramer formation. PRKCE is the kinase responsible for GAC phosphorylation at Ser314 [10]. We next detected the effects of PRKCE on tetramer formation of GAC. Overexpressing PRKCE remarkably increased tetramer formation while knocking down PRKCE showed an opposite effect (). We further demonstrated that knocking down FAIM significantly decreased the interaction between GAC and PRKCE, and overexpressing FAIM increased this interaction (). These results proved that FAIM increased GAC tetramer formation by facilitating the interaction between GAC and PRKCE, then enhanced GAC actitvity and promoted α-KG production.
FAIM regulates the stability of GAC
Except for the influence on GAC tetramer formation, we also discovered that FAIM could regulate GAC stability. This could be seen from that degradation rate of GAC in A549-shFAIM cells was more rapid than that in A549 wild type cells. Mitochondrial proteases are essential for maintaining mitochondrial function and homeostasis [Citation35]. CLPP is the proteolytic subunit of mitochondrial protease-ClpXP and knocking down CLPP is demonstrated to increase GAC expression level, indicating that ClpXP plays an important role in GAC stability [Citation36,Citation37]. Because FAIM also located in mitochondria, we speculated that FAIM might regulate the expression of GAC through mitochondrial protease. We first examined the effects of CLPP on the expression of GAC. Interestingly, there were no obvious changes in GAC expression when overexpressing CLPP. However, overexpression of CLPP significantly decreased GAC expression when FAIM was knocked down (). We also found that the decreased expression of GAC induced by FAIM knockdown could be recovered when treating cells with A2-32-01, the specific inhibitor of CLPP, while CQ treatment did not show this effect, indicating that FAIM knockdown reduced GAC expression through CLPP protease, not the lysosomal pathway (Figure S7). The degradation rate of GAC increased significantly when knocking down FAIM while this observation could not be seen in wild-type cells (). These results indicated that FAIM could prevent GAC from degradation by CLPP. To further prove this, we examined the interaction between GAC and CLPP. showed that CLPP interacted with GAC. We next detected the effects of FAIM on the interaction between CLPP and GAC. Decreased expression of FAIM remarkably enhanced the interaction between GAC and CLPP (). These results demonstrated that FAIM could stabilize GAC by segregating GAC from CLPP, thus preventing its degradation.
Figure 6. FAIM regulates the stability of GAC. (A) A549 control cells and FAIM knockdown stable cell lines were treated with 25 μg/ml cycloheximide (CHX) for different times and the expression of the indicated proteins were detected by western blot. (B) A549 cells were co-transfected with pcDNA3.1-V5-CLPP and the indicated siRNAs. Forty-eight h later, the cells were lysed and western blot was performed. (C) A549 control cells and FAIM knockdown stable cell lines were transfected with or without pcDNA3.1-V5-CLPP. Forty-eight h later, the cells were lysed and western blot was performed. (D) A549 cells were transfected with the indicated plasmids or siRNAs. Forty-two h later, the cells were treated with CHX for indicated times. Western blot was used to detect the expression of the indicated proteins. Relative GAC expression over ACTB was quantified. (E) A549 cells were transfected with pcDNA3.1-V5 empty vector or pcDNA3.1-V5-CLPP. Forty-eight h later, the cells were lysed and immunoprecipitation was performed. The expression of the indicated proteins was examined by western blot. (F) A549 cells were co-transfected with pcDNA3.1-V5-CLPP and the indicated siRNAs. Forty-eight h later, the cells were lysed and immunoprecipitation was performed. The expression of the indicated proteins was examined by western blot. (G) A549 control cells and FAIM knockdown stable cell lines were transfected with pcDNA3.1-V5-CLPP. Forty-eight h later, the cells were lysed and immunoprecipitation was performed. The expression of the indicated proteins was examined by western blot. (H) A549 cells were transfected with WT GAC, GACS314A and GACS314D plasmids followed by treatment with CHX for different times. Western blot was used to detect the expression of the indicated proteins. Relative GAC expression over ACTB was quantified. (I) A549 cells were transfected with the indicated plasmids or siRNAs followed by treatment with CHX for different times. Western blot was used to detect the expression of the indicated proteins. Relative GAC expression over ACTB was quantified.
As FAIM could affect both the tetramer formation and the stability of GAC, we wanted to clarify if these two processes were interconnected. We examined the degradation rate of GAC wild-type and GAC mutants under physiological conditions. showed that there were no significant differences between these proteins. This result proved that the degradation of GAC was not related to its phosphorylation states. However, the degradation rate of the three types of GAC protein significantly increased when knocking down FAIM (). These results demonstrated that the stability of GAC was closely related to the existence of FAIM no matter it was phosphorylated or not.
FAIM suppresses the interaction between ULK1 and MTOR in the cytoplasm
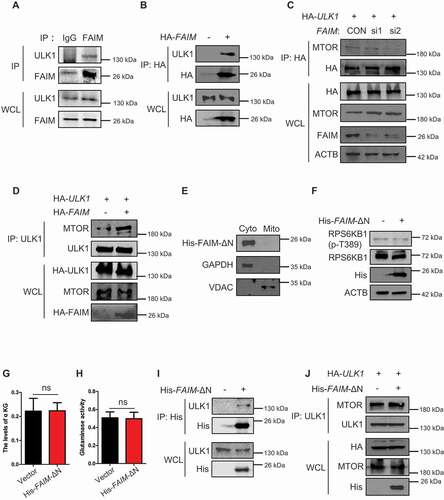
In , we could see that except for its main localization at mitochondria, FAIM also located in cytoplasm. This prompted us to explore its function in cytoplasm. ,B showed that FAIM could interact with ULK1, indicating that FAIM might also regulate autophagy in cytoplasm. As FAIM affected the phosphorylation of ULK1 on Ser757 which is regulated by MTOR ( and S4A), we examined the effects of FAIM expression on the interaction between MTOR and ULK1. Knocking down FAIM remarkably decreased the MTOR level immunoprecipitated from ULK1, while overexpressing FAIM significantly enhanced their interaction (, D). To clarify if this effect was caused by FAIM located in cytoplasm, we constructed a mutant FAIM lacking the N-terminal amino acid sequence. showed that the mutant FAIM mainly located in cytoplasm. This mutant did not enhance MTOR pathway activation as demonstrated by the unchanged or even down-regulated expression of phosphorylated RPS6KB1 (). Also, the mutant FAIM did not affect the production of α-KG and glutaminase activity (). However, this mutant FAIM could still interact with ULK1 and overexpressing mutant FAIM increased the interaction between ULK1 and MTOR (, J). All these results demonstrated FAIM could also regulate autophagy induction in the cytoplasm through facilitating the interaction between ULK1 and MTOR.
Figure 7. FAIM suppresses the interaction between ULK1 and MTOR in cytoplasm. (A) H1299 cells were lysed and immunoprecipitation was performed using the indicated antibodies. Western blot were used to detect protein expression. (B) H1299 cells were transfected with or without pcDNA3.1-HA-FAIM. Forty-eight h later, the cells were lysed and immunoprecipitation was performed. The expression of the indicated proteins was examined by western blot. (C) H1299 cells were transfected with pCMV-HA-ULK1 and the indicated siRNAs. Forty-eight h later, the cells were lysed and immunoprecipitation was performed. The expression of the indicated proteins was examined by western blot. (D) H1299 cells were co-transfected with pCMV-HA-ULK1 and pcDNA3.1-HA-FAIM. Forty-eight h later, the cells were lysed and immunoprecipitation was performed. The expression of the indicated proteins was examined by western blot. (E) A549 cells were transfected with pcDNA3.1-His-FAIM-ΔN. Forty-eight h later, Mitochondria were isolated and the mitochondria and cytosolic proteins were detected by western blot. (F) A549 cells were transfected with pcDNA3.1-His-FAIM-ΔN. Forty-eight h later, the cells were lysed and western blot was performed to detect the expression of the indicated proteins. (G) A549 cells were transfected with pcDNA3.1-His-FAIM-ΔN. Forty-eight h later, the cells were lysed and the production of α-ketoglutarate (α-KG) was measured. Data represent the average of three independent experiments (mean ± SD). ns, P > 0.05. (H) A549 cells were transfected with pcDNA3.1-His-FAIM-ΔN. Forty-eight h later, mitochondria were isolated and glutaminase activity was measured. Data represent the average of three independent experiments (mean ± SD). ns, P > 0.05. (I) A549 cells were transfected with or without pcDNA3.1-His-FAIM-ΔN. Forty-eight h later, the cells were lysed and immunoprecipitation was performed. The expression of the indicated proteins was examined by western blot. (J) A549 cells were co-transfected with pCMV-HA-ULK1 and pcDNA3.1-His-FAIM-ΔN. Forty-eight h later, the cells were lysed and immunoprecipitation was performed. The expression of the indicated proteins was examined by western blot.
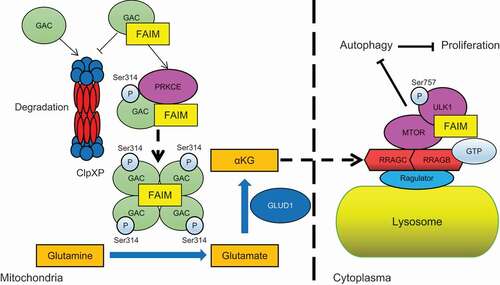
Finally, we gave the working model for this study. In mitochondria, FAIM interacted with GAC. This interaction on one hand stabilized GAC through protecting GAC from degradation by ClpXP complex. On the other hand, FAIM increased PRKCE mediated phosphorylation of GAC at Ser314, this further promoted the tetramer formation of GAC. These two effects of mitochondrial FAIM together increased the production of α-KG, leading to the activation of MTOR and the phosphorylation of ULK1 at Ser757. In cytoplasma, FAIM could promote the interaction between MTOR and ULK1, this further enhanced the phosphorylation of ULK1. These two pathways together suppressed the induction of autophagy and promoted the proliferation of cancer cells. Thus, FAIM is a new regulator of autophagy that functions separately through mitochondrial and cytoplasmic pathways ().
Figure 8. The proposed working model for the regulation of autophagy by FAIM.
Discussion
FAIM is initially identified as an antagonist against Fas-induced apoptosis [23]. In fact, several other functions of FAIM are also discovered, such as cell proliferation, metabolism, neurodegenerative disease and tumorigenesis, although only a few relative studies [Citation38–42]. In the regulation of metabolism, overexpression of FAIM reduces the expresssion of adipogenesis proteins, including SREBF1/SREBP1 (sterol regulatory element binding transcription factor 1), SREBF2/SREBP2 (sterol regulatory element binding transcription factor 2), SCD (stearoyl-CoA desaturase) and HMGCR (3-hydroxy-3-methylglutaryl-CoA reductase), and increases the expression of glycogen synthesis proteins, such as SLC2A2/GLUT2 (solute carrier family 2 member 2) and GSK3B/GSK-3β (glycogen synthase kinase 3 beta) in hepatocyte [Citation43]. FAIM is also demonstrated as a new mediator of AKT signaling through modulating its localization to lipid rafts during AKT activation [Citation44]. These results indicate that FAIM is an important regulator of glucose and lipid metabolism. However, the precise molecular mechanism of FAIM in metabolism regulation and tumorigenesis remains unclear. In the present study, we discovered that FAIM could regulate autophagy through modulating the activation of MTOR pathway in lung adenocarcinoma cells. Interestingly, we first discovered that FAIM was located in mitochondria. As mitochondria are the center of a series of metabolic pathways, we speculated that FAIM might regulate autophagy through regulating metabolism. We found that FAIM could enhance glutamine metabolism by promoting the tetramer formation of GAC, thus increased GAC activity and the production α-ketoglutarate which is the activator of MTOR pathway. We also found that FAIM did not interact with GLUD1, another important enzyme in glutaminolysis, and had no effects on GLUD1 expression, indicating that the function of FAIM on glutamine metabolism mainly came from the regulation on GAC. Importantly, we found that phosphorylation of GAC at Ser314 was critical for tetramer formation. Further studies demonstrated that FAIM increased the interaction between PRKCE and GAC thus promoting the phosphorylation of GAC at Ser314. To our knowledge, this is the first study demonstrating that phosphorylation promotes tetramer formation of GAC and Ser314 is the key phosphorylation site in this process. Thus, this study together with our previous published works [10] clarify another critical point of view in glutamine metabolism that except for the high expression of GAC in cancer, phosphorylation-mediated GAC activation is another main reason for glutamine addiction in cancer. We also examined the effects of FAIM on mitophagy, the selective degradation of mitochondria. We found that knocking down FAIM reduced the expression of mitophagy marker-BNIP3 (data not shown), indicating the inhibition on mitophagy. As FAIM knockdown reduces the activity of GAC, this study consists with the previous study that inhibition of GAC by SIRT5 overexpression blocks mitophagy in breast cancer cells [Citation45]. However, that study mainly focuses on the effects of ammonia derived from glutaminolysis and it is reported that ammonia induces autophagy through an MTOR independent mechanism [Citation46]. In our study, we discovered that autophagy induced by FAIM knockdown was originated from MTOR inhibition, which was mediated by decreased α-KG production. Whether the inhibition on mitophagy in cells with FAIM knockdown was related to α-KG or ammonia production needed to be further defined. Thus, the autophagy induction mechanisms in cancer are complicated and closely related to metabolic state of different cancer.
Both the protein expression and enzymatic activity are important for the proper function of GAC in cancer cells. The expression of GLS can be regulated at the transcription and post-translational modification level. The transcription factors MYC, RELA/p65 and JUN are demonstrated to regulate the expression of GLS either through directly binding to the promoter or indirectly regulating the expression of certain miRNAs [14,15,Citation47]. Post-translational modification can also regulate GLS expression at the protein stability level. The anaphase-promoting complex/cyclosome (APC/C)-FZR1/Cdh1 can ubiquitinate and degrade GLS [Citation48]. GLS desuccinylation by SIRT5 increases the protein stability and inhibits its degradation through ubiquitin-proteasomal system [16]. However, GAC is a mitochondrial enzyme, how this ubiquitination process occurs is still unclear. CLPP (ATP-dependent Clp protease proteolytic subunit P) is a mitochondrial protease that forms the ClpXP complex with the chaperone ATP-dependent Clp protease ATP-binding subunit CLPX (caseinolytic mitochondrial peptidase chaperone subunit X) [Citation37,Citation49]. We found that overexpressing CLPP did not reduce GAC expression. Interestingly, CLPP remarkably decreased GAC expression when knocking down FAIM. We further found that FAIM could protect GAC from binding to CLPP thereby maintaining its protein stability, and this effect was solely related to FAIM expression, not related to its protein phosphorylation state. In fact, FAIM has been reported to maintain protein homeostasis. FAIM can interact with XIAP through its IAP-binding motif and inhibit ubiquitination, thus maintaining protein stability [25]. FAIM also counteracts the aggregation of mutant SOD1 (superoxide dismutase 1), and further disassembles and solubilizes protein aggregates [Citation50]. These studies together with ours demonstrate that maintaining protein homeostasis may be a new biological function of FAIM except for its anti-apoptosis effect.
In this study, we also found that the cytoplasmic FAIM could regulate autophagy in a different manner. The phosphorylation of ULK1 by MTOR is an important autophagic inhibitory mechanism [Citation32]. We found that FAIM could interact with ULK1 in the cytoplasm and inhibit the interaction between MTOR and ULK1, thus reducing the phosphorylation of ULK1 at Ser757. This mechanism together with its function in glutaminolysis regulates autophagy induction in lung adenocarcinoma cells.
Until now, little is still known about the function and molecular mechanisms of FAIM in cancer progression. It is reported that knocking down FAIM in multiple myeloma cells significantly reduces cell viability under serum starved conditions and the high expression of FAIM correlates with poor survival outcomes for multiple myeloma patients. This study also finds that insulin-like growth factor-1 (IGF-1) treatment increases FAIM expression, however the transcription factors in this process is not defined [Citation42]. IRF4 (interferon regulatory factor 4) is reported to increase FAIM expression [Citation51], but this still needs to be further demonstrated in cancer cells. In neuroblastoma and cervical cancer cells, the expression of FAIM can also be regulated by MIR206, MIR1-3p, and MIR133B, indicating that microRNAs may be important regulators on FAIM expression [Citation52]. In NSCLC cells, the short form of FAIM-FAIM-S suppresses cell proliferation by reducing the expression of CCND1 through the NFKB pathway [41]. In the present study, we discovered that FAIM (actually represents FAIM-L) was overexpressed in lung adenocarcinoma and promoted cell proliferation through suppressing autophagy. These studies demonstrated that the role and molecular mechanisms of FAIM in cancer progression depended on cancer type, and different isoforms of FAIM might have different functions in the same type of cancer. Thus, a serious of outstanding questions need to be further clarified: 1. The molecular mechanism of FAIM overexpression in cancer needs to be explored; 2. the function of different FAIM isoforms in cancer progression needs to be clarified; 3. the mechanism for alternative splicing of FAIM in cancer is an intersting question; 4. more studies need to be done to identifying if maintaining protein homeostasis is a general function of FAIM. Besides, we demonstrated that FAIM mainly located in mitochondria and regulated glutamine metabolism, whether FAIM can regulate other metabolic pathways is another important issue. Clarifying these questions will help us to further understand the functions and molecular mechanisms of FAIM in cancer progression which will provide theoretical basis for targeting FAIM as a potential therapeutic strategy against cancer.
Materials and methods
Reagents and plasmids
Cycloheximide (CHX), chloroquine (CQ) and cell-permeable α-ketoglutarate (dimethyl 2-oxoglutarate) were purchased from Sigma (C7698, C6628, 349631). A2-32-01 was purchased from MCE (HY-111532). FAIM and BECN1 siRNAs were synthesized by Thermo Fisher Scientific (1299001). The plasmids: pcDNA3.1-HA-FAIM, pcDNA3.1-V5-GAC, pCMV-HA-PRKCE, pcDNA3.1-V5-CLPP, pCMV-HA-ULK1, pcDNA3.1-His-FAIM-ΔN and the mutant plasmids (GACS314A, GACS314D) were constructed by us. The FAIM shRNAs was purchased from OriGene (TR304703). The FAIM antibody was purchased from Proteintech (13005-1-AP). Mouse anti-ACTB/β-actin was purchased from Proteintech (66009-1-lg). Mouse anti-HA Tag, anti-His Tag and anti-V5 Tag monoclonal antibodies were ordered from Thermo Fisher Scientific (26183, MA1-21315, 37–7500). Mouse anti-SQSTM1/p62 monoclonal antibody was ordered from OriGene (TA502127). Commercial rabbit polyclonal antibodies anti-LC3B was purchased from Proteintech (18725-1-AP). The ULK1 and p-ULK1 (Ser757) were ordered from Cell Signaling Technology (6439, 14202). The ULK1 antibody purchased from Cell Signaling Technology (6439) was used for immunoprecipitation. The RPS6KB1 and p-RPS6KB1 antibodies were purchased from Cell Signaling Technology (2708, 9234). The GAC antibody was purchased from Abcam (ab93434). The anti-MKI67/Ki67 and anti-NKX2-1/TTF1 antibodies were purchased from Abcam (ab15580, ab76013). The normal rabbit IgG was purchased from Santa Cruz Biotechnology (sc-2027). The MTOR antibody was ordered from Proteintech (20657-1-AP). The GAPDH and VDAC antibody were purchased from Proteintech (60004-1-Ig, 10866-1-AP). The protein G agarose beads were purchased from Roche (11243233,001).
Cell growth assay
Human lung adenocarcinoma cell lines were obtained from ATCC (H1299 [CRL-5803], A549 [CCL-185], H292 [CRL-1848], H1975 [CRL-5908], HCC827 [CRL-2868], H358 [CRL-5807]) and BeNa Culture Collection (SPC-A1 [BNCC101697], PC9 [BNCC340767]), and these cells were cultured in RPMI 1640 (Gibco, C11875500BT) supplemented with 10% FBS (Gibco, 10099–141 C). For cell proliferation assay, cells were seeded in 24-well plates at 3000 cells per well in 0.5 ml medium with 10% FBS. Medium was changed every two days. At the indicated times, cells were fixed in 3.7% formaldehyde and stained with 0.1% crystal violet. Dye was extracted with 10% acetic acid and the relative proliferation was determined by the absorbance at 595 nm. For the colony formation assay, cells were seeded in 6-well plates at a density of 500 cells per well in 1 ml of medium supplemented with 10% FBS. The medium was changed every 2 days. After 10 days, cells were fixed in 4% formaldehyde for 30 min and stained with 0.1% crystal violet. The images were obtained using a digital camera (Canon, EOS70D).
Mitochondrial isolation and glutaminase activity assay
The detailed procedures for this part were carried out as previously described [11]. Briefly, mitochondial isolation was conducted using the mitochondria isolation kit (QIAGEN, 37612) following the manufacturer’s instructions. 2 × 10⁷ cells were collected and centrifuged at 500 × g for 10 min at 4°C. The cell pellets were suspended in 2 ml of lysis buffer and incubated on ice for 10 min using an end-over-end shaker. The cell lysates were centrifuged at 1000 × g for 10 min at 4°C, then the pellets were resuspended in 1.5 ml disruption buffer using a blunt-ended, 23-gauge needle and a syringe. The suspension was centrifuged at 6000 × g for 20 min at 4°C. The pellets were resuspended in 100 μl of storage buffer and assayed for glutaminase activity. Briefly, 20 μl resuspended mitochondrial lysate were added in a reaction buffer I (57 mM Tris-acetate [Sigma-Aldrich, T1258], pH 8.6, 0.225 mM EDTA [Solarbio, E8030], 17 mM glutamine [Sigma-Aldrich, G3126]) and incubated by rotating at 37°C for 1 h. The reaction was stopped by adding 10 μl ice-cold 3 M hydrogen chloride (HCl) and incubated on ice for 5 min. Then, 10 μl quenched reaction mixture was added to a reaction buffer II containing 114 mM Tris-HCl (Solarbio, T8230), pH 9.4, 0.35 mM adenosine diphosphate (ADP; Sigma-Aldrich, A2754), 1.7 mM nicotinamide adenine dinucleotide (NAD; Sigma-Aldrich, N7004), 6.3 U/ml GLUD1 (Sigma-Aldrich, G2626), 1% hydrazine (Sigma-Aldrich, 225819–50 G) to give a final volume of 230 μl and incubated at room temperature for 45 min. The formation of NADH was detected by the absorbance at 340 nm against a water blank. Measurements were done in triplicate.
Measurement of α-ketoglutarate
The detailed procedures for α-ketoglutarate detection were carried out as previously described [Citation53]. In short, cells were lysed with RIPA buffer (Beyotime, P0013) containing phosphatase and protease inhibitors (Beyotime, P1046), and centrifuged at 15000 × g for 5 min at 4°C. Then, the 50 μl lysates were used for detection in 450 μl assay solution (100 mM KH2PO4 [Solarbio, P7392], pH 7.2, 10 mM NH4Cl [Solarbio, A7320], 5 mM MgCl2 [Solarbio, M8161], 0.15 mM NADH, 5 U GLUD1 [Sigma-Aldrich, G2626]) and incubated for 10 min at 37°C. The absorbance at 340 nm was measured. The decreased absorbance was used to detect the level of α-ketoglutarate.
RNA interference and gene overexpression
For RNA interference, cells were transiently transfected with the siRNAs using the SuperFectin siRNA Transfection Reagent (Pufei, 2103–100) following the manufacturer’s instructions. After 48 h, the transfection efficiency was checked by western blot assay using the relevant antibodies. The FAIM and BECN1 siRNAs were purchased from Thermo Fisher Scientific (1299001).
For gene overexpression, cells were transiently transfected with the indicated plasmids using the SuperFectin DNA Transfection Reagent kit (Pufei, 2102–100) following the manufacturer’s instructions. 48 h later, the transfection efficiency was checked by western blot using the indicated antibodies.
Immunoprecipitation and western blot
For immunoprecipitation assay, cells were lysed in RIPA buffer (Beyotime, P0013) containing protease inhibitor cocktail (Sigma, P2714) and phenylmethylsulfonyl fluoride (DINGGUO, WB0180) for 30 min at 4°C. Then, the cell lysates were centrifuged at 10000 × g for 20 min at 4°C. The supernatants were added with the indicated antibodies and protein G agarose beads followed by incubating overnight at 4°C. Then the mixtures were washed with lysis buffer for three times and suspended with 2× loading buffer and boiled for 10 min.
After transfection with plasmids or siRNAs for 48 h, cells were lysed in RIPA buffer containing protease inhibitors, and the protein concentrations were measured by the BCA Protein Assay Kit (Pierce Biotechnology, 23225). Total proteins were subjected to 10% or 12% SDS-PAGE and transferred to PVDF membranes (Milipore, IPVH00010). The membranes were blocked with 5% skim milk (BD, 232100) for 1 h at room temperature and incubated with the indicated antibodies overnight at 4°C. The membranes were washed 3 times at room temperature with 1× TBST (20 mM Tris-base [Solarbio, T8060], 150 mM NaCl [SCR, 10019318], 0.05% Tween-20 [Solarbio, T8220], pH 7.4) for 10 min every time, followed by incubation for 1 h at room temperature with horseradish peroxidase-conjugated anti-mouse secondary antibodies (Thermo Fisher Scientific, 31430) or anti-rabbit secondary antibodies (Thermo Fisher Scientific, 31460). Protein bands were visualized after incubation with Pro-Light chemiluminescence detection kit (TIANGEN, PA112-01) using a digital gel image analysis system TANON 5500 and the band intensities were quantified by Tanon GIS software.
Quantitative RT-PCR
Total RNA was extracted using TRIzol reagent (Thermo Fisher Scientific, 15596018) and 1 μg total RNA was used for reverse transcription using PrimeScript RT reagent kit with gDNA eraser (Takara, RR047A) according to the manufacturer’s instructions. Quantitative RT-PCR was performed with SYBR Green dye (Takara, RR820A). The relative amount of cDNA was calculated by the comparative Ct method using GAPDH as a control. PCR reactions were performed in triplicate. The sequences of the primers used to were:
FAIM-L: 5ʹ-TTCTTCGGCAGAGCTACGAC-3ʹ (sense); 5ʹ-CTGTAAGGAGGGCTCAGAG-3ʹ (antisense).
FAIM-M: 5ʹ-CCCACAGAGCACAGACTGT-3ʹ (sense); 5ʹ-ACCATTGCACCATACGTCCA-3ʹ (antisense).
FAIM-S: 5ʹ-ACAGAGCACAGCCCTCCTT-3ʹ (sense); 5ʹ-ACCATTGCACCATACGTCCA-3ʹ (antisense).
GAPDH: 5ʹ-GGAGCGAGATCCCTCCAAAAT-3ʹ (sense); 5ʹ-GGCTGTTGTCATACTTCTCATGG-3ʹ (antisense).
Blue Native Gel Electrophoresis
The detailed procedures for Blue Native Gel Electrophoresis were carried out as previously described [36]. The NativePAGE 4–16% Bis-Tris Gel was purchased from ThermoFisher (BN1002BOX). Briefly, The cells were lysed in ice-cold DDM buffer (1% n-dodecyl-β-D-maltoside [Solarbio, D8890], 50 mM Bis-Tris [Solarbio, B8160], pH 7.2, 0.5 M 6-aminocaproic acid [Solarbio, IA0230], 50 mM NaCl, 10% glycerol [Solarbio, G8190], 0.001% ponceau S [Solarbio, P8330] and standard protease inhibitor) and ice-cold CHAPS buffer (5% CHAPS [Solarbio, C8390], 50 mM Bis-Tris, pH 7.2, 0.5 M 6-aminocaproic acid, 50 mM NaCl, 10% glycerol, 0.001% ponceau S and standard protease inhibitor). The ratio of DDM buffer to CHAPS buffer was 4:1. The lysates were centrifuged at 20,000 × g for 30 min. After adding the sample buffer (0.5% Coomassie Brilliant Blue G-250 [Solarbio, C8420], 10 mM Bis-Tris, pH 7.2, 50 mM 6-aminocaproic acid, 10% glycerol and standard protease inhibitor) to the supernatant, Blue Native Gel Electrophoresis was performed. The 4–16% NativePAGE Bis-Tris Gel was run with pre-chilled dark blue cathode buffer (50 mM Bis-Tris, 50 mM Tricine [Solarbio, T8190], pH 6.8, 0.02% Coomassie Brilliant Blue G-250) for 50 min at 150 V. Then the dark blue cathode buffer was changed for light blue cathode buffer (50 mM Bis-Tris, 50 mM Tricine, pH 6.8, 0.002% Coomassie Brilliant Blue G-250) and continued to run for 50 min. The anode buffer we used was: 50 mM Bis-Tris, 50 mM Tricine, pH 6.8. After the electrophoresis was finished, the gels were first soaked in blot buffer (20 mM Bicine [Solarbio, B8020], 25 mM Bis-Tris, 1 mM EDTA, pH 7.2) for 20 min and then the proteins in the gels were transferred to PVDF membranes in the same buffer, followed by detection using the indicated antibodies as western blot.
In vivo xenograft assay
Cell suspensions (1 × 10⁷ cells) in a total volume of 100 μl were injected subcutaneously into the flanks of 3 ~ 4-week-old male BALB/C nude mice (SLAC, Shanghai). A549-CON cells were injected into the left side and A549-shFAIM cells were injected into the right side of the same mice. Four weeks after the injection, the mice were sacrificed and the tumors were dissected out, the weights and volumes were measured. Tumor volume was calculated with the formula: volume (mm3) = π/6 × (large diameter) × (smaller diameter)Citation2. All mice were housed in the SPF animal facility of Institute of Translational Medicine at Nanchang University.
Immunohistochemistry
Lung adenocarcinoma tissue microarray was purchased from National Engineering Center for BioChips in Shanghai, China. A more complete description of the human specimens was included in Table S1. The expression of FAIM in the tissue was evaluated by immunohistochemical staining with a FAIM-specific antibody. The tissue microarray slide was deparaffinized, rehydrated, and subjected to an epitope retrieval step. Subsequently, 6% hydrogen peroxide was used to block endogenous peroxidase activity. The slide was washed in PBS (DINGGUO, BF-0011) for three times and then incubated with FAIM antibody at 4°C overnight. After three washes in PBS, the slide was incubated with horseradish peroxidase-conjugated secondary antibody (Servicebio, GB23303) for 1 h. The stain was developed with either chromogen or hematoxylin solutions. The images of the tissue microarray were analyzed by ImageScope software. The immunohistochemical staining for tumors derived from A549-CON and A549-shFAIM was performed as mentioned above. The anti-MK67 and anti-NKX2-1/TTF1 antibodies were purchased from abcam (ab15580, ab76013). The photographs were taken using Olympus IX71 microscope.
Statistical analysis
Data are presented as means ± SD. Statistical comparisons were made by ANOVA or a two-tailed Student’s t-test; P-values ≤ 0.05 was considered statistically significant.
Supplemental Material
Download Zip (6 MB)Disclosure statement
The authors declare no competing interests.
Supplementary material
Supplemental data for this article can be accessed here
Additional information
Funding
Related Research Data
References
- Hanahan D, Weinberg RA. Hallmarks of cancer: the next generation. Cell. 2011;144(5):646–674.
- DeBerardinis RJ, Mancuso A, Daikhin E, et al. Beyond aerobic glycolysis: transformed cells can engage in glutamine metabolism that exceeds the requirement for protein and nucleotide synthesis. Proc Natl Acad Sci U S A. 2007;104(49):19345–19350.
- DeBerardinis RJ, Cheng T. Q’s next: the diverse functions of glutamine in metabolism, cell biology and cancer. Oncogene. 2010;29(3):313–324.
- Curthoys NP, Watford M. Regulation of glutaminase activity and glutamine metabolism. Annu Rev Nutr. 1995;15(1):133–159.
- Katt WP, Lukey MJ, Cerione RA. A tale of two glutaminases: homologous enzymes with distinct roles in tumorigenesis. Future Med Chem. 2017;9(2):223–243.
- Szeliga M, Bogacinska-Karas M, Rozycka A, et al. Silencing of GLS and overexpression of GLS2 genes cooperate in decreasing the proliferation and viability of glioblastoma cells. Tumour Biol. 2014;35(3):1855–1862.
- Elgadi KM, Meguid RA, Qian M, et al. Cloning and analysis of unique human glutaminase isoforms generated by tissue-specific alternative splicing. Physiol Genomics. 1999;1(2):51–62.
- Szeliga M, Matyja E, Obara M, et al. Relative expression of mRNAS coding for glutaminase isoforms in CNS tissues and CNS tumors. Neurochem Res. 2008;33(5):808–813.
- Turner A, McGivan JD. Glutaminase isoform expression in cell lines derived from human colorectal adenomas and carcinomas. Biochem J. 2003;370(Pt 2):403–408.
- Han T, Zhan W, Gan M, et al. Phosphorylation of glutaminase by PKCepsilon is essential for its enzymatic activity and critically contributes to tumorigenesis. Cell Res. 2018;28(6):655–669.
- Wang JB, Erickson JW, Fuji R, et al. Targeting mitochondrial glutaminase activity inhibits oncogenic transformation. Cancer Cell. 2010;18(3):207–219.
- Han T, Guo M, Zhang T, et al. A novel glutaminase inhibitor-968 inhibits the migration and proliferation of non-small cell lung cancer cells by targeting EGFR/ERK signaling pathway. Oncotarget. 2017;8(17):28063–28073.
- Wang Z, Liu F, Fan N, et al. Targeting glutaminolysis: new perspectives to understand cancer development and novel strategies for potential target therapies. Front Oncol. 2020;10:589508.
- Gao P, Tchernyshyov I, Chang TC, et al. c-Myc suppression of miR-23a/b enhances mitochondrial glutaminase expression and glutamine metabolism. Nature. 2009;458(7239):762–765.
- Lukey MJ, Greene KS, Erickson JW, et al. The oncogenic transcription factor c-Jun regulates glutaminase expression and sensitizes cells to glutaminase-targeted therapy. Nat Commun. 2016;7(1):11321.
- Greene KS, Lukey MJ, Wang X, et al. SIRT5 stabilizes mitochondrial glutaminase and supports breast cancer tumorigenesis. Proc Natl Acad Sci U S A. 2019;116(52):26625–26632.
- van den Heuvel AP, Jing J, Wooster RF, et al. Analysis of glutamine dependency in non-small cell lung cancer: GLS1 splice variant GAC is essential for cancer cell growth. Cancer Biol Ther. 2012;13(12):1185–1194.
- Sellers K, Fox MP, Bousamra M 2nd, et al. Pyruvate carboxylase is critical for non-small-cell lung cancer proliferation. J Clin Invest. 2015;125(2):687–698.
- Godfrey S, Kuhlenschmidt T, Curthoys P. Correlation between activation and dimer formation of rat renal phosphate-dependent glutaminase. J Biol Chem. 1977;252(6):1927–1931.
- Morehouse RF, Curthoys NP. Properties of rat renal phosphate-dependent glutaminase coupled to Sepharose. Evidence that dimerization is essential for activation. Biochem J. 1981;193(3):709–716.
- Ferreira AP, Cassago A, Goncalves Kde A, et al. Active glutaminase C self-assembles into a supratetrameric oligomer that can be disrupted by an allosteric inhibitor. J Biol Chem. 2013;288(39):28009–28020.
- McDonald CJ, Acheff E, Kennedy R, et al. Effect of lysine to alanine mutations on the phosphate activation and BPTES inhibition of glutaminase. Neurochem Int. 2015;88:10–14.
- Schneider TJ, Fischer GM, Donohoe TJ, et al. A novel gene coding for a Fas apoptosis inhibitory molecule (FAIM) isolated from inducibly Fas-resistant B lymphocytes. J Exp Med. 1999;189(6):949–956.
- Huo J, Xu S, Guo K, et al. Genetic deletion of faim reveals its role in modulating c-FLIP expression during CD95-mediated apoptosis of lymphocytes and hepatocytes. Cell Death Differ. 2009;16(7):1062–1070.
- Moubarak RS, Planells-Ferrer L, Urresti J, et al. FAIM-L is an IAP-binding protein that inhibits XIAP ubiquitinylation and protects from Fas-induced apoptosis. J Neurosci. 2013;33(49):19262–19275.
- Martinez-Marmol R, Barneda-Zahonero B, Soto D, et al. FAIM-L regulation of XIAP degradation modulates synaptic long-term depression and axon degeneration. Sci Rep. 2016;6(1):35775.
- Malumbres M, Barbacid M. Mammalian cyclin-dependent kinases. Trends Biochem Sci. 2005;30(11):630–641.
- Li LT, Jiang G, Chen Q, et al. Ki67 is a promising molecular target in the diagnosis of cancer (review). Mol Med Rep. 2015;11(3):1566–1572.
- Winslow MM, Dayton TL, Verhaak RG, et al. Suppression of lung adenocarcinoma progression by Nkx2-1. Nature. 2011;473(7345):101–104.
- Klionsky DJ, Abdel-Aziz AK, Abdelfatah S, et al. Guidelines for the use and interpretation of assays for monitoring autophagy (4th edition). Autophagy. 2021;17(1):1–382.
- Jung CH, Ro SH, Cao J, et al. mTOR regulation of autophagy. FEBS Lett. 2010;584(7):1287–1295.
- Kim J, Kundu M, Viollet B, et al. AMPK and mTOR regulate autophagy through direct phosphorylation of Ulk1. Nat Cell Biol. 2011;13(2):132–141.
- Duran RV, Oppliger W, Robitaille AM, et al. Glutaminolysis activates Rag-mTORC1 signaling. Mol Cell. 2012;47(3):349–358.
- Plaitakis A, Kalef-Ezra E, Kotzamani D, et al. The glutamate dehydrogenase pathway and its roles in cell and tissue biology in health and disease. Biology (Basel). 2017;6(1):11.
- Deshwal S, Fiedler KU, Langer T. Mitochondrial proteases: multifaceted regulators of mitochondrial plasticity. Annu Rev Biochem. 2020;89(1):501–528.
- Kita K, Suzuki T, Ochi T. Diphenylarsinic acid promotes degradation of glutaminase C by mitochondrial Lon protease. J Biol Chem. 2012;287(22):18163–18172.
- Nouri K, Feng Y, Schimmer AD. Mitochondrial ClpP serine protease-biological function and emerging target for cancer therapy. Cell Death Dis. 2020;11(10):841.
- Huo J, Ma Y, Liu JJ, et al. Loss of Fas apoptosis inhibitory molecule leads to spontaneous obesity and hepatosteatosis. Cell Death Dis. 2016;7:e2091.
- Carriba P, Comella JX. Amyloid Beta, TNFalpha and FAIM-L; approaching new therapeutic strategies for AD. Front Neurol. 2014;5:276.
- Carriba P, Jimenez S, Navarro V, et al. Amyloid-beta reduces the expression of neuronal FAIM-L, thereby shifting the inflammatory response mediated by TNFalpha from neuronal protection to death. Cell Death Dis. 2015;6:e1639.
- Wang P, Xun W, Han T, et al. FAIM-S functions as a negative regulator of NF-kappaB pathway and blocks cell cycle progression in NSCLC cells. Cell Cycle. 2020;19(24):3458–3467.
- Huo J, Xu S, Lin B, et al. Fas apoptosis inhibitory molecule is upregulated by IGF-1 signaling and modulates Akt activation and IRF4 expression in multiple myeloma. Leukemia. 2013;27(5):1165–1171.
- Xiao X, Qiu P, Gong HZ, et al. PACAP ameliorates hepatic metabolism and inflammation through up-regulating FAIM in obesity. J Cell Mol Med. 2019;23(9):5970–5980.
- Huo J, Xu S, Lam KP. Fas apoptosis inhibitory molecule regulates T cell receptor-mediated apoptosis of thymocytes by modulating Akt activation and Nur77 expression. J Biol Chem. 2010;285(16):11827–11835.
- Polletta L, Vernucci E, Carnevale I, et al. SIRT5 regulation of ammonia-induced autophagy and mitophagy. Autophagy. 2015;11(2):253–270.
- Cheong H, Lindsten T, Wu J, et al. Ammonia-induced autophagy is independent of ULK1/ULK2 kinases. Proc Natl Acad Sci U S A. 2011;108(27):11121–11126.
- Qie S, Chu C, Li W, et al. ErbB2 activation upregulates glutaminase 1 expression which promotes breast cancer cell proliferation. J Cell Biochem. 2014;115(3):498–509.
- Colombo SL, Palacios-Callender M, Frakich N, et al. Anaphase-promoting complex/cyclosome-Cdh1 coordinates glycolysis and glutaminolysis with transition to S phase in human T lymphocytes. Proc Natl Acad Sci U S A. 2010;107(44):18868–18873.
- Haynes CM, Petrova K, Benedetti C, et al. ClpP mediates activation of a mitochondrial unfolded protein response in C. elegans. Dev Cell. 2007;13(4):467–480.
- Kaku H, Ludlow AV, Gutknecht MF, et al. FAIM opposes aggregation of mutant SOD1 that typifies some forms of familial amyotrophic lateral sclerosis. Front Neurosci. 2020;14:110.
- Uranishi M, Iida S, Sanda T, et al. Multiple myeloma oncogene 1 (MUM1)/interferon regulatory factor 4 (IRF4) upregulates monokine induced by interferon-gamma (MIG) gene expression in B-cell malignancy. Leukemia. 2005;19(8):1471–1478.
- Coccia E, Masanas M, Lopez-Soriano J, et al. FAIM is regulated by MiR-206, MiR-1-3p and MiR-133b. Front Cell Dev Biol. 2020;8:584606.
- MacKenzie ED, Selak MA, Tennant DA, et al. Cell-permeating alpha-ketoglutarate derivatives alleviate pseudohypoxia in succinate dehydrogenase-deficient cells. Mol Cell Biol. 2007;27(9):3282–3289.