
ABSTRACT
By promoting anabolism, MTORC1 is critical for muscle growth and maintenance. However, genetic MTORC1 upregulation promotes muscle aging and produces age-associated myopathy. Whether MTORC1 activation is sufficient to produce myopathy or indirectly promotes it by accelerating tissue aging is elusive. Here we examined the effects of muscular MTORC1 hyperactivation, produced by simultaneous depletion of TSC1 and DEPDC5 (CKM-TD). CKM-TD mice produced myopathy, associated with loss of skeletal muscle mass and force, as well as cardiac failure and bradypnea. These pathologies were manifested at eight weeks of age, leading to a highly penetrant fatality at around twelve weeks of age. Transcriptome analysis indicated that genes mediating proteasomal and macroautophagic/autophagic pathways were highly upregulated in CKM-TD skeletal muscle, in addition to inflammation, oxidative stress, and DNA damage signaling pathways. In CKM-TD muscle, autophagosome levels were increased, and the AMPK and ULK1 pathways were activated; in addition, autophagy induction was not completely blocked in CKM-TD myotubes. Despite the upregulation of autolysosomal markers, CKM-TD myofibers exhibited accumulation of autophagy substrates, such as SQSTM1/p62 and ubiquitinated proteins, suggesting that the autophagic activities were insufficient. Administration of a superoxide scavenger, tempol, normalized most of these molecular pathologies and subsequently restored muscle histology and force generation. However, CKM-TD autophagy alterations were not normalized by rapamycin or tempol, suggesting that they may involve non-canonical targets other than MTORC1. These results collectively indicate that the concomitant muscle deficiency of TSC1 and DEPDC5 can produce early-onset myopathy through accumulation of oxidative stress, which dysregulates myocellular homeostasis.
Abbreviations: AMPK: AMP-activated protein kinase; CKM: creatine kinase, M-type; COX: cytochrome oxidase; DEPDC5: DEP domain containing 5, GATOR1 subcomplex subunit; DHE: dihydroethidium; EDL: extensor digitorum longus; EIF4EBP1: eukaryotic translation initiation factor 4E binding protein 1; GAP: GTPase-activating protein; GTN: gastrocnemius; MTORC1: mechanistic target of rapamycin kinase complex 1; PLA: plantaris; QUAD: quadriceps; RPS6KB/S6K: ribosomal protein S6 kinase beta; SDH: succinate dehydrogenase; SOL: soleus; SQSTM1: sequestosome 1; TA: tibialis anterior; TSC1: TSC complex subunit 1; ULK1: unc-51 like autophagy activating kinase 1
KEYWORDS:
Introduction
MTOR (mechanistic target of rapamycin kinase) complex 1 (MTORC1) is a protein kinase critical for cell growth and anabolism [Citation1]. MTORC1 upregulates protein synthesis by phosphorylating RPS6KB/S6K (ribosomal protein S6 kinase beta) and EIF4EBP1 (eukaryotic translation initiation factor 4E binding protein 1) [Citation2]. MTORC1 is also known to inhibit macroautophagy/autophagy, a major catabolic pathway in the cell, through inhibitory phosphorylation of ULK1, an autophagy-initiating protein kinase [Citation3]. Showing the critical role of MTORC1 in muscle mass maintenance, muscle-specific ablation of raptor, an essential regulatory subunit of MTORC1, or the MTOR kinase itself, produced a progressive dystrophy associated with loss of muscle mass and force [Citation4,Citation5] and autophagy dysregulation [Citation6,Citation7]. Rapamycin, a pharmacological MTORC1 inhibitor, was also shown to inhibit muscle growth during post-injury recovery or mechanical overload [Citation8–10]. These studies show the critical role of MTORC1 in muscle homeostasis.
Given the critical role of MTORC1 in anabolic metabolism, MTORC1 activity is tightly controlled in cells. Two small GTPases, RHEB and RRAG, are known to directly regulate MTORC1 [Citation11]. Growth factor signals activate MTORC1 through RHEB, while nutrient signals regulate MTORC1 through RRAG. In the absence of anabolic inputs from growth factors and nutrients, RHEB is inhibited by its GTPase-activating protein (GAP) TSC1 (TSC complex subunit 1)-TSC2, whereas RRAG is inhibited by GAP activity toward Rags 1 (GATOR1) [Citation11]. TSC contains TSC1 and TSC2 proteins [Citation12], while GATOR1 is a trimeric complex of DEPDC5, NPRL2 and NPRL3 proteins [Citation13]. TSC1 and DEPDC5 are proteins critical for GAP activity of the corresponding protein complexes [Citation11–13].
To increase anabolic activities in mouse muscle, MTORC1 activities were genetically upregulated through disruption of either TSC1 or DEPDC5. Even though MTORC1 upregulation in these models can occasionally increase muscle mass and mitochondrial activities, it led to substantially accelerated muscle aging associated with late-onset myopathy [Citation4–6,Citation14–16]. However, such a pathological phenotype was not evident in young mice. Given the well-established role of MTORC1 in accelerating aging in multiple organisms [Citation1], it is unclear whether MTORC1 activation is sufficient to produce muscle damage, or if it is merely accelerating the muscle aging process. Considering that natural aging of wild-type mice can provoke MTORC1 hyperactivities in myofibers exhibiting degenerative features [Citation14], it is important to determine whether MTORC1 hyperactivity per se can damage the myofiber or if MTORC1 activation is an indirect secondary sequelae of muscle aging and degeneration.
In this study, we produced a new mouse strain (CKM-TD), which lacks both DEPDC5 and TSC1, specifically in the muscle tissue. This genetic modulation is expected to uncouple MTORC1 from both growth and nutrient inputs, and result in constitutive hyperactivation of MTORC1 regardless of the upstream cues (). In contrast to formerly described MTORC1 upregulation models such as Depdc5 and Tsc1 single-knockout mice, which showed no obvious muscle pathologies in young mice, CKM-TD mice exhibited prominent early-onset myopathy phenotypes accompanied by highly penetrant fatality by ten weeks of age. Therefore, simultaneous deletion of Depdc5 and Tsc1 is sufficient to injure muscle by provoking excessive oxidative stress, leading to prominent pathologies in cardiac and skeletal muscle tissues.
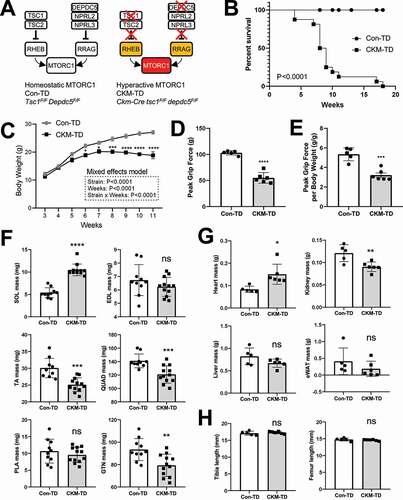
Figure 1. Muscle-specific deletion of both Tsc1 and Depdc5 (CKM-TD) produces early fatality associated with reduced body weight and grip force. (A) Schematic of unregulated MTORC1 hyperactivation in CKM-TD mice. (B) Survival analysis of Con-TD (n = 12) and CKM-TD (n = 16) male mice between 0 and 18 weeks of age. P-value is from the log-rank test. (C) Body weight curve analysis of Con-TD (n = 25) and CKM-TD (n = 14) male mice between 3 and 11 weeks of age. (D and E) Grip force analysis of Con-TD (n = 5) and CKM-TD (n = 6) male mice at ten weeks of age. (F-H) Weight (F and G) and size (H) of indicated tissues and organs of Con-TD (n = 5) and CKM-TD (n = 6) male mice at ten weeks of age. Data are presented as mean±SEM with individual values. *P < 0.05, **P < 0.01, ***P < 0.001, ****P < 0.0001, ns non-significant in Student’s t-test.
Results
CKM-TD mice exhibit early fatality associated with loss of body weight and grip force
To achieve hyperactivation of MTORC1, Tsc1F/FDepdc5F/F mice were bred to Ckm/Mck-Cre, which produces muscle-specific Cre expression. Control (Tsc1F/FDepdc5F/F; Con-TD) and Ckm-Cre-positive (Ckm-Cretsc1F/Fdepdc5F/F; CKM-TD) littermates were generated and analyzed for the experiments. CKM-TD has a muscle-specific deletion of Tsc1 and Depdc5; in this mouse strain, TSC1 and DEPDC5 proteins were depleted from both skeletal (Figure S1A) and cardiac (Figure S1B) muscle tissues. Upon double depletion of TSC1 and DEPDC5, MTORC1 becomes hyperactive in muscle tissue regardless of growth factor and nutrient cues (). CKM-TD mice showed highly penetrant fatality between 5 and 20 weeks of age (), associated with a persistent reduction in body weight ().
Due to the unexpectedly early lethality, we performed all our experiments using ten-week-old Con-TD and CKM-TD mice. At this age, CKM-TD mice showed a reduction in grip force by nearly 50% (), suggesting defects in muscle function. Interestingly, muscle mass was disparately affected by CKM-TD modulation according to their anatomical locations (). Soleus muscle mass (SOL in ) was highly increased, while tibialis anterior (TA), gastrocnemius (GTN), and quadriceps (QUAD) muscle masses () were slightly decreased. In contrast, plantaris (PLA) and extensor digitorum longus (EDL) did not show significant changes in tissue weight (). Heart mass was increased, suggestive of cardiac hypertrophy (). While kidney mass was decreased, liver and white adipose tissue masses did not show significant changes (). Body weight-normalized masses of these tissues showed similar patterns of changes after CKM-TD modulation (Figure S1C and S1D). Importantly, the reduction in body weight in CKM-TD mice did not seem to be caused by systemic growth defect because the lengths of the tibia and femur were comparable between Con-TD and CKM-TD mice ().
CKM-TD reduces muscle force production
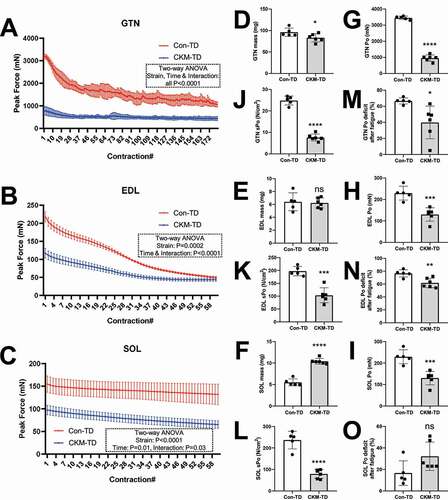
We measured the force production of three different skeletal muscle tissues: GTN, EDL, and SOL. In all of the tissues examined, muscle force was diminished in CKM-TD mice compared to the Con-TD mice (). Although muscle mass was only reduced in GTN () and not in EDL () or SOL (; SOL mass was increased by CKM-TD), muscle force () and specific muscle force normalized by the cross-sectional area () were reduced in all anatomical locations by CKM-TD. Interestingly, although initial force production was impaired in CKM-TD muscles, they did not fatigue quickly after repetitive contraction (); therefore, fatigue-induced force decline was either reduced (GTN and EDL; ) or comparable to Con-TD muscles (SOL; ). It is possible that non-degenerative CKM-TD myofibers made an adaptation to be resistant to stress and fatigue. It is also possible that CKM-TD altered fiber type composition of the muscle fiber or that a fatigue-resistant fiber type is also resistant to CKM-TD pathologies, either of which can lead to partial fatigue resistance. Nevertheless, the CKM-TD effect on specific force, which is independent of muscle size, was robustly observed across all muscle types ().
Figure 2. CKM-TD reduces muscle force production. (A-C) Force production as a function of time for GTN (A), EDL (B), and SOL (C) muscles isolated from 10-week-old Con-TD (n = 5) and CKM-TD (n = 6) male mice. Muscles were repeatedly stimulated with 0.5 s duration, once each 5 s for 15 min (A) or 5 min (B and C). (D-O) Muscle mass (D-F), maximum force (G-I), specific maximum force normalized by the cross-sectional area (J-L), and force deficit after fatigue (M-O) were measured from GTN, EDL and SOL muscle tissues. Data are presented as mean±SEM with individual values. *P < 0.05, **P < 0.01, ***P < 0.001, ****P < 0.0001, ns non-significant in Student’s t-test.
CKM-TD muscle histology reveals damaged myofibers
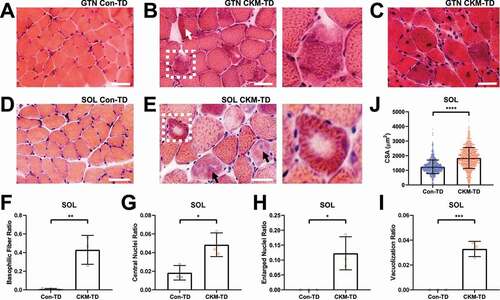
To comprehend the histological basis of functional muscle impairments, we performed hematoxylin and eosin (H&E) staining. Histological examination of GTN (), SOL () and TA (Figure S1E and S1F) myofibers revealed that CKM-TD mouse muscle frequently exhibits degenerative features, such as basophilic fibers (, inset; ), central nuclei (, arrows; ; ), abnormally large nuclei ( and S1F, black arrows; ), internal vacuoles (, inset; ) or cytosolic aggregate structures (Figure S1F, white arrow). It was also noted that, in SOL, myofiber size was substantially increased (), which is consistent with the increased SOL mass in CKM-TD mice (). Myofiber size was also generally increased in GTN (Figure S1G), even though GTN mass was decreased in CKM-TD mice () due to muscle degeneration. Very small degenerating and regenerating fibers () were observed in CKM-TD tissue but not in normal tissue (yellow arrow in Figure S1G). Therefore, although the CKM-TD modulation produced differential effects on muscle mass and myofiber size, it consistently deteriorated muscle homeostasis, leading to myopathy phenotypes across all examined muscle tissues, which is likely the basis of defects in contractile function ().
Figure 3. CKM-TD muscle tissues exhibit early-onset myopathy. (A-E) Hematoxylin and eosin (H&E) staining of GTN (A-C) and SOL (D and E) muscles isolated from 10-week-old Con-TD (A and D) and CKM-TD (B, C and E) male mice. Boxed areas highlighting damaged myofibers are magnified in right. Scale bars: 50 µm. (F-J) Quantification of histological features from SOL muscle sections. (F-I) Frequencies of myofibers exhibiting indicated pathological features were calculated for each mouse. (J) Cross-sectional area (CSA) was quantified for individual myofibers. Three animals per group (≥497 myofibers/mice, whole SOL section) were analyzed. Data are presented as mean±SD with individual values. *P < 0.05, **P < 0.01, ***P < 0.001, ****P < 0.0001 in Student’s t-test.
CKM-TD mice exhibit heart and diaphragm abnormalities
Since Ckm-Cre driver is expressed not only in limb muscles but also in heart and diaphragm muscle tissues [Citation17], we examined the performance of cardiovascular and respiratory systems through ultrasound imaging. Echocardiogram of Con-TD and CKM-TD mice showed contrasting cardiac phenotypes between the two strains (). Consistent with the cardiac hypertrophy observed from postmortem tissues (), both diastolic and systolic left ventricular diameters were highly increased (). Cardiac output, measured as ejection fraction () or fractional shortening (), was dramatically reduced, indicating that the cardiac dilation led to decreased heart performance. Therefore, even though heart rate was relatively constant (), aortic peak velocity was diminished (), and isovolumic contraction (IVCT; ) and relaxation (IVRT; ) times were both increased, indicating both diastolic and systolic dysfunction. The cardiac defects were manifested in both male and female mice (Figure S2A and S2B), although the male data did not reach significance due to its small sample size. These results indicate that CKM-TD mice experience cardiac muscle defects.
Figure 4. CKM-TD mice experience cardiac dysfunction and bradypnea. 10-week-old Con-TD (n = 9) and CKM-TD (n = 7) male and female mice were examined through echocardiography (A-J) and diaphragm ultrasonography (K-S). (A, B, K and L) Representative 2D image (upper) and M-mode diagram (lower). LVDd, left ventricular diameter – diastolic; LVDs, left ventricular diameter – systolic; EF, ejection fraction; FS, fractional shortening; Ao Peak Vel, aorta velocity peak gradient; IVCT, isovolumic contraction time; IVRT, isovolumic relaxation time. Data are presented as mean±SD with individual values. *P < 0.05, **P < 0.01, ***P < 0.001, ns non-significant in Student’s t-test.
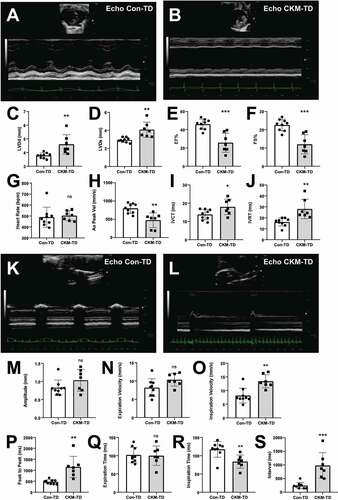
In the ultrasound examination of the diaphragm (), CKM-TD mice exhibited an unusually slow breathing rate with a dramatically increased interval between contractions (Bradypnea; ), suggesting that the diaphragm muscle was also affected by CKM-TD perturbation. The bradypnea phenotype was observed in both the male and female mice (Figure S3A and S3B). Interestingly, in the male mice, the amplitude and velocity of the diaphragm movement was increased (Figure S3B), likely to compensate for defective breathing due to bradypnea.
CKM-TD mice have MTORC1 hyperactivation in muscle
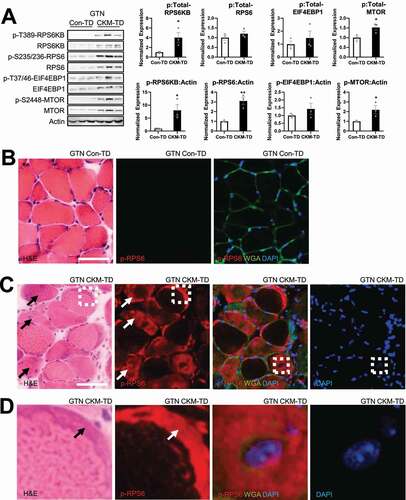
Phosphorylation of the downstream targets of MTORC1, such as RPS6KB, RPS6 and EIF4EBP1 [Citation2], as well as MTORC1-specific MTOR autophosphorylation [Citation18], was increased in GTN (), SOL (Figure S4A) and QUAD (Figure S4B) muscle tissues of CKM-TD mice. Activation of MTORC1 was also manifested in immunohistochemical detection of phosphorylated RPS6 (p-RPS6; ). According to the serial section analyses, degenerating fibers with higher levels of basophilic staining contained even more elevated levels of p-RPS6 (, arrows). Even in the partially degenerated myofibers, p-RPS6 levels were very high in the basophilic regions (, arrows in the left two panels). Some myofibers with high p-RPS6 intensity had an enlarged central nucleus (, boxes in the right two panels; , the right two panels). CKM-TD upregulation of MTORC1 was also observed in cardiac tissues (Figure S4C) and myotube cultures differentiated from primary myoblasts (Figure S4D).
Figure 5. CKM-TD muscle fibers exhibit MTORC1 hyperactivation. (A) Immunoblotting of indicated proteins in indicated tissue samples from Con-TD or CKM-TD mice. Immunoblot quantitation is shown in right. Data are presented as mean±SEM with individual data points. *P < 0.05, **P < 0.01 in Student’s t-test. (B-D) Serial muscle sections were stained with H&E (B-D, left) or phospho-RPS6 (B-D, right panels). Extracellular matrix and nuclei were visualized by wheat germ agglutinin (WGA) and DAPI, respectively (B-D, right panels). Boxed areas in (C) were magnified in the corresponding panels of (D). Scale bars: 50 µm.
CKM-TD muscle activated stress signaling and protein catabolic pathways
To comprehend the molecular nature of myopathy in CKM-TD mice, we performed RNA-seq on GTN muscle tissues isolated from the Con-TD and CKM-TD littermate mice. Compared to the Con-TD transcriptome, the CKM-TD transcriptome had 1,079 significantly upregulated genes and 250 significantly downregulated genes (). Although gene ontology analysis of CKM-TD-downregulated genes did not reveal any biological terms enriched for the group, CKM-TD-upregulated genes were highly enriched with genes that are involved in various biological processes, including cell signal transduction, cell death and cell structure modulation (). Specifically, the expression of various genes involved in cytokine and chemokine pathways (), DNA damage responses (), ER stress response (), and oxidative stress response () were upregulated. Interestingly, genes mediating protein catabolic pathways, such as autophagy (), lysosomal (), and proteasomal () pathways, were also upregulated. Classical muscle atrophy genes associated with proteasomal degradation pathways, such as MAFbx/Fbxo32 and MuRF1/Trim63 [Citation19], were also noticeably upregulated in CKM-TD muscle (). CKM-TD also upregulated Sestrins, stress-inducible feedback inhibitors of MTORC1 () [Citation20,Citation21]. These observations from the transcriptomic analysis suggest that CKM-TD myopathy involves diverse stress signaling pathways involving inflammation, DNA damage, and oxidative injury, as well as pathways controlling autophagy and proteasomal catabolism.
Figure 6. Transcriptome analysis of CKM-TD muscle tissue. GTN muscle tissues of Con-TD and CKM-TD mice (n = 2 each) were subjected to RNA-seq analysis. (A) Effect of CKM-TD modulation of individual gene expression. Each dot represents individual genes. FC, fold change; Pval, statistical significance on CKM-TD-induced gene expression alteration. Differential expression analysis identified 1,079 CKM-TD-upregulated genes and 250 CKM-TD-downregulated genes. (B) Networks of enriched pathways for CKM-TD-upregulated genes, visualized through ClueGO/Cytoscape. CKM-TD-downregulated genes did not reveal significantly enriched gene ontology terms. (C-L) Heat map diagrams representing mRNA expression fold change from averaged control values. Each column represents a muscle sample from a different Con-TD (C1 and C2) and CKM-TD (M1 and M2) mouse.
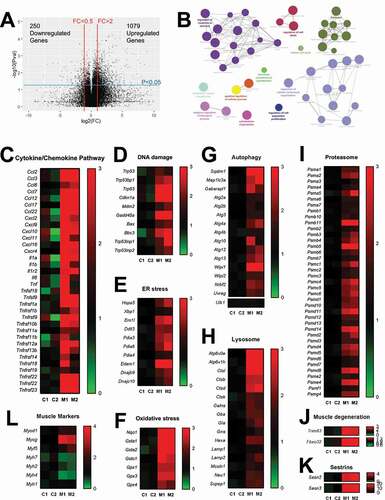
RNA-seq data also indicated that CKM-TD muscle upregulated Myod1, Myog, and Myf5 (), which are myogenic regulatory factors induced during muscle injury and regeneration [Citation22]. In contrast, differentiated fiber type markers, such as Myh7 (Mhc-I), Myh2 (Mhc-IIa), and Myh4 (Mhc-IIb), were downregulated in CKM-TD muscle (), while Myh1 (Mhc-IIx) expression was maintained (). These results collectively indicate that the CKM-TD modulation systematically disrupted muscle homeostasis.
CKM-TD downregulates AKT signaling
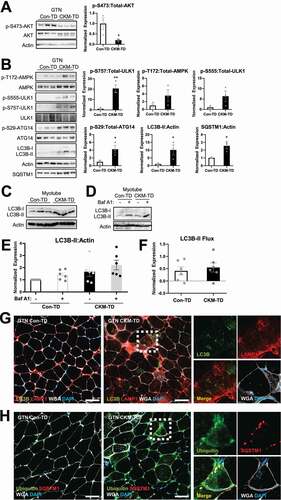
MTORC1 hyperactivation is known to inhibit AKT signaling through feedback inhibition of insulin signaling, precipitating insulin resistance [Citation23]. Inhibition of muscle AKT signaling may upregulate proteasomal and autophagic catabolism through the upregulation of FOXO-family transcription factors [Citation24–26]. To test whether this signaling loop is affected by CKM-TD, we monitored AKT signaling activity through pS473-AKT antibodies. CKM-TD mice displayed remarkably reduced AKT signaling in all of the muscle tissues we examined, including GTN (), SOL (Figure S5A) and QUAD (Figure S5B) tissues. This finding is consistent with the notion that MTORC1 hyperactivation can inhibit AKT signaling through induction of insulin resistance (Figure S5C).
Figure 7. Dysregulated autophagy in CKM-TD muscle tissue. (A and B) Immunoblotting of indicated proteins in indicated tissue samples from Con-TD or CKM-TD mice. Immunoblot quantitation is shown in right. Data are presented as mean±SEM with individual data points. *P < 0.05, **P < 0.01 in Student’s t-test. (C-F) Primary myoblasts were isolated from Con-TD or CKM-TD mice, differentiated into myotubes, and subjected to autophagic flux assays. Immunoblotting (C and D) and immunoblot quantification (E and F; mean±SEM with individual data points) results were presented. LC3B-II Flux is expressed as the difference between the levels of LC3B-II:Actin in a batch of cells, before and after bafilomycin A1 treatments. (G and H) Immunostaining of indicated proteins in the GTN muscle of Con-TD and CKM-TD mice. Extracellular matrix and nuclei were visualized by wheat germ agglutinin (WGA) and DAPI, respectively. Boxed areas are highlighted in right. Scale bars: 50 µm.
CKM-TD upregulates the levels of autophagosome/lysosome markers
MTORC1 is known to phosphorylate ULK1 at Ser757, which subsequently inhibits the ULK1 activity. Consistent with MTORC1 hyperactivation in CKM-TD tissues ( and S4), ULK1 phosphorylation at Ser757 was upregulated in CKM-TD tissues (pS757; and S5D). AMPK is another ULK1-regulating kinase, which produces ULK1 activation through phosphorylation of Ser555 [Citation27,Citation28]. Phosphorylation of AMPK subunit PRKAA (p-T172), as well as AMPK-dependent phosphorylation of ULK1 (pS555) was also higher in CKM-TD muscle tissues compared to Con-TD tissues ( and S5D). Phosphorylation of ATG14, a ULK1 substrate, was also higher in CKM-TD (p-S29-ATG14; and S5D), indicating that the ULK1 signaling was activated in CKM-TD tissues. Based on the ATG14 results, MTORC1-mediated inhibitory effects on ULK1 seem to have been overridden by strong activating effects of stress signaling pathways such as AMPK.
Consistent with the role of ULK1 in promoting autophagosome synthesis, autophagosome marker LC3-II was elevated in CKM-TD tissues (LC3B-II; and S5D). Interestingly, the level of autophagy substrate SQSTM1/p62 was also increased in CKM-TD tissues (SQSTM1; and S5D), which may be due to its increased expression (). Similar patterns of ULK1-autophagy regulation were observed in the heart tissue (Figure S5E). Also, in the primary cell culture system, CKM-TD myotubes exhibited higher levels of LC3B-II expression (). Autophagic flux assay showed that autophagosome synthesis and degradation was detectable in CKM-TD myotubes (). Therefore, even though MTORC1 can block autophagy induction by suppressing ULK1 signaling in homeostatic conditions [Citation3], TSC1 and DEPDC5 depletion unexpectedly led to autophagosome accumulation, despite MTORC1 hyperactivation (Figure S5F).
Results from the immunostaining of lysosomal protein LAMP1 were consistent with those from the RNA-seq experiments, which showed lysosomal gene upregulation by CKM-TD (). LAMP1 was upregulated in CKM-TD muscle, most pronouncedly in the interstitial compartment (). Although intramyofiber LAMP1 and LC3B levels were also elevated (), CKM-TD muscle accumulated high levels of autophagic substrates, such as ubiquitin and SQSTM1 (); this, along with the SQSTM1 immunoblot results described above, suggested that the degradation steps of autophagy are slowed down, limited, or at least insufficient in CKM-TD mice, leading to the accumulation of autophagic substrates in the tissues.
CKM-TD provokes formation of stress granules in myocytes
Diverse stress signals, such as DNA damage, oxidative stress, and ER stress, can provoke the formation of stress granules [Citation29]. The depletion of ULK1 in muscle can also provoke stress granule formation, which is associated with muscle degeneration [Citation30]. Since CKM-TD muscles experience stress insults while experiencing ULK1 signaling upregulation, we were curious whether stress granules would be observed in the degenerating myofibers of the CKM-TD mice. In immunohistochemical staining, TIA1, a stress granule marker, was prominently found in myofibers of CKM-TD mice (Figure S6A and S6B). TIA1 was not colocalized with autophagy substrate SQSTM1 (Figure S6A) or autophagosome marker LC3B (Figure S6B), indicating that stress granules are not targeted to the autolysosomal pathways in our system.
CKM-TD displays oxidative stress associated with mitochondrial enzyme dysregulation
Because the RNA-seq of CKM-TD muscle revealed upregulation of various antioxidant defense genes (), we examined the levels of oxidative stress in Con-TD and CKM-TD muscle tissues through dihydroethidium (DHE) staining, which visualizes superoxide radicals [Citation31]. DHE staining revealed that CKM-TD exhibited prominently elevated superoxide levels, which were higher in degenerating myofibers (). To further substantiate this finding, we performed oxyblot, which quantitatively measures protein oxidation in skeletal muscles [Citation32]. Consistent with the DHE staining results, the oxyblot showed that CKM-TD muscle experienced increased oxidative stress across all muscle samples examined ().
Figure 8. Oxidative injuries and mitochondrial abnormalities in CKM-TD muscle tissue. (A) GTN muscle from Con-TD and CKM-TD was stained with dihydroethidium (DHE) staining that visualizes superoxide radicals. Boxed areas are magnified below. (B) Oxyblot analysis of indicated muscle lysates. The presented oxyblot data covers the entire area between 37kD and 75kD molecular weight markers. Oxyblot intensities were quantified (n = 5) in the bottom panel. Data are presented as mean±SD with individual values. ***P < 0.001 in Student’s t-test. (C-E) GTN (C) and SOL (D and E) tissues were stained for mitochondrial COX (C and D) and SDH (E) enzymatic activities. Boxed areas are magnified below. (F) Serial sections of SOL were stained with H&E (upper) and COX assay (lower). Degenerating fibers exhibit aberrantly higher (blue arrows) or lower (green arrows) activities of COX. Scale bars: 100 µm.
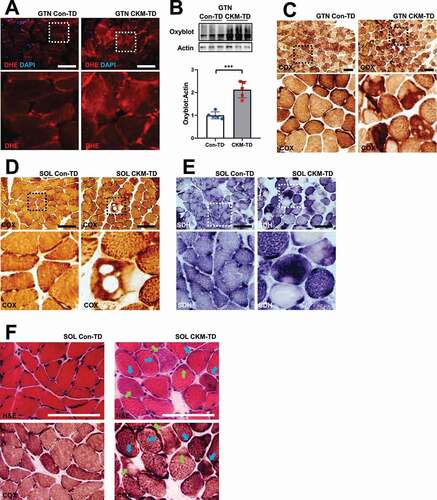
Histological assay of mitochondrial enzymes, such as cytochrome oxidase (COX; ) and succinate dehydrogenase (SDH; ), revealed that these enzymatic activities, which can lead to the production of superoxides, are aberrantly high in a subset of myofibers. However, some of the fibers had holes that exhibited no enzymatic activities, which could be due to the absence or extensive damage of mitochondria (). Indeed, serial section examination demonstrated that degenerating fibers exhibit aberrant upregulation (blue arrows; ) or downregulation (green arrows; ) of COX activity in histological sections, indicating that mitochondrial enzyme dysregulation accompanies muscle degeneration.
Tempol restores muscle structure and functionality in CKM-TD mice
Using tempol, a chemical scavenger for superoxides [Citation33,Citation34], we tested whether the excessive accumulation of oxidative stress plays a pathogenetic role in CKM-TD myopathy. Ten days of tempol administration did not significantly change the body weight of CKM-TD mice (). However, tempol substantially restored the grip force in CKM-TD mice (). Body weight-normalized grip force of tempol-treated CKM-TD mice was indistinguishable from that of Con-TD mice ().
Figure 9. Tempol reduces oxidative stress and restores grip strength in CKM-TD mice. 7-week-old CKM-TD male mice were given normal drinking water (n = 5) or water containing 0.064% tempol (n = 5). Littermate Con-TD mice on normal drinking water (n = 5) were used as the wild-type control. (A) Body weight was measured after ten days of control and tempol administration. (B and C) Grip force was analyzed. (D and E) GTN (D) and SOL (E) tissues were analyzed through DHE staining. Boxed areas are magnified below. Scale bars: 100 µm. Data are presented as mean±SEM with individual data points. *P < 0.05, **P < 0.01, ****P < 0.0001, ns non-significant in Student’s t-test.
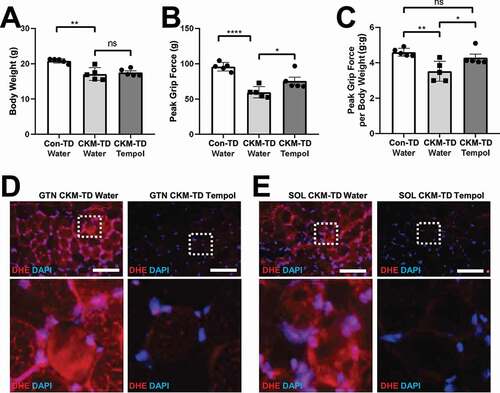
We tested if tempol indeed alleviated superoxide accumulation in CKM-TD muscle tissues through DHE staining. Compared to the water-fed CKM-TD mice, which exhibited aberrantly high superoxide levels, tempol-fed CKM-TD mice downregulated the superoxide levels (), indicating that tempol can relieve oxidative stress in the CKM-TD muscle tissue.
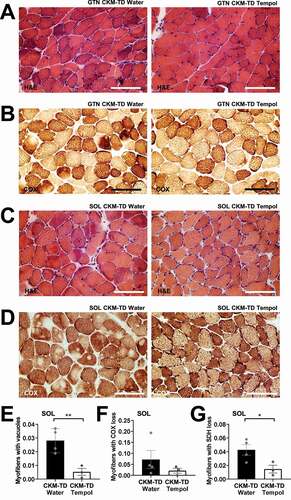
We also examined if tempol administration can restore histological abnormalities of CKM-TD mice. Muscle tissues from tempol-fed CKM-TD mice showed a dramatic improvement in muscle morphologies () and contained significantly smaller numbers of abnormal fibers (). Likewise, tempol-fed CKM-TD mice exhibited restoration of the normal mitochondrial activity staining pattern (, S7A and S7B) and contained significantly fewer fibers with aberrant mitochondrial enzymatic activities (). These results collectively demonstrate that tempol administration was effective in ameliorating the CKM-TD myopathy and improving the muscle function and integrity, perhaps by rescuing mitochondrial function and suppressing superoxide accumulation.
Figure 10. Tempol relieves CKM-TD muscle histopathologies. (A and B) GTN tissues from water- and tempol-fed CKM-TD mice were analyzed by H&E (A) and COX (B) staining. (C and D) SOL tissues were analyzed by H&E (C) and COX (D) staining. (E-G) Myofibers with aberrant staining patterns were quantified for water (n = 4) and tempol (n = 3) groups. Scale bars: 100 µm. Data are presented as mean±SEM with individual data points. *P < 0.05, **P < 0.01 in Student’s t-test.
Tempol reduces autophagy signaling in CKM-TD skeletal muscle
Although tempol substantially restored CKM-TD myopathy (), it did not suppress MTORC1 signaling in CKM-TD muscle, as monitored by the phosphorylation of its downstream target RPS6 (). Tempol also did not upregulate AKT signaling; rather, it further reduced AKT phosphorylation and phosphorylation of its downstream target FOXO3 (). Therefore, the myopathy-improving effect of tempol seems to be independent of MTORC1 or AKT regulation.
Figure 11. Tempol downregulates autophagy signaling in CKM-TD muscle. (A-C) Immunoblotting of indicated proteins in QUAD tissues isolated from water- and tempol-fed CKM-TD mice. Immunoblot quantitation is shown in right. (D-F) Primary myoblasts were isolated from CKM-TD mice, differentiated into myotubes, and subjected to autophagic flux assays with indicated drug treatments. Immunoblotting (D) and immunoblot quantification (E and F) results were presented. LC3B-II Flux is expressed as the difference between the levels of LC3B-II:Actin in a batch of cells, before and after bafilomycin A1 treatments. Data are presented as mean±SEM with individual data points. *P < 0.05, **P < 0.01, ***P < 0.001, ns non-significant in Student’s t-test.
We also tested whether the autophagic phenotypes observed in CKM-TD muscle can be altered by tempol administration. AMPK-induced phosphorylation of ULK1 and ULK1-mediated phosphorylation of ATG14 were both downregulated by tempol (), indicating that with less oxidative stress, AMPK-ULK1 hyperactivity in CKM-TD tissues was reduced. Consistent with this, AMPK activities were also generally downregulated in CKM-TD tissues although they showed more variations across the tissue (Figure S8A-S8C). However, there were no significant changes in steady-state LC3B-II levels, and SQSTM levels were downregulated ().
Experiments in cultured myotubes indicated that tempol treatment substantially reduced autophagic flux measured using bafilomycin A1 (). Rapamycin, which directly inhibits MTORC1, also decreased autophagic flux (); however, the effects were not as pronounced compared to tempol. Since tempol inhibits oxidative stress but not MTORC1 (), it is possible that high MTORC1 activity in tempol-treated CKM-TD cells led to a strong reduction in autophagic flux in the absence of oxidative stress insults. Despite the decreased autophagic flux, the reduction in oxidative stress would have decreased the muscle damage and the accumulation of autophagic substrates such as SQSTM1 ().
Autophagic flux assays using chloroquine (Figure S9) confirmed and further substantiated the initial observations made using bafilomycin A1 (), including that (1) Autophagosome levels are massively increased in CKM-TD cells. (2) Autophagic flux is still detectable in CKM-TD cells. (3) Rapamycin and Tempol did not promote the flux in CKM-TD cells and rather tends to suppress it. Since rapamycin was not effective in normalizing the autophagic homeostasis when treated for both long (24 h; Figure S9A) and short (2 h; Figure S9B) term, it is possible that the autophagy phenotypes exhibited by CKM-TD might not be associated with hyperactive MTORC1 but with non-canonical targets of TSC1 and DEPDC5. In addition, limitation of the degradation steps in mutant myotubes may have contributed to the abnormal accumulation of LC3B-II based on the minor increase in LC3B-II levels observed upon chloroquine treatment (Figure S9).
Interestingly, the effect of tempol on autophagic signaling was quite different in the heart. Although RPS6 phosphorylation in CKM-TD heart was not affected by tempol as was observed in CKM-TD skeletal muscle (Figure S10A and S10B), AMPK-induced ULK1 phosphorylation became higher in tempol-treated CKM-TD hearts (Figure S10A and S10B). Furthermore, ULK1-induced ATG14 phosphorylation was also upregulated by tempol (Figure S10A and S10B), indicating further upregulation in the ULK1-ATG14-autophagy initiation pathway. Interestingly, the SQSTM levels were downregulated in the tempol-treated heart (Figure S10A and S10B), consistent with the observation from the skeletal muscle. These results suggest that, even though tempol generally restores protein homeostasis in CKM-TD tissues, its effect on autophagy signaling could be different across different tissues. It also suggests that AMPK and ULK1 may be activated by hyperactive MTORC1 through pathways that do not involve oxidative stress signaling, at least in the heart.
Discussion
The current work provides a novel model of uncontrolled MTORC1 hyperactivation in which both the growth factor and nutrient signaling pathways were maximally activated (). Former models of MTORC1 activation involved upregulation of single arms and showed no pathological muscle degeneration at early ages [Citation6,Citation14–16]. In contrast to these former models, the CKM-TD model, which has concomitant deletion of Tsc1 and Depdc5 genes, was sufficient to produce early-onset myopathy associated with cardiac failure, bradypnea, skeletal muscle dysfunction, and early lethality. Diminished cardiac output, manifested in our echocardiography analysis (often less than 50% of normal output), is one of the most likely contributors of early sickness and death observed in the CKM-TD mice. It is also possible that the skeletal and cardiac muscle phenotypes interact with each other, aggravating the pathologies in each of the organs. The severity of CKM-TD muscle pathologies presented in this study may also be an underestimation of the actual CKM-TD effects because all dead animals with severe pathologies were excluded from the analysis.
MTORC1 is considered a promoter of aging, and pharmacological MTORC1 inhibition extends lifespan and healthspan in multiple model organisms [Citation1]. Previous studies found that even normal wild-type myofibers can exhibit occasional MTORC1 hyperactivation in aged muscle tissue, which is associated with age-associated myofiber deterioration [Citation14]. Since our data suggest that MTORC1 activation per se is enough to provoke myopathy associated with mitochondrial enzyme dysregulation, MTORC1 may be an effector of muscle aging that directly damages myofiber integrity. Notably, mitochondrial damage is also known to provoke MTORC1 hyperactivation in muscle [Citation35]. Therefore, mitochondrial damage and MTORC1 hyperactivity seem to produce a vicious cycle of muscle degeneration by forming a positive feedback loop during later ages. Inhibition of either MTORC1 or oxidative stress could provide a clinically relevant attenuation of age-associated myopathy. Consistent with this idea, rapamycin administration was effective in restoring muscle mass and force [Citation36], as well as mitochondrial quality [Citation37], in aged mice.
One of the unexpected findings from the current study is that CKM-TD modulation can paradoxically activate the ULK1 kinase, which is known to induce autophagosome formation through phosphorylation of several substrates, such as ATG14 [Citation38] and BECN1 [Citation39]. In the homeostatic condition, it is very well established that MTORC1 suppresses autophagy initiation by suppressing the activity of ULK1 (), through inhibitory phosphorylation at residues such as Ser757 [Citation3]. When MTORC1 is inhibited by nutrient starvation or rapamycin, ULK1 is activated and phosphorylates its substrates to initiate autophagosome synthesis. The current study indicates that, although CKM-TD strongly activates MTORC1 signaling, it can also upregulate ULK1 signaling through several mechanisms that partially involve oxidative stress (). For instance, oxidative stress can induce Sestrins, a stress-inducible protein family that can activate AMPK [Citation20,Citation40]. Oxidative stress can also damage mitochondria and provoke dysregulation of mitochondrial enzymes, which can activate AMPK through energy deprivation [Citation41]. AMPK hyperactivation can lead to ULK1 upregulation through phosphorylation of Ser555 and additional residues [Citation42]. The AMPK-ULK1 axis was formerly shown to be of specific importance for oxidative stress-induced autophagy and cell death [Citation43,Citation44]. However, we cannot rule out the possibility that there are AMPK-independent mechanisms of how CKM-TD and oxidative stress can upregulate ULK1. For instance, oxidative stress-induced Sestrins may directly activate ULK1 without involvement of AMPK [Citation45]. Regardless of the specific mechanism, CKM-TD indirectly upregulated phosphorylation of ULK1 and the ULK1 target ATG14, despite the fact that hyperactive MTORC1 still directly phosphorylated Ser757 of ULK1, which produces inhibitory effects. It is most likely that the inhibitory Ser757 phosphorylation was overridden by the activating signals conferred by AMPK and other stress-induced signaling pathways in the context of MTORC1 hyperactivation. Indeed, ULK1-dependent LC3B-II synthesis and flux was detectable in CKM-TD myotubes.
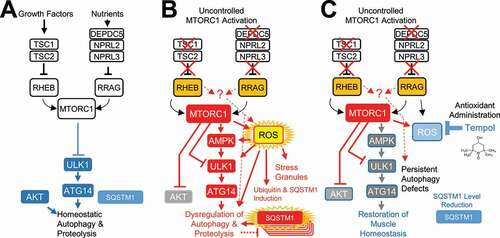
Figure 12. CKM-TD mice provide a novel animal model of hyperactive MTORC1-induced myopathy that is associated with excessive oxidative damage. (A) Homeostatic MTORC1 activities suppress ULK1 while allowing for physiological activation of autophagy during nutrient starvation and growth factor limitation. (B) Excessive MTORC1 activation through concomitant disruption of TSC1 and DEPDC5 paradoxically upregulates ULK1, the kinase activating autophagy initiation, through oxidative stress-dependent pathways. However, due to excessive oxidative stress, expression of SQSTM1 and ubiquitin-labeled damaged proteins was increased and accumulated in CKM-TD muscle. (C) Administration of a superoxide scavenger tempol ameliorates CKM-TD myopathy with decreased levels of mitochondrial abnormalities and SQSTM1 accumulation. Subsequently, restoration of redox homeostasis improves muscle structure and function. Nevertheless, neither rapamycin nor tempol was able to completely normalize autophagy in CKM-TD cells, suggesting that the autophagy phenotypes of CKM-TD cells could be independent of MTORC1 hyperactivation or oxidative stress accumulation.
In addition to the ULK1 upregulation, transcriptome profiling by RNA-seq also showed that MTORC1 hyperactivation upregulated many genes involved in the autophagy pathway, including Sqstm1, Lc3s, Gabaraps, Wipis and various Atg genes (). However, interestingly, expression levels of total ULK1 did not show substantial changes (). Expression of lysosomal genes, such as lysosomal ATPases, cathepsins, and LAMPs, was also highly increased (). It was formerly shown that the FOXO3 transcription factor can mediate autolysosomal gene upregulation in conditions of AKT inhibition, AMPK activation, and/or oxidative stress accumulation [Citation46–49]. Since CKM-TD muscle tissues experience AKT downregulation and activation of AMPK and oxidative stress signaling, it is possible that they upregulate autophagy gene expression through FoxO3. However, CKM-TD still accumulated a lot of autophagy substrates, such as ubiquitinated proteins and SQSTM1, indicating that increased autolysosomal activities are insufficient for removing all these substrates, which could be a byproduct of oxidative stress induced by hyperactive MTORC1. Increased SQSTM1 expression may have also contributed to the transcription of antioxidant genes () through activation of the KEAP1-NFE2L2/NRF2 signaling pathway [Citation50]. Importantly, tempol administration and subsequent quenching of oxidative stress was sufficient to alleviate SQSTM1 accumulation in both skeletal () and cardiac (Figure S10) muscle tissues, although the effect of tempol on autophagy signaling was different between skeletal and cardiac tissues. Therefore, SQSTM1 accumulation in CKM-TD tissues seems to be mainly caused by oxidative stress-dependent induction, not by the blockade of autophagic catabolism. Nevertheless, attenuation of the autophagosome degradation steps may have still contributed to the accumulation of these autophagy substrates; such attenuation would be independent of MTORC1 hyperactivation since rapamycin was not sufficient to reverse LC3B-II accumulation in vitro ( and S9).
The mechanism of how hyperactive MTORC1 can provoke accumulation of excessive superoxide radicals is still elusive. There are several reports that MTORC1 can alter mitochondrial metabolism through modulation of mitochondrial enzymes or mitochondrial protein translation [Citation35,Citation51]. Indeed, slight upregulation of MTORC1 in the muscle through mutation of Nprl2, a GATOR1 component, was sufficient to alter mitochondrial metabolism substantially [Citation15]. In addition, MTORC1-mediated inhibition of autophagy, which occurs in the early phase of MTORC1 activation, may deteriorate mitochondrial quality control, leading to the accumulation of dysfunctional mitochondria [Citation20,Citation52]. However, the autophagy inhibition may not be the major mechanism of how MTORC1 damages mitochondria because tempol, which further inhibits autophagic flux in CKM-TD tissue, rather restored mitochondrial homeostasis. MTORC1 is also known to suppress superoxide-scavenging activities of Sod1 [Citation53], which is important for attenuating muscle aging. It is also possible that MTORC1 produces oxidative stress through non-mitochondrial mechanisms, such as through NADPH oxidases that are abundantly expressed in muscle, which can produce superoxides and induce mitochondrial dysfunction [Citation54]. Since MTORC1 hyperactivation in the liver is shown to provoke excessive oxidative stress [Citation55], it is also possible that there is a common mechanism of MTORC1-induced oxidative stress across different tissues.
It should be also noted that rapamycin-mediated MTORC1 inhibition, as well as tempol-mediated oxidative stress amelioration, was not sufficient to restore autophagic homeostasis in cultured CKM-TD myotubes. Therefore, it is possible that autophagy phenotypes exhibited by CKM-TD might involve molecular pathways other than MTORC1 regulation. For instance, it was previously reported that TSC1-RHEB has non-canonical targets unrelated to MTORC1 [Citation56], some of which may directly control autophagy. Likewise, RRAG was also shown to control lysosomal homeostasis independently of MTORC1 regulation [Citation57]. Therefore, it is possible that concomitant overactivation of RHEB and RRAG produced defects in autophagy in a way that is independent of MTORC1 and oxidative stress.
In summary, we provide a new animal model of muscular MTORC1 hyperactivation and autophagy dysregulation, which displays early-onset myopathy accompanied by cardiovascular defects and early fatality. Using this model, we show that the concomitant loss of TSC1 and DEPDC5 can quickly disrupt muscle homeostasis and provoke the wasting of muscle mass through excessive oxidative stress. Short-term administration of a superoxide scavenger, tempol, was effective in restoring muscle homeostasis, integrity, and functionality, although it was insufficient to restore all autophagy defects (). This work provides a novel insight into understanding the relationship between MTORC1 and muscle aging because muscle aging involves the occasional hyperactivation of MTORC1, which may play a causal role in oxidative stress accumulation and muscle degeneration.
Materials and methods
Mouse strains and rearing conditions
As described previously [Citation55], Tsc1F/F and Depdc5F/F strains originated from Jackson laboratories (005680) and European Mouse Mutant Archive (EM: 10,459), respectively, and were backcrossed to C57BL/6 mice. Ckm-Cre on a C57BL/6 background also originated from Jackson laboratories. Ckm-Cre positive (CKM-TD) and negative (Con-TD) strains of Tsc1F/FDepdc5F/F littermate mice were used for the analyses.
Mice were maintained in filter-topped cages and given free access to autoclaved regular chow diet (LFD; Lab Diet, 5L0D) and water at the University of Michigan, according to National Institutes of Health (NIH) and institutional guidelines. We complied with all relevant ethical regulations for animal testing and research. All experiments were approved by the University of Michigan Institutional Animal Care & Use Committee (IACUC protocol numbers: PRO00007710, PRO00006772, and PRO00006689).
For survival experiments, mice were evaluated daily using the End Stage Illness Scoring System set by the IACUC, and moribund animals undergoing an illness score of 9 or more were euthanized and counted as dead. Except for longitudinal analyses, 10-week-old mice were used for the experiments. Tempol (4-hydroxy-2,2,6,6-tetramethylpiperidine-1-oxyl; Sigma, 176,141) was administered to mice in drinking water (0.064%) for the last ten days before experiments.
Muscle force measurement
Grip strength was measured using live mice through the Columbus Instruments Grip Strength Meter. At least three measurements were used to calculate the mean value for each mouse. Force measurements for individual muscle tissue were done similarly to the previously described procedure [Citation58] with a minor modification, as described below. For in situ measurements of GTN contractile properties, the whole GTN muscle was isolated from the surrounding muscle and connective tissues from mice under the surgical plane of isoflurane anesthesia. The muscle was then severed and secured to the lever arm of a servomotor (Aurora Scientific, model 305B). The muscle was stimulated via the tibial nerve using a bipolar platinum wire electrode. Stimulation voltage (typically 5–10 V) and then muscle length were adjusted to give the maximum twitch force (Pt). With the muscles held at optimal muscle length, trains of 0.2-ms stimulus pulses were applied at increasing frequencies until a maximum isometric force (Po) was reached. For the fatigue test, muscles were stimulated with 100-Hz trains of 0.5 s duration, once each 5 s for 15 min. Ex vivo measurements of SOL and EDL contractile properties were performed similarly to that described for GTN muscles, except that the measurements were made in vitro, and the duration of the fatigue protocol was 5 min, instead of 15 min. For SOL and EDL measurements, each muscle was removed from the animal and placed in a horizontal bath containing buffered mammalian Ringer solution [Citation58] maintained at 25°C and bubbled with 95% O2-5% CO2 to stabilize pH at 7.4. One tendon was tied to a force transducer (Kulite Semiconductor Products, model BG-50) and the other tendon to a fixed post. Muscles were stimulated between two stainless steel plate electrodes. After all force measurements, muscles were blotted and weighed, and the total fiber cross-sectional area was calculated by dividing the muscle mass by the product of fiber length (determined from previously established muscle length-to-fiber length ratios) and muscle density, 1.06 g/cm2. Specific Po (kN/m2) was calculated for each muscle by dividing Po by cross-sectional area.
Antibodies
Ubiquitin (sc-8017), LAMP1 (sc-20,011), RPS6KB/S6K (sc-8418), TIA1 (sc-1751), MYH (sc-32,732) and FOXO3 (sc-11,351) are from Santa Cruz Biotechnology. p-S2448-MTOR (2971), MTOR (2983), p-T389-RPS6KB/S6K (9234), p-T172-AMPK (2535), p-S555-ULK1 (5869), p-S757-ULK1 (14,202), AMPK (2532), p-T37/46-EIF4EBP1/4E-BP1 (2855), p-S318/321-FOXO3 (9465) EIF4EBP1/4E-BP1 (9452), p-S473-AKT (4060), p-T308-AKT (4056), AKT (4691), SQSTM1/p62 (5114), p-S29-ATG14 (13,155), ATG14 (5504), LC3B (2775), p-S235/236-RPS6 (2211) and RPS6 (2317) are from Cell Signaling Technology. Actin (JLA20) antibody is from Developmental Studies Hybridoma Bank.
Immunoblotting
For immunoblotting, tissues were homogenized in radioimmunoprecipitation assay (RIPA) buffer (50 mM Tris–HCl, pH 7.4, 150 mM NaCl; 1% sodium deoxycholate [Sigma, D6750], 1% NP-40 [Sigma, I8896], 1% Triton X-100 [Amresco, M143], and complete protease inhibitor cocktail [Roche, 11,836,170,001] and clarified by centrifugation at 14,000 g for 10 min. After protein quantity normalization using the Bio-Rad protein assay kit (Bio-Rad, 5,000,006), lysates were boiled in 1X SDS sample buffer, separated by SDS-PAGE, transferred to PVDF membranes and probed with primary antibodies and then with horseradish peroxidase-conjugated secondary antibodies (Bio-Rad, 1,706,515 and 1,706,516). Oxyblot analysis was performed using the OxyBlotTM Oxidized Protein Detection Kit (Chemicon, S7150), according to the manufacturer’s instruction. Chemiluminescence was detected using LAS4000 (GE) systems.
Muscle histology
Muscle histology was done similarly to previously described procedures [Citation59,Citation60] with a minor modification, as described below. Whole mouse SOL, GTN, EDL and TA muscles were snap-frozen in O.C.T compound (Tissue-Tek, 4583) using isopentane, cooled in liquid nitrogen, cut into ten-µm-thick cryosections, and subjected to hematoxylin and eosin (H&E) staining.
For immunostaining, muscle cryosections were fixed in 4% paraformaldehyde in PBS (gibco, 10,010–023), permeabilized in 0.5% Triton X-100 in PBS, and treated in a blocking solution (5% donkey serum; Sigma, D9663). The sections were incubated overnight at 4°C with indicated primary antibodies. The primary antibodies were detected with fluorescence-conjugated secondary antibodies (Alexa Fluor 594: Invitrogen, A-21207; Alexa Fluor 647: Invitrogen, A-31573). To visualize the extracellular matrix, wheat germ agglutinin (WGA) lectin conjugated to Alexa Fluor 488 (Life Technologies, W11261) was used. To visualize nuclei, DAPI (Invitrogen, D21490) was used. Fluorescence images were obtained through Nikon A1 confocal microscope.
For mitochondrial assays, succinate dehydrogenase (SDH, complex II) and cytochrome oxidase (COX, complex IV) activities were monitored from fresh frozen sections, as previously described [Citation60–62]. For SDH assays, the sections were dried at the room temperature for 10 min, rehydrated with PBS (pH 7.2), and then incubated in a complex II assay solution containing 50 mM phosphate buffer, pH 7.4, 50 mM succinic acid (Sigma, S2378), and 0.5 mg mL-1 nitroblue tetrazolium (NBT; Sigma, N5514) at 37°C in a humidity chamber for 30 min. For COX assays, a complex IV assay solution containing 0.75% sucrose (Sigma, S0389), 0.05% 3,3´-diaminobenzidine tetrahydrochloride (DAB; Sigma, D5637), 0.001% CAT (catalase; Sigma, C9322), and 0.05% CYCS (cytochrome c, somatic; Sigma, C2037) in PBS (pH 7.6) was used. The sections were washed in distilled water, dried, and then mounted in glycergel mounting medium (Dako, C0563). All histological sections were imaged under a light microscope (Meiji).
For superoxide detection, fresh frozen muscle sections were stained with DHE (Thermo Fisher Scientific, D11347) and DAPI (Invitrogen, D21490) and imaged under a fluorescence-equipped light microscope.
RNA-Seq data analysis
RNA-seq data were processed similarly to previously described procedures [Citation55]. Ten µg of DNAase I-treated total RNA, purified from GTN muscle tissues of Con-TD and CKM-TD mice, were submitted to BGI for mRNA enrichment, library construction, and sequencing (BGISeq 50SE), and processed through standard experimental and analytical pipelines. Each sample produced more than 20 M clean reads that were mapped to the mm9 reference genome using STAR [Citation63]. Then, Cufflinks was used to generate Fragments Per Kilobase of transcript per Million mapped reads (FPKM) table [Citation64]. The raw and processed RNA-seq data are available at the Gene Expression Omnibus database (GEO accession number GSE184646).
Echocardiography
Echocardiography was carried out similarly to the previously described procedure [Citation65] with a minor modification, as described below. The mice were subjected to isoflurane anesthesia (induction, 2%; maintenance, 1.5%) via a nasal mask. Two dimensional and M-mode images subsequently used for measurements were obtained from both parasternal long- and short-axis views. Left ventricular end-diastolic diameter (LVDd) and left ventricular end-systolic diameter (LVDs) were obtained from the parasternal short axis in M-mode recordings of the left ventricular (LV). Then, the LV fractional shortening (FS) and ejection fraction (EF) were calculated from the LV dimensions using the following formula: FS = (LVDd – LVDs)/LVDd, EF = (7/(2.4 + LVDd) * LVDd3 – 7/(2.4 + LVDs) * LVDs3)/(7/(2.4 + LVDd) * LVDd3). Aortic peak velocity, isovolumic contraction (IVCT) and relaxation (IVRT) were obtained from the pulsed wave Doppler analysis.
Diaphragm ultrasonography
Diaphragm Ultrasonography was also conducted using the previously described procedure [Citation66]. Diaphragm motion, observed in M-mode, was recorded for three or more respiratory cycles, from which all the presented parameters were measured and calculated.
Primary myoblast culture
Primary myoblasts were isolated from hind limb muscles of 2-month-old Con-TD and CKM-TD male littermates. The isolated myoblasts were cultured in myoblast growth media (F-10 media [Gibco, 11,550,043], 20% FBS, 10 ng/ml FGF2/basic fibroblast growth factor [PeproTech, 100–18B], penicillin-streptomycin) on 10% Matrigel (Corning, 354,234)-coated plates. For differentiation into myotubes, when primary myoblasts were around 95% confluency, differentiation media (DMEM [ATCC, 30–2002], 2% horse serum [gibco, 26,050,088]) was added and the culture was maintained until mature differentiation (~5 days). To measure autophagic flux, bafilomycin A1 (Baf A1, 100 nM; LC-Labs, B-1080) or chloroquine (CQ, 100 µM; Sigma, C6628) was treated for 3 h. Tempol (2 mM; Sigma, 581,500) and rapamycin (Rap, 200 nM; LC-Labs; R-5000) were used for 2 or 24 h.
Statistical analysis
Data are shown as mean ± SEM or mean ± SD, as indicated in the corresponding Figure Legends. Bar graphs show all raw data points. For two-group comparisons, statistical differences were assessed by Student’s t-test. Survival curves were assessed through the Log-rank (Mantel-Cox) test. Two-way ANOVA (for complete datasets) or Mixed-effects model (for datasets with missing data point) was used to evaluate the effects of time and strain and assess the interactions and synergy between them. Sidak’s multiple comparisons test was used to calculate the significance at individual time points. Volcano plot was generated through a customized R script. Gene enrichment analysis was performed on Cytoscape equipped with the ClueGo plugin. The heat map tables were generated from the GraphPad Prism 8.0 software (GraphPad Software, La Jolla, CA, USA), using which all P values were calculated (*P < 0.05, **P < 0.01, ***P < 0.001, ****P < 0.0001, ns non-significant). Western blots were quantified from band intensities. Experiments with different batches of cells () were normalized using the untreated control sample as a reference (“1”). Experiments with the same batch of cells were analyzed without normalization using the similarly exposed immunoblot images; Fisher’s least significant difference (LSD) test was used to calculate the significance of autophagic flux in these samples. Experiments with the animal tissues were all from the same cohort and analyzed in the same blot.
Supplemental Material
Download Zip (146.4 MB)Acknowledgments
We thank Dr. Dan Michele, Steven Whitesall, Kimber Converso-Baran and the University of Michigan Frankel Cardiovascular Center-Physiology Phenotyping Core for grip tests and ultrasound examinations, Drs. Richard Miller, David Lombard and Scott Pletcher for access to lab equipment, Drs. Hojoong Kwak and Sim Namkoong for sharing codes, Bondong Gu and Steve Gong for technical assistance, Lee and Brooks lab members for helpful discussion, and Santa Cruz Biotech Inc. for sharing reagents.
Disclosure statement
Disclosure Statement No potential conflict of interest was reported by the author(s)
Supplementary material
Supplemental data for this article can be accessed here.
Additional information
Funding
Related Research Data
References
- Cornu M, Albert V, Hall MN. mTOR in aging, metabolism, and cancer. Curr Opin Genet Dev. 2013;23(1):53–62.
- Hay N, Sonenberg N. Upstream and downstream of mTOR. Genes Dev. 2004;18:1926–1945.
- Dunlop EA, Tee AR. mTOR and autophagy: a dynamic relationship governed by nutrients and energy. Semin Cell Dev Biol. 2014;36:121–129.
- Bentzinger CF, Romanino K, Cloetta D, et al. Skeletal muscle-specific ablation of raptor, but not of rictor, causes metabolic changes and results in muscle dystrophy. Cell Metab. 2008;8:411–424.
- Zhang Q, Duplany A, Moncollin V, et al. Lack of muscle mTOR kinase activity causes early onset myopathy and compromises whole-body homeostasis. J Cachexia Sarcopenia Muscle. 2019;10:35–53.
- Castets P, Lin S, Rion N, et al. Sustained activation of mTORC1 in skeletal muscle inhibits constitutive and starvation-induced autophagy and causes a severe, late-onset myopathy. Cell Metab. 2013;17:731–744.
- Baraldo M, Geremia A, Pirazzini M, et al. Skeletal muscle mTORC1 regulates neuromuscular junction stability. J Cachexia Sarcopenia Muscle. 2020;11:208–225.
- Bodine SC, Stitt TN, Gonzalez M, et al. Akt/mTOR pathway is a crucial regulator of skeletal muscle hypertrophy and can prevent muscle atrophy in vivo. Nat Cell Biol. 2001;3:1014–1019.
- Pallafacchina G, Calabria E, Serrano AL, et al. A protein kinase B-dependent and rapamycin-sensitive pathway controls skeletal muscle growth but not fiber type specification. Proc Natl Acad Sci U S A. 2002;99:9213–9218.
- Goodman CA, Frey JW, Mabrey DM, et al. The role of skeletal muscle mTOR in the regulation of mechanical load-induced growth. J Physiol. 2011;589(22):5485–5501. DOI:10.1113/jphysiol.2011.218255.
- Kim J, Guan KL. mTOR as a central hub of nutrient signalling and cell growth. Nat Cell Biol. 2019;21:63–71.
- Huang J, Manning BD. The TSC1-TSC2 complex: a molecular switchboard controlling cell growth. Biochem J. 2008;412:179–190.
- Dokudovskaya S, Rout MP. SEA you later alli-GATOR–a dynamic regulator of the TORC1 stress response pathway. J Cell Sci. 2015;128:2219–2228.
- Tang H, Inoki K, Brooks SV, et al. mTORC1 underlies age-related muscle fiber damage and loss by inducing oxidative stress and catabolism. Aging Cell. 2019;18:e12943.
- Dutchak PA, Estill-Terpack SJ, Plec AA, et al. Loss of a negative regulator of mTORC1 induces aerobic glycolysis and altered fiber composition in skeletal muscle. Cell Rep. 2018;23:1907–1914.
- Graber TG, Fry CS, Brightwell CR, et al. Skeletal muscle-specific knockout of DEP domain containing 5 protein increases mTORC1 signaling, muscle cell hypertrophy, and mitochondrial respiration. J Biol Chem. 2019;294:4091–4102.
- Bruning JC, Michael MD, Winnay JN, et al. A muscle-specific insulin receptor knockout exhibits features of the metabolic syndrome of NIDDM without altering glucose tolerance. Mol Cell. 1998;2:559–569.
- Soliman GA, Acosta-Jaquez HA, Dunlop EA, et al. mTOR Ser-2481 autophosphorylation monitors mTORC-specific catalytic activity and clarifies rapamycin mechanism of action. J Biol Chem. 2010;285:7866–7879.
- Bodine SC, Latres E, Baumhueter S, et al. Identification of ubiquitin ligases required for skeletal muscle atrophy. Science. 2001;294:1704–1708.
- Lee JH, Budanov AV, Park EJ, et al. Sestrin as a feedback inhibitor of TOR that prevents age-related pathologies. Science. 2010;327:1223–1228.
- Kim M, Kowalsky AH, Lee JH. Sestrins in physiological stress responses. Annu Rev Physiol. 2021;83:381–403.
- Asp M, Bergenstrahle J, Lundeberg J. Spatially resolved transcriptomes-next generation tools for tissue exploration. Bioessays. 2020;42:e1900221.
- Shah OJ, Wang Z, Hunter T. Inappropriate activation of the TSC/Rheb/mTOR/S6K cassette induces IRS1/2 depletion, insulin resistance, and cell survival deficiencies. Curr Biol. 2004;14:1650–1656.
- Zhao J, Brault JJ, Schild A, et al. FoxO3 coordinately activates protein degradation by the autophagic/lysosomal and proteasomal pathways in atrophying muscle cells. Cell Metab. 2007;6:472–483.
- Glass DJ. Molecular mechanisms modulating muscle mass. Trends Mol Med. 2003;9:344–350.
- Glass DJ. Signaling pathways perturbing muscle mass. Curr Opin Clin Nutr Metab Care. 2010;13:225–229.
- Egan DF, Shackelford DB, Mihaylova MM, et al. Phosphorylation of ULK1 (hATG1) by AMP-activated protein kinase connects energy sensing to mitophagy. Science. 2011;331:456–461.
- Kim J, Kundu M, Viollet B, et al. AMPK and mTOR regulate autophagy through direct phosphorylation of Ulk1. Nat Cell Biol. 2011;13:132–141.
- Buchan JR, Parker R. Eukaryotic stress granules: the ins and outs of translation. Mol Cell. 2009;36:932–941.
- Wang B, Maxwell BA, Joo JH, et al. ULK1 and ULK2 regulate stress granule disassembly through phosphorylation and activation of VCP/p97. Mol Cell. 2019;74:742–57 e8.
- Zhao H, Kalivendi S, Zhang H, et al. Superoxide reacts with hydroethidine but forms a fluorescent product that is distinctly different from ethidium: potential implications in intracellular fluorescence detection of superoxide. Free Radic Biol Med. 2003;34:1359–1368.
- Carnio S, LoVerso F, Baraibar MA, et al. Autophagy impairment in muscle induces neuromuscular junction degeneration and precocious aging. Cell Rep. 2014;8:1509–1521.
- Thiemermann C. Membrane-permeable radical scavengers (tempol) for shock, ischemia-reperfusion injury, and inflammation. Crit Care Med. 2003;31:S76–84.
- Muscoli C, Cuzzocrea S, Riley DP, et al. On the selectivity of superoxide dismutase mimetics and its importance in pharmacological studies. Br J Pharmacol. 2003;140:445–460.
- Khan NA, Nikkanen J, Yatsuga S, et al. mTORC1 regulates mitochondrial integrated stress response and mitochondrial myopathy progression. Cell Metab. 2017;26:419–28 e5.
- Joseph GA, Wang SX, Jacobs CE, et al. Partial Inhibition of mTORC1 in aged rats counteracts the decline in muscle mass and reverses molecular signaling associated with Sarcopenia. Mol Cell Biol. 2019;39: ;e00141–19.
- Bielas J, Herbst A, Widjaja K, et al. Long term rapamycin treatment improves mitochondrial DNA quality in aging mice. Exp Gerontol. 2018;106:125–131.
- Park JM, Jung CH, Seo M, et al. The ULK1 complex mediates MTORC1 signaling to the autophagy initiation machinery via binding and phosphorylating ATG14. Autophagy. 2016;12:547–564.
- Russell RC, Tian Y, Yuan H, et al. ULK1 induces autophagy by phosphorylating Beclin-1 and activating VPS34 lipid kinase. Nat Cell Biol. 2013;15:741–750.
- Ho A, Cho CS, Namkoong S, et al. Biochemical basis of sestrin physiological activities. Trends Biochem Sci. 2016;41:621–632.
- Hardie DG, Ross FA, Hawley SA. AMPK: a nutrient and energy sensor that maintains energy homeostasis. Nat Rev Mol Cell Biol. 2012;13:251–262.
- Egan D, Kim J, Shaw RJ, et al. The autophagy initiating kinase ULK1 is regulated via opposing phosphorylation by AMPK and mTOR. Autophagy. 2011;7:643–644.
- Yu H, Zhou X, Wang Y, et al. Nicotinamide N-methyltransferase inhibits autophagy induced by oxidative stress through suppressing the AMPK pathway in breast cancer cells. Cancer Cell Int. 2020;20:191.
- Joshi A, Iyengar R, Joo JH, et al. Nuclear ULK1 promotes cell death in response to oxidative stress through PARP1. Cell Death Differ. 2016;23:216–230.
- Ro SH, Semple IA, Park H, et al. Sestrin2 Promotes Unc-51-like Kinase 1 (ULK1)-mediated phosphorylation of p62/sequestosome-1. FEBS J. 2014;281:3816–3827.
- Mammucari C, Milan G, Romanello V, et al. FoxO3 controls autophagy in skeletal muscle in vivo. Cell Metab. 2007;6:458–471.
- Milan G, Romanello V, Pescatore F, et al. Regulation of autophagy and the ubiquitin-proteasome system by the FoxO transcriptional network during muscle atrophy. Nat Commun. 2015;6:6670.
- Tezze C, Romanello V, Desbats MA, et al. Age-associated loss of OPA1 in muscle impacts muscle mass, metabolic homeostasis, systemic inflammation, and epithelial senescence. Cell Metab. 2017;25:1374–89 e6.
- Segatto M, Fittipaldi R, Pin F, et al. Epigenetic targeting of bromodomain protein BRD4 counteracts cancer cachexia and prolongs survival. Nat Commun. 2017;8:1707.
- Komatsu M, Kurokawa H, Waguri S, et al. The selective autophagy substrate p62 activates the stress responsive transcription factor Nrf2 through inactivation of Keap1. Nat Cell Biol. 2010;12:213–223.
- Zid BM, Rogers AN, Katewa SD, et al. 4E-BP extends lifespan upon dietary restriction by enhancing mitochondrial activity in Drosophila. Cell. 2009;139:149–160.
- Bartolome A, Garcia-Aguilar A, Asahara SI, et al. MTORC1 regulates both general autophagy and mitophagy induction after oxidative phosphorylation uncoupling. Mol Cell Biol. 2017;37:e00441–17.
- Tsang CK, Chen M, Cheng X, et al. SOD1 phosphorylation by mTORC1 couples nutrient sensing and redox regulation. Mol Cell. 2018;70:502–15 e8.
- Ferreira LF, Laitano O. Regulation of NADPH oxidases in skeletal muscle. Free Radic Biol Med. 2016;98:18–28.
- Cho CS, Kowalsky AH, Namkoong S, et al. Concurrent activation of growth factor and nutrient arms of mTORC1 induces oxidative liver injury. Cell Discov. 2019;5:60.
- Neuman NA, Henske EP. Non-canonical functions of the tuberous sclerosis complex-Rheb signalling axis. EMBO Mol Med. 2011;3:189–200.
- Kim YC, Park HW, Sciarretta S, et al. Rag GTPases are cardioprotective by regulating lysosomal function. Nat Commun. 2014;5:4241.
- Lustgarten MS, Jang YC, Liu Y, et al. Conditional knockout of Mn-SOD targeted to type IIB skeletal muscle fibers increases oxidative stress and is sufficient to alter aerobic exercise capacity. Am J Physiol Cell Physiol. 2009;297:C1520–32.
- Kim M, Sujkowski A, Namkoong S, et al. Sestrins are evolutionarily conserved mediators of exercise benefits. Nat Commun. 2020;11:190.
- Seligman AM, Karnovsky MJ, Wasserkrug HL, et al. Nondroplet ultrastructural demonstration of cytochrome oxidase activity with a polymerizing osmiophilic reagent, diaminobenzidine (DAB). J Cell Biol. 1968;38:1–14.
- Loughlin M. Muscle biopsy. A laboratory investigation. Oxford, Boston: Butterworth-Heinemann; 1993.
- Sheehan D, Hrapchak B. Histotechnology. 2nd ed. Columbus: Batelle Press; 1987.
- Dobin A, Davis CA, Schlesinger F, et al. STAR: ultrafast universal RNA-seq aligner. Bioinformatics. 2013;29:15–21.
- Trapnell C, Roberts A, Goff L, et al. Differential gene and transcript expression analysis of RNA-seq experiments with TopHat and Cufflinks. Nat Protoc. 2012;7:562–578.
- Li R, Huang Y, Semple I, et al. Cardioprotective roles of sestrin 1 and sestrin 2 against doxorubicin cardiotoxicity. Am J Physiol Heart Circ Physiol. 2019;317:H39–H48.
- Buras ED, Converso-Baran K, Davis CS, et al. Fibro-Adipogenic remodeling of the diaphragm in obesity-associated respiratory dysfunction. Diabetes. 2019;68:45–56.