
ABSTRACT
Chloroquine (CQ), a lysosomotropic agent, is commonly used to inhibit lysosomal degradation and macroautophagy/autophagy. Here we investigated the cell-extrinsic effects of CQ on secretion. We showed that lysosomal and autophagy inhibition by CQ altered the secretome, and induced the release of Atg8 orthologs and autophagy receptors. Atg8-family proteins, in particular, were secreted inside small extracellular vesicles (sEVs) in a lipidation-dependent manner. CQ treatment enhanced the release of Atg8-family proteins inside sEVs. Using full-length ATG16L1 and an ATG16L1 mutant that enables Atg8-family protein lipidation on double but not on single membranes, we demonstrated that LC3B is released in two distinct sEV populations: one enriched with SDCBP/Syntenin-1, CD63, and endosomal lipidated LC3B, and another that contains LC3B but is not enriched with SDCBP/Syntenin-1 or CD63, and which our data supports as originating from a double-membrane source. Our findings underscore the context-dependency of sEV heterogeneity and composition, and illustrate the integration of autophagy and sEV composition in response to lysosomal inhibition.
Abbreviations: ACTB: actin beta; ANOVA: analysis of variance; ATG4B: autophagy related 4B cysteine peptidase; Atg8: autophagy related 8; ATG16L1: autophagy related 16 like 1; ATP5F1A/ATP5a: ATP synthase F1 subunit alpha; CALCOCO2: calcium binding and coiled-coil domain 2; CASP3: caspase 3; CASP7: caspase 7; CQ: chloroquine; CD9: CD9 molecule; CD63: CD63 molecule; DAPI: 4’,6-diamidino-2-phenylindole; DQ-BSA: dye quenched-bovine serum albumin; ER: endoplasmic reticulum; ERN1/IRE1a: endoplasmic reticulum to nucleus signaling 1; EV: extracellular vesicles; FBS: fetal bovine serum; FDR: false discovery rate; GABARAP: GABA type A receptor-associated protein; GABARAPL2: GABA type A receptor associated protein like 2; GAPDH: glyceraldehyde-3-phosphate dehydrogenase; GFP: green fluorescent protein; GO: gene ontology; HCQ: hydroxychloroquine; HSP90AA1: heat shock protein 90 alpha family class A member 1; IP: immunoprecipitation; KO: knockout; LAMP2: lysosomal associated membrane protein 2; LIR: LC3-interacting region; LMNA: lamin A/C; MAP1LC3B/LC3B: microtubule associated protein 1 light chain 3 beta; MS: mass spectrometry; NBR1: NBR1 autophagy cargo receptor; NCOA4: nuclear receptor coactivator 4; NTA: nanoparticle tracking analysis; PE: phosphatidylethanolamine; PECA: probe-level expression change averaging; SDCBP/syntenin-1: syndecan binding protein; SD: standard deviation; SE: secreted; sEV: small extracellular vesicles; SQSTM1/p62: sequestosome 1; TAX1BP1: Tax1 binding protein 1; TEM: transmission electron microscopy; TMT: tandem-mass tag; TSG101: tumor susceptibility 101; ULK1: unc-51 like autophagy activating kinase 1; WC: whole cell
Introduction
Hydroxychloroquine (HCQ) and chloroquine (CQ) belong to the family of four-aminoquinolines, commonly used as antimalarials. Recent efforts sought to repurpose HCQ and CQ for cancer therapy due to their inhibitory effect on lysosomes and, by extension, macroautophagy [Citation1] (hereafter referred to as autophagy). Autophagy is a cellular catabolic process ubiquitous to almost all eukaryotic cells. Double-membrane structures termed autophagosomes form in the cytosol and sequester cargos, which may include damaged organelles, proteins, and invading bacteria [Citation2]. Mature autophagosomes then fuse with lysosomes to form autolysosomes, where contents are degraded and recycled for energy and nutrients [Citation2]. Autophagy also has non-degradative functions, including the secretion of cytoplasmic content, that are only beginning to be understood [Citation3]. Cytoprotective autophagy has been demonstrated in multiple types of cancers, precipitating the development of various autophagy inhibitors [Citation4]. Recently, promising reports of autophagy inhibition against certain types of cancers stimulated renewed interest [Citation5]. Multiple clinical trials are examining the safety and efficacy of HCQ in cancer settings, some of which produced promising results [Citation6]. While part of HCQ’s anticancer effect was shown to be its influence on the tumor microenvironment [Citation7], the cell extrinsic effects of HCQ and CQ remain largely unexplored.
Extracellular vesicles (EV) are membrane-bound entities released by most, if not all, cells [Citation8]. A variety of cellular cargoes, including nucleic acids, lipids and proteins, are contained within EVs, yet the mechanisms of EV cargo loading, and the heterogeneity of EV populations are poorly understood [Citation9]. Known to facilitate cell-cell communication, EV are of special interest in cancer [Citation9,Citation10]. A class of small EV (sEV) termed exosomes were previously identified to play important roles in breast cancers, including the facilitation of organotropic metastasis [Citation11]. Previous works implicated lysosomal status in sEV biogenesis [Citation12–14], and the autophagy-related LC3 conjugation machinery in sEV loading [Citation15]. The secretory role of the autophagy apparatus under lysosomal status has not been explored.
Here, we characterized secreted nanoparticles derived from breast cancer cell lines in the presence and absence of lysosomal inhibition by CQ. We utilized a quantitative proteomics approach to further explore CQ-induced changes in secretion, revealing Atg8 (autophagy related 8)-family-protein dependent secretion of autophagy cargo receptors under CQ, as well as the involvement of Atg8-family proteins in distinct subsets of sEV. Our data support a model where components of the autophagy machinery contribute to secretion and sEV protein composition upon lysosomal inhibition, and underscores a new mechanism by which CQ could exert cell non-autonomous effects.
Results
Chloroquine does not substantially affect the physical profile of secreted particles
To inhibit lysosomal function and by extension, autophagy, 10 µM chloroquine (CQ) was added to the culture media of breast cancer cell lines MDA-MB-231, Hs578T and SUM159PT. Accumulation of MAP1LC3B/LC3B (microtubule associated protein 1 light chain 3 beta) and SQSTM1/p62 (sequestosome 1) indicated blockage of autophagy (Fig S1A). A decrease in dye quenched-bovine serum albumin (DQ-BSA) fluorescence confirmed reduction of lysosomal degradation (Fig S1B).
Secreted nanoparticles were collected from cell line conditioned serum-free media after 40–48 h of incubation in the presence or absence of 10 µM CQ. No significant (>10%) cell death was observed at the time of collection (Fig. S1C). Cleavage of CASP3 (caspase 3) or CASP7 (caspase 7) was not observed at the time of collection (Fig. S1D), precluding overabundance of apoptotic bodies. The collected cell culture media was subjected to sequential centrifugation (300 x g, 2,000 x g, and 10,000 x g twice) to remove larger vesicles, followed by high-molecular weight (100 kDa) ultrafiltration and finally precipitated (Fig S1D). Small EV were present in secreted particles, as evidenced by the presence of known sEV-associated proteins (CD63, CD9, TSG101 [tumor susceptibility 101], SDCBP/syntenin-1 [syndecan binding protein]) in the preparations from the three breast cancer cell lines, while the endoplasmic reticulum (ER) marker ERN1/IRE1a (endoplasmic reticulum to nucleus signaling 1) was absent (). HSP90AA1 (heat shock protein 90 alpha family class A member 1) and LAMP2 (lysosomal associated membrane protein 2), two proteins commonly associated with sEV, were detected at low levels (). ATP5F1A/ATP5α (ATP synthase F1 subunit alpha; mitochondria), LMNA (lamin A/C; nucleus) were not detected, and GAPDH (glyceraldehyde-3-phosphate dehydrogenase) was detected in trace amounts in the secreted fraction (Fig S1F). Transmission electron microscopy (TEM) indicated the presence of sEV in the secreted fractions, visualized as cup-shaped entities (). Total protein assays (BCA) determined that CQ did not significantly alter the total amount of protein per million cells in the secreted fraction (). In MDA-MB-231 and Hs578T cells, nanoparticle tracking analysis (NTA) showed no statistically significant differences between the number of particles per million of control and CQ treated cells. Fewer particles were collected per million of SUM159PT cells after CQ treatment (, P < 0.01). NTA also detected very similar size distributions between particles secreted from control and CQ-treated cell lines (), where no significant alterations were observed in mean or modal particle sizes (, t-test). Particle:protein ratios were not significantly different between particles secreted from control and CQ-treated cells (, t-test). These findings suggest that CQ did not have pronounced effects on the physical profile of secreted particles.
Figure 1. Chloroquine does not substantially affect physical properties of secreted particles. (A) Immunoblot characterization of secreted particles from three cell lines. Protein concentrations of whole cell lysates (WC) and secreted (SE) fractions were quantified using a BCA assay. equal amount of protein was loaded in each lane. Samples from the same experiments were run in parallel blots. Known sEV proteins TSG101, SDCBP/syntenin-1, CD9, and CD63 were analyzed along with known sEV-associated proteins, HSP90AA1 and LAMP2, and the ER marker ERN1/IRE1a. (B) Transmission electron micrograph visualization of sEV contained in the secreted fraction, using uranyl acetate as a counter stain. Scale bar: 200 nm. (C) Total protein content (measured by BCA assay) and particle count (measured by nanoparticle tracking analysis [NTA]) of secreted particles normalized to cell number. significance was determined by paired t-test (**: p < 0.01; n = 3). Horizontal lines denote mean and SD. (D) Size distribution of secreted particles measured by NTA. Solid lines represent mean while dotted lines represent SD (n = 3). (E) Effect of CQ on modal or mean size of secreted particles, or particle/protein ratio. Error bars represent SD. Significance was determined by paired t-test (n = 3).
![Figure 1. Chloroquine does not substantially affect physical properties of secreted particles. (A) Immunoblot characterization of secreted particles from three cell lines. Protein concentrations of whole cell lysates (WC) and secreted (SE) fractions were quantified using a BCA assay. equal amount of protein was loaded in each lane. Samples from the same experiments were run in parallel blots. Known sEV proteins TSG101, SDCBP/syntenin-1, CD9, and CD63 were analyzed along with known sEV-associated proteins, HSP90AA1 and LAMP2, and the ER marker ERN1/IRE1a. (B) Transmission electron micrograph visualization of sEV contained in the secreted fraction, using uranyl acetate as a counter stain. Scale bar: 200 nm. (C) Total protein content (measured by BCA assay) and particle count (measured by nanoparticle tracking analysis [NTA]) of secreted particles normalized to cell number. significance was determined by paired t-test (**: p < 0.01; n = 3). Horizontal lines denote mean and SD. (D) Size distribution of secreted particles measured by NTA. Solid lines represent mean while dotted lines represent SD (n = 3). (E) Effect of CQ on modal or mean size of secreted particles, or particle/protein ratio. Error bars represent SD. Significance was determined by paired t-test (n = 3).](/cms/asset/7b7b551f-0d4a-4f65-8347-353f10b5088e/kaup_a_2039535_f0001_oc.jpg)
Chloroquine treatment alters the secretome
To determine whether CQ treatment led to alterations in the secretome, we conducted a highly sensitive quantitative proteomics analysis of nanoparticles secreted by MDA-MB-231. Whole cell (WC) and corresponding secreted (SE) fractions were prepared from control and CQ-treated MDA-MB-231 cells in biological triplicates. Protein isolated from each sample was subjected to SP3 bead cleanup, isobaric tandem-mass tag (TMT) labeling prior to three stage mass spectrometry (MS/MS/MS; MS3) analyses [Citation16, [PMID: 27713570]]. 8512 and 4302 proteins were identified in the WC and SE samples, respectively, that contained at least one unique peptide in all biological triplicates. Principle component analyses showed separation of control and CQ-treated samples (Fig. S2A). Significant enrichment of extracellular-related, EV-related, and depletion of mitochondria-related gene ontology cellular component terms were identified in the secreted fraction (; Table S1). Differential protein abundance analysis of CQ-treated versus control samples using paired probe-level expression change averaging (PECA [Citation17]) revealed that CQ treatment affected a greater proportion of proteins in the SE fractions compared to the WC fractions (p < 0.0001; two-sample Kolmogorov-Smirnov’s test) (Fig. S2B). Indeed, a greater percentage of proteins were found to be differentially abundant, defined using a cutoff of 1.5-fold change and a false discovery rate (FDR)-adjusted p value of 0.05 in SE (189; 4.4% of 4302 identified proteins, ) than in WC (178; 2.1% of 8512 identified proteins) (p < 0.0001; chi-square test; Table S2, ). KEGG pathway enrichment analysis showed CQ-induced over-representation of proteins involved in autophagy-related pathways in both WC and SE fractions (Table S3, ). Additionally, CQ treatment increased the relative abundance of sEV-associated endosomal proteins (CD63, SDCBP/syntenin-1, CD9, and CD81) in the cytosol; in the sEV fraction, however, only SDCBP/syntenin-1 was significantly increased (Fig. S2C, S2D; adjusted p < 0.001). While the increase in autophagy-related proteins in the cell was consistent with the effects of CQ-mediated lysosomal and autophagy inhibition [Citation18], their presence in secreted fraction following CQ treatment was less well-known and therefore selected for further investigation.
Figure 2. Chloroquine treatment alters the MDA-MB-213 secretome. (A) All proteins identified from the secreted fraction were used in gene ontology (GO) enrichment analysis to identify enriched cellular components terms relative to the total proteome identified from WC fractions. The top 10 enriched and de-enriched GO terms are shown, and all passed a significance threshold of adjusted p-value < 0.05. See also Table S1, S2. (B) CQ-induced differential protein abundance in the secretome of MDA-MB-231. 189 proteins (4.4% of 4302 identified proteins) were differentially abundant between secretomes of control and CQ-treated MDA-MB-231 cells (solid dots). Threshold for defining significance was set at an adjusted p-value of 0.05 (horizontal dotted line) and an absolute log2-fold change of 0.584 (1.5-fold change, vertical lines). See also Fig. S2D. (C) CQ-induced differential protein abundance in whole cell (WC) lysate of MDA-MB-231. 178 proteins (2.1% of 8512 identified proteins) were differentially abundant between control and CQ-treated MDA-MB-231 cells (solid dots). Threshold for defining significance was set at an adjusted p-value of 0.05 (horizontal dotted line) and an absolute log2-fold change of 0.584 (1.5-fold change, vertical lines). See also Fig. S2C. (D) Bubble chart showing KEGG pathway analysis results of proteins differentially abundant due to CQ treatment. Only the top 20 enriched pathways with adjusted p-value < 0.2 in each condition are shown and are listed on the y-axis. Samples and directionality of the protein fold-changes are represented on the X-axis. Size and color of the bubbles represent proportion of differentially abundant proteins in pathway and their significance, respectively. (E) CQ-induced protein fold changes (log2-scale; Log2FC) in whole cell (WC; X-axis) vs in secreted fraction (SE; Y-axis) are shown as a scatter plot where each dot represents a protein identified in the proteome of both WC and SE. Threshold for defining significance was set at an adjusted p-value of 0.05 and an absolute log2-fold change of 0.584 (1.5-fold change, dotted rectangle). Proteins meeting the fold-change cutoff in both WC and SE datasets are shown as large opaque dots, whereas proteins meeting the cutoff in only one dataset are shown as semi-transparent dots. Each dot is colored according to its direction of fold change in both WC and SE. Proteins of interest, including mammalian Atg8-family orthologs and select autophagy cargo receptors, are labeled. +CQ: CQ-treated; -CQ: not treated. See also , S2 and Fig. S2E, S2F, S2G.
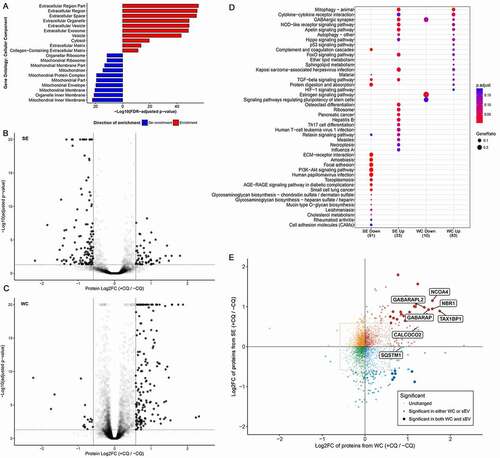
Atg8-family proteins are ubiquitin-like proteins that can be conjugated to the lipid phosphatidylethanolamine (PE) in phagophore membranes during the autophagy process. Autophagy cargo receptor proteins can interact with Atg8-family proteins through an LC3-interacting region (LIR) motif, which facilitates incorporation of specific receptors and their cargos into the phagophore [Citation19]. Proteins containing known LIR domains were identified among differentially abundant proteins in the MS datasets of WC and SE fractions (Fig. S2E). In the MS dataset, CQ-induced increase of mammalian Atg8 orthologs was apparent in both WC and SE fractions (Table S1), as were the levels of Atg8 ortholog cargo receptor proteins that facilitate selective autophagy of cytoplasmic content (NBR1 [NBR1 autophagy cargo receptor], TAX1BP1 [Tax1 binding protein 1], CALCOCO2 [calcium binding and coiled-coil domain 2] and NCOA4 [nuclear receptor coactivator 4] [Citation20–23]) (). The MAP1LC3 family of mammalian Atg8 homologs shares highly similar peptide sequences; those of MAP1LC3B/LC3B and MAP1LC3B2/LC3B2 only differ by one amino acid and are hence challenging to differentiate. We identified CQ-induced increases in the abundance of peptides mapped to MAP1LC3A/LC3A or LC3B/B2 in WC. In the SE fraction, we found increased abundance of a peptide shared by LC3A, LC3B or LC3B2 (Fig. S2F, Table S1). Subsequent Western blot confirmed the presence of both LC3A and LC3B in the SE fraction (Fig. S2G). These data suggested the possibility of Atg8-family-protein-mediated secretion of autophagy cargo receptors during lysosomal stress.
Chloroquine enhances secretion of TAX1BP1 in an ATG16L1-dependent manner
To validate the proteomics findings, we used Western blotting to verify that in addition to LC3B and SQSTM1/p62 (), CQ treatment induced significant intracellular accumulation of TAX1BP1 and lipidated GABARAP (GABA type A receptor-associated protein) in MDA-MB-231 (, P < 0.05). CQ treatment also enhanced the secretion of LC3B and TAX1BP1 (f, p < 0.01). Interestingly, only the lipidated, but not the soluble forms of LC3B and GABARAP were detected in the SE fraction ().
Figure 3. Chloroquine enhances secretion of TAX1BP1 in an ATG16L1-dependent manner. (A) Whole cell pellet collected alongside the secreted fraction were lysed and probed for TAX1BP1, GABARAP, and LC3B. Significance was determined by paired t-test (*: p < 0.05; **: p < 0.01; n = 3). ±: plus or minus 10 µM CQ. (B) Secreted particles (SE) were collected from cells treated with or without 10 µM CQ and probed for TAX1BP1, TSG101, GABARAP and LC3B. Equal amount of protein, as determined by BCA assay, was loaded in each lane. (C) CRISPR-mediated knockout (KO) of ATG16L1 with two different single guide RNAs was used to generate isogenic ATG16L1 KO lines in MDA-MB-231 (n = 3). Secreted particles were collected as described and probed for LC3B, TSG101 and TAX1BP1. (D) Isogenic ATG4B KO cells were generated using CRISPR-mediated knockout (KO). Secreted particles were collected from ATG4B KO cells in the presence or absence of 10 µM CQ treatment and probed for LC3B and GABARAPL2 (n = 3). (E) The effect of ATG16L1 knockout and rescue on the lipidation of LC3B and GABARAP in whole cell (WC) and secretion (SE) of LC3B and TAX1BP1 (n = 3). Samples from the same experiment were run on parallel blots. WT: wild type; -: ATG16L1 KO, α: ATG16L1-α rescue of ATG16L1 KO; β: ATG16L1-β rescue of ATG16L1 KO. (F) Densitometry quantitation of SE fraction in (E). Significance was determined by one-way ANOVA with Sidak’s multiple comparison test (***: p < 0.001; **: p < 0.01; *: p < 0.05; ns: not significant; n = 3).
Non-lipidated LC3B was previously shown to aggregate independent of autophagosome association [Citation24], and secreted in sEV in the absence of lipid conjugation [Citation25]. Thus, we determined whether lipidation was required for CQ-induced secretion of Atg8 orthologs. ATG16L1 (autophagy related 16 like 1) is required for the lipidation of all mammalian Atg8 orthologs [Citation26], and ATG16L1 knockout (KO) hampered lipidation of both LC3 and GABARAP in MDA-MB-231 cells (Fig. S3A). ATG16L1 KO also hampered secretion of LC3B (). ATG4B (autophagy related 4B cysteine peptidase), encoding a protein required for priming of LC3A/B before they can be lipidated (Fig. S3B) [Citation27], was knocked out to impede LC3 lipidation. In ATG4B KO MDA-MB-231 cells, LC3B remained in the pro-LC3B form and could not associate with membrane (Fig. S3C, S3D). Consequently, LC3B was not secreted by ATG4B KO cells (). GABARAPL2 (GABA type A receptor associated protein like 2), whose lipidation does not depend on ATG4B [Citation28], remained to be secreted (). These results indicated that the secretion of Atg8 orthologs is lipidation dependent.
Selective autophagy is known to utilize Atg8 ortholog-interacting cargo receptors to facilitate capture of specific cargos on membrane-bound Atg8 orthologs for autophagic degradation [Citation29]. We next investigated whether Atg8 orthologs are involved in the secretion of cargo receptor protein TAX1BP1 under lysosomal inhibition. In MDA-MB-231, knockout of LC3B alone failed to attenuate CQ-enhanced secretion of TAX1BP1 (Fig S3E), suggesting potential functional redundancy of mammalian Atg8-family proteins. In contrast, ATG16L1 KO attenuated CQ-induced enhancement of LC3B and TAX1BP1 secretion (, f); one-way ANOVA), suggesting that lipidated Atg8 orthologs likely participate in the lysosomal-stress induced secretion of autophagy receptors. Rescuing ATG16L1 KO cells with the expression of either ATG16L1 isoform – the larger beta isoform (ATG16L1-β) required for PIK3C3/VPS34-independent endosomal LC3B lipidation [Citation26], or the smaller alpha isoform (ATG16L1-α) – was sufficient to restore the lipidation of LC3B and GABARAP in the cell (), and the CQ-induced enhancement of LC3B and TAX1BP1 secretion (; one-way ANOVA). Taken together, this data suggested that Atg8 orthologs collectively participate in CQ-enhanced secretion of TAX1BP1.
Chloroquine treatment induces accumulation of mammalian Atg8 orthologs inside sEV
Having observed that only the lipidated forms of LC3B and GABARAP were secreted, we next determined whether Atg8 orthologs were located within sEV. Protease protection assays were conducted where MDA-MB-231-derived sEV were treated either with PBS, 100 µg/ml trypsin, or 100 µg/ml trypsin plus 1% Triton X-100 (Fig. S4A). TSG101 was used as an internal control due to its known lumenal localization and stable abundance in sEV regardless of CQ treatment [Citation30,Citation31] (Fig. S2D). LC3B, GABARAP, and GABARAPL2 were protected from trypsin digestion in the absence of detergent, which suggested predominant lumenal localization (). When normalized to the levels of TSG101 in the corresponding samples, the levels of trypsin-resistant SDCBP/syntenin-1, LC3B, GABARAP, and GABARAPL2 were markedly increased after CQ treatment (, P = 0.03, p = 0.02, p = 0.04, p = 0.02, respectively), further validating the MS findings. Therefore, we conclude that CQ enhanced the release of SDCBP/syntenin-1 in sEV, and that LC3B, GABARAP and GABARAPL2 were secreted inside sEV rather than in sEV-associated or non-vesicular compartments.
Figure 4. CQ induces accumulation of Atg8-family orthologs inside sEV of MDA-MB-231 cells. (A) Equal volume of secreted fraction collected from control and 10 µM CQ-treated MDA-MB-231 cells were treated with PBS, 50 µg/ml trypsin, or 50 µg/ml trypsin plus 1% Triton X-100 (TX-100). Positive controls for proteins inside sEV are TSG101 and SDCBP/syntenin-1. (B) Densitometry quantitation of trypsin-resistant SDCBP/syntenin-1, lipidated LC3B (LC3B-II), GABARAP, and GABARAPL2 levels normalized to TSG101. Significance was determined by paired ratio t-test (*: p < 0.05, n = 3). Error bars represent SD.
Chloroquine inhibits lysosomal function and induces co-localization of autophagy-related proteins with endolysosomal markers.
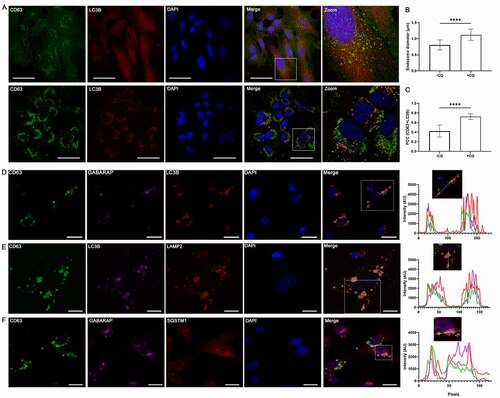
We next used confocal microscopy to visualize CQ-induced endosomal changes and LC3B localization. In SUM159PT cells, 48 h of 10 µM CQ treatment enlarged CD63-bearing endosomes (, b), p < 0.0001). CQ treatment also altered the distribution of LC3B from diffuse to punctate, and increased co-localization of LC3B and CD63 (, c), p < 0.0001). Similar observations were also made in MDA-MB-231 cells (Fig S5A-C, p < 0.0001). Furthermore, in MDA-MB-231 cells stably expressing CD63-GFP, 48 h of CQ treatment induced co-localization between CD63-labeled endosomes with both LC3B and GABARAP puncta (), as well as LAMP2 () and SQSTM1 (). This data revealed a CQ-induced accumulation of a CD63-positive endolysosomal or amphisomal compartment that also contained mammalian Atg8 orthologs and cargo receptor SQSTM1.
Figure 5. Chloroquine enlarges endosomes and induces co-localization of autophagy-related protein with endolysosomal markers. (A) SUM159PT cells were grown on cover glasses and treated with vehicle or 10 µM CQ. After 48 h, cells were fixed with cold methanol and incubated with anti-LC3B and anti-CD63 antibodies followed by corresponding secondary antibodies for confocal microscopy. Scale bars: 50 µm. (B) Endosome diameter was measured for n = 150 endosomes from control and CQ-treated cells, where significance was determined by two-tailed t-test (****: p < 0.001). (C) Pearson’s correlation coefficient (PCC) between CD63 and LC3B was determined for n = 11 individual cells treated with vehicle or CQ, where significance was calculated by two-tailed t-test (****: p < 0.001). (D) – (F) MDA-MB-231 cells stably expressing CD63-GFP were grown on cover glasses in full media. After 48 h of 10 µM CQ treatment, cells were fixed and immunostained as indicated for confocal microscopy. To determine co-localization, the intensity profile along a line in a single z-section (as indicated in the boxed region) was measure for each channel (except DAPI) and compared, where overlap was interpreted as co-localization. Scale bars: 20 µm.
Atg8 orthologs are enriched in distinct subsets of sEV
Existing literature conflicts on whether LC3B and endosomal proteins reside in the same sEV population. In one study, LC3B-positive EV were identified in different density fractions as most of the SDCBP/syntenin-1-bearing sEV [Citation32], while in another, LC3B can be found on the same density fraction as PDCD6IP/Alix (programmed cell death 6 interacting protein) – an endosomal protein crucial for exosome biogenesis [Citation33] – and can be captured by CD63-mediated immunoprecipitation [Citation15]. Therefore, we investigated whether Atg8 ortholog-containing sEV released under lysosomal inhibition constitute a distinct sEV population. Secreted particles were enriched from conditioned media of CQ-treated MDA-MB-231 cells using sequential centrifugation followed by ultrafiltration, and fractionated on a bottom-loading density gradient of 6% to 30% iodixanol. Partial overlap between LC3B and endosomal proteins was observed on density gradient fractions, where some (fractions 7 and 8) but not all fractions were enriched with all of LC3B, CD63, and SDCBP/syntenin-1 (). These results suggested that LC3B may be present in more than one subpopulation of sEV, only one of which originated from endosomes.
Figure 6. Atg8 orthologs are enriched in specific subsets of sEV. (A) Centrifugation density gradient (6% to 30% iodixanol) fractionation of ultrafiltration-concentrated conditioned media from 10 µM CQ treated MDA-MB-231 cells (n = 2). (B) Using anti-CD63 or anti-CD9 antibody-bound magnetic beads, immunoaffinity capture was conducted on pre-cleared and concentrated conditioned media of CQ-treated MDA-MB-231 cells (n = 3). (C) Densitometry quantitation of LC3B and GABARAP levels in CD63-IP were normalized to TSG101 levels in the respective lane. Significance was determined by paired t-test (*: p < 0.05; n = 3). Error bars represent SD. (D) Conditioned media from CQ-treated MDA-MB-231 ATG16L1 KO cells expressing either ATG16L1-α or ATG16L1-β was pre-cleared, concentrated, and incubated with CD63-Dynabeads overnight at 4°C. Beads were washed twice the next day and eluded by boiling in 1X LDS with reducing agent (n = 3). (E) Centrifugation density gradient (6% to 30% iodixanol) fractionation of ultrafiltration-concentrated conditioned media from 10 µM CQ treated MDA-MB-231 ATG16L1 KO cells rescued with either ATG16L1-α or ATG16L1-β (n = 2). (F) Secreted particles (SE) were collected from ATG16L1 KO cells rescued with truncated ATG16L1 (aa 1–249) treated with control or 10 µM CQ. Significance was determined by paired t-test (*: p < 0.05; n = 3). Error bars represent SD. (G) Using anti-CD63 antibody-bound magnetic beads, immunoaffinity capture was conducted on pre-cleared and concentrated conditioned media of CQ treated ATG16L1 KO cells expressing ATG16L1(1–249) (n = 3). (H) Centrifugation density gradient (6% to 30% iodixanol) fractionation of ultrafiltration-concentrated conditioned media from 10 µM CQ treated MDA-MB-231 ATG16L1 KO cells rescued with ATG16L1 (aa1-249) (n = 2). (I) Centrifugation density gradient (6% to 30% iodixanol) fractionation of ultrafiltration-concentrated conditioned media from 10 µM CQ treated MDA-MB-231 ULK1 KO cells (n = 2).
To further validate that LC3B is present in the CD63-positive sEV population, magnetic beads conjugated with anti-CD63 or anti-CD9 antibodies were used to capture sEV directly from pre-cleared and ultrafiltration (100 kDa) concentrated conditioned media. Both CD63 and CD9 immunoprecipitation (IP) captured sEV that contained CD9, TSG101, and SDCBP/syntenin-1 but not HSP90AA1 (). CD63-IP captured CD63 protein as expected (Fig S6A). Interestingly, CD63 IP captured only limited quantities of CD9 (). While TSG101 was captured by both CD9-IP and CD63-IP, GABARAP and LC3B were predominantly found in CD63-IP but not CD9-IP. CQ-induced enrichment of LC3B and GABARAP in CD63-IP was pronounced when normalized to TSG101 (, P = 0.027 and p = 0.013, respectively). These results showed that CQ treatment induced LC3B and GABARAP enrichment in CD63-positive sEV.
Canonically, LC3B is lipidated on double-membraned autophagic membranes for macroautophagy. More recent findings suggest that LC3B can also be lipidated on single membranes such as endosomes or phagosomes [Citation26,Citation34]. To determine whether these organelles contribute to LC3B-containing sEV, we expressed ATG16L1-α or ATG16L1-β, which rescue both double-membrane (autophagic) and single-membrane (endosome/phagosome) lipidation of Atg8 orthologs [Citation26,Citation34], in ATG16L1 KO MDA-MB-231 cells. We also expressed an ATG16L1 truncation mutant (ATG16L1 aa1-249), which rescues only double-membrane (autophagosome) but not single-membrane (endosome/phagosome) lipidation of Atg8 orthologs [Citation26,Citation34], in ATG16L1 KO MDA-MB-231 cells. Expression of either ATG16L1-α or ATG16L1-β rescued CD63-mediated IP of LC3B () and strong overlap of LC3B with CD63 and SDCBP/syntenin-1 on a density gradient of the SE fractions from CQ-treated cells (). Expression of ATG16L1(1–249) in ATG16L1 KO cells restored LC3B lipidation in the cell (Fig S6B), as well as the CQ-induced enhancement of LC3B secretion similar to wildtype cells (, P < 0.05; Fig S6C, p > 0.05). However, CD63-IP failed to capture the LC3B-containing sEV from CQ-treated ATG16L1 (1–249) cells, revealing a population of LC3B-positive sEV that are not heavily decorated with CD63 (). Density gradient fractionation failed to fully separate LC3B from CD63 and SDCBP/syntenin-1 in the secretion from cells expressing ATG16L1 (1–249) (), suggesting that the two populations overlap in density.
The ULK1 (unc-51 like autophagy activating kinase 1) complex, consisting of ULK1, RB1CC1/FIP200 (RB1 inducible coiled-coil 1), ATG13, and ATG101, is essential for autophagy induction [Citation35,Citation36]. To determine whether an autophagic organelle gives rise to the sEV population containing LC3B but not SDCBP/syntenin-1, ULK1 was knocked out in MDA-MB-231 via CRISPR (Fig. S6D). In the secretion of CQ-treated ULK1 KO cells, there was complete co-fractionation of LC3B, SDCBP/syntenin-1 and CD63 on a density gradient (), while the LC3B-positive, SDCBP/syntenin-1-negative fractions ceased to be detected. Taken together, these results suggested that cells under CQ treatment secreted two distinct LC3B-containing sEV subpopulations: one originating from single membrane endosomes, and another originating from a double-membrane compartment.
Discussion
The contributions of macroautophagy machinery in non-degradative processes deserve scrutiny, especially due to the advent of therapeutics modulating the autophagy process. In this study, we conducted unbiased quantitative proteome profiling experiments to comprehensively characterize CQ-induced alterations in the secretome, and discovered increased levels of multiple mammalian Atg8 orthologs and their cargo receptor proteins in secreted particles. We further validated our MS data and demonstrated ATG16L1-dependent enhancement of TAX1BP1 secretion induced by CQ, supporting the notion that Atg8 orthologs can be utilized in non-degradative contexts. Nevertheless, other Atg8 ortholog-independent cargo receptor recruitment mechanisms, such as receptor clustering, may also be involved [Citation37]. Previous literature in neurodegeneration [Citation13,Citation38], and the recent observation that SIRT1 (sirtuin 1) loss impairs lysosomal integrity and alters the breast cancer secretome [Citation39] support the notion that lysosomal status affects secretion. Previously, endosome microautophagy was demonstrated to play a role in selective degradation and secretion of cytosolic cargos [Citation40,Citation41]. Our study suggests that the selective autophagy apparatus may also perform a similar function. A recent study also suggested that LC3B mediates the loading of RNA-binding proteins into sEV [Citation15], which raises important questions on how Atg8 orthologs are divided between different degradative and secretory roles.
EV heterogeneity is an important area of pursuit in the EV field. Previous work has demonstrated that immunoprecipitation targeting different surface tetraspanins (CD9, CD81, CD63) yields sEV populations with overlapping but not identical proteomes at steady state [Citation42]. We have shown in our study that LC3B and GABARAP are present inside CD63+ sEV, a phenomenon that can be enhanced by CQ treatment. Our results where CD63, but not CD9, IP captured the majority of Atg8-family proteins are consistent with the proposed model that CD9 marks a broader range of sEV, while CD63 is present on a more restricted subset of sEV [Citation42], presumably of endosomal origin [Citation43]. Our findings and existing literature support a model where LC3B and other Atg8 orthologs can be lipidated at endosomal membranes, which give rise to CD63-positive sEV containing Atg8 orthologs (Fig. S6E). Indeed, LC3B lipidation was known to occur on perturbed endosomes [Citation44] and in the absence of autophagosome formation [Citation45]. We showed that the portion of ATG16L1 responsible for single membrane lipidation of LC3B [Citation26,Citation34] was required for the inclusion of LC3B in CD63-positive sEV. The recent discovery of LC3B-phosphatidylserine conjugation on single membranes during lysosomal stress is one possible mechanism driving the incorporation of LC3B in CD63+ sEV [Citation46] (Fig. S6E). The population of sEV bearing LC3B but not CD63 or SDCBP/syntenin-1 likely originated from separate, double-membrane structures, likely autophagosomes or precursor structures, but other intermediates such as secretory amphisomes [Citation47,Citation48] cannot be ruled out. While a previous study with well-fed cells failed to detect LC3B in CD63 or CD9 mediated immunoaffinity sEV capture [Citation32], our results indicate that the incorporation of LC3B and GABARAP into SDCBP/syntenin-1 and CD63-enriched sEV was significantly amplified upon CQ treatment, and possibly enhanced due to upregulation of basal autophagy under serum-free conditions. Our data also revealed an additional sEV subpopulation where the inclusion of LC3B does not involve endosomal lipidation but instead depends on double membrane, likely autophagosomal, LC3B lipidation. It remains to be determined how LC3B is distributed between these two sEV populations, and how autophagy flux affects each population with respect to abundance, contents and physiological effects. Our work was the first to show that lysosomal stress differentially affects sEV populations, and raises the possibility that other stressors may also differentially affect the composition and function of sEV, giving rise to the heterogeneity and plasticity in sEV signaling.
In this study, protein yield was prioritized during the collection of secreted particles in order to facilitate detection of low abundance proteins and changes in the overall secretome in downstream applications. Therefore, vesicular and non-vesicular entities were both present in the secreted fractions examined, as evident from the Western blot detection of sEV proteins and low levels of exomere components, and the TMT-MS detection of lipoproteins (APOA-APOB [apolipoprotein A-apolipoprotein B]), respectively. Potential CQ-induced changes in the sEV profile may be partially masked by non-vesicular components or may have evaded detection due to reduced sensitivity of NTA in the detection of small (<100 nm) particles [Citation49]. Future studies are necessary to fully elucidate the effects of CQ on distinct components of the secretome and each sEV population.
In the context of cancer treatment, CQ is typically used as a sensitizing agent in combination with another therapy. A meta-analysis of clinical trial data indicated that CQ or HCQ treatment results in improved treatment responses compared to chemotherapy or radiation therapy alone [Citation50]. While CQ is intended as an autophagy inhibitor, it is recognized that CQ can exert both autophagy-dependent and autophagy-independent effects [Citation51]. Our study illuminates a new mechanism (i.e., the enhanced secretion of autophagy proteins and partitioning of Atg8-family proteins into sEV) by which CQ can exert such effects in a cell extrinsic manner. It will be important to determine the physiological roles of CQ-induced secretion and how such roles are modified in the contexts of autophagy deficiency, cancer type and stage, distinct driver mutations, and mode of therapy.
Materials and methods
Cell culture
Mammalian cell lines were cultured at 37°C and 5% CO2. MDA-MB-231 was obtained from ATCC (HTB-26) and cultured in DMEM supplemented with 10 mM HEPES (Invitrogen, 15,630–080) 5 µg/ml insulin (Sigma, 10,516), 1x non-essential amino acids (NEAA; Invitrogen, 11,140–050) and 10% heat-inactivated fetal bovine serum (FBS) (Invitrogen, 12,483,020). SUM159PT was obtained from Asterand Bioscience/BioIVT (HUMANSUM-0003006) and cultured in Ham’s F-12 (Invitrogen, 11,765–062) supplemented with 10 mM HEPES, 5 µg/ml insulin, 1x NEAA, 10% FBS and 1 µg/ml hydrocortisone (Sigma, H4001). All cell lines were routinely checked with e-Myco Mycoplasma Detection Kit (iNtRON, 25,235) to rule out mycoplasma contamination.
Collection of secreted particles from cell lines
Cells were seeded on 15-cm tissue culture plates (Corning, 430,599) in regular growth media. Upon reaching 50% confluency, the culture media was removed, and cells were washed twice with PBS (Invitrogen, 10,010–049). Serum-free media was added to each plate along with PBS or chloroquine (Sigma, C6628). After 40–48 h, conditioned media and cell pellets were collected by centrifugation at 2000 x g, for 20 min. Trypan blue exclusion assay was used to ensure cell viability of greater than 90%. Conditioned media was pre-cleared by sequential centrifugation: 10 min at 300 x g, 20 min at 2000 x g and twice for 30 min at 10,000 x g. High molecular weight centrifugal ultrafiltration (Ultra 15, 100 kDa; Amicon, UFC910024) was then carried out to remove smaller contaminants and concentrate media. ExoQuick TC (Systems Biosciences, EXOTC50A-1) was used to precipitate secreted particles from concentrate according to manufacturer’s protocol. Secreted particles were resuspended in 200 µl of 0.02-µm filtered PBS and frozen in −80°C for future analyses. Protein concentration was measured using a Pierce BCA assay kit (Thermo Fisher, 23,227) after lysis using RIPA buffer (Santa Cruz Biotechnology, sc-24,948) for 1 h at 4°C with agitation.
Western blotting
Cell pellets and secreted particles were lysed using RIPA buffer using the manufacturer’s protocol. Gel electrophoresis was conducted using the Bolt (Thermo Fisher) system. Gels were run under reducing conditions unless CD63 detection was required. Protein gels were transferred using Mini Trans-blot system (Bio-Rad) onto PVDF membranes, followed by probing with primary antibodies (1:500–1:1000) overnight at 4°C, and HRP-linked secondary antibodies (1:5000) for 2 h at room temperature (see for antibody details). Signal was detected using a ChemiDox XRS+ (Bio-Rad) and quantitated using Image Lab software (Bio-Rad).
Table 1. Key reagents.
Nanoparticle tracking analysis (NTA)
A NanoSight LM10 microscope (Malvern) equipped with 488-nm laser and a sCMOS camera was used to measure the size and number of particles. Samples were diluted 1:500 to 1:2000 in 0.02-µm filtered PBS and injected into the chamber with a constant output syringe pump. The Nanoparticle Tracking Analysis (NTA 3.2 Dev Build 3.2.16) software was used to analyze three 60-second recordings of each sample (camera level: 12–13, detection threshold: 5).
Transmission electron microscopy
TBS (Tris-Buffered Saline, 137 mM NaCl, 2.7 mM KCl, 25 mM Tris Base, pH 7.4)-diluted secreted particle preparation (3 µl) was placed on glow-discharged Formvar-coated carbon grids (Ted Pella, 01800-F) and dried for 1 min. Excess liquid was removed with filter paper. Uranyl acetate (3 µl of 2%) was placed on the grid as a negative stain and removed after 1 minute of incubation using filter paper. The loaded grids were allowed to dry completely before viewing on a Hitachi H7600 TEM (transmission electron microscope; HV = 80kV, camera = XR51).
CRISPR-Cas9 knockout
Single guide RNA sequences against the human ATG4B, ATG16L1, MAP1LC3B and ULK1 genes were obtained from Genome-scale CRISPR Knock-Out (V2.0) library (Addgene, see for details; deposited by Feng Zhang) and cloned into PX459 (see ) using the Addgene recommended protocol. The resulting plasmids were sequenced and transfected into the MDA-MB-231 cell line using Lipofectamine 3000 (Thermo Fisher, L3000015). After 48 h, cells were selected with 1 µg/ml puromycin. Surviving individual clones were obtained using serial dilution. Isogenic knockout clones were validated with Western blotting.
Virus production and transduction
To produce lentivirus, lentiviral envelope (pCMV-VSV-G), packaging (psPAX2) and expression (pLENTI-PGK) vectors (see ) were transfected into HEK293T cells (ATCC, ACS-4500) using TransIT (Mirus Bio, MIR2300) at a ratio of 9:10:1. Twenty-four h after transfection, media was replaced with viral collection media (DMEM with 10% FBS, 1.1 g/100 ml BSA [Sigma, A2153] and HEPES). Virus-containing medium was collected 24 h after and cleared by centrifugation (20 min at 1791 g) and filtration (0.45 µm).
For viral transduction, cells were seeded on 6-well plates and allowed to reach 50% confluency. Cells were incubated overnight in 100 µL virus-containing medium plus 750 µL Opti-MEM (Invitrogen,11,058–021) with 8 µg/ml polybrene (Santa Cruz Biotechnology, sc-134,220). Normal growth media was added the next day, and 1 µg/ml puromycin (Sigma, P9620) was added 48 h after transduction for selection.
Cell viability assay
To measure cell line viability in serum-free media, cells were seeded on 96-well plates and placed in IncuCyte Zoom (Essen Bioscience) for live image capture. Four images were taken per well every 4 h using a 10x objective. Imaging data were analyzed using Incucyte Zoom software. Percentage viability was calculated by dividing the number of live cells (number of total nuclei minus number of Sytox-positive nuclei) with the total number of cells, using NucLight Rapid Red reagent (Essen BioScience, 4717) and Sytox Green (Thermo Fisher, S7020) to stain nuclei and dead cells, respectively.
Trypsin protection assay
Secreted particles were collected from the conditioned media of 10 x 15-cm plates of MDA-MB-231 parental or knockout cells seeded at the same density and treated with PBS or 10 µM CQ as described above. Sixty µl of SE sample per condition were split equally between 3 tubes (20 µl each), where 20 µl PBS, 20 µl 100 µg/ml trypsin (Sigma, T1426) in PBS or 20 µl 100 µg/ml trypsin and 2% Triton X-100 (Sigma, T8787) was added to each tube as described [Citation52]. After incubating on ice for 40 min with occasional flicking, the reactions were terminated by addition of 20 µl 4X LDS loading buffer (Thermo Fisher, B0007) with 2-mercaptoethanol and heating for 10 min at 80 degrees. Thirty µl of each sample was loaded per gel for Western blotting analysis as described above.
Iodixanol density gradient fractionation
Conditioned media was pre-cleared and concentrated by ultrafiltration as described above. Concentrate (100–400 µl) was mixed with equal volume of OptiPrep Density Gradient Medium (60% iodixanol; Sigma Aldrich, D1556) and placed on the bottom of ultracentrifuge tubes. Two-ml layers of 30%, 24%, 18%, 12%, and 6% iodixanol were prepared fresh and sequentially layered on top. The density gradient was centrifuged at x100,000 g for 16 h at 4°C in a Beckman SW41Ti rotor. One-ml fractions were sequentially taken starting from the top, diluted in 10 ml PBS and centrifuged again at 100,000 g for 3 h at 4°C to precipitate contents.
Immunofluorescence microscopy
Cells were grown on coverslips in 6-well plates and fixed with 4% neutral buffered formalin for 10 min. Samples were washed 3x in PBS+0.3% Triton X-100, permeabilized in 0.5% Triton X-100 for 5 min, and blocked for 1 h (2% BSA [Sigma, A2153], 0.3% Triton X-100 in PBS). For LC3B IF only, cells were fixed with −20°C methanol on ice for 10 min and preceded to blocking without permeabilization. Samples were then incubated with primary antibodies at 1:200 dilution for 1 h at room temperature, washed and incubated for 2 h in 1:1000 secondary antibodies, 10 min in 5 µg/ml DAPI, washed 3x again and mounted with Mowiol 488 (Sigma, 81,381).
Confocal images were acquired using a Nikon A1 plus camera on a Nikon TiE microscope (objective: 60X; numerical aperture: 1.45; refraction index: 1.51). Fluorophores were excited with lasers at 405 nm, 488 nm, 561 nm and 640 nm. Images were analyzed with NIS-Elements Viewer (4.50). Measurement of endosome size and fluorescent intensity profile was performed manually using ImageJ [Citation53]. Pearson’s correlation coefficient for colocalization was determined using JACoP [Citation54].
Immunoaffinity capture of sEV
Conditioned media was pre-cleared and concentrated by ultrafiltration as described above. 20 µl concentrated media and 180 µl IP buffer (0.2-µm filtered 0.1% BSA in PBS) was added to anti-CD9 or CD63 Dynabeads (Thermo Fisher, 10606D, 10614D) and incubated overnight at 4°C with mixing. Beads were washed twice with cold IP buffer the next day. Bound sEV were eluted by addition of 30–60 µl 1xLDS gel loading buffer, Bolt reducing agent and heating at 70–80°C for 10 min. Relative enrichment was calculated by first normalizing the levels of proteins of interest to TSG101 (to control for pull-down efficiency), followed by the ratio between -/+ CQ conditions.
DQ-BSA lysosomal activity assay
MDA-MB-231 cells seeded on 6-well plates were treated with PBS or 10 µM CQ in serum-free media for 48 h. Sixteen h prior to harvesting, DQ Red BSA (Thermo Fisher, D12051) was added to the media to a final concentration of 10 µg/ml and allowed to incubate overnight. The next day, cells were collected via trypsinization and analyzed for DQ Red BSA fluorescence on a Fortessa cytometer (BD Biosciences) using FACSDiva software. All lives cells negative for Sytox Green were analyzed. Data were analyzed using FlowJo 10.
Quantitative proteomics
Buffer containing 100 mM HEPES, pH 8.5 (Sigma, H3375), 2% (w:v) SDS (Sigma, L4509), 10 mM TCEP (Sigma, C4706), 40 mM CAA (Sigma, C0267), and 1x cOmplete protease inhibitor – EDTA free (Sigma, 4,693,159,001) was added to whole cell and secreted fractions for lysis and alkylation of disulfide bonds. SP3 cleanup [Citation16], digestions, TMT labeling and HPLC fractionation of proteins were performed as previously described [PMID: 27713570]. An Orbitrap Fusion Tribrid MS platform (Thermo Scientific) was used to analyze TMT-labeled peptide fractions. Data acquisition was carried out on the Orbitrap Fusion (control software version 2.1.1565.20) and processed using Proteome Discoverer Software as described [PMID: 27713570]. The mass spec proteomics data have been deposited to the ProteomeXchange Consortium via the PRIDE partner repository [Citation55].
Bioinformatics data analysis
All bioinformatics data analysis was conducted within the R environment (v3.3.3) [Citation56]. Abundance values of the identified unique peptides were median-centered across samples and used for downstream analyses. Differential protein abundance analysis between control and CQ-treated samples was performed at the peptide-level using paired PECA [Citation17] (v1.10), and p-values were computed from moderated t-statistics with multiple testing correction by Benjamini and Hochberg’s (BH) method. Proteins with at least 1.5-fold change and an adjusted p-value less than 0.05 between treated and untreated samples were termed differentially abundant proteins. Principal component analysis was performed using the prcomp function from the stats R package. All unique peptides identified commonly across all samples were used and their abundance log2-transformed for the analysis.
GO terms overrepresented in SE relative to WC were identified through the PANTHER web interface (accessed August 26th, 2019; GO Ontology database Released 2019–07–03) [Citation57] using Fisher’s exact test and BH correction. KEGG pathway overrepresentation analysis was performed using ClusterProfiler (v3.2.14) [Citation58] with BH correction and pathway annotations from https://www.kegg.jp/ (accessed August 26th, 2019). UniProt accession numbers of the differentially abundant proteins were converted to Entrez gene IDs using org.Hs.eg.db (v3.4.0) for KEGG pathway annotations. The list of LC3 interacting region containing proteins were obtained from the iLIR database (accessed 19 March 2019) [Citation59 Citation60 Citation61].
Statistics
Statistical tests were performed using GraphPad Prism 8.4.1. Unless otherwise noted, at least three biological replicates were performed. Two-tailed t-tests were used to evaluate the differences between two groups (control and one treated condition). Ordinary one-way ANOVA with appropriate multiple comparison tests were used to evaluate the difference between more than two groups. Unless otherwise noted, data is reported as mean with standard deviation (SD).
Data availability
Source data for have been provided in supplementary table S2. Methods for collecting secreted particles have been deposited to EV-TRACK [60] (EV190047). Referencing MISEV2018 [61], a nanoparticle collection procedure prioritizing recovery was selected. All relevant collection procedures and parameters were reported, and potential co-isolates of interest were mentioned. Molecules of interest were interpreted as secreted particles if vesicular nature could not be ascertained by appropriate validation experiments due to technical limitations. As this study focused on protein secretion, large EV, EV lipid/nucleic acids, and EV function were not investigated. Mass spectrometry data was deposited to PRIDE (PXD015614). Other supporting data are available upon reasonable request.
Supplemental Material
Download Zip (5.2 MB)Acknowledgments
The authors thank Garnet Martens, Miki Fujita, Bradford Ross, Sam Livingstone, and Derrick Horne at the UBC Bioimaging Facility for training and assistance with TEM microscopy, Cathie Garnis and James Lawson for sharing reagents and protocols, Mei Yieng Chin for Nanosight assistance, Andrew Leidal for protease protection assay protocol, Marcel Bally for IncuCyte access, Wenbo Xu, Vincent Chui, and the Terry Fox Laboratory for flow cytometry and confocal microscopy assistance, and Ian Bercovitz for assistance with statistical analyses. The authors also thank Gian Luca Negri, Robert Camfield, Kirstin Brown, and Bian Tu for helpful comments and discussions. The authors are grateful for comments and suggestions from anonymous reviewers. This study was supported by CIHR Operating Grant MOP-78882, CIHR in partnership with Avon Foundation for Women-Canada grant OBC127216 and BC Cancer-Pfizer Research Innovation Fund F17-05467-001 to SMG. JX and CJH were supported by CIHR Frederick Banting and Charles Best Canada Graduate Scholarship Doctoral Awards. AHL and AS were supported by the Research Council of Norway through its Center of Excellence funding scheme (Project: 262652). This project was partially supported by a Dust Diseases Board competitive grant to EHB. The views expressed herein are those of the authors and are not necessarily those of iCare or the Dust Diseases Board.
Disclosure statement
No potential conflict of interest was reported by the author(s).
Supplementary material
Supplemental data for this article can be accessed here.
Additional information
Funding
Related Research Data
References
- Levy JMM, Towers CG, Thorburn A. Targeting autophagy in cancer. Nat Rev Cancer. 2017;17(9):528–542.
- He C, Klionsky DJ. Regulation mechanisms and signaling pathways of autophagy. Annu Rev Genet. 2009;43(1):67–93.
- Ponpuak M, Mandell MA, Kimura T, et al. Secretory autophagy. Curr Opin Cell Biol. 2015;35:106–116.
- Rebecca VW, Amaravadi RK. Emerging strategies to effectively target autophagy in cancer. Oncogene. 2016;35(1):1–11.
- Dolgin E. Anticancer autophagy inhibitors attract ‘resurgent’ interest. Nat Rev Drug Discov. 2019;18(6):408–410.
- Chude CI, Amaravadi RK. Targeting autophagy in cancer: update on clinical trials and novel inhibitors. Int J Mol Sci. 2017;18(6):1279.
- Maes H, Kuchnio A, Peric A, et al. Tumor vessel normalization by chloroquine independent of autophagy. Cancer Cell. 2014;26(2):190–206.
- van Niel G, D’Angelo G, Raposo G. Shedding light on the cell biology of extracellular vesicles. Nat Rev Mol Cell Biol. 2018;19(4):213–228.
- Yáñez-Mó M, Siljander PR-M, Andreu Z, et al. Biological properties of extracellular vesicles and their physiological functions. J Extracell Vesicles. 2015;4(1):27066.
- El Andaloussi S,Mager, I,Breakefield, X. O, et al. Extracellular vesicles: biology and emerging therapeutic opportunities. Nat Rev Drug Discov. 2013;12(5):347–357.
- Hoshino A, Costa-Silva, B, Shen, T. L, et al. Tumour exosome integrins determine organotropic metastasis. Nature. 2015;1–19. DOI:10.1038/nature15756.
- Xu J, Camfield R, Gorski SM. The interplay between exosomes and autophagy – partners in crime. J Cell Sci. 2018;131(15):jcs215210.
- Eitan E, Suire C, Zhang S, et al. Impact of lysosome status on extracellular vesicle content and release. Ageing Res. Rev. 2016; 1–10. DOI:10.1016/j.arr.2016.05.001.
- Fussi N, Höllerhage M, Chakroun T, et al. Exosomal secretion of α-synuclein as protective mechanism after upstream blockage of macroautophagy. Cell Death Dis. 2018;9(7): DOI:10.1038/s41419-018-0816-2.
- Leidal AM, Huang, HH, Marsh, T, et al. The LC3-conjugation machinery specifies the loading of RNA-binding proteins into extracellular vesicles. Nat Cell Bio. 2020;22(2):187–199.
- Hughes CS, Foehr, S, Garfield, D. A, et al. Ultrasensitive proteome analysis using paramagnetic bead technology. Mol Syst Biol. 2014;10(10):757.
- Kohtala S, Theilmann W, Suomi T. PECA: probe-level expression change averaging. ACS Chemical Neuroscience. 2016;7(6):749–756.
- Mauthe M, Orhon I, Rocchi C, et al. Chloroquine inhibits autophagic flux by decreasing autophagosome-lysosome fusion. Autophagy. 2018;14(8):1435–1455.
- Johansen T, Lamark T. Selective autophagy mediated by autophagic adapter proteins. Autophagy. 2011;7(3):279–296.
- Mancias JD, Wang X, Gygi SP, et al. Quantitative proteomics identifies NCOA4 as the cargo receptor mediating ferritinophagy. Nature. 2014;509(7498):105–109.
- Sarraf SA, Shah HV, Kanfer G, et al. Selective autophagic clearance of protein aggregates is mediated by the autophagy receptor, TAX1BP1. bioRxiv. 2019;558767. DOI:10.1101/558767.
- Kirkin V, Rogov VV. A diversity of selective autophagy receptors determines the specificity of the autophagy pathway. Mol Cell. 2019;76(2):268–285.
- Xie X, Li F, Wang Y, et al. Molecular basis of ubiquitin recognition by the autophagy receptor CALCOCO2. Autophagy. 2015;11(10):1775–1789.
- Kuma A, Matsui M, Mizushima N. LC3, an autophagosome marker, can be incorporated into protein aggregates independent of autophagy: caution in the interpretation of LC3 localization. Autophagy. 2007;3(4):323–328.
- Guo H, Chitiprolu M, Roncevic L, et al. Atg5 disassociates the V1V0-ATPase to promote exosome production and tumor metastasis independent of canonical macroautophagy. Dev Cell. 2017;43(6):716–730.e7.
- Lystad AH, Carlsson SR, de la Ballina LR, et al. Distinct functions of ATG16L1 isoforms in membrane binding and LC3B lipidation in autophagy-related processes. Nat Cell Bio. 2019;21(3):372–383.
- Agrotis A, von Chamier L, Oliver H, et al. Human ATG4 autophagy proteases counteract attachment of ubiquitin-like LC3/GABARAP proteins to other cellular proteins. J Biol Chem. 2019;294(34):jbc.AC119.009977.
- Agrotis A, Pengo N, Burden JJ, et al. Redundancy of human ATG4 protease isoforms in autophagy and LC3/GABARAP processing revealed in cells. Autophagy. 2019;00:1–22.
- Kraft C, Peter M, Hofmann K. Selective autophagy: ubiquitin-mediated recognition and beyond. Nat Cell Bio. 2010;12(9):836–841.
- Tauro BJ, Greening DW, Mathias RA, et al. Two distinct populations of exosomes are released from LIM1863 colon carcinoma cell-derived organoids. Mol Cell Proteomics. 2013;12(3):587–598.
- Colombo M, Moita C, van Niel G, et al. Analysis of ESCRT functions in exosome biogenesis, composition and secretion highlights the heterogeneity of extracellular vesicles. J Cell Sci. 2013;126(Pt 24):5553–5565.
- Jeppesen DK, Fenix AM, Franklin JL, et al. Reassessment of exosome composition. Cell. 2019;177(2):428–445.e18.
- Baietti MF, Zhang Z, Mortier E, et al. Syndecan–syntenin–ALIX regulates the biogenesis of exosomes. Nat Cell Bio. 2012;14(7):677–685.
- Fletcher K, Ulferts, R, Jacquin, E, et al. The WD40 domain of ATG16L1 is required for its non‐canonical role in lipidation of LC3 at single membranes. EMBO J. 2018;e97840. DOI:10.15252/embj.201797840.
- Russell RC, Tian Y, Yuan H, et al. ULK1 induces autophagy by phosphorylating beclin-1 and activating VPS34 lipid kinase. Nat Cell Bio. 2013;15(7):741–750.
- Zachari M, Ganley IG, Lane JD. The mammalian ULK1 complex and autophagy initiation. Essays Biochem. 2017;61(6):585–596.
- Ohnstad AE, Delgado, JM, North, BJ, et al. Receptor‐mediated clustering of FIP200 bypasses the role of LC3 lipidation in autophagy. EMBO J. 2020;39(24):1–20.
- Minakaki G, Menges, S, Kittel, A, et al. Autophagy inhibition promotes SNCA/alpha-synuclein release and transfer via extracellular vesicles with a hybrid autophagosome-exosome-like phenotype. Autophagy. 2017;8627:1–61.
- Latifkar A, Ling L, Hingorani A, et al. Loss of sirtuin 1 alters the secretome of breast cancer cells by impairing lysosomal integrity. Dev Cell. 2019;49(3):393–408.e7.
- Sahu R, Kaushik S, Clement CC, et al. Microautophagy of cytosolic proteins by late endosomes. Dev Cell. 2011;20(1):131–139.
- Mukherjee A, Patel B, Koga H, et al. Selective endosomal microautophagy is starvation-inducible in drosophila. Autophagy. 2016;12(11):1984–1999.
- Kowal J, Arras G, Colombo M, et al. Proteomic comparison defines novel markers to characterize heterogeneous populations of extracellular vesicle subtypes. Proc Natl Acad Sci U S A. 2016;113(8):E968–77.
- Mathieu M, Menges, S, Kittel, A, et al. Specificities of exosome versus small ectosome secretion revealed by live intracellular tracking and synchronized extracellular vesicle release of CD9 and CD63. bioRxiv. 2020;2020(10.27.323766). DOI:10.1101/2020.10.27.323766
- Florey O, Gammoh N, Kim SE, et al. V-ATPase and osmotic imbalances activate endolysosomal LC3 lipidation. Autophagy. 2015;11(1):88–99.
- Jacquin E, Leclerc-Mercier S, Judon C, et al. Pharmacological modulators of autophagy activate a parallel noncanonical pathway driving unconventional LC3 lipidation. Autophagy. 2017;13(5):854–867.
- Durgan J, Lystad AH, Sloan, K, et al. Non-canonical autophagy drives alternative ATG8 conjugation to phosphatidylserine. Mol Cell. 2021;81(9):2031–2040.e8.
- Patel KK, Miyoshi H, Beatty WL, et al. Autophagy proteins control goblet cell function by potentiating reactive oxygen species production. EMBO J. 2013;32(24):3130–3144.
- Zhang M, Kenny SJ, Ge L, et al. Translocation of interleukin-1β into a vesicle intermediate in autophagy- mediated secretion. Elife. 2015;4. 10.7554/eLife.11205
- Bachurski D, Schuldner, M, Nguyen, PH, et al. Extracellular vesicle measurements with nanoparticle tracking analysis – an accuracy and repeatability comparison between NanoSight NS300 and ZetaView. J Extracell Vesicles. 2019;8(1):1596016.
- Xu R, Ji Z, Xu C, et al. The clinical value of using chloroquine or hydroxychloroquine as autophagy inhibitors in the treatment of cancers. Medicine (Baltimore). 2018;97(46):e12912.
- Maycotte P, Aryal S, Cummings CT, et al. Chloroquine sensitizes breast cancer cells to chemotherapy independent of autophagy. Autophagy. 2012;8(2):200–212.
- Shurtleff MJ, Temoche-Diaz MM, Karfilis KV, et al. Y-box protein 1 is required to sort microRNAs into exosomes in cells and in a cell-free reaction. Elife. 2016;5:1–23.
- Schneider CA, Rasband WS, Eliceiri KW. NIH Image to ImageJ: 25 years of image analysis. Nat Methods. 2012;9(7):671–675.
- Bolte S, Cordelières FP. A guided tour into subcellular colocalization analysis in light microscopy. J. Microsc. 2006;224(3):213–232.
- Perez-Riverol Y, Csordas A, Bai J, et al. The PRIDE database and related tools and resources in 2019: improving support for quantification data. Nucleic Acids Res. 2019;47(D1):D442–D450.
- R Core Team. . R: A Language and Environment for Statistical Computing. https://www.R-project.org/. Vienna, Austria: R Foundation for Statistical Computing; 2016, .
- Thomas PD, Campbell MJ, Kejariwal A. PANTHER: a library of protein families and subfamilies indexed by function. Genome Res. 2003;13(9):2129–2141.
- Yu G, Wang L-G, Han Y, et al. clusterProfiler: an R package for comparing biological themes among gene clusters. Omi A J Integr Biol. 2012;16(5):284–287.
- Jacomin A-C, Samavedam S, Promponas V, et al. iLIR database: a web resource for LIR motif-containing proteins in eukaryotes. Autophagy. 2016;12(10):1945–1953.
- Van Deun J, Mestdagh, P, Agostinis, P, et al. EV-TRACK: transparent reporting and centralizing knowledge in extracellular vesicle research. Nat Methods. 2017;14(3):228–232.
- Théry C, Witwer KW, Aikawa E, et al. Minimal information for studies of extracellular vesicles 2018 (MISEV2018): a position statement of the international society for extracellular vesicles and update of the MISEV2014 guidelines. J Extracell Vesicles. 2018;7(1):1535750.