
ABSTRACT
Macroautophagy/autophagy is a conserved cellular process associated with tumorigenesis and aggressiveness, while mechanisms regulating expression of autophagic machinery genes in cancers still remain elusive. Herein, we identified E2F4 (E2F transcription factor 4) as a novel transcriptional activator of cytoprotective autophagy crucial for zinc homeostasis in cancer cells. Gain- and loss-of-function studies showed that E2F4 promoted autophagy in a cell cycle-dependent manner, resulting in facilitated degradation of MT (metallothionein) proteins, elevated distribution of Zn2+ within autophagosomes, decreased labile intracellular zinc ions, and increased growth, invasion, and metastasis of gastric cancer cells. Mechanistically, E2F4 directly regulated the transcription of ATG2A (autophagy related 2A) and ULK2 (unc-51 like autophagy activating kinase 2), leading to autophagic degradation of MT1E, MT1M, and MT1X, while USP2 (ubiquitin specific peptidase 2) stabilized E2F4 protein to induce its transactivation via physical interaction and deubiquitination in cancer cells. Rescue experiments revealed that USP2 harbored oncogenic properties via E2F4-facilitated autophagy and zinc homeostasis. Emetine, a small chemical inhibitor of autophagy, was able to block interaction between UPS2 and E2F4, increase labile intracellular zinc ions, and suppress tumorigenesis and aggressiveness. In clinical gastric cancer specimens, both USP2 and E2F4 were upregulated and associated with poor outcome of patients. These findings indicate that therapeutic targeting of the USP2-E2F4 axis inhibits autophagic machinery essential for zinc homeostasis in cancer progression.
Abbreviations: 3-MA: 3-methyladenine; ANOVA: analysis of variance; ATG2A: autophagy related 2A; ATG5: autophagy related 5; ATP: adenosine triphosphate; BECN1: beclin 1; BiFC: bimolecular fluorescence complementation; CCND1: cyclin D1; CDK: cyclin dependent kinase; ChIP: chromatin immunoprecipitation; CHX: cycloheximide; Co-IP: co-immunoprecipitation; DAPI: 4’,6-diamidino-2-phenylindole; E2F4: E2F transcription factor 4; eATP: extracellular adenosine triphosphate; EBSS: Earle’s balanced salt solution; FP: first progression; FRET: fluorescence resonance energy transfer; FUCCI: fluorescent ubiquitination-based cell cycle indicator; GFP: green fluorescent protein; GST: glutathione S-transferase; HA: hemagglutinin; MAP1LC3B/LC3B: microtubule associated protein 1 light chain 3 beta; MDM2: MDM2 proto-oncogene; MKI67/Ki-67: marker of proliferation Ki-67; MT: metallothionein; MT1E: metallothionein 1E; MT1M: metallothionein 1M; MT1X: metallothionein 1X; MTT: 3-(4,5-dimethyltriazol-2-yl)-2,5-diphenyl tetrazolium bromide; OS: overall survival; PECAM1/CD31: platelet and endothelial cell adhesion molecule 1; PIK3C3: phosphatidylinositol 3-kinase catalytic subunit type 3; qPCR: quantitative PCR; RFP: red fluorescent protein; SQSTM1/p62: sequestosome 1; UBXN1: UBX domain protein 1; Ub: ubiquitin; ULK2: unc-51 like autophagy activating kinase 2; USP14: ubiquitin specific peptidase 14; USP2: ubiquitin specific peptidase 2; USP5: ubiquitin specific peptidase 5; USP7: ubiquitin specific peptidase 7; ZnCl2: zinc chloride.
Introduction
Gastric cancer, an aggressive malignancy, ranks as the second leading cause of cancer-related death around the world [Citation1]. Despite of declined mortality rate in past decade, 5-year overall survival rate of gastric cancer is still low, mainly due to tumor recurrence and metastasis [Citation1]. Macroautophagy/autophagy is initially characterized as a mechanism of cell death when apoptosis is defective, and plays tumor suppressive roles [Citation2]. However, emerging evidence shows that proliferative or aggressive cancer cells undergo cytoprotective autophagy to degrade cytoplasmic organelles or misfolded proteins, and reuse them to sustain biosynthesis and energy homeostasis [Citation3]. Autophagy is involved in modulating motility, invasion, stem cell phenotype, and drug resistance of cancer cells [Citation4], and contributes to epithelial-to-mesenchymal transition [Citation5] or escape from immune surveillance [Citation6]. Increased expression of MAP1LC3B/LC3B (microtubule associated protein 1 light chain 3 beta), an autophagy signature, is associated with aggressive phenotypes and poor survival in many types of cancers, such as breast cancer [Citation7], melanoma [Citation8], and glioblastoma [Citation9]. However, mechanisms regulating functions and expression of ATG (autophagy related) genes in cancers still remain largely elusive.
E2F4 (E2F transcription factor 4), one member of E2F transcription factor family, plays an important role in regulating expression of genes essential for cell cycle progression from G1 to S phrase [Citation10]. For instance, E2F4 promotes the transcription of cyclin and cyclin dependent kinase necessary for S phase, which can be suppressed by RBL1/p107 (RB transcriptional corepressor like 1) and RBL2/p130 (RB transcriptional corepressor like 2) [Citation11]. Remarkably, loss of E2F4 suppresses the development of pituitary and thyroid tumors in Rb1 (RB transcriptional corepressor 1)+/− mice [Citation12]. High E2F4 expression is documented in breast cancer [Citation13] and bladder cancer [Citation14], and associated with cancer progression and poor prognosis of patients [Citation13,Citation14]. Meanwhile, knockdown of E2F4 leads to decrease in G1-S transition and proliferation of colon cancer cells [Citation10], suggesting the oncogenic functions of E2F4. However, the roles of E2F4 in gastric cancer progression remain to be determined, especially in regulating autophagic machinery.
In this study, we identified E2F4 as a novel transcription factor regulating expression of autophagic machinery genes, which was associated with poor outcome of gastric cancer. Notably, E2F4 facilitated cytoprotective autophagy in a cell cycle-dependent manner, resulting in degradation of MT (metallothionein) proteins, decrease of labile intracellular zinc ions, and increase of growth, invasion, and metastasis in gastric cancer cells. In addition, USP2 (ubiquitin specific peptidase 2) physically interacted with E2F4 to prevent its ubiquitination and proteasomal degradation in cancer cells. Depletion of USP2 or administration of a small chemical inhibitor blocking interaction of USP2 with E2F4 significantly suppressed autophagy, increased labile intracellular zinc ion levels, and inhibited tumorigenesis and aggressiveness of cancer cells, suggesting that USP2 promoted E2F4-mediated autophagy machinery during zinc homeostasis and cancer progression.
Results
E2F4 is an essential transcription factor activating autophagic genes in gastric cancer
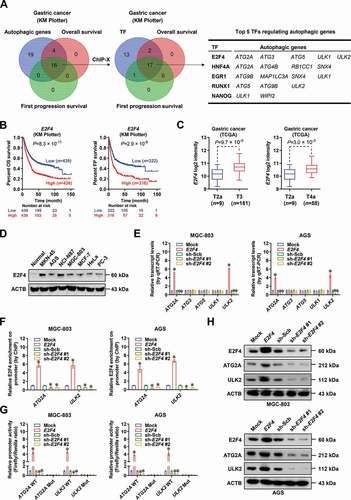
To investigate essential transcription factors regulating macroautophagic/autophagic gene expression, we performed comprehensive analysis of Kaplan-Meier (KM) Plotter database (http://kmplot.com), and identified 16 autophagic machinery genes associated with both overall (OS) and first progression (FP) survival of gastric cancer patients (). Subsequently, we discovered 33 transcription factors regulating these autophagic machinery genes analyzed by ChIP-X, a program based on evidence from chromatin immunoprecipitation (ChIP) on chip, ChIP sequencing, or ChIP-paired end diTag [Citation15], and 17 of them were consistently associated with OS and FP survival of gastric cancer cases ( and Table S1). Notably, E2F4 was top transcription factor ranking by number of target genes (). Gastric cancer patients with high E2F4 levels had poorer OS or FP survival than those with low expression (P = 8.3 × 10⁻¹¹, P = 2.9 × 10⁻⁹, and Fig. S1A). Higher E2F4 levels were observed in clinical gastric cancer cases with advanced pathological stages (P = 9.7 × 10⁻⁵ and P = 3.0 × 10⁻³, ), as well as in cultured cancer cell lines than those of normal gastric mucosa ( and Fig. S1B). To explore the effects of E2F4 on autophagic gene expression, MGC-803 and AGS (with moderate E2F4 levels) were chosen as cell line models. Notably, stable overexpression or knockdown of E2F4 increased or decreased the transcript levels of ATG2A (autophagy related 2A) and ULK2 (unc-51 like autophagy activating kinase 2), but not of autophagy related 3, ATG5 (autophagy related 5), unc-51 like autophagy activating kinase 1, BECN1 (beclin 1), or PIK3C3 (phosphatidylinositol 3-kinase catalytic subunit type 3), in MGC-803 and AGS cells, respectively ( and Fig. S1C). As a control, knockdown of potential transcription factor HNF4A (hepatocyte nuclear factor 4 alpha) or RUNX1 (RUNX family transcription factor 1; ) did not affect the expression of ATG2A or ULK2 in gastric cancer cells (Fig. S1D). There was increase or decrease in E2F4 enrichment, promoter activity, and expression of ATG2A and ULK2 in gastric cancer cells upon stable ectopic expression or knockdown of E2F4, respectively (). Mutation of E2F4 binding site decreased the promoter activity of ATG2A and ULK2 in MGC-803 and AGS cells, which was not affected by stable overexpression or silencing of E2F4 (). Treatment with palbociclib, an established CDK4 (cyclin dependent kinase 4) and CDK6 (cyclin dependent kinase 6) inhibitor inducing cell cycle arrest at G1 phase [Citation16], prevented S phrase entry and upregulation of ATG2A and ULK2 in MGC-803 cells stably overexpressing E2F4 (Fig. S1E-S1G), suggesting that E2F4 facilitated their expression in a cell cycle-dependent manner. These results indicated that transcription factor E2F4 facilitated the expression of autophagic machinery genes in gastric cancer.
Figure 1. Identification of E2F4 as a transcription factor activating autophagic genes in gastric cancer. (A) Venn diagram (left panel) and table (right panel) showing discovery of macroautophagic/autophagic genes associated with overall and first progression survival of gastric cancer patients derived from KM plotter database (http://kmplot.com), transcription factors (TF) regulating expression of these autophagic machinery genes analyzed by ChIP-X program, and those associated with overall and first progression survival. (B) Kaplan-Meier curves indicating overall (OS) and first progression (FP) survival of gastric cancer cases with low or high levels of E2F4 (cutoff values = 7.02 and 6.61). (C) Relative levels of E2F4 in gastric cancer cases (TCGA) with different pathological stages (t2a vs. t3, t2a vs. t4a). (D) Western blot assay showing the protein levels of E2F4 in normal gastric mucosa and cancer cell lines. (E) Real-time qRT-PCR assay revealing the transcript levels of target genes (normalized to ACTB/β-actin) in MGC-803 and AGS cells stably transfected with empty vector (mock), E2F4, scramble shRNA (sh-Scb), or sh-E2F4 (n = 5). (F) ChIP and qPCR assays showing the enrichment of E2F4 (normalized to input DNA) on promoter region of ATG2A and ULK2 in MGC-803 and AGS cells stably transfected with mock, E2F4, sh-Scb, or sh-E2F4 (n = 5). (G and H) Dual-luciferase assay using reporter with wild-type (WT) or mutant (Mut) E2F4 binding site (G) and Western blot assay (H) indicating the promoter activity and expression of ATG2A and ULK2 in MGC-803 and AGS cells stably transfected with mock, E2F4, sh-Scb, or sh-E2F4 (n = 5). Fisher’s exact test for overlapping analysis in A. Log-rank test for survival comparison in B. Bars were means and whiskers (min to max) in C. Student’s t test and ANOVA compared the difference in C and E-G. * P < 0.05 vs. mock or sh-Scb. Data are shown as mean ± s.e.m. (error bars) and representative of three independent experiments in D-H.
E2F4 facilitates cytoprotective autophagy via ATG2A or ULK2 in gastric cancer
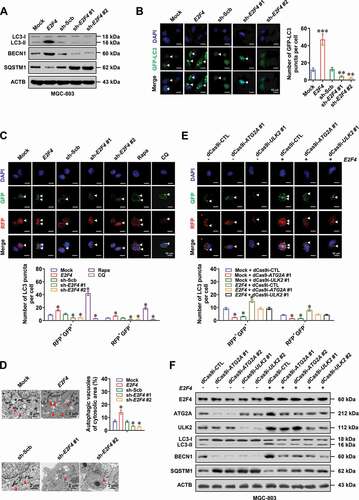
We further determined whether E2F4 could affect autophagy in gastric cancer cells. The levels of LC3-II and BECN1, hallmarkers of autophagy, were increased or decreased in MGC-803 and AGS cells with stable overexpression or silencing of E2F4, accompanied by downregulation or upregulation of SQSTM1/p62 (sequestosome 1), respectively ( and Fig. S2A). Consistently, there was elevated or reduced green fluorescent protein (GFP)-tagged LC3 punctate in MGC-803 cells stably transfected with E2F4 or short hairpin RNAs (shRNAs) targeting E2F4 (sh-E2F4, ). Autophagy flux assay further revealed that ectopic expression or knockdown of E2F4 significantly affected the autophagosome (red fluorescent protein [RFP]+ GFP+) or autolysosome (RFP+ GFP−) formation in MGC-803 cells (), while the morphological presence and number of vesicular structures resembling autophagosomes and autolysosomes were further validated by transmission electron microscopy (). Notably, knockdown of ATG2A or ULK2 by dCas9-based clustered regularly interspaced short palindromic repeats [Citation17] abolished the autophagy induced by stable overexpression of E2F4 in MGC-803 cells (and F). These data indicated that E2F4 facilitated cytoprotective autophagy via ATG2A or ULK2 in gastric cancer.
Figure 2. E2F4 facilitates cytoprotective autophagy via ATG2A or ULK2 in gastric cancer. (A) Western blot assay showing the levels of LC3-I, LC3-II, BECN1/Beclin 1, or SQSTM1/p62 in MGC-803 cells stably transfected with empty vector (mock), E2F4, scramble shRNA (sh-Scb), or sh-E2F4. (B) Representative images (left panel) and quantification (right panel) of GFP-LC3 puncta in MGC-803 cells transfected with mock, E2F4, sh-Scb, or sh-E2F4, with nucleus staining by DAPI. Scale bars: 10 μm. (C) Representative images (upper panel) and quantification (lower panel) of autophagic flux reporter RFP-GFP-LC3 in MGC-803 cells stably transfected with mock, E2F4, sh-Scb, or sh-E2F4, and those treated with rapamycin (Rapa, 1 μmol·L−1) or chloroquine (CQ, 20 μmol·L−1) for 4 h as positive or negative controls. Scale bars: 10 μm. (D) Transmission electron microscopic observation and quantification of autophagosomes or autolysosomes (red arrowheads) in MGC-803 cells stably transfected with mock, E2F4, sh-Scb, or sh-E2F4. Scale bars: 2 μm. (E and F) Representative images (upper panel) and quantification (lower panel) of autophagic flux reporter RFP-GFP-LC3 (E) and Western blot assay of target gene expression (F) in MGC-803 cells stably transfected with mock, E2F4, sh-Scb, or sh-E2F4 #1, and those co-transfected with dCas9i control (dCas9i-CTL), dCas9i-ATG2A, or dCas9i-ULK2. Scale bars: 10 μm. Student’s t test and ANOVA compared the difference in B-E. *P < 0.05, **P< 0.01, ***P< 0.001 vs. mock, sh-Scb, or mock+dCas9i-CTL. Data are shown as mean ± s.e.m. (error bars) and representative of three independent experiments in A-F.
E2F4 decreases metallothionein and labile zinc ion levels via inducing autophagy
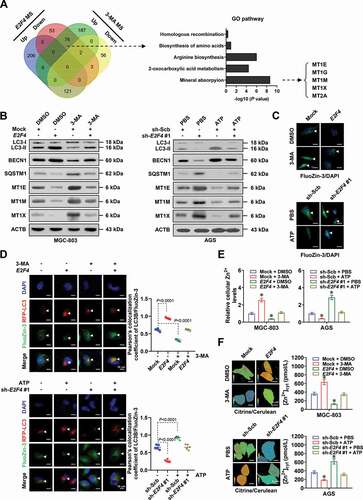
Then, we investigated potential proteins degraded by E2F4-induced autophagy via quantitative proteomics. Overlapping analysis of mass spectrometry results from MGC-803 cells indicated 76 proteins downregulated by stable transfection of E2F4 and rescued by treatment with autophagy inhibitor 3-methyladenine (3-MA, Table S2 and Table S3), especially those involved in zinc homeostasis, including MT1E (metallothionein 1E), MT1G (metallothionein 1 G), MT1M (metallothionein 1 M), MT1X (metallothionein 1X), and MT2A (metallothionein 2A; ), which are multifunctional zinc-binding proteins regulating storage, transport, and distribution of zinc ions [Citation18]. Among them, lower expression of MT1E, MT1M, or MT1X was significantly associated with poor survival of gastric cancer patients (Fig. S2B and S2C). Further validating experiments indicated that stable overexpression or knockdown of E2F4 led to downregulation or upregulation of MT1E, MT1M, and MT1X at protein levels, elevated or reduced distribution of Zn2+ within autophagosomes (colocalization of LC3B and FluoZin-3 reporters), and decreased or increased levels of labile intracellular zinc ions in MGC-803 and AGS cells, which were rescued by treatment with 3-MA or adenosine triphosphate (ATP) driving autophagic process [Citation19], respectively (and Fig. S2D). In addition, knockdown of ATG5, an established core autophagy regulator [Citation20], abolished the increase of Zn2+ distribution within autophagosomes and decrease of labile intracellular zinc ions in MGC-803 cells stably overexpressing E2F4 (Fig. S2E-S2H). These results indicated that E2F4 decreased metallothionein and labile zinc ion levels via inducing autophagy in gastric cancer cells.
Figure 3. E2F4 decreases metallothionein and zinc ion levels via inducing autophagy. (A) Venn diagram (left panel) and GO pathway analysis (right panel) showing the overlapping of mass spectrometry results from MGC-803 cells treated with stable transfection of E2F4 or 3-MA (1.0 μmol·L−1). (B) Western blot assay indicating the expression of LC3-I, LC3-II, BECN1/Beclin 1, SQSTM1/p62, MT1E, MT1M, MT1X in MGC-803 and AGS cells stably transfected with empty vector (mock), E2F4, scramble shRNA (sh-Scb), or sh-E2F4, and those treated with 3-MA (1.0 μmol·L−1) or ATP (0.1 mmol·L−1). (C) Confocal images of FluoZin-3 staining within MGC-803 and AGS cells stably transfected with mock, E2F4, sh-Scb, or sh-E2F4, and those treated with 3-MA (1.0 μmol·L−1) or ATP (0.1 mmol·L−1). Scale bars: 10 μm. (D) Representative images (left panel) and quantification (right panel) of RFP-GFP-LC3 and FluoZin-3 reporters in MGC-803 cells stably transfected with mock, E2F4, sh-Scb, or sh-E2F4, and those treated with 3-MA (1.0 μmol·L−1) or ATP (0.1 mmol·L−1). Scale bars: 10 μm. (E) Intracellular levels of zinc ion within MGC-803 and AGS cells stably transfected with mock, E2F4, sh-Scb, or sh-E2F4, and those treated with 3-MA (1.0 μmol·L−1) or ATP (0.1 mmol·L−1). (F) Representative images (left panel) and quantification (right panel) of FRET assay using eCALWY-4 in MGC-803 and AGS cells stably transfected with mock, E2F4, sh-Scb, or sh-E2F4, and those treated with 3-MA (1.0 μmol·L−1) or ATP (0.1 mmol·L−1). Scale bars: 5 μm. ANOVA compared the difference in D-F. * P < 0.05 vs. mock+DMSO or sh-Scb+PBS. Data are shown as mean ± s.e.m. (error bars) and representative of three independent experiments in B-F.
E2F4 promotes tumorigenesis and aggressiveness in an autophagy-dependent manner
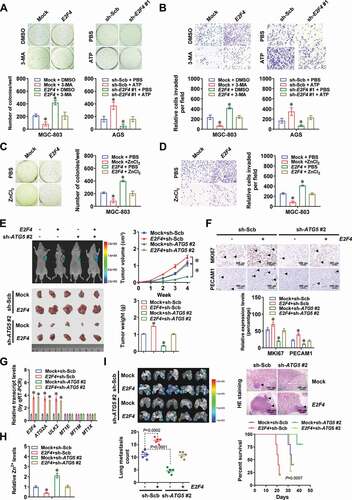
Then, we explored the involvement of autophagy in oncogenic roles of E2F4 in gastric cancer. The viability, anchorage-independent growth, and invasion capabilities of MGC-803 and AGS cells were increased or decreased by stable overexpression or silencing of E2F4, respectively, while 3-MA incubation, ATG5 knockdown, or ATP treatment abolished these alterations (and B, Fig. S3A-S3C). Treatment with gastric cancer cells with zinc chloride (ZnCl2) prevented the increase of viability, anchorage-independent growth, and invasion of gastric cancer cells stably overexpressing E2F4 (and D, Fig. S3D). Stable transfection of E2F4 into MGC-803 cells led to increase in growth, weigh, MKI67/Ki-67 (marker of proliferation Ki-67) index, and PECAM1/CD31 (platelet and endothelial cell adhesion molecule 1)-positive microvessels of subcutaneous xenograft tumors in athymic nude mice (and F). There was upregulation of ATG2A and ULK2 in subcutaneous xenograft tumors formed by MGC-803 cells stably overexpressing E2F4 in athymic nude mice, accompanied by alteration in protein levels of LC3-II, BECN1, MT1E, MT1M, and MT1X ( and Fig. S3E). Meanwhile, the transcript levels of MT1E, MT1M, and MT1X were not significantly altered in these xenograft tissues (). There were decreased zinc ion levels in subcutaneous xenograft tumors formed by MGC-803 cells stably overexpressing E2F4 (). In experimental metastasis assay, more lung metastatic colonies and lower survival probability were observed in athymic nude mice treated with tail vein injection of MGC-803 cells stably transfected with E2F4 (). In addition, silencing of ATG5 abolished these alterations induced by ectopic expression of E2F4 ( and Fig. S3E). Taken together, these results indicated that E2F4 promoted tumorigenesis and aggressiveness in an autophagy-dependent manner.
Figure 4. E2F4 promotes tumorigenesis and aggressiveness in an autophagy-dependent manner. (A and B) Representative images (upper panel) and quantification (lower panel) of soft agar (A) and matrigel invasion (B) assays indicating the anchorage-independent growth and invasion of MGC-803 and AGS cells stably transfected with empty vector (mock), E2F4, scramble shRNA (sh-Scb), or sh-E2F4, and those treated with 3-MA (1.0 μmol·L−1) or ATP (0.1 mmol·L−1; n = 4). (C and D) Representative images (left panel) and quantification (right panel) of soft agar (C) and matrigel invasion (D) assays showing the anchorage-independent growth and invasion of MGC-803 cells stably transfected with mock or E2F4, and those treated with ZnCl2 (50 μmol·L−1). (E) Representative images (left panels), tumor growth curve (right upper panel), and weight at the end points (right lower panel) of xenografts formed by subcutaneous injection of MGC-803 cells stably transfected with mock, E2F4, sh-Scb, or sh-ATG5 #2 into the dorsal flanks of nude mice (n = 5 for each group). (F) Representative images (upper panel) and quantification (lower panel) of immunohistochemical staining revealing the expression of MKI67/Ki-67 and PECAM1/CD31 (arrowheads) within xenografts formed by subcutaneous injection of MGC-803 cells stably transfected with mock, E2F4, sh-Scb, or sh-ATG5 #2. Scale bars: 100 μm. (G) Real-time qRT-PCR (normalized to ACTB/β-actin) assay revealing the levels of E2F4, autophagic target genes (ATG2A and ULK2), and metallothioneins (MT1E, MT1M, and MT1X) in subcutaneous xenografts formed by MGC-803 cells stably transfected with mock, E2F4, sh-Scb, or sh-ATG5 #2 (n = 5). (H) Relative zinc ion levels within xenografts formed by subcutaneous injection of MGC-803 cells stably transfected with mock, E2F4, sh-Scb, or sh-ATG5 #2 (n = 5). (I) Representative images (upper left panel), hematoxylin-eosin (HE) staining (upper right panel), quantification of lung metastatic colonization (lower left panel), and survival curve (lower right panel) of nude mice treated with tail vein injection of MGC-803 cells stably transfected with mock, E2F4, sh-Scb, or sh-ATG5 #2 (n = 5 for each group). Student’s t test and ANOVA compared the difference in A-I. Log-rank test for survival comparison in I. * P < 0.05 vs. mock+DMSO, sh-Scb+PBS, mock+PBS, or mock+sh-Scb. Data are shown as mean ± s.e.m. (error bars) and representative of three independent experiments in A-D.
USP2 stabilizes E2F4 protein via deubiquitination in gastric cancer cells
To gain insight into protein partner essential for E2F4 stability in gastric cancer, co-immunoprecipitation (co-IP) and mass spectrometry assays were performed and identified 402 proteins immunoprecipitated by E2F4 antibody from extracts of MGC-803 cells (Table S4). Since previous studies implicate the involvement of ubiquitin-proteasome pathway in degrading E2F4 protein [Citation21], these potential partners were subjected to further overlapping analysis with those involved in deubiquitination process derived from AmiGO2 (http://amigo.geneontology.org/) database (). The results revealed five potential proteins binding to E2F4, including UBXN1 (UBX domain protein 1), USP14 (ubiquitin specific peptidase 14), USP2, USP5 (ubiquitin specific peptidase 5), and USP7 (ubiquitin specific peptidase 7; , Fig. S4A and S4B). Validating studies indicated endogenous physical interaction of E2F4 with USP2 protein, but not with UBXN1, USP14, USP5, or USP7, in MGC-803 cells ( and Fig. S4C). Consistently, immunofluorescence assay indicated co-localization of E2F4 and USP2 in the nuclei of AGS cells, with elevated E2F4 levels in those stably transfected with USP2 (). Meanwhile, treatment with palbociclib decreased the nuclear translocation of USP2 in gastric cancer cells (Fig. S4D). Direct physical interaction of E2F4 with USP2 was observed in MGC-803 cells transfected with constructs of Flag-tagged USP2, hemagglutinin (HA)-tagged E2F4, VC155-USP2, or VN173-E2F4 (and E). Especially, 1–200 and 403–503 amino acids of USP2 protein were crucial for its interaction with E2F4, while C-terminal transactivation domain (TAD, 337–413 amino acids), but not DNA-binding domain (DBD), DP dimerization domain (DDD), or SS domain (SSD), of HA-tagged E2F4 protein was crucial for its interaction with USP2 (), which were validated by in vitro binding assay using purified recombinant GST (glutathione S-transferase)-tagged E2F4 and His-tagged USP2 proteins (Fig. S4E).
Figure 5. USP2 stabilizes E2F4 protein via deubiquitination in gastric cancer cells. (A) Coomassie Brilliant Blue staining, co-IP, and mass spectrometry (MS) assays showing proteins immunoprecipitated by E2F4 antibody in MGC-803 cells, and those overlapped with proteins involved in deubiquitination. (B) Co-IP and Western blot assays indicating endogenous interaction between E2F4 and USP2 protein in MGC-803 cells. The IgG-bound proteins were taken as negative controls. (C) Representative images (left panel) and quantification (right panel) of immunofluorescence showing co-localization between E2F4 and USP2 in AGS cells, and those stably transfected with empty vector (mock) or USP2. Scale bars: 10 μm. (D) Co-IP and Western blot assays indicating interaction between E2F4 and USP2 protein in MGC-803 cells transfected with truncations of Flag-tagged USP2 or HA-tagged E2F4 as indicated. (E) Representative images (upper panel) and quantification (lower panel) of BiFC assay showing physical interaction of E2F4 with USP2 in MGC-803 cells co-transfected with VC155-USP2 and VN173-E2F4. Scale bars: 10 μm. (F) Western blot assay revealing the levels of E2F4 in gastric cancer cells stably transfected with mock, USP2, scramble shRNA (sh-Scb), or sh-USP2 #1. (G) Western blot assay indicating the expression of E2F4 in MGC-803 and AGS cells stably transfected with mock, USP2, sh-Scb, or sh-USP2 #1, and those treated with cycloheximide (CHX, 20 μg/ml) or MG132 (10 μmol·L−1) for 4 h. (H) Western blot assay showing the protein levels of USP1 and E2F4 in AGS cells stably transfected with mock or USP2, and those treated with CHX (20 μg/ml) for durations as indicated (n = 5). (I) Co-IP and Western blot assays revealing ubiquitination of E2F4 in MGC-803 and AGS cells transfected with mock, USP2, sh-Scb, sh-USP2 #1, HA-tagged E2F4 with wild-type (WT) or mutant ubiquitination site at lysine 350 (K350), or Flag-tagged Ub. ANOVA compared the difference in C, E and H. *P < 0.05 vs. VN173+ VC155 or mock. Data are shown as mean ± s.e.m. (error bars) and representative of three independent experiments in B-I.
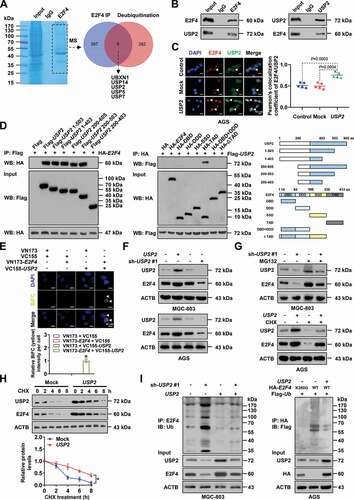
Stable overexpression or knockdown of USP2, a deubiquitinating enzyme [Citation22], increased or decreased the protein levels, but not transcript levels, of E2F4 in MGC-803 and AGS cells (, Fig. S4F-S4H). Meanwhile, there was no significant impact of E2F4 on USP2 expression in these gastric cancer cells (Fig. S4H). Pre-treatment of AGS cells with cycloheximide (CHX), an established protein synthesis inhibitor, abolished the increase of E2F4 levels induced by ectopic expression of USP2 (), while incubation of MGC-803 cells with proteasome inhibitor (MG132) prevented the degradation of E2F4 protein induced by USP2 knockdown (). Notably, overexpression or silencing of USP2 markedly increased or decreased the half-life of E2F4 protein in gastric cancer cells ( and Fig. S4I). Consistently, the levels of HA-tagged E2F4 protein were increased by transfection of Flag-tagged USP2 in a dose-dependent manner (Fig. S4J). Ubiquitination assay revealed that USP2 significantly decreased the ubiquitional levels of endogenous or HA-tagged E2F4 protein in gastric cancer cells, while mutation of lysine 350 (K350) analyzed by UbPred program (http://www.ubpred.org) abolished the ubiquitination of E2F4 induced by transfection of Flag-tagged ubiquitin (Ub, ). Collectively, these results suggested that USP2 stabilized E2F4 protein via deubiquitination in gastric cancer cells.
USP2 harbors oncogenic properties via facilitating E2F4-mediated autophagy
We further performed rescue studies in AGS and MGC-803 cells to investigate the functional interplay of USP2 and E2F4 during autophagy and aggressiveness of gastric cancer cells. Stable overexpression or knockdown of USP2 increased and decreased the E2F4 enrichment, promoter activity, transcript levels, and protein expression of ATG2A and ULK2, which was prevented by silencing or ectopic expression of E2F4, respectively (and B, Fig. S5A and S5B). Consistently, autophagy was facilitated or inhibited in gastric cancer cells stably overexpressing or silencing USP2, resulting in elevated or reduced distribution of Zn2+ within autophagosomes, and decreased or increased labile intracellular zinc ions, respectively, which were rescued by knockdown or overexpression of E2F4 (and D, Fig. S5C-S5F). To further validate these findings, HEK293 cells with E2F4 knockout were transfected with exogenous E2F4, resulting in upregulation of ATG2A and ULK2 (Fig. S5G). In addition, ectopic expression of USP2 induced upregulation of these autophagic genes in HEK293 cells with wild-type E2F4, but not in those with knockout of E2F4 ().
Figure 6. USP2 harbors oncogenic properties via facilitating E2F4-mediated autophagy. (A) ChIP and qPCR (normalized to input DNA, n = 4), dual-luciferase reporter (n = 5), and real-time qRT-PCR (normalized to ACTB/β-actin, n = 4) assays indicating E2F4 enrichment, promoter activity, and transcript levels of ATG2A and ULK2 in AGS cells stably transfected with empty vector (mock) or USP2, and those co-transfected with scramble shRNA (sh-Scb) or sh-E2F4 #1. (B) Western blot assay showing the protein levels of ATG2A and ULK2 in AGS cells stably transfected with mock or USP2, and those co-transfected with sh-Scb or sh-E2F4 #1. (C) Western blot assay revealing protein levels of LC3-I, LC3-II, BECN1/Beclin 1, and SQSTM1/p62 in AGS cells stably transfected with mock or USP2, and those co-transfected with sh-Scb or sh-E2F4 #1. (D) Representative images of RFP-GFP-LC3 fluorescence punctate in MGC-803 cells stably transfected with mock or USP2, and those co-transfected with sh-Scb or sh-E2F4 #1. Scale bars: 10 μm. (E) Western blot assay indicating the levels of USP2, E2F4, ATG2A, and ULK2 in HEK293 cells with wild-type (WT) or mutant knockout (KO) of E2F4, and those transfected with mock or USP2. (F and G) Representative images (left panel) and quantification (right panel) of soft agar (F) and matrigel invasion (G) assays indicating Anchorage-independent growth and invasion capability of AGS cells stably transfected with mock or USP2, and those co-transfected with sh-Scb or sh-E2F4 #1 (n = 5). (H and I) Representative images (H, left panels), tumor growth curve (H, right upper panel), weight at the end points (H, right lower panel), relative zinc ion levels (H, right lower panel), and immunohistochemical staining of MKI67/Ki-67 and PECAM1/CD31 (I) within xenografts in nude mice formed by subcutaneous injection of AGS cells stably transfected with mock or USP2, and those co-transfected with sh-Scb or sh-E2F4 #1 (n = 5 for each group). Scale bars: 100 μm. (J) Representative images (upper panel) and quantification of lung metastatic colonies (middle panel), and Kaplan-Meier curves (lower panel) of nude mice treated with tail vein injection of AGS cells stably transfected with mock or USP2, and those co-transfected with sh-Scb or sh-E2F4 #1 (n = 5 for each group). ANOVA compared the difference in A and F-J. Log-rank test for survival comparison in J. *P < 0.05 vs. mock+sh-Scb. Data are shown as mean ± s.e.m. (error bars) and representative of three independent experiments in A-G.
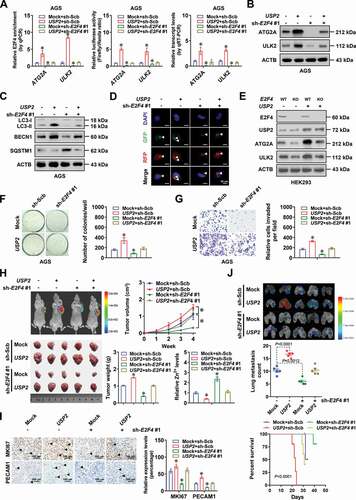
Stable overexpression or knockdown of USP2 facilitated and attenuated the anchorage- independent growth and invasiveness of gastric cells, which was abolished by transfection of sh-E2F4 #1 or E2F4 into AGS and MGC-803 cells, respectively (and G, Fig. S6A and S6B). In addition, stable transfection of USP2 into AGS cells increased the growth, tumor weight, MKI67 proliferation index, and PECAM1/CD31-positive microvessels of subcutaneous xenograft tumors in nude mice, along with decreased levels of zinc ions, which were prevented by knockdown of E2F4 (and I). There was significant upregulation of ATG2A and ULK2 in xenograft tumors formed by AGS cells stably transfected with USP2, accompanied by decreased protein expression rather than transcript levels of BECN1, MT1E, MT1M, and MT1X, while knockdown of E2F4 abolished these effects (Fig. S6C and S6D). In experimental metastasis assay, athymic nude mice treated with tail vein injection of AGS cells stably transfected with USP2 displayed more lung metastatic colonies and less survival probability, which were prevented by knockdown of E2F4 (). These results indicated that USP2 harbored oncogenic properties through facilitating E2F4-mediated autophagy.
Therapeutic knockdown of USP2 suppresses the tumorigenesis and aggressiveness of gastric cancer
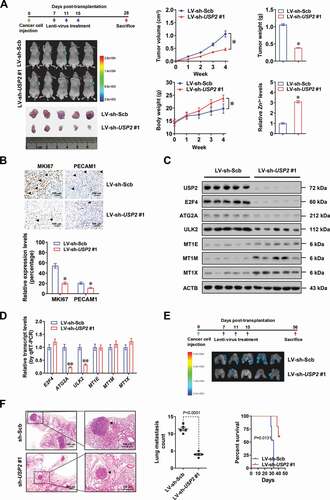
To further assess the therapeutic efficacy of USP2 knockdown, nude mice were treated with subcutaneous or tail vein injection of MKN-45 cells. Intravenous administration of lentivirus-mediated sh-USP2 #1 dramatically reduced the growth, weight, MKI67 proliferation index, and PECAM1/CD31-positive microvessels of subcutaneous xenograft tumors (and B), accompanied by elevation of zinc ions and significant alteration in expression of USP2 and its target genes (and D). In addition, body weight of nude mice was increased in lentivirus-mediated sh-USP2 #1 treatment group (). Nude mice treated with tail vein administration of lentivirus-mediated sh-USP2 #1 presented fewer metastatic lung counts and longer survival time (and F). These data indicated that lentivirus-mediated USP2 knockdown suppressed tumorigenesis and aggressiveness of gastric cancer.
Figure 7. Therapeutic knockdown of USP2 suppresses the tumorigenesis and aggressiveness of gastric cancer. (A and B) Representative images, tumor growth curve, weight at the end points, relative zinc ion levels (A), and immunohistochemical staining of MKI67/Ki-67 and PECAM1/CD31 (B) of xenografts formed by MKN-45 cells in athymic nude mice (n = 5 per group) that received intravenous injection of lentivirus (LV)-mediated scramble shRNA (sh-Scb) or sh-USP2 #1, with body weight (left lower panel) as indicated. Scale bars: 100 μm. (C and D) Western blot (C) and real-time qRT-PCR (D, normalized to ACTB/β-actin) assays revealing the expression of USP2, E2F4, ATG2A, ULK2, MT1E, MT1M, and MT1X within subcutaneous xenografts formed by MKN-45 cells in athymic nude mice (n = 5 per group) that received intravenous injection of LV-mediated sh-Scb or sh-USP2 #1. (E and F) Representative images (E), hematoxylin-eosin (HE) staining (F, left panel), quantification of lung metastatic colonization (F, middle panel), and survival curves (F, right panel) of nude mice (n = 5 for each group) treated with tail vein injection of MKN-45 cells and subsequent administration of LV-mediated sh-Scb or sh-USP2 #1 as indicated. Scale bars: 100 μm. Student’s t test and ANOVA compared the difference in A, B, D and F. Log-rank test for survival comparison in F. * P < 0.05 vs. LV-sh-Scb. Data are shown as mean ± s.e.m. (error bars) in A, B, D and F.
Emetine suppresses autophagy and cancer progression via blocking E2F4-USP2 interaction
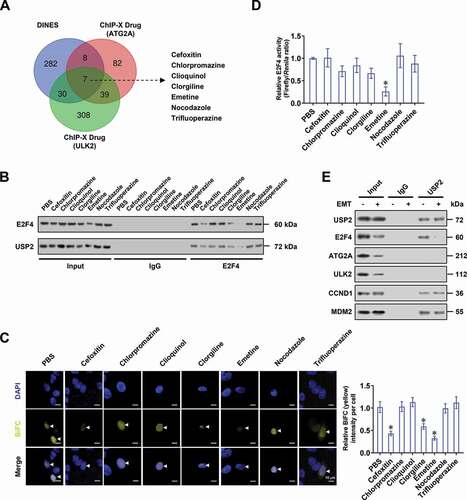
To screen chemical inhibitors targeting interaction between USP2 and E2F4, we first analyzed public DINES (https://www.genome.jp/tools/dinies/) database, and identified 327 potential compounds interacting with USP2 (). We also found 136 and 384 chemicals that were able to induce upregulation or downregulation of target genes (ATG2A and ULK2) using ChIP-X program. Based on overlapping analysis of these findings, 7 compounds were found to probably block the interaction between USP2 and E2F4, including cefoxitin, chlorpromazine, clioquinol, clorgiline, emetine, nocodazole, and trifluoperazine (). Administration of cefoxitin, clorgiline, or emetine, but not of other compounds, reduced the interaction of USP2 with E2F4 in AGS cells (and C). Among these compounds, only emetine significantly reduced the transactivation of E2F4 (). Notably, there was no interaction of USP2 with ATG2A or ULK2, while emetine did not affect the binding of USP2 to established substrate CCND1 (cyclin D1) [Citation23] or MDM2 (MDM2 proto-oncogene) [Citation24] ().
Figure 8. Identification of emetine as an inhibitor blocking E2F4-USP2 interaction. (A) Venn diagram indicating identification of 327 potential compounds interacting with USP2 derived from DINES (https://www.genome.jp/tools/dinies/) database, and overlapping analysis with chemicals inducing upregulation or downregulation of target genes (ATG2A and ULK2) using ChIP-X program. (B) Co-IP and Western blot assays showing the interaction of USP2 with E2F4 in gastric cancer AGS cells treated with seven potential compounds as indicated. (C) Representative images (left panel) and quantification (right panel) of BiFC assay revealing the direct interaction between E2F4 with USP2 in AGS cells treated with chemicals as indicated. Scale bars: 10 μm. (D) Dual-luciferase assay indicating the E2F4 transactivation activity in AGS cells treated with chemicals as indicated. (E) Co-IP and Western blot assays showing the interaction of USP2 with E2F4, ATG2A, ULK2, CCND1, or MDM2 in gastric cancer AGS cells treated PBS or emetine (EMT, 0.5 µmol/L) for 48 h. ANOVA compared the difference in C and D. * P < 0.05 vs. PBS. Data are shown as mean ± s.e.m. (error bars) and representative of three independent experiments in B-E.
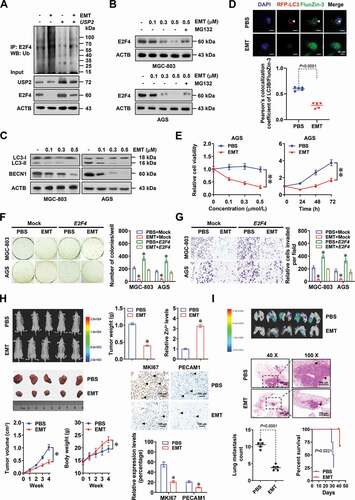
Notably, ubiquitination levels of E2F4 were significantly enhanced in AGS cells treated with emetine, which were rescued by transfection of USP2 (). Importantly, the E2F4 protein levels were downregulated by emetine in a dose-dependent manner, with concentration as low as 0.1 µmol·L−1, in gastric cancer cells (Fig. S7A and S7B), while administration of proteasome inhibitor MG132 attenuated these effects (). Treatment with emetine resulted in decreased levels of LC3-II and BECN1 ( and Fig. S7C), and reduced accumulation of GFP-LC3 fluorescence puncta (Fig. S7D). In addition, emetine abolished the autophagy of gastric cancer cells induced by ATP or Earle’s Balanced Salt Solution (EBSS), and reduced distribution of Zn2+ within autophagosomes (Fig. S7C and ). In 3-(4,5-dimethyltriazol-2-yl)-2,5-diphenyl tetrazolium bromide (MTT) colorimetric assay, emetine suppressed the viability of AGS cells in a dose- or time-dependent manner, without impact on that of non-transformed mammary epithelial MCF 10A cells ( and Fig. S7E). The anchorage-independent growth and invasion capabilities of gastric cancer cells were reduced by emetine treatment, with elevated labile intracellular zinc ion levels, while ectopic expression of E2F4 abolished these effects (and G, Fig. S7F-S7H). Importantly, intraperitoneal administration of emetine (10 mg/kg) significantly reduced the growth, tumor weight, MKI67 proliferation index, and PECAM1/CD31-positive microvessels of subcutaneous xenograft tumors formed by AGS cells in nude mice (), with elevated zinc ion levels and altered expression of E2F4 and its autophagic target genes (, Fig. S7I and S7J). The body weight of nude mice, an indicator of developing tumor burden, was improved in emetine treatment group, than that of solvent treatment group (). Moreover, administration of emetine significantly reduced the lung metastatic colonies and increased the survival duration of nude mice treated with tail vein injection of AGS cells ().
Figure 9. Emetine suppresses autophagy and cancer progression via blocking E2F4-USP2 interaction. (A) Denatured IP and Western blot assays indicating the ubiquitination of E2F4 in AGS cells treated with emetine (EMT, 0.5 µmol·L−1), and those transfected with empty vector (mock) or USP2. (B) Western blot assay revealing the E2F4 levels in MGC-803 and AGS cells treated with different doses of EMT, and those co-treated with MG132 (10 μmol·L−1). (C) Western blot assay showing the levels of LC3-I, LC3-II and BECN1/Beclin 1 in MGC-803 and AGS cells treated with different doses of EMT. (D) Representative images (upper panel) and quantification (lower panel) of RFP-GFP-LC3 and FluoZin-3 reporters in AGS cells treated with EMT (0.5 µmol·L−1) for 48 h. Scale bars: 10 μm. (E) MTT colorimetric assay depicting changes in viability of AGS cells treated with different doses of EMT for 24 h or EMT (0.5 µmol·L−1) for time points as indicated. (F and G) Representative images (left panel) and quantification (right panel) of soft agar (F) and matrigel invasion (G) assays indicating Anchorage-independent growth and invasion of MGC-803 and AGS cells stably transfected with mock or E2F4, and those treated with EMT (0.5 µmol·L−1). (H) Representative images (left upper panel), tumor growth curve (left lower panel), weight (right upper panel), relative zinc ion levels (right upper panel), and immunohistochemical staining of MKI67/Ki-67 and PECAM1/CD31 (right lower panel) of subcutaneous xenografts formed by AGS cells in nude mice that received intraperitoneal administration of EMT (10 mg/kg, n = 5 for each group), with body weight (left lower panel) as indicated. Scale bars: 100 μm. (I) Representative images (upper panel), HE staining (middle panel), quantification of lung metastatic colonization (lower left panel), and survival curves (lower right panel) of nude mice treated with tail vein injection of AGS cells and PBS or EMT (10 mg/kg, n = 5 for each group). Scale bars: 100 μm. Student’s t test and ANOVA compared the difference in D-I. Log-rank test for survival comparison in I. * P < 0.05 vs. PBS or PBS+mock. Data are shown as mean ± s.e.m. (error bars) and representative of three independent experiments in A-G.
To further explore effects of emetine, xenograft tumors formed by MGC-803 cells stably overexpressing empty vector (mock) or E2F4 were collected for organoid culture (Fig. S8A). Of note, ectopic expression of E2F4 facilitated the growth of organoids, while treatment with emetine significantly abolished these effects (Fig. S8A). Moreover, administration of emetine inhibited the growth of organoids derived from clinical gastric cancer specimens with detectable USP2-E2F4 interaction, without impact on those lacking this interaction (Fig. S8B and S8C). Taken together, these data indicated that emetine suppressed autophagy and cancer progression via blocking E2F4-USP2 interaction.
USP2, E2F4, and target genes are associated with outcome of gastric cancer
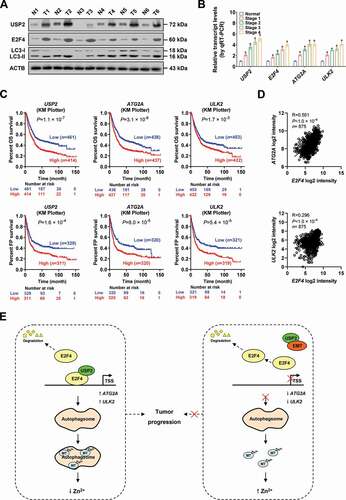
To better understand the correlation of USP2, E2F4, and their target genes with outcome of gastric cancer, we observed their expression in clinical specimens. Western blot and real-time qRT-PCR assays indicated higher levels of USP2, E2F4, LC3-II, ATG2A, and ULK2 in clinical gastric cancer tissues, than those of normal peri-tumor counterparts (and B). Kaplan–Meier survival plots of well-defined gastric cancer cases derived from KM Plotter database (http://kmplot.com) revealed that higher expression of USP2 (P = 1.1 × 10⁻⁷ and P = 1.6 × 10⁻⁴), ATG2A (P = 3.1 × 10⁻⁶ and P = 8.0 × 10⁻⁵), or ULK2 (P = 1.7 × 10⁻³ and P = 5.4 × 10⁻⁵) was associated with OS and FP survival probability of patients ( and Fig. S8D). In addition, the E2F4 expression was positively correlated with that of ATG2A (R = 0.561, P < 1.0 × 10⁻⁴) or ULK2 (R = 0.296, P < 1.0 × 10⁻⁴) in these gastric cancer specimens (). Moreover, high expression of USP2 or E2F4 was associated with poor survival of patients with breast cancer, colon cancer, gliomas, head and neck cancer, lung cancer, neuroblastoma, ovarian cancer, renal cancer, or Wilms tumor (Fig. S9). These results indicated that expression of USP2, E2F4, or target genes was associated with outcome of gastric cancer.
Figure 10. USP2, E2F4, and target genes are associated with outcome of gastric cancer. (A) Western blot assay indicating the levels of USP2, E2F4, LC3-I, and LC3-II in gastric cancer tissues (T) or their normal counterparts (N). (B) Real-time qRT-PCR assay showing the levels (normalized to ACTB/β-actin) of USP2, E2F4, ATG2A, and ULK2 in gastric cancer tissues and their normal counterparts (n = 21). (C) Kaplan-Meier curves indicating the overall (OS) and first progression (FP) survival of gastric cancer cases derived from KM Plotter (http://kmplot.com) with high or low expression of USP2 (cutoff values = 3.46 and 3.00), ATG2A (cutoff values = 8.59 and 8.42), or ULK2 (cutoff values = 5.73 and 5.55). (D) Pearson’s coefficient correlation analysis depicting the positive expression correlation of E2F4 with ATG2A or ULK2 in gastric cancer tissues (n = 875). (E) The mechanisms underlying the roles of USP2 and E2F4 in autophagy and cancer progression: as a deubiquitinating enzyme, USP2 interacts with and stabilizes E2F4 protein, resulting in transcriptional upregulation of autophagic genes ATG2A and ULK2, autophagic degradation of metallothioneins, decrease of labile intracellular zinc ions, and increase of tumorigenesis and aggressiveness. Meanwhile, emetine is able to block USP2-E2F4 interaction and suppress cancer progression. Student’s t test compared the difference in B. Log-rank test for survival comparison in C. Pearson’s correlation analysis in D. * P < 0.05 vs. normal. Data are shown as mean ± s.e.m. (error bars) and representative of three independent experiments in A and B.
Discussion
The formation process of macroautophagy involves a series of steps including initiation, nucleation, elongation and maturation, fusion with lysosome, and degradation, which are highly regulated by ATGs [Citation25]. To date, 32 mammalian ATGs constituting autophagic machinery have been discovered [Citation26]. Based on specific context, ATGs play a tumor suppressive or promoting role in cancer progression [Citation27]. For example, BECN1 is essential for initiation of autophagy via activating PIK3C3 and facilitating the onset of phosphatidylinositol 3 kinase complex [Citation28]. Loss of BECN1 is found in 40%-75% of breast cancer cases [Citation29], whereas Becn1 mutant mice develop spontaneous malignancies [Citation30]. Besides, Atg7-deficient mice also develop liver tumors [Citation31]. On the other hand, ATG10, a component catalyzing conjugation of ATG5 and ATG12, is upregulated in colorectal cancer and associated with invasion and metastasis of tumors [Citation32]. Infection of H. pylori impairs autophagy to promote tumorigenesis of gastric mucosa [Citation33]. In gastric cancer, elevated BECN1 or ATG5 expression is associated with poor prognosis or chemoresistance of patients [Citation34,Citation35]. However, transcriptional regulators of autophagy in gastric cancer still remain largely unknown. In this study, through mining of public datasets, we identified E2F4 as a crucial transcription factor regulating autophagic gene expression, such as ATG2A and ULK2 (). ATG2 localizes on the autophagic membrane and is essential for autophagosome formation at a late stage [Citation36]. Meanwhile, ULK2 contributes to initiation phase of autophagy through phosphorylation of BECN1-containing initiation complex, and promotes invasiveness of cancer cells [Citation37]. Our evidence indicated that E2F4 exerted oncogenic roles in promoting cancer progression via inducing autophagy, while cell cycle G1/S phase blocker abolished these effects, suggesting the perspective roles of E2F4 in regulating cell cycle-dependent autophagic machinery of cancer cells.
In healthy tissues, extracellular adenosine triphosphate (eATP) is undetectable [Citation38]. Meanwhile, in response to various conditions, such as hypoxia, inflammation, autophagy, or plasma membrane damage [Citation39], ATP is released from cancer cells to constitute one of main components of tumor microenvironment. Previous studies show that eATP is able to affect proliferation, motility, dissemination, and stem cell-like property of cancer cells via signaling through purinergic receptors [Citation40,Citation41]. For example, eATP stimulates migration and invasion of vemurafenib-resistant melanoma cells [Citation42], glioma cells, breast cancer cells, and prostate cancer cells [Citation43]. Recent evidences indicate that ATP induces autophagy in human macrophages [Citation44]. However, the roles of eATP in regulating autophagy of cancer cells still remain elusive. In this study, we found that as an upstream stimulation, eATP facilitated autophagy, growth, and aggressiveness of cancer cells via E2F4, while underlying mechanisms warrant further investigation.
Zinc ion, the second most abundant transition metal, is essential for proper cellular processes including cell cycle and differentiation [Citation45]. In approximate 10% of human proteins, Zn2+ is required for their structure and functions, including DNA and RNA polymerases, protein kinase C, nuclear factor κB, and mitochondrial respiratory enzymes [Citation46]. Meanwhile, aberrant zinc homeostasis affects transcriptional regulation of genes involved in cell viability, proliferation, or apoptosis in a variety of cancers [Citation47]. Interestingly, multiple studies suggest that zinc may be an effective anti-cancer agent in xenograft models [Citation48]. As zinc-binding proteins, human MTs are divided into four isoforms (MT1-4), while high expression of MT1 or MT2 is associated with aggressiveness and poor prognosis of breast cancer and ovarian cancer [Citation49]. However, MT1 or MT2 expression is decreased and associated with poor prognosis in hepatocellular cancer, gastric cancer, and thyroid cancer [Citation49]. Knockdown of MT3 induces arrest of autophagy and accumulation of zinc ions in lysosomes, and decreases survival of irradiated glioma cells, suggesting essential role of zinc accumulation in autophagy flux [Citation50]. In recent years, a variety of methods have been developed to monitor the levels or distribution of zinc ions within mammalian cells. In this study, we applied the FluoZin-3, a zinc sensitive fluorescent dye, for observing the fluctuation of zinc ion levels in gastric cancer cells. However, high intracellular concentrations of FluoZin-3 might perturb labile Zn2+ levels [Citation51]. To overcome this limitation, we also applied the genetically encoded Zn2+ sensor (eCALWY-4) to specifically detect labile Zn2+ pool. The eCALWY-4 is consisted of two fluorescent proteins and a Zn2+ coordinating site [Citation51], while relative orientation and distance of two fluorescent proteins can be altered upon binding with zinc, resulting in reduction of fluorescence resonance energy transfer (FRET) signal. In the current study, our results demonstrated that E2F4 induced autophagic degradation of MT1E, MT1M, and MT1X, resulting in elevated distribution of Zn2+-stored vesicles within autophagosomes, reduced labile intracellular zinc ion levels, and facilitated growth and invasion of gastric cancer cells, providing a novel mechanism of autophagy in regulating zinc homeostasis of cancers.
USP2, a member of ubiquitin-specific protease family, removes lysine-linked ubiquitin from substrate proteins and rescues them from proteasomal degradation [Citation22]. For instance, USP2 is able to deubiquitinate Aurora, an oncogenic serine/threonine kinase, in accelerating cell mitosis [Citation52]. In addition, USP2 interacts with and stabilizes MDM2 [Citation24], tumor necrosis factor receptor associated factor 2 [Citation53], epidermal growth factor receptor [Citation54], and CCNA1 (cyclin A1) [Citation55]. As a bona fide oncogene, USP2 is able to induce malignant transformation of NIH3T3 cells [Citation56]. In triple-negative breast cancer, USP2 is highly expressed in metastatic lesions of patients with poor prognosis [Citation57]. Enforced expression of USP2 leads to enhanced proliferation, invasion, migration, and resistance to chemotherapeutic reagents via targeting CCNA1 in bladder cancer cells [Citation55]. Previous studies indicate that free E2F4 protein is unstable and degraded by the ubiquitin-proteasome pathway [Citation21]. In the present study, our evidence demonstrated that USP2 directly interacted with E2F4, resulting in deubiquitination of lysine 350 and stabilization of E2F4 protein. In addition, USP2 was highly expressed in gastric cancer specimens and associated with patients’ survival. Importantly, rescue experiments indicated that oncogenic functions of USP2 were mediated, at least in part, through interacting with and stabilizing E2F4 protein in gastric cancer cells.
In recent years, pharmacological or genetic inhibition of autophagy has been regarded as a promising therapeutic strategy for cancers. For example, as an inhibitor of autophagy, chloroquine is able to enhance the therapeutic effects of radiation or temozolomide in glioma cells [Citation58]. Knockdown of ATG5, ATG7, or ATG12 results in sensitization of cancer cells to a variety of therapeutic modalities [Citation59]. In this study, based on mining of public datasets, we discovered emetine as an inhibitor blocking interaction between USP2 and E2F4. Emetine, a natural compound originated from ipecac roots, is firstly approved as an anti-protozoal compound in clinics [Citation60]. Recent evidence shows that emetine inhibits migration and invasion of non-small-cell lung cancer cells via regulating extracellular regulated protein kinase and MAPK14 (mitogen-activated protein kinase 14) signaling pathway [Citation61]. In ovarian cancer, emetine and cisplatin synergistically inhibit proliferation of ovarian cancer cells [Citation62]. In this study, we found that emetine inhibited the expression of E2F4 and its autophagic target genes in cancer cells, resulting in elevated zinc ion levels and repressed cancer progression. In addition, lentivirus-mediated USP2 knockdown suppressed the autophagy, tumorigenesis, and aggressiveness of gastric cancer cells, suggesting the oncogenic roles of the USP2-E2F4-autophagy axis in cancer progression.
In conclusion, we demonstrate that E2F4 is associated with poor outcomes of gastric cancer, and regulates expression of autophagic machinery genes (ATG2A and ULK2), resulting in atuophagic degradation of metallothioneins essential for zinc homeostasis, tumorigenesis, and aggressiveness. As a deubiquitinating enzyme, USP2 interacts with and stabilizes E2F4 protein, leading to promotion of E2F4-mediated autophagy associated with cancer progression. Lentivirus-mediated USP2 knockdown suppresses tumorigenesis and aggressiveness of gastric cancer. Importantly, administration of emetine, a chemical blocking interaction between USP2 and E2F4, inhibits autophagy and suppresses the growth and aggressiveness of gastric cancer cells. We believe that this study extends our knowledge about the regulation of autophagy by transcription factor and its protein partner, and suggests that the USP2-E2F4-autophagy-zinc homeostasis axis may be a potential therapeutic target for cancers.
Materials and methods
Cell culture
Human gastric cancer cell lines MKN-45 (JCRB0254), AGS (CRL-1739), NCI-N87 (CRL-5822), MGC-803 (JCRB0254), breast cancer MCF-7 cells (HTB-22), cervical cancer HeLa cells (CCL-2), prostate cancer PC-3 cells (CRL-1435), and embryonic kidney HEK293 (CRL-1573) and HEK293T (CRL-11268) cells were obtained from Japanese Collection of Research Bioresources Cell Bank and American Type Culture Collection. The E2F4−/− HEK293 cells were obtained from EdiGene Biotechnology Company (CL0041773301A). Cell were authenticated by short tandem repeat profiling, and used within 6 months after resuscitation of frozen aliquots. Mycoplasma contamination was regularly examined using Lookout Mycoplasma PCR Detection Kit (Sigma, MP0035). Cell lines were cultured at 37°C in a humidified atmosphere of 5% CO2, with RPMI1640 medium containing 10% fetal bovine serum (Life Technologies, 16,140,071), and treated with EBSS (Life Technologies, Inc., 24,010,043), palbociclib (Sigma, PZ0383), 3-MA (Sigma, M9281), ATP (Sigma, A1852), ZnCl2 (Sigma, 39,059), CHX (Sigma, C7698), MG132 (Sigma, M8699), rapamycin (Sigma, V900930), chloroquine (Sigma, C6628), or emetine (Sigma, S962856) as indicated.
Real-time quantitative RT-PCR
Cellular total RNA was prepared using RNeasy Mini Kit (Qiagen Inc., 74,104). Reverse transcription reactions were conducted with PrimeScript 1st Strand cDNA Synthesis Kit (TaKaRa Bio. Inc., 6110A). Real-time PCR was performed with SYBR Premix Ex Taq II (TaKaRa Bio. Inc., RR820A) and primer sets (Table S5). The fluorescent signals were collected during extension phase, while Ct values of each sample were calculated, and transcript levels were analyzed by 2−ΔΔCt method.
Western blot
Cytoplasmic or nuclear fractions were isolated using NE-PER Nuclear and Cytoplasmic Extraction Reagents (Thermo Fisher Scientific Inc., 78,835). Protein was extracted from tissues or cells with 1× cell lysis buffer (Promega, A1731). Western blot was undertaken with antibodies specific for E2F4 (Cell Signaling Technology, 40,291); ATG2A (ab226931), ULK2 (ab97695), LC3B (ab51520), BECN1 (ab210498), SQSTM1/p62 (ab109012), MT1E (ab193618), ATG5 (ab108327), UBXN1 (ab151723), USP14 (ab192618), USP2 (ab66556), USP5 (ab154170), USP7 (ab108931), CCND1 (ab16663), MDM2 (ab226939), HA (ab9110), His (ab18184), Flag (ab45766), and Ub (ab7254) from Abcam Inc.; MT1M (17,281-1-AP) and MT1X (17,172-1-AP) from Proteintech Group, Inc.; GST (sc-33,614) and ACTB/β-actin (sc-130,300) from Santa Cruz Biotechnology.
Denatured protein immunoprecipitation and ubiquitination assays
Cancer cells were seeded on 10-cm dishes. Twenty-four hours later, cells were treated with 10 µmol·L−1 of proteasome inhibitor MG132 for 24 h. Cell extracts were heat-denatured for 10 min, and diluted with RIPA buffer supplemented with complete protease inhibitors (Roche, 04693132001) and 20 mmol·L−1 N-ethylmaleimide (Sigma, E3876). Diluted cell lysates were sonicated and clarified by centrifugation. Immunoprecipitation was performed using E2F4 antibody (Abcam Inc., ab264276) or IgG (Abcam Inc., ab172730), respectively. The immunoprecipitated proteins were subjected to Western blotting using Ub antibody (Abcam Inc., ab7780). For protein half-life assay, cancer cells were treated with CHX (20 µg/ml) for durations as indicated, and proteins were extracted for Western blot assay.
Luciferase reporter assay
Human ATG2A (−494 to +202) or ULK2 (−422 to +376) promoter with wild-type or mutant E2F4 binding site was amplified from genomic DNA by PCR primers (Table S6), subcloned into luciferase reporter vector pGL3-Basic (Promega, E1751), and confirmed by sequencing. Cancer cells were seeded on 24-well plates, and co-transfected with these established luciferase reporter vectors (30 ng) and Renilla luciferase reporter vector pRL-SV40 (10 ng; Promega, E2231) as an internal reference. Dual-luciferase assay was performed using a luminometer (Lumat LB9507, Berthold Tech., Bad Wildbad, Germany).
ChIP and qPCR
Cancer cells were plated on 10-cm culture dishes, and ChIP assay was performed according to the instructions of EZ-ChIP kit (MerkMillipore, 17–371). Real-time quantitative PCR (qPCR) was performed using SYBR Green PCR Master Mix (Applied Biosystems, 4,309,155) and primers sets (Table S5).
Overexpression or knockdown of genes
Human E2F4 cDNA (1241 bp) expression vector was purchased from GeneCopoeia (Guangzhou, China), while USP2 cDNA (1818 bp) was kindly provided by Dr. Hong-Bing Shu (Wuhan University, Wuhan, China). Their truncations were obtained by PCR with primers (Table S6), and inserted into pCMV-HA (Addgene, 32,530; deposited by Christopher A Walsh) or pCMV-3Tag-1A (Stratagene, 240,195–51), respectively. Mutation of ubiquitination site within E2F4 was performed with GeneTailorTM Site-Directed Mutagenesis System (Invitrogen, 12,397–014) and primers (Table S6). Oligonucleotides specific for shRNAs against E2F4 or USP2 (Table S7) were inserted into lentiviral vector GV298 (Genechem Co., Ltd, GCD0316554). Single guide RNAs (sgRNAs, Table S7) targeting downstream region of ATG2A or ULK2 transcription start site were inserted into dCas9-BFP-KRAB (Addgene, 127,968; deposited by Martin Kampmann). The pEGFP-LC3 (21,073; deposited by Tamotsu Yoshimori) and pmRFP-LC3 (21,075; deposited by Tamotsu Yoshimori) constructs were obtained from Addgene. Stable cancer cells were established by screening with puromycin (Invitrogen, A1113803).
Rescue of target gene expression
To rescue gene expression altered by E2F4 knockdown, cancer cells were transfected with USP2 vector (Table S6). To restore target gene expression induced by overexpression of E2F4, shRNA specific for USP2 or dCas9i against ATG2A or ULK2 (Table S7) was transfected into cancer cells with Genesilencer Transfection Reagent (Gene Therapy Systems, Inc., T500750). Empty vector and scramble shRNA (sh-Scb) were applied as controls (Table S7).
Lentiviral packaging
Lentiviral vectors were co-transfected with packaging plasmids psPAX2 and pMD2.G (Addgene, 12,260,12,259; deposited by Didier Trono) into HEK293T cells. Infectious lentivirus was harvested at 36 and 60 h after transfection, and filtered through 0.45-μm PVDF filters (Invitrogen, STM2006). Recombinant lentivirus was concentrated 100-fold by ultracentrifugation (2 h at 120,000 g). Lentivirus-containing pellet was dissolved in phosphate-buffered saline (PBS; Sigma, P3813) and injected in mice within 48 h.
Fluorescence immunocytochemical staining
Cells were plated on coverslip, fixed with 4% paraformaldehyde, blocked with 5% milk for 1 h, and incubated with antibodies specific for E2F4 (Abcam Inc., ab264276; 1:100 dilution) or USP2 (Abcam Inc., ab66556; 1:100 dilution) at 4°C overnight. Then, coverslips were treated with Alexa Fluor 488 goat anti-rabbit IgG (Abcam Inc., ab150081; 1:1000 dilution) or Alexa Fluor 594 goat anti-rabbit IgG (Abcam Inc., ab150160; 1:1000 dilution), and stained with 4’,6-diamidino-2- phenylindole (DAPI, 300 nmol·L−1; Sigma, D9542). The images were photographed under a Nikon A1Si Laser Scanning Confocal Microscope (Nikon Instruments Inc, Japan).
Co-IP and mass spectrometry analysis
Co-IP assay was conducted as previously described [Citation63–66], with antibodies specific for E2F4 (ab264276), USP2 (ab66556), Flag (ab45766), or HA (ab9110) from Abcam Inc. The proteins bound on Pierce Protein A/G magnetic beads (Thermo Fisher Scientific Inc., 88,802) were recovered and detected by Western blot. Mass spectrometry for immunoprecipitated proteins or quantitative proteomics was undertaken at Wuhan Institute of Biotechnology (Wuhan, China) [Citation67]. Raw data were deposited to ProteomeXchange Consortium via iProX repository (identifer PXD029858).
Bimolecular fluorescence complementation (BiFC) assay
Human E2F4 cDNA (1241 bp) and USP2 cDNA (1818 bp) were inserted into BiFC vectors pBiFC-VC155 and pBiFC-VN173 (Addgene, 22,011, 22,010; deposited by Chang-Deng Hu), respectively (Table S6). Recombinant plasmids were co-transfected into cancer cells. Twenty-four hours later, cells were fixed with 4% paraformaldehyde, incubated with DAPI for 5 min, and observed and photographed under a confocal microscope (Nikon Instruments Inc), whose excitation and emission wavelengths were 488 and 500 nm, respectively.
Autophagy flux assay
The GFP-RFP-tagged LC3 (Addgene, 117,413; deposited by Noboru Mizushima) plasmid was used to monitor autophagy flux. Briefly, cancer cells were seeded on 24-well plates, and transfected with GFP-RFP-tagged LC3 reporter using Lipofectamine 2000 (Invitrogen, 11,668,027). Twenty-four hours later, cells were fixed with 4% paraformaldehyde and photogaphed under a fluorescence microscope, indicating autophagosomes (yellow puncta) or autolysosomes (red puncta), respectively [Citation68].
Transmission electron microscopy
Cancer cells were plated on 10-cm dishes, collected, and fixed with 2.5% glutaraldehyde. Then, cells were fixed with 1% osmic acid for 2–3 h, dehydrated, and embedded in paraffin. The 70-nm-thick sections were prepared and stained with uranyl acetate-lead citrate, while autophagic vacuoles were observed and photographed under a transmission electron microscopy (JEM1230, JEOL Ltd., Tokyo, Japan).
Measurement of intracellular zinc ions
Cells were seeded on coverslips, incubated with 2 mmol·L−1 cell-permeable zinc specific fluorophore FluoZin-3 (Invitrogen, F24195) at room temperature for 30 min, and treated with PBS at room temperature for 30 min, allowing intracellular activation of FluoZin-3. The distribution of FluoZin-3 was observed under a fluorescence microscopy, using 485/10 nm excitation and 535/25 nm emission filters. The intracellular zinc ion levels were measured using Amplite Colorimetric Zinc Ion Quantitation Kit (AAT Bioquest, AAT-19001).
FRET imaging
Cancer cells were transfected with eCALWY-4 construct (Addgene, 22,236; deposited by Maarten Merkx) for 48 h, and then cultured in a modified Krebs-HEPES bicarbonate (KB) buffer, including 132.5 mmol·L−1 NaCl, 3.6 mmol·L−1 KCl, 0.5 mmol·L−1 NaH2PO4, 0.5 mmol·L−1 MgSO4, 1.5 mmol·L−1 CaCl2, 10 mmol·L−1 HEPES, 2 mmol·L−1 NaHCO3, 3 mmol·L−1 glucose, pH 7.4. Cells were observed under a Nikon A1Si Laser Scanning Confocal Microscope (Nikon Instruments Inc., Japan) [Citation51], with excitation wavelengths of Cerulean and Citrine being 440 and 514 nm, respectively. To evaluate the range of zinc ion concentration, cells were perfused in sequence with KB buffer, 50 μmol·L−1 N,N,N’,N’-tetrakis(2-pyridinylmethyl)-1,2-ethanediamine (TPEN; Sigma, 616,394), 5 μmol·L−1 pyrithione (Sigma, 13,463–41-7), or 5 μmol·L−1 pyrithione plus 100 μmol·L−1 ZnCl2. Two hybrid detectors were used to detect fluorescence emission intensity at 460–500 and 520–560 nm. The concentration and distribution of zinc ions within cells were compared by false color fluorescence (citrine:cerulean) ratio.
Cell cycle assay
Cell cycle was assessed by flow cytometry. In brief, cells were collected and fixed by 70% ethanol overnight at 4°C. Then, cells were washed twice with PBS, digested by 200 μl of RNase (1 mg/ml; TaKaRa Bio. Inc., 740,505), and stained with 800 μl of propidium iodide (50 mg/ml; Sigma, P4170) at room temperature for 30 min.
Fluorescent ubiquitination-based cell cycle indicator (FUCCI)
The FUCCI reporters, pRetroX-G1-Red and pRetroX-SG2M-Cyan, were purchased from TaKaRa Bio. Inc. (631,463, 631,462). These vectors were transfected into cancer cells, and stable cells expressing FUCCI reporters were screened. After starvation overnight, cell cycles of cancer cells were observed under a Nikon A1Si Laser Scanning Confocal Microscope (Nikon Instruments Inc.).
In vitro cell viability, growth, migration, invasion assays
The MTT (Sigma, M5655) colorimetric [Citation69,Citation70], soft agar using 0.1% Noble agar (Sigma, 9002–18-0) [Citation66,Citation70–72], and matrigel (Sigma, E1270) invasion [Citation64–66,Citation69,Citation71–73] assays were carried out to measure the viability, growth, and invasiveness capabilities of cancer cells, respectively.
Organoid culture
Organoid culture was performed as previously described [Citation74]. Briefly, cancer tissues were cut into small 2 mm pieces, and homogenized with a teflon pestle in 1.5 ml tubes. Tissue homogenates were trypsinized in Trypsin-EDTA (Sigma, 59417C) for 3–4 min and incubated on ice. After centrifugation, pellets were resuspended and filtered through 70-μm cell strainers (BD Bioscience, 352,350). Single cell suspensions were mixed with cold 3D Matrigel matrix (10 µg/ml; Corning, 354,230). Organoids were cultured in 10-cm dishes with media containing 50% WNT3A (Sigma, H17001), 10% RSPO (R-spondin; Sigma, SRP3292), 10% NOG (noggin; Sigma, N17001), 10 mmol·L−1 nicotinamide (Sigma, N0636), 1 mmol·L−1 N-acetyl-L-cysteine (Sigma, A7250), 1 nmol·L−1 GAST (gastrin; Sigma, G9020), 200 ng·ml−1 FGF2/basic fibroblast growth factor (Sigma, F3685), 50 ng·ml−1 EGF/epidermal growth factor (Peprotech, GMP100-15), 1% B-27 (Gibco, 17,504,044), and 1% N2 (Gibco, 17,502,001).
In vivo growth and metastasis assays
All animal experiments were approved by the Animal Care Committee of Tongji Medical College (approval number: Y20080290), and performed according to NIH Guidelines for the Care and Use of Laboratory Animals. In vivo subcutaneous xenograft and tail vein metastasis experiments were performed in randomized four-week-old male BALB/c nude mice (National Rodent Seeds Center, Shanghai, China), with injection of 1 × 10⁶ and 1 × 10⁷ cancer cells, respectively. For in vivo therapeutic studies, one week after subcutaneous or tail vein injection of 5 × 10⁶ cancer cells, male BALB/c nude mice were blindly randomized and treated by tail vein injection of lentivirus-mediated shRNA (1 × 10⁷ plaque-forming units in 100 μl PBS) or intraperitoneal injection of emetine (10 mg/kg in 100 µl PBS every two days). Mice were recorded for tumor volume and survival time, and imaged using In-Vivo Xtreme II small animal imaging system (Bruker Corporation, Billerica, MA).
Immunohistochemistry
Immunohistochemical staining and quantitative evaluation were performed as previously described [Citation64,Citation65,Citation72,Citation75], with antibody specific for MKI67/Ki-67 (Santa Cruz Biotechnology, sc-23,900; 1:200 dilution) or PECAM1/CD31 (Arigo, ARG52748; 1:100 dilution).
Patient tissue samples
The Institutional Review Board of Tongji Medical College approved human tissue study (approval number: 2011-S085). All procedures were carried out in accordance with guidelines set forth by Declaration of Helsinki. Written informed consent was obtained from all patients. Cancer tissues and their adjacent normal tissues were obtained at surgery from patients suffering from gastric cancer at Union Hospital of Tongji medical College. Patients with a history of preoperative chemotherapy or radiotherapy were excluded. All fresh specimens were frozen in liquid nitrogen, validated by pathological diagnosis, and stored at −80°C until use.
Statistical analysis
All data were shown as mean ± standard deviation (SD). Cutoff values were determined by medium or average gene expression levels. Student’s t test, analysis of variance (ANOVA), and χ2 analysis were applied to compare difference in cancer cells or tissues. Statistical significance of overlap or expression correlation was determined by Fisher’s exact test and Pearson’s product-moment correlation analysis, respectively. Log-rank test was used to assess survival difference. All statistical tests were two-side.
Data availability
Public microarray datasets for analyzing association of gene expression with survival of cancer patients are available from Kaplan-Meier Plotter (http://kmplot.com), The Cancer Genome Atlas (TCGA, https://portal.gdc.cancer.gov), Gene Expression Omnibus (GEO) database (https://www. ncbi.nlm.nih.gov/geo/, accession number GSE24551 and GSE85047), or Therapeutically Applicable Research to Generate Effective Treatments (TARGET, https://software.Broad institute.org/cancer/cga/target) databases. The patients were divided into high or low groups by medium or average gene expression levels as cutoffs. The event status (dead or alive) and survival time of each patient in low or high groups were collected and subjected to generating Kaplan-Meier curves and statistical analysis using GraphPad 8.0 software (GraphPad Software, San Diego, CA). To screen potential transcription factors regulating gene expression, ChIP-X program was applied by inputting official target gene names and selecting organism as “human”. The resulting transcription factors and corresponding target genes were downloaded and ranked by target gene number. The UbPred program (http://www.ubpred.org) was applied for analyzing potential lysine residues for E2F4 ubiquitinylation by inputting amino acid sequence and selecting sites with scores above 0.9 (high confidence). In addition, DINES (https://www.genome.jp/tools/dinies/), a database based on drug and omics-scale protein data, was applied to predict potential interactions between drug molecules and target proteins by searching protein name, clicking “drug or target search” bottom, and selecting chemogenomic or pharmacogenomic approach. The resulting drug lists were further screened by score above 0.8. As a website for Gene Ontology browsing, AmiGO2 (http://amigo.geneontology.org/) was used to obtain a list of genes involved in deubiquitination process by searching pathway name and selecting parameters“Organism: Homo sapiens” and “Type: protein”. All remaining data are presented within the article and Supplementary Information Files, and available from the corresponding author upon request.
Supplemental Material
Download MS Word (76.5 MB)Acknowledgments
We are grateful for Dr. Hong-Bing Shu for providing vectors. This work was granted by the National Natural Science Foundation of China (81272779, 81372667, 81472363, 81402301, 81402408, 81572423, 81672500, 81773094, 81772967, 81874085, 81874066, 81802925, 81903011, 81903008, 82072801, 82173316), Fundamental Research Funds for the Central Universities (2019kfyRCPY032, 2012QN224, 2013ZHYX003, 01-18-530112, 01-18-530115), and Natural Science Foundation of Hubei Province (2014CFA012).
Disclosure statement
No potential conflict of interest was reported by the author(s).
Supplementary material
Supplemental data for this article can be accessed here.
Additional information
Funding
References
- Bray F, Ferlay J, Soerjomataram I, et al. Global cancer statistics 2018: GLOBOCAN estimates of incidence and mortality worldwide for 36 cancers in 185 countries. CA Cancer J Clin. 2018;68:394–424.
- Debnath J, Baehrecke EH, Kroemer G. Does autophagy contribute to cell death? Autophagy. 2005;1:66–74.
- Levine B, Kroemer G. Biological functions of autophagy genes: a disease perspective. Cell. 2019;176:11–42.
- Lock R, Kenific CM, Leidal AM, et al. Autophagy-dependent production of secreted factors facilitates oncogenic RAS-driven invasion. Cancer Discov. 2014;4:466–479.
- Qiang L, Zhao B, Ming M, et al. Regulation of cell proliferation and migration by p62 through stabilization of Twist1. Proc Natl Acad Sci USA. 2014;111:9241–9246.
- Akalay I, Janji B, Hasmim M, et al. Epithelial-to-mesenchymal transition and autophagy induction in breast carcinoma promote escape from T-cell-mediated lysis. Cancer Res. 2013;73:2418–2427.
- Lazova R, Camp RL, Klump V, et al. Punctate LC3B expression is a common feature of solid tumors and associated with proliferation, metastasis, and poor outcome. Clin Cancer Res. 2012;18:370–379.
- Lazova R, Klump V, Pawelek J. Autophagy in cutaneous malignant melanoma. J Cutan Pathol. 2010;37:256–268.
- Galavotti S, Bartesaghi S, Faccenda D, et al. The autophagy-associated factors DRAM1 and p62 regulate cell migration and invasion in glioblastoma stem cells. Oncogene. 2013;32:699–712.
- Garneau H, Paquin MC, Carrier JC, et al. E2F4 expression is required for cell cycle progression of normal intestinal crypt cells and colorectal cancer cells. J Cell Physiol. 2009;221:350–358.
- Moberg K, Starz MA, Lees JA. E2F-4 switches from p130 to p107 and pRB in response to cell cycle reentry. Mol Cell Biol. 1996;16:1436–1449.
- Lee EY, Cam H, Ziebold U, et al. E2F4 loss suppresses tumorigenesis in Rb mutant mice. Cancer Cell. 2002;2:463–472.
- Rakha EA, Pinder SE, Paish EC, et al. Expression of E2F-4 in invasive breast carcinomas is associated with poor prognosis. J Pathol. 2004;203:754–761.
- Cheng C, Varn FS, Marsit CJ. E2F4 program is predictive of progression and intravesical immunotherapy efficacy in bladder cancer. Mol Cancer Res. 2015;13:1316–1324.
- Lachmann A, Xu H, Krishnan J, et al. ChEA: transcription factor regulation inferred from integrating genome-wide ChIP-X experiments. Bioinformatics. 2010;26:2438–2444.
- O’Leary B, Finn RS, Turner NC. Treating cancer with selective CDK4/6 inhibitors. Nat Rev Clin Oncol. 2016;13:417–430.
- Gilbert LA, Horlbeck MA, Adamson B, et al. Genome-scale CRISPR-mediated control of gene repression and activation. Cell. 2014;159:647–661.
- Cherian MG, Jayasurya A, Bay BH. Metallothioneins in human tumors and potential roles in carcinogenesis. Mutat Res. 2003;533:201–209.
- Schellens JP, Vreeling-Sindelárová H, Plomp PJ, et al. Hepatic autophagy and intracellular ATP. A morphometric study. Exp Cell Res. 1988;177:103–108.
- Klionsky DJ, Abdel-Aziz AK, Abdelfatah S, et al. Guidelines for the use and interpretation of assays for monitoring autophagy (4th edition). Autophagy. 2021;17:1–382.
- Hateboer G, Kerkhoven RM, Shvarts A, et al. Degradation of E2F by the ubiquitin-proteasome pathway: regulation by retinoblastoma family proteins and adenovirus transforming proteins. Genes Dev. 1996;10:2960–2970.
- Wang CL, Wang JY, Liu ZY, et al. Ubiquitin-specific protease 2a stabilizes MDM4 and facilitates the p53-mediated intrinsic apoptotic pathway in glioblastoma. Carcinogenesis. 2014;35:1500–1509.
- Shan J, Zhao W, Gu W. Suppression of cancer cell growth by promoting cyclin D1 degradation. Mol Cell. 2009;36:469–476.
- Stevenson LF, Sparks A, Allende-Vega N, et al. The deubiquitinating enzyme USP2a regulates the p53 pathway by targeting Mdm2. EMBO J. 2007;26:976–986.
- Zhou H, Yuan M, Yu Q, et al. Autophagy regulation and its role in gastric cancer and colorectal cancer. Cancer Biomark. 2016;17:1–10.
- Mizushima N, Komatsu M. Autophagy: renovation of cells and tissues. Cell. 2011;147:728–741.
- Cuervo AM. Autophagy: in sickness and in health. Trends Cell Biol. 2004;14:70–77.
- Funderburk SF, Wang QJ, Yue Z. The Beclin 1-VPS34 complex-at the crossroads of autophagy and beyond. Trends Cell Biol. 2010;20:355–362.
- Liang XH, Jackson S, Seaman M, et al. Induction of autophagy and inhibition of tumorigenesis by beclin 1. Nature. 1999;402:672–676.
- Qu X, Yu J, Bhagat G, et al. Promotion of tumorigenesis by heterozygous disruption of the beclin 1 autophagy gene. J Clin Invest. 2003;112:1809–1820.
- Takamura A, Komatsu M, Hara T, et al. Autophagy-deficient mice develop multiple liver tumors. Genes Dev. 2011;25:795–800.
- Jo YK, Kim SC, Park IJ, et al. Increased expression of ATG10 in colorectal cancer is associated with lymphovascular invasion and lymph node metastasis. PLoS One. 2012;7:e52705.
- Deen NS, Huang SJ, Gong L, et al. The impact of autophagic processes on the intracellular fate of Helicobacter pylori: more tricks from an enigmatic pathogen? Autophagy. 2013;9:639–652.
- Qu B, Yao L, Ma HL, et al. Prognostic significance of autophagy-related proteins expression in resected human gastric adenocarcinoma. J Huazhong Univ Sci Technolog Med Sci. 2017;37:37–43.
- Ge J, Chen Z, Huang J, et al. Upregulation of autophagy-related gene-5 (ATG-5) is associated with chemoresistance in human gastric cancer. PLoS One. 2014;9:e110293.
- Velikkakath AKG, Nishimura T, Oita E, et al. Mammalian Atg2 proteins are essential for autophagosome formation and important for regulation of size and distribution of lipid droplets. Mol Biol Cell. 2012;23:896–909.
- Kim YH, Baek SH, Kim EK, et al. Uncoordinated 51-like kinase 2 signaling pathway regulates epithelial-mesenchymal transition in A549 lung cancer cells. FEBS Lett. 2016;590:1365–1374.
- Di Virgilio F, Adinolfi E. Extracellular purines, purinergic receptors and tumor growth. Oncogene. 2017;36:293–303.
- Follo C, Cheng Y, Richards WG, et al. Autophagy facilitates the release of immunogenic signals following chemotherapy in 3D models of mesothelioma. Mol Carcinog. 2019;58:1754–1769.
- Stagg J, Smyth MJ. Extracellular adenosine triphosphate and adenosine in cancer. Oncogene. 2010;29:5346–5358.
- Ledur PF, Villodre ES, Paulus R, et al. Extracellular ATP reduces tumor sphere growth and cancer stem cell population in glioblastoma cells. Purinergic Signal. 2012;8:39–48.
- Martin S, Dudek-Peric AM, Garg AD, et al. An autophagy-driven pathway of ATP secretion supports the aggressive phenotype of BRAF(V600E) inhibitor-resistant metastatic melanoma cells. Autophagy. 2017;13:1512–1527.
- Li WH, Qiu Y, Zhang HQ, et al. P2Y2 receptor promotes cell invasion and metastasis in prostate cancer cells. Br J Cancer. 2013;109:1666–1675.
- Biswas D, Qureshi OS, Lee WY, et al. ATP-induced autophagy is associated with rapid killing of intracellular mycobacteria within human monocytes/macrophages. BMC Immunol. 2008;9:35.
- Vallee BL, Falchuk KH. The biochemical basis of zinc physiology. Physiol Rev. 1993;73:79–118.
- Andreini C, Banci L, Bertini I, et al. Counting the zinc-proteins encoded in the human genome. J Proteome Res. 2006;5:196–201.
- Krizkova S, Ryvolova M, Hrabeta J, et al. Metallothioneins and zinc in cancer diagnosis and therapy. Drug Metab Rev. 2012;44:287–301.
- Margalit O, Simon AJ, Yakubov E, et al. Zinc supplementation augments in vivo antitumor effect of chemotherapy by restoring p53 function. Int J Cancer. 2012;131:E562–568.
- Pedersen M, Larsen A, Stoltenberg M, et al. The role of metallothionein in oncogenesis and cancer prognosis. Prog Histochem Cytochem. 2009;44:29–64.
- Cho YH, Lee SH, Lee SJ, et al. A role of metallothionein-3 in radiation-induced autophagy in glioma cells. Sci Rep. 2020;10:2015.
- Vinkenborg JL, Nicolson TJ, Bellomo EA, et al. Genetically encoded FRET sensors to monitor intracellular Zn2+ homeostasis. Nat Methods. 2009;6:737–740.
- Shi Y, Solomon LR, Pereda-Lopez A, et al. Ubiquitin-specific cysteine protease 2a (USP2a) regulates the stability of Aurora-A. J Biol Chem. 2011;286:38960–38968.
- Mahul-Mellier AL, Pazarentzos E, Datler C, et al. De-ubiquitinating protease USP2a targets RIP1 and TRAF2 to mediate cell death by TNF. Cell Death Differ. 2012;19:891–899.
- Liu Z, Zanata SM, Kim J, et al. The ubiquitin-specific protease USP2a prevents endocytosis-mediated EGFR degradation. Oncogene. 2013;32:1660–1669.
- Kim J, Kim WJ, Liu Z, et al. The ubiquitin-specific protease USP2a enhances tumor progression by targeting cyclin A1 in bladder cancer. Cell Cycle. 2012;11:1123–1130.
- Priolo C, Tang D, Brahamandan M, et al. The isopeptidase USP2a protects human prostate cancer from apoptosis. Cancer Res. 2006;66:8625–8632.
- Qu Q, Mao Y, Xiao G, et al. USP2 promotes cell migration and invasion in triple negative breast cancer cell lines. Tumor Biol. 2015;36:5415–5423.
- Savarino A, Lucia MB, Giordano F, et al. Risks and benefits of chloroquine use in anticancer strategies. Lancet Oncol. 2006;7:792–793.
- Thorburn A. Apoptosis and autophagy: regulatory connections between two supposedly different processes. Apoptosis. 2008;13:1–9.
- Moller M, Herzer K, Wenger T, et al. The alkaloid emetine as a promising agent for the induction and enhancement of drug-induced apoptosis in leukemia cells. Oncol Rep. 2007;18:737–744.
- Kim JH, Cho EB, Lee J, et al. Emetine inhibits migration and invasion of human non-small-cell lung cancer cells via regulation of ERK and p38 signaling pathways. Chem Biol Interact. 2015;242:25–33.
- Sun Q, Yogosawa S, Iizumi Y, et al. The alkaloid emetine sensitizes ovarian carcinoma cells to cisplatin through downregulation of bcl-xL. Int J Oncol. 2015;46:389–394.
- Jiang G, Zheng L, Pu J, et al. Small RNAs targeting transcription start site induce heparanase silencing through interference with transcription initiation in human cancer cells. PLoS One. 2012;7:e31379.
- Fang E, Wang X, Wang J, et al. Therapeutic targeting of YY1/MZF1 axis by MZF1-uPEP inhibits aerobic glycolysis and neuroblastoma progression. Theranostics. 2020;10:1555–1571.
- Li H, Yang F, Hu A, et al. Therapeutic targeting of circ-CUX1/EWSR1/MAZ axis inhibits glycolysis and neuroblastoma progression. EMBO Mol Med. 2019;11:e10835.
- Fang E, Wang X, Yang F, et al. Therapeutic targeting of MZF1-AS1/PARP1/E2F1 axis inhibits proline synthesis and neuroblastoma progression. Adv Sci. 2019;6:1900581.
- Chen Y, Yang F, Fang E, et al. Circular RNA circAGO2 drives cancer progression through facilitating HuR-repressed functions of AGO2-miRNA complexes. Cell Death Differ. 2019;26:1346–1364.
- Zhang Z, Singh R, Aschner M. Methods for the detection of autophagy in mammalian cells. Curr Protoc Toxicol. 2016;69:20.12.21–20.12.26.
- Li D, Mei H, Pu J, et al. Intelectin 1 suppresses the growth, invasion and metastasis of neuroblastoma cells through up-regulation of N-myc downstream regulated gene 2. Mol Cancer. 2015;14:47.
- Qu H, Zheng L, Pu J, et al. miRNA-558 promotes tumorigenesis and aggressiveness of neuroblastoma cells through activating the transcription of heparanase. Hum Mol Genet. 2015;24:2539–2551.
- Zhao X, Li D, Pu J, et al. CTCF cooperates with noncoding RNA MYCNOS to promote neuroblastoma progression through facilitating MYCN expression. Oncogene. 2016;35:3565–3576.
- Li D, Song H, Mei H, et al. Armadillo repeat containing 12 promotes neuroblastoma progression through interaction with retinoblastoma binding protein 4. Nat Commun. 2018;9:2829.
- Zheng L, Qi T, Yang D, et al. microRNA-9 suppresses the proliferation, invasion and metastasis of gastric cancer cells through targeting cyclin D1 and Ets1. PLoS One. 2013;8:e55719.
- Seidlitz T, Merker SR, Rothe A, et al. Human gastric cancer modelling using organoids. Gut. 2019;68:207–217.
- Jiao W, Chen Y, Song H, et al. HPSE enhancer RNA promotes cancer progression through driving chromatin looping and regulating hnRNPU/p300/EGR1/HPSE axis. Oncogene. 2018;37:2728–2745.