
ABSTRACT
Parkinson disease (PD) is a neurodegenerative disorder characterized by the abnormal intracellular accumulation of SNCA/α-synuclein. While the exact mechanisms underlying SNCA pathology are not fully understood, increasing evidence suggests the involvement of autophagy as well as lysosomal deficiencies. Because CTSD (cathepsin D) has been proposed to be the major lysosomal protease involved in SNCA degradation, its deficiency has been linked to the presence of insoluble SNCA conformers in the brain of mice and humans as well as to the transcellular transmission of SNCA aggregates. We here postulate that SNCA degradation can be enhanced by the application of the recombinant human proform of CTSD (rHsCTSD). Our results reveal that rHsCTSD is efficiently endocytosed by neuronal cells, correctly targeted to lysosomes and matured to an enzymatically active protease. In dopaminergic neurons derived from induced pluripotent stem cells (iPSC) of PD patients harboring the A53T mutation within the SNCA gene, we confirm the reduction of insoluble SNCA after treatment with rHsCTSD. Moreover, we demonstrate a decrease of pathological SNCA conformers in the brain and within primary neurons of a ctsd-deficient mouse model after dosing with rHsCTSD. Boosting lysosomal CTSD activity not only enhanced SNCA clearance in human and murine neurons as well as tissue, but also restored endo-lysosome and autophagy function. Our findings indicate that CTSD is critical for SNCA clearance and function. Thus, enzyme replacement strategies utilizing CTSD may also be of therapeutic interest for the treatment of PD and other synucleinopathies aiming to decrease the SNCA burden.
Abbreviations: aa: amino acid; SNCA/α-synuclein: synuclein alpha; APP: amyloid beta precursor protein; BBB: blood brain barrier; BF: basal forebrain; CBB: Coomassie Brilliant Blue; CLN: neuronal ceroid lipofuscinosis; CNL10: neuronal ceroid lipofuscinosis type 10; Corr.: corrected; CTSD: cathepsin D; CTSB: cathepsin B; DA: dopaminergic; DA-iPSn: induced pluripotent stem cell-derived dopaminergic neurons; dox: doxycycline; ERT: enzyme replacement therapy; Fx: fornix, GBA/β-glucocerebrosidase: glucosylceramidase beta; h: hour; HC: hippocampus; HT: hypothalamus; i.c.: intracranially; IF: immunofluorescence; iPSC: induced pluripotent stem cell; KO: knockout; LAMP1: lysosomal associated membrane protein 1; LSDs: lysosomal storage disorders; MAPT: microtubule associated protein tau; M6P: mannose-6-phosphate; M6PR: mannose-6-phosphate receptor; MB: midbrain; mCTSD: mature form of CTSD; neurofil.: neurofilament; PD: Parkinson disease; proCTSD: proform of CTSD; PRNP: prion protein; RFU: relative fluorescence units; rHsCTSD: recombinant human proCTSD; SAPC: Saposin C; SIM: structured illumination microscopy; T-insol: Triton-insoluble; T-sol: Triton-soluble; TEM: transmission electron microscopy, TH: tyrosine hydroxylase; Thal: thalamus
Introduction
Parkinson disease (PD) is the second most common age-related neurodegenerative disorder. The pathological hallmark of PD is the intracellular accumulation of the presynaptic protein SNCA/α-synuclein within Lewy bodies and neurites in the form of insoluble inclusions [Citation1]. The pathogenesis of PD involves a complex interplay between genetics and environmental factors [Citation2]. Although most PD cases are idiopathic [Citation3], a number of genetic risk factors have been described [Citation4,Citation5]. Early-onset familial cases of PD can arise from variants within the SNCA gene. Point mutations in SNCA, such as A53T, A30P [Citation6,Citation7] as well as genomic duplications or triplications [Citation8,Citation9], have clearly linked SNCA accumulation to PD etiology. Interestingly, several lysosomal proteins and pathways have also emerged as risk factors for PD [Citation10,Citation11], including lysosomal transporter ATP13A2 [Citation12,Citation13] and TMEM175 [Citation5], as well as the lysosomal enzymes CTSD (cathepsin D) [Citation14] and CTSB (cathepsin B) [Citation15]. Moreover, mutations in GBA/GBA1 (glucosylceramidase beta) represent one of the highest risk factors for developing PD [Citation16,Citation17]. A recent genome-wide association study/GWAS identified and validated further genetic loci, correlating components from the autophagy-lysosomal pathway to PD [Citation15]. Another broad genomic screening of PD patients revealed a large number of variants within genes related to lysosomal storage disorder (LSD) [Citation14], further highlighting the importance of lysosomal disturbances in PD pathogenesis.
Through their fusion with endocytic and autophagic structures, lysosomes act as principal site for protein degradation [Citation18,Citation19] and are responsible for the depletion of cytoplasmic components, including misfolded and aggregated proteins [Citation20]. Based on the delivery to the lysosome, at least three types of autophagy mechanisms can be distinguished: microautophagy, macroautophagy, and chaperone-mediated autophagy (CMA) [Citation21]. Of these, macroautophagy and CMA are the main degradation pathways for SNCA [Citation22–26]. Macroautophagy involves the encapsulation of organelles and cytosolic macromolecules, generating autophagic vacuoles that fuse with the lysosome, whereas CMA selectively degrades proteins bearing a specific pentapeptide motif recognized by a complex of chaperones, thereby helping the substrate crossing the lysosomal membrane directly to the lysosomal lumen [Citation27]. Once inside the lysosome, an array of lysosomal proteases, including cathepsins, are responsible for the hydrolysis of proteins [Citation19,Citation28]. Several findings suggest that the proteasomal system also regulates SNCA levels by preferentially clearing its soluble forms, whereas aggregated SNCA is preferentially eliminated by macroautophagy/autophagy pathways [Citation24,Citation26,Citation27,Citation29,Citation30].
CTSD is an aspartyl protease that is widely distributed in all mammalian cells and is particularly abundant in the brain [Citation28]. The enzyme is synthesized as an inactive pro-enzyme of 412 amino acids (aa). Following the removal of the N-terminal signal peptide within the endoplasmic reticulum, the inactive ~52-kDa proCTSD gets glycosylated and transported to the Golgi apparatus. The pro-enzyme is further trafficked to the lysosome via M6PR (mannose-6-phosphate receptor)-dependent [Citation31] or M6PR-independent pathways [Citation32,Citation33]. An acidic environment is essential for the subsequent proteolytic processing of proCTSD to mature CTSD: the low pH of endosomes dissociates the proCTSD from the receptors and subsequently the pro-peptide is removed, generating an active single chain of ~48 kDa [Citation34]. This single chain form is further processed into a two domain mature enzyme, comprising a heavy (~34-kDa) and light (~14-kDa) chain that remain non-covalently associated [Citation34].
Mutations in the CTSD gene underlie the congenital form of neuronal ceroid lipofuscinosis-10 (CNL10), an LSD hallmarked by an early-onset progressive neurodegeneration [Citation35]. The severe phenotype of the ctsd-deficient mouse model, a murine pre-clinical model of CLN10, is characterized by blindness, seizures, neurodegeneration and premature death, further providing evidence for the crucial function of CTSD in the brain [Citation36–38]. Interestingly, accumulation of SNCA and neurodegeneration are common features observed in many LSDs, indicating an overlap in the pathogenesis of LSDs and PD [Citation39,Citation40]. Recent studies in cellular and animal models implicate CTSD as a direct mediator of SNCA proteolysis [Citation41–43]. Moreover, a partial or total deficiency of CTSD has been associated with cell-to-cell propagation of SNCA aggregates in vitro and intracellular SNCA inclusions in the brain of mammals [Citation44,Citation45]. Conversely, restoration of CTSD corrects lysosomal function [Citation46,Citation47] and protects against SNCA aggregation and toxicity after restoration of the enzyme [Citation48].
In light of the importance of the cellular degradation in PD etiology and the convergence of pathogenic pathways with LSDs, several treatment strategies for LSDs that implicate boosting lysosomal function are now under consideration and tested as therapeutic strategies for PD [Citation40,Citation49].
This includes compounds that promote activity or trafficking of the lysosomal enzyme GBA (e.g., LTI-291, LNK-754) [Citation50–52] and small molecules that reduce the synthesis of glucosylceramide (e.g., venglustat), the substrate of GBA, which can reduce SNCA pathology in PD patient iPSC-derived neuronal cultures and in vivo [Citation52–55].
Enzyme replacement therapy (ERT) remains one of the most successful treatment strategies of LSDs, which aims to restore lysosomal enzyme activity, thereby decreasing lysosomal substrates and improving clinical symptoms of the disease [Citation56]. Recently, it has been demonstrated that the administration of recombinant human proCTSD (rHsCTSD) can attenuate inflammation, correct autophagic flux and clear accumulated storage material in a CLN10 mouse model [Citation47]. Moreover, application of CTSD by intracranial injection, which bypasses the blood-brain barrier (BBB) and allows direct targeting to neuronal cells, delays the onset of neurological symptoms and increases the lifespan in ctsd-deficient mice [Citation47].
In this study, we examine whether exogenous application of rHsCTSD can decrease SNCA levels in preclinical synucleinopathy models, including an SNCA overexpressing cell line and dopaminergic neurons generated from induced pluripotent stem cells (iPSC) of PD patients (A53T SNCA mutation). In all systems, rHsCTSD was converted to an enzymatically active enzyme, able to enhance clearance of pathological SNCA conformers further improving intracellular function. Moreover, we confirm the positive effect of rHsCTSD on SNCA clearance in vivo by analyzing brain tissue and primary neurons of ctsd-deficient mice.
Our data provide evidence in cells and in vivo that the application of rHsCTSD stimulates SNCA turnover and restores lysosomal and autophagy function, suggesting a potential therapeutic strategy for patients harboring SNCA aggregation pathologies.
Results
Endocytosis, maturation and enzymatic activity of rHsCTSD in CTSD-deficient H4 cells
To confirm efficient endocytosis of the recombinant pro-enzyme (rHsCTSD), CTSD-deficient H4 neuroglioma cells (H4 CTSD knockout [KO]) were treated with the enzyme, which was produced as described in Marques et al. [Citation47]. The purified proform of the enzyme (~52-kDa; see cartoon Figure S1A) was detected by SDS-PAGE and assayed for CTSD activity (Figure S1B, S1C). After auto-activation at pH 4.5, the enzymatic activity of rHsCTSD was significantly higher compared to the enzyme after addition of pepstatin A (PepA), an aspartic protease inhibitor (Figure S1C).
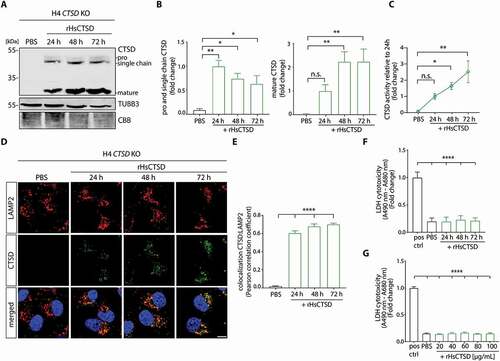
We next examined, if rHsCTSD was endocytosed and processed by cells in a time-dependent manner. H4 CTSD KO cells were cultured with 20 µg/ml of rHsCTSD for 0.5 to 72 h. After 0.5 h of incubation, we found that the enzyme was taken up by the cells (Figure S1D) and after 6 h to 8 h, the mature form, depicted by the presence of the heavy chain (~34-kDa), was first detected (Figure S1D). This indicates that the recombinant enzyme underwent endocytosis and proteolytic maturation within the cells. Also, increasing presence of catalytically active single chain and mature CTSD was observed over time after application of the enzyme (Figure S1D, S1E; ). Moreover, we determined the enzymatic activity of rHsCTSD in cell lysates utilizing a fluorogenic peptide cleavage assay. In line with elevated mature CTSD levels as detected by immunoblotting, we determined significant augmentation in the catalytic activity of the enzyme, that steadily increased over time (). Since lysosomal localization is a prerequisite for optimal enzymatic activity, we analyzed rHsCTSD cellular uptake and localization by lysosomal enrichment and immunofluorescence (IF) microscopy. IF analysis revealed a distinct colocalization of CTSD (green) with the lysosomal marker LAMP2 (lysosomal associated membrane protein 2; red), suggesting a successful delivery of rHsCTSD to the lysosome () Enrichment of lysosomes via a sequential centrifugation protocol revealed the presence and activity of the recombinant enzyme within the degradative organelle (Figure S1F, S1G). Moreover, in vitro cytotoxicity assays did not detect any toxicity or induction of apoptosis after rHsCTSD administration at any time point () or rHsCTSD concentration (up to 100 µg/ml; ‒S1H), as measured by release of LDH (lactate dehydrogenase; ) or AK (adenylate kinase; ToxiLight assay; Figure S1H) into the media, or the presence of cleaved pro-apoptotic CASP3 (caspase 3; Figure S1I).
Figure 1. H4 cells deficient in CTSD (CTSD KO) endocytose and process extracellularly applied rHsCTSD. (A) Representative western blot and (B) quantification of CTSD signal in H4 CTSD KO cells treated with 20 µg/ml rHsCTSD for 24, 48 and 72 h. PBS was added to the media as an untreated control. Mature CTSD (~34-kDa) as well as pro- (~52-kDa) and single chain forms (~48-kDa) were normalized to loading control TUBB3 and expressed as fold change toward the 24h time point (n = 3). For a graphical overview of CTSD maturation and protein sizes refer to Figure S1A. As additional loading control, Coomassie Brilliant Blue (CBB)-stained SDS-PAGE gel was included to visualize equal protein input. (C) Fluorogenic CTSD activity assay from cell lysates analyzed immediately after harvesting. CTSD activity was normalized to the 24 h time point and expressed as fold change (n = 3). (D) Immunostaining of lysosomal marker LAMP2 (red) and CTSD (green) of control (PBS) and rHsCTSD treated H4 CTSD KO cells, representative pictures for three independent rounds of treatment. Scale bar: 10 µm. (E) Colocalization analysis of LAMP2 and CTSD determined by Pearson’s correlation coefficient and compared to PBS (n = 9–12 individual cells per group). (F) LDH cytotoxicity assay of H4 CTSD KO cells incubated with 20 µg/ml rHsCTSD for different time points and (G) with different concentrations for 72 h normalized to the positive control and expressed as fold change (n = 3). All data represent mean ± SEM. Statistical analyses were performed by using one-way ANOVA together with Dunnett’s multiple comparison test. Statistical differences are shown toward PBS treatment for (B, C and E) and toward positive control for LDH cytotoxicity assay (F and G). ****p < 0.0001, **p < 0.01, *p < 0.05; n.s., not significant.
Together, our results demonstrate that recombinant proCTSD is endocytosed by H4 neuroglioma cells and delivered to the lysosome, where it follows a regular maturation process and becomes enzymatically active without inducing toxicity.
rHsCTSD treatment decreases SNCA/α-synuclein in H4 cells
The lysosomal enzyme CTSD has been implicated in SNCA proteolysis and its deficiency promotes SNCA aggregation both in cell-based systems and in vivo [Citation42,Citation44,Citation45,Citation48]. In line with these previous findings, in vitro incubation of recombinant SNCA with rHsCTSD resulted in multiple degradation products of lower molecular weight at lysosomal pH 4.5 in comparison to neutral pH, indicating the ability of the recombinant enzyme to process SNCA under lysosomal conditions (Figure S2A). Moreover, SNCA assembly states appeared to have an impact on the proteolytic capacity of CTSD. Monomeric and oligomeric SNCA were more prone to CTSD degradation than SNCA fibrils under in vitro conditions (Figure S2B). This was additionally confirmed by transmission electron microscopic (TEM) images revealing residual SNCA fibrils after 24 h incubation with rHsCTSD similar to the non-degraded fibril, suggesting an increased resistance of the fibril to CTSD proteolysis (Figure S2C).
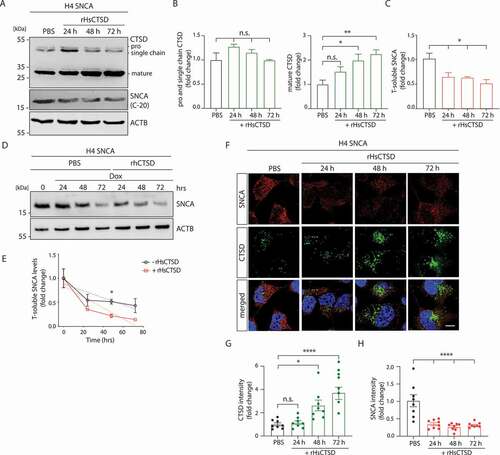
Using an established doxycycline (dox)-inducible (tet-off) H4 neuroglioma cell line with SNCA overexpression (named H4 SNCA in the following) [Citation57,Citation58], we studied the effect on SNCA turnover after exogenous application of rHsCTSD. Enzyme treatment of cells was carried out by incubation with 20 µg/ml of rHsCTSD for 24, 48 and 72 h. Immunoblot analyses revealed that while H4 SNCA cells harbour endogenous levels of CTSD, the protein level of pro- (~52-kDa) and single chain (~48-kDa) forms of CTSD still increased after 24 h of rHsCTSD treatment (). After 48 h, the single chain form of CTSD returned to endogenous protein levels () due to proteolytic events that lead to the maturation of CTSD within the endocytic pathway. The amount of mature CTSD (~34-kDa) almost doubled after 48 and 72 h of treatment (). Also, in this SNCA overexpressing cell line, rHsCTSD treatment did not result in any cytotoxic or apoptotic event even with increasing enzyme concentrations up to 5-times of the utilized amount (100 µg/ml) (Figure S2D-S2F). Concomitant to the increase of mature CTSD level, application of rHsCTSD to H4 cells led to a significant reduction of SNCA after 24 h (). To more clearly define the time-dependent effect of rHsCTSD on the SNCA degradation rate, SNCA expression was turned off by adding doxycycline (Dox) (). We observed that SNCA degradation was significantly enhanced when cells were additionally treated with rHsCTSD (). The proteolytic function of CTSD on SNCA clearance in the H4 cell model was further analyzed by IF microscopy utilizing the LB509 antibody, which is able to detect pathology-associated SNCA conformers [Citation1] (). In line with the immunoblot analysis, we observed significantly increased CTSD levels after 48 h of incubation with the recombinant enzyme as compared to non-treated cells (). A significant (~50%) reduction of SNCA was detected after 24 h of rHsCTSD treatment (). Additionally, treatment of rHsCTSD together with the combined serine and cysteine protease inhibitor leupeptin resulted in a comparable decrease of SNCA as indicated by utilizing two different SNCA antibodies (C-20 and syn-1) in immunoblot analysis (Figure S2G, S2H). As expected, also saposin C (SAPC), a typical substrate of CTSD [Citation59,Citation60], was specifically reduced by ~20% after treatment with rHsCTSD, also in the addition of leupeptin (Figures S2G-S2H). Collectively, these data suggest that the exogenously applied rHsCTSD can induce a significant and time-dependent reduction of SNCA in H4 neuroglioma cells without causing cell toxicity.
Figure 2. rHsCTSD treatment decreases SNCA in H4 cells overexpressing SNCA (tet-off). (A) Representative immunoblot of H4 cell lysates treated with 20 µg/ml rHsCTSD for 24, 48 and 72 h. The western blot was stained for CTSD (proform ~52-kDa, single chain form ~48-kDa and mature form ~34-kDa) and SNCA utilizing the C-20 SNCA antibody. ACTB was used as loading control. (B) Quantification of immature (pro- and single chain form) and mature CTSD, normalized to ACTB (n = 3), expressed as fold change. (C) Quantification of soluble SNCA normalized to ACTB and compared to PBS treated sample (n = 3). (D) Kinetics of soluble SNCA degradation in H4 cells shown in representative immunoblot. SNCA expression was downregulated by 2 µg/ml doxycycline (Dox) in cells additionally treated with PBS (-rHsCTSD, black) or with 20 µg/ml rHsCTSD (+rHsCTSD, red) for 24, 48 and 72 h. (E) Respective analysis of SNCA levels from three individual experiments (n = 3), normalized to ACTB (slope −0.007234 ± 0.002833 for PBS; −0.01128 ± 0.003974 for +rHsCTSD). (F) Representative immunofluorescence pictures of H4 cells treated with rHsCTSD. H4 cells were stained with antibodies against SNCA (LB509; red) and CTSD (green). Scale bar: 10 µm. Quantification of (G) CTSD signal intensities and of (H) SNCA signal intensities, expressed as fold change (n = 8 individual cells per group). Data represent mean ± SEM. Statistical analyses were performed by using one-way ANOVA together with a Dunnett’s multiple comparison test with statistical differences tested to PBS treatment (B, C, G and H). For (E) two-tailed unpaired Student’s t-tests were performed at each time point . ****p < 0.0001, **p < 0.01, *p< 0.05; n.s., not significant.
rHsCTSD treatment enhances lysosomal and autophagy function in H4 cells
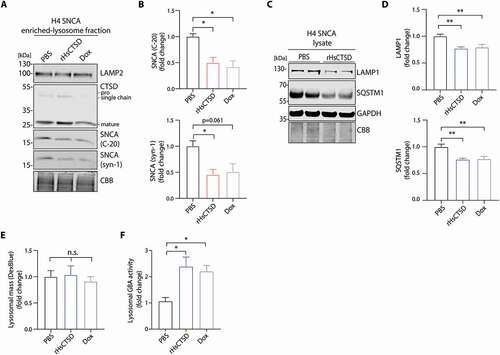
Since pathology-associated SNCA has been described to be mainly degraded by the autophagic- and lysosomal pathways and CTSD achieves its full proteolytic function in the lysosome, we analyzed the effects of rHsCTSD treatment on lysosomal turnover and autophagy function. For this, lysosomal fractions of H4 SNCA cells were enriched by applying gradual centrifugation. Western blot analyses of lysosome-enriched samples revealed LAMP2-positive signals and an increase in the mature form of CTSD, as well as a decrease of lysosomal SNCA after treatment with rHsCTSD for 72 h (). Simultaneously, SNCA level decreased and reached similar levels as doxycycline (dox)-treated controls (depletion of SNCA expression), as complementarily confirmed by immunoblots against SNCA (‒3B). Further, we observed an SNCA-dependent increase in the lysosomal membrane protein LAMP1 and the autophagy marker SQSTM1 (sequestosome 1) ( and S3), indicating dysfunctions of the lysosomal and autophagosomal system [Citation61,Citation62]. Importantly, application of rHsCTSD could reverse these effects and decrease LAMP1 and SQSTM1 protein to the levels of low SNCA conditions (dox-treated) (; for dox-treatment see Figure S3). Total lysosomal mass (number and/or size of lysosomes) measured by a Dextran-Cascade Blue staining was not affected by SNCA overexpression or rHsCTSD treatment in the H4 cell system (). Importantly, treatment with the recombinant enzyme resulted in a rescue of lysosomal GBA activity (). GBA activity was drastically reduced under high SNCA conditions (PBS) and restored to levels detected for low SNCA conditions (dox-treated) (). Altogether, our data indicate that exogenous treatment with rHsCTSD decreases lysosomal SNCA and improves lysosomal and autophagy function in a SNCA overexpressing H4 cell line. Moreover, by comparing H4 SNCA cells (high SNCA levels) and dox-treated cells (low SNCA levels), the beneficial effect of rHsCTSD on SNCA clearance is comparable to conditional down regulation of SNCA.
Figure 3. rHsCTSD treatment decreases lysosomal SNCA and improves endo-lysosomal and autophagic system in SNCA overexpressing H4 cells. (A) Representative immunoblot of lysosomal fractions enriched from H4 cells overexpressing SNCA (tet-off). Cells were incubated with PBS, 20 µg/mL rHsCTSD or Dox for 72 h. Western blot shows LAMP2 signal and CTSD signal with pro and single chain forms (~52-kDa and ~48-kDa) as well as mature form (~34-kDa). (B) SNCA signals were detected and quantified using SNCA antibodies C-20 (top) and syn-1 (bottom). CBB-stained SDS-PAGE gel was used as protein loading control and the corresponding quantification is expressed as fold change (n =3). (C) Immunoblot of H4 SNCA cells incubated with PBS or 20 µg/ml rHsCTSD. Antibodies against lysosomal and autophagic marker LAMP1 and SQSTM1 were utilized. As loading controls GAPDH and CBB-stained SDS-PAGE gel were used. (D) Signal intensities of LAMP1 (top) and SQSTM1 (bottom) were normalized to GAPDH signals and expressed as fold change (n = 5). Representative western blot of PBS or Dox treated H4 SNCA cells is shown in Figure S3. (E) Quantification of lysosomal mass by Dextran-Cascade Blue staining, normalized to overall cell stain (Celltag700) and expressed as fold change (n = 4). (F) Lysosomal GBA activity was determined in H4 cells overexpressing SNCA after incubation with PBS, 20 µg/mL rHsCTSD or Dox for 72 h (n = 3). All data represent mean ± SEM. Statistical analyses were performed by using one-way ANOVA together with Dunnett’s multiple comparison test (B, D-F). Statistical differences are shown toward PBS treatment. **p < 0.01, *p < 0.05; n.s., not significant.
rHsCTSD treatment decreases pathological SNCA/α-synuclein in iPSC-dopaminergic neurons from PD patients
We next sought to determine whether rHsCTSD can reduce pathological SNCA that naturally accumulates due to endogenous mutations using iPSC-derived DA neuronal cultures derived from PD patients. Neurons were generated from a previously established and extensively characterized iPSC line that harbors the A53T mutation within the SNCA together with its isogenic control A53T corrected (A53T corr.) [Citation50,Citation63]. We verified the successful differentiation of iPSCs to DA neurons by immunofluorescence studies using the DA marker TH (tyrosine hydroxylase) that also co-localized with SNCA (Figure S4A).
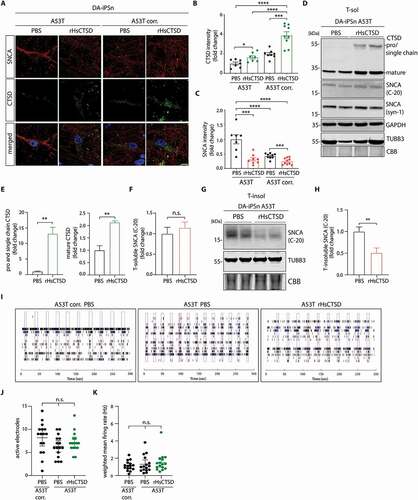
To elucidate the effect of exogenously applied rHsCTSD in SNCA clearance, iPSC-derived dopaminergic neurons (DA-iPSn) were treated with 10 µg/ml of rHsCTSD for 21–25 days with replacement of the enzyme together with medium change every 4 days, followed by IF and immunoblotting analyses. Importantly, treatment with 10 µg/ml rHsCTSD did not induce neurotoxic effects as indicated by an LDH-assay (Figure S4B), unchanged neurofilament levels (Figure S4C) that would detect shrinkage of cells in early cell death state, and absence of pro-apoptotic cleaved CASP3 (Figure S4D). For microscopy analyses, DA-iPSn (A53T and A53T corr.) were stained with the anti-SNCA (LB509; red) and anti-CTSD (green) antibodies. Treatment with rHsCTSD showed increased signals of CTSD throughout the cell body of the neurons (), indicating that rHsCTSD was endocytosed. Importantly, SNCA signal intensity was reduced to half in the rHsCTSD-treated A53T DA-iPSn compared to the non-treated PD neurons (). Interestingly, the mutant iPSC line (A53T) treated with the recombinant enzyme exhibited similar CTSD and SNCA levels as compared to the non-treated, isogenic control (A53T corr.; ). Remarkably, corrected DA-iPSn that received exogenous CTSD exhibited the highest staining intensity for CTSD, which was also significantly higher than the non-treated mutant line (‒4B). We also analyzed CTSD uptake by immunoblot, where rHsCTSD-treated A53T neurons presented a significant increase in proform/single chain and mature CTSD, respectively (), indicating that DA neurons are able to endocytose and correctly process rHsCTSD. While there was no change in Triton-soluble (T-sol) SNCA (; analysis C-20 antibody: ; analysis Syn-1 antibody: Figure S4E), we found a significant reduction of insoluble SNCA () after treatment with rHsCTSD, confirming the IF data ().Full western blots exhibited no high molecular weight SNCA form in denaturing immunoblot analysis (Figures S4F, S4G). The same type of immunoblot analyses were performed in the A53T corr. line exhibiting very low levels of soluble SNCA, efficient rHsCTSD uptake and enzyme maturation (Figures S4H, S4I). Noteworthy, Triton-insoluble SNCA conformers were completely absent in the isogenic control cell line (A53T corr.; Figure S4J). We further characterized the neurophysiological activity of the A53T mutant and A53T corr. DA-iPSn lines using a multielectrode array (MEA). Both cell lines were spontaneously active and were able to generate repetitive network bursts (). Also, the number of active electrodes and weighted mean firing rate were similar between A53T corr. and A53T mutant stayed constant after two weeks of rHsCTSD treatment (). This indicates that the rHsCTSD treatment does not change the electrophysiological properties of neurons within this time frame. Importantly, both here tested electrophysiological parameters were unchanged for all DA-iPS lines preceding rHsCTSD treatment (Figures S4K, S4L).
Figure 4. rHsCTSD treatment decreases pathology-associated SNCA in PD patients iPS-derived dopaminergic neurons (DA-iPSn) harboring an SNCA mutation (A53T). (A) Representative immunofluorescence pictures of A53T DA-iPSn and isogenic control (A53T corr.) treated with PBS or rHsCTSD. Pathology-associated SNCA was stained with LB509 antibody (red) and CTSD (green). Scale bar: 10 µm. (B) Quantification of CTSD and (C) SNCA signal intensities determined by confocal microscopy were indicated as fold change (n = 7–10 individual neurons per group). (D) Immunoblot of Triton-soluble (T-sol) lysates of DA-iPSn A53T treated with 10 µg/ml of rHsCTSD for 3.5 weeks, representative for three individual rounds of enzyme treatment. Western blot was stained for CTSD (pro- and single chain enzyme (~52- and ~48-kDa) and mature form at (~34-kDa)). SNCA signal was detected by C-20 and syn-1 antibodies. GAPDH, TUBB3 and CBB-stained SDS-PAGE gels are shown to validate equal loading. (E) Quantification of pro-/single chain CTSD and mature CTSD signal was normalized to GAPDH and shown as fold change (n = 3). (F) Quantification of soluble SNCA levels detected by the SNCA antibody C-20 was normalized to GAPDH and displayed as fold change (n = 6). Quantification of syn-1 antibody is shown in Figure S4E. (G) Representative western blot of Triton-insoluble (T-insol) lysates after treatment with PBS or rHsCTSD. (H) Insoluble SNCA levels (C-20 antibody) were quantified and normalized to TUBB3 and expressed as fold change (n = 6). (I) Representative image of a raster plot profiles of multi-electrode array (MEA) of DA-iPSn A53T corr. and A53T with and without rHsCTSD treatment. Each black line represents a detected spike. Blue lines represent detected channel bursts and pink boxes show network burst. Respective quantification of (J) number of active electrodes and (K) weighted mean firing rate in A53T corr. and A53T treated with PBS or rHsCTSD 14 days after treatment (n = 16, each dot represents one active well of a 48-well MEA plate). Data of active electrodes and weighted mean firing rate before rHsCTSD treatment are shown in Figure S4K and S4L. Data represent mean ± SEM. Statistical analyses were performed by using one-way ANOVA together with a Tukey’s multiple comparison test in (B-C, J-K) and a two-tailed unpaired Student’s t-test (E, F and H). ****p < 0.0001, ***p < 0.001, **p < 0.01, *p < 0.05; n.s., not significant.
Altogether, these data indicate that treatment with rHsCTSD efficiently decreases pathological SNCA protein levels and does not change neurophysiological properties of PD DA-iPSn.
Effects of rHsCTSD treatment on lysosomal and autophagy pathways in iPSC-dopaminergic neurons
To assess the impact of rHsCTSD treatment on lysosome and autophagy function, lysates and fractions enriched for lysosomes of DA-iPSn, were analyzed by biochemical, ultrastructural and proteomic analyses. After incubation of DA-iPSn with rHsCTSD, we enriched for lysosomal fractions by a gradual centrifugation approach as performed before for the H4 cell line. These lysosome-enriched samples derived from A53T corr., A53T DA-iPSn with and without rHsCTSD treatment were subjected to a SNCA seeding assay that evaluates the ability to stimulate amyloid protein aggregation of recombinant, monomeric SNCA using an amyloid-binding dye (Thioflavin T). Importantly, only lysosomal fractions of the non-treated A53T mutant DA-iPSn were able to cause the formation of pathological SNCA aggregates (, red line), as also observed for the positive control (fibril + SNCA monomer, Figure S5A, black dotted line). The input of lysosomal fractions of control (A53T corr.) and rHsCTSD-treated A53T mutant cells did not result in significant seeding events (). To further purify resulting SNCA conformers for ultrastructural analyses, the seeding assay was repeated a second time (Figure S5B). The presence of pathological SNCA conformers after two rounds of seeding assay was evaluated by non-denaturing dot blot analysis utilizing the MJFR-14-6-4-2 antibody, which preferentially detects pathological SNCA conformations [Citation64]. Pathological conformers were only found within the A53T mutant sample and in the positive control (fibril + monomer; ). TEM analyses confirmed the formation of fibrillar SNCA structures that could be identified in amplified lysosomal fractions of non-treated A53T DA-iPSn (). This indicates the pathological nature of lysosomal SNCA conformers within A53T mutant iPSn, which were able to seed the aggregation of SNCA monomers. Furthermore, this result suggests that treatment with the recombinant enzyme depleted pathological SNCA conformers, which originate from lysosomes. Following, we analyzed lysosomal and autophagy markers in lysates of DA-iPSn: rHsCTSD treatment of A53T mutant line resulted in significant reductions of LAMP1 and SQSTM1 protein levels that were significantly increased under disease state (A53T PBS, high SNCA) in comparison to the corrected line (A53T corr.; ). Consisting with lysosomal dyshomeostasis and dysfunction [Citation58,Citation62], increased lysosomal mass measured by Dextran-Cascade Blue staining was detected under high SNCA conditions (A53T mutant line) and could be reduced after rHsCTSD treatment (A53T +rHsCTSD; ). This data corresponds to ultrastructural TEM analyses of DA-iPSn showing a drastic decrease in the number of intracellular vesicles after rHsCTSD treatment of A53T mutant line, which was comparable to A53T corr. level (orange triangles, , S5C). Moreover, lysosomal GBA activity that was diminished under disease state (A53T), could be partly recovered after rHsCTSD treatment (p = 0.086; Figure S5D), indicating an improvement of lysosomal function. Importantly, all here performed assays investigating lysosomal and autophagosomal dysfunction, including LAMP1, SQSTM1 protein levels (), number and volume of vesicular structures and lysosomes () as well as lysosomal GBA activity (Figure S5D), could be improved in rHsCTSD-treated A53T mutant line to similar levels as found in the isogenic control line (A53T corr.), which lacks SNCA aggregation. To evaluate the specificity of rHsCTSD treatment, we compared the protein content of lysosomal fractions enriched from DA-iPSn treated with exogenous CTSD or PBS (CTSD vs. PBS) by a proteomic mass spectrometry analysis. As expected, we found a significant increase of CTSD (green; upper right square) and a decrease in SNCA protein (SNCA, red) in lysosomes of rHsCTSD-treated DA-iPSn (). Overall, rHsCTSD treatment did not interfere considerably with the lysosomal protein composition (): we did not observe significant changes of other lysosomal enzymes (highlighted in green; including GBA and CTSB) or soluble forms of other potential CTSD substrates (highlighted in orange: PSAP (prosaposin) [Citation47,Citation65]; APP (amyloid-beta precursor protein) [Citation66,Citation67]; MAPT/tau (microtubule associated protein tau) [Citation68,Citation69]; PRNP/Prion (prion protein) [Citation70,Citation71]) after rHsCTSD treatment. Interestingly, there was an increase in abundance for proteins important for vesicular trafficking within the endo-lysosomal and autophagy system (e.g. SYT11/ syntaxin 11 [Citation72], SNX2/ Sorting nexin-2 [Citation73] and RAB4B [Citation74]; highlighted in purple). Moreover, lysosomal membrane proteins represented by LAMP2 and LAMP1 showed slight downregulation, whereas subunits of the vacuolar-type H+-translocating ATPase (e.g., ATP6V0A1; only some subunits highlighted in graph) were not affected by rHsCTSD treatment (blue dots; ). A full overview of the results of the proteomic mass spectrometry can be found in Table S1.
Figure 5. Effects of rHsCTSD treatment within lysosomes and on the endo-lysosomal/ autophagic system in DA-iPSn harboring an SNCA mutation (A53T). (A) In vitro SNCA seeding assay of lysosomal fractions derived from DA-iPSn of A53T corr. PBS and A53T treated with PBS or rHsCTSD for 25 days. An increase in ThioT signal indicates amyloid protein conversion. Graph shows relative Thio T signal normalized to positive control (fibril+ SNCA mono) (n = 3). Corresponding positive and negative controls as well as second round of SNCA seeding assay are shown in Figures S5A and S5B. (B) Non-denaturing dot blot analysis confirms the presence of pathological SNCA conformation in lysosomal fractions of DA-iPSn A53T and control (fibril + SNCA mono) after two rounds of seeding assay utilizing an SNCA conformation specific antibody (MJFR-14-6-4-2). (C) Representative transmission electron microscopy (TEM) picture of SNCA fibrils from second seeding round derived from DA-iPSn A53T lysosomes. Scale bar: 90 nm. (D) Representative western blot of A53T DA-iPSn lysates from A53T corr., A53T mutant and mutant treated with 10 µg/mL rHsCTSD for 25 days stained for autophagic marker LAMP1 and SQSTM1 as well as pro/single chain (~48/ ~52-kDa) and mature CTSD (~34-kDa). GAPDH and CBB staining were used as loading controls. (E) Respective quantification of LAMP1 and SQSTM1 signal intensity normalized to GAPDH and expressed as fold change (n = 3). (F) Analysis of Dextran-Cascade Blue representing the lysosomal mass. DA-iPSn A53T corr. was incubated with PBS and mutant line (A53T) was treated with PBS and 10 µg/mL rHsCTSD for 21 days. Dextran-Cascade Blue signal was normalized to overall cell stain (Celltag700) and expressed as fold change (measured in triplicates of three independent experiments, n = 3). (G) TEM pictures of ultrastructural analysis of A53T DA-iPSn treated with PBS or rHsCTSD (corresponding picture of A53T corr. in Figure S5C). Blue: nucleus; yellow arrows: intracellular vesicles. One representative mitochondrion is highlighted by an orange star to distinguish it from the vesicular structures. Scale bars: 25 µm. (H) Quantification of intracellular vesicles in DA-iPSn of A53T corr. and A53T treated with PBS or rHsCTSD, showing numbers of vesicle per µm2 (each dot represents the mean of vesicles per µm2 of n = 4 cells). (I) Mass spectrometry analysis of enriched lysosomal fraction from DA-iPSn of A53T mutant line incubated with PBS compared to A53T treated with rHsCTSD (25 days). The graph shows log2 transformed ratios of heavy (Dimethyl Lys4, Dimethyl Nterm4) labeled rHsCTSD sample and light (Dimethyl lys0, Dimethyl Nterm0) labeled control (PBS) sample on the x-axis. The technical replicate (labeling was switched) was inverted for visualization to show the same enrichment direction. The red dashed line indicates a two-fold threshold for enrichment. The most important proteins are highlighted in color, based on their function. All data represent mean ± SEM. Statistical analyses were performed by using two-way ANOVA with a Tukey’s multiple comparison test in (A). To distinguish between statistical differences, asterisks (*) were used for A53T corr. vs. A53T and diamonds (#) were used for A53T vs. A53T +rHsCTSD. One-way ANOVA together with Dunnett’s multiple comparison test was used in (E, F and H). ***/###p < 0.001, */#p < 0.05.

Collectively, these findings indicate that treatment of iPSC-derived PD neurons with rHsCTSD resulted in a decline of lysosome-derived, pathology-associated SNCA conformer that was capable of seeding amyloid aggregation. Moreover, the function of the endo-lysosomal and autophagy system could be restored in A53T mutant DA-iPSn after boosting lysosomal CTSD activity without changing the overall lysosomal composition.
rHsCTSD in vivo treatment decreases SNCA/α-synuclein in CTSD-deficient mice
To investigate the role of CTSD on SNCA metabolism in vivo, we made use of a well-characterized ctsd KO mouse model [Citation37,Citation75]. Mice lacking the CTSD protease show neurodegeneration, accumulation of undigested proteins, elevated levels of insoluble SNCA aggregates and premature death at postnatal day 25 ± 1 (P25-26) [Citation44], supporting the essential role of CTSD for brain function. A recent study demonstrated that rHsCTSD directly applied by intracranial injection to the central nervous system was able to ameliorate the pathological phenotype and prolong the lifespan of ctsd KO mice to P33-34 [Citation47]. Importantly, rHsCTSD-treated mice showed improved behavioral changes, evaluated by motor coordination and muscle strength [Citation47]. Since SNCA aggregates are present in the brain of these mice [Citation44,Citation48], we decided to use this model to evaluate the effects of dosing recombinant CTSD administration in vivo on SNCA aggregation. Ctsd KO mice received two intracranial injections of 100 µg (in 10 µl) of rHsCTSD each, one at P1 (right hemisphere) and the other one at P19 (left hemisphere) (Figure S6A). Mice were sacrificed at P23 as untreated ctsd KO mice drastically decline in health and survival shortly afterward [Citation37,Citation47]. We first verified CTSD protein levels within whole brain of rHsCTSD treated ctsd KO mice by immunoblot and observed a significant increase in mature CTSD levels, similar to the protein amount found in wildtype (WT) (). The absence of the immature forms of human CTSD in brain lysates of treated mice indicates a rapid maturation of the enzyme to the active lysosomal form (). For detection of SNCA in immunoblot, we made use of two different SNCA antibodies (C-20 and syn-1). No significant differences within total soluble SNCA were observed between brain lysates of ctsd WT, KO and KO-treated mice utilizing the C-20 () and the syn-1 antibody (Figure S6B, S6D, S6E, S6G). However, consistent with previous studies [Citation44], we observed that ctsd-deficient mice presented elevated levels of Triton-insoluble (T-insol; SDS-soluble) forms of SNCA in comparison to WT (). Importantly, treatment of ctsd KO animals with rHsCTSD decreased the pathological (T-insol.) SNCA levels in a significant manner, reducing them to levels similar or even below to those found in WT controls, again utilizing two different SNCA antibodies (C-20 and syn-1) (, S6C, S6D). Additionally, dot blot analysis of T-insol whole brain lysates utilizing the Syn505 antibody, which preferentially detects oxidized SNCA forms [Citation76], also showed elevated levels of pathological SNCA in ctsd KO mice and a significant decrease after rHsCTSD treatment (Figure S6F, S6G).
Figure 6. Intracranial injection of rHsCTSD decreases insoluble SNCA in the brain of ctsd deficient (KO) mice. (A) Representative immunoblot of Triton-soluble (T-sol) fraction of whole brain lysates from wildtype (WT) and ctsd KO (KO) mice injected with 10µL PBS or 100 µg rHsCTSD (KO rHsCTSD) each at day P1 into the left hemisphere and on day P19 into the right hemisphere (illustrative timeline of rHsCTSD treatment in mice is depicted in Figure S6A). Western blot stained for CTSD (pro/single chain ~52/~48-kDa and mature form ~34-kDa) as well as SNCA (C-20; immunoblots of syn-1 can be found in Figure S6B). TUBB3 and CBB-stained SDS-PAGE gels were used as control for equal protein load. (B) Quantification of pro-/single chain form and mature CTSD normalized to TUBB3 and normalized to WT (n = 3 mice per group). (C) Quantification of soluble SNCA (C-20; analysis for syn-1 can be found in Figure S6D), normalized to TUBB3 shown as fold change (n = 3 mice per group). (D) Immunoblot of Triton-insoluble (T-insol) fraction of whole brain lysates from WT, KO and rHsCTSD treated KO mice. Right, quantification of insoluble SNCA levels detected by C-20 representative for three individual experiments, normalized to TUBB3 expressed as fold change (n = 3 mice per group; immunoblot and quantification of syn-1 antibody can be found in Figure S6C-6D). (E) Representative dot blot from T-sol whole brain lysates of WT, ctsd KO and ctsd KO mice i.c. injected with rHsCTSD. Pathology-associated SNCA was detected by the conformation-specific SNCA antibody MJFR-14-6-4-2. ACTB was used as a loading control. Right, fold change quantification of SNCA-filament-MJFR signal normalized to ACTB (n = 3–4 mice per group). (F) Representative images of co-stained brain regions hypothalamus, fornix, basal forebrain/thalamus, hippocampus and midbrain of ctsd KO and ctsd KO +rHsCTSD. Pathology-associated SNCA was detected by the conformation-specific antibody MJFR-14-6-4-2 (red) and co-stained with the neuronal marker neurofilament (neurofil., green). Scale bar: 50 µm. For images of WT mice and in lower magnification refer to Figures S7A-7B. (G-I) Analyses of average SNCA aggregate size (µm) and SNCA intensity signal per aggregate from (G) hypothalamus, (H) fornix and (I) basal forebrain and thalamus. Dots represents SNCA aggregates found per image in the respective brain area (n = 3 mice per group). Quantification of SNCA intensity in (J) midbrain and (K) hippocampus (n = 3 mice per group). (L) Representative immunofluorescence pictures of primary neurons derived from wildtype (WT), heterozygous (Het) and ctsd-deficient (KO) mice stained for SNCA (syn1; red), CTSD (green) and nucleus (DAPI; blue). Primary neurons of KO animals were treated with 20 µg/ml rHsCTSD. Individual channels for CTSD (green) and SNCA (red) are shown in Figure S7F. Scale bar: 10 µm. Quantification of (M) SNCA and (N) CTSD signal intensity, normalized to WT and expressed as fold change (n = 6 individual neurons per group). Data represent mean ± SEM. Statistical analyses were performed by using one-way ANOVA together with a Tukey’s multiple comparison test and a two-tailed unpaired Student’s t-test in (G-I). ****p < 0.0001, ***p < 0.001, **p < 0.01, *p < 0.05; n.s., not significant.
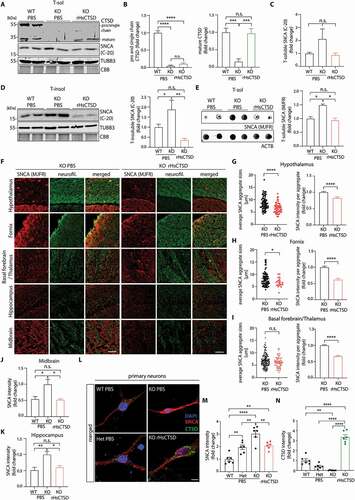
Next, we analyzed the degradation capacity of the intracranially dosed rHsCTSD on aggregated SNCA by using the conformation-specific antibody MJFR-14-6-4-2 [Citation64]. Since this antibody preferentially targets pathological folding of SNCA, analysis was performed under non-denaturing conditions utilizing dot blot analysis in T-sol whole brain lysates. We observed increased levels of pathological SNCA conformers in brain lysates of ctsd KO mice and a significant decrease similiar to WT levels of this form in rHsCTSD-treated mice (). Furthermore, the conformation-specific MJFR antibody was used for IF analyses of brain slices by co-staining with neurofilament as a neuronal marker (overview of analyzed brain areas: Figure S6H). Confirming our dot blot analyses, signal intensities for the pathological SNCA conformer were low in brain areas of WT animals (Figure S7A). However, we found visible SNCA aggregates in the hypothalamus (mean average size: 8.7 µm ± 0.42) (), the fornix (mean average size: 8.2 µm ± 0.40) (), and in the area between basal forebrain and thalamus (mean average size: 6.8 µm ± 0.30) () of ctsd KO mice (; lower magnification pictures in Figure S7B). After treatment of mice with rHsCTSD, SNCA aggregates appeared significantly smaller in the hypothalamus (~23% decrease in size: mean average size 6.7 µm ± 0.66) () and in the fornix (~18% decrease in size: mean average size 6.7 µm ± 0.72) () and were less positive for the MJFR-antibody as compared to non-treated KO mice (). While there were no significant differences in the mean average size of SNCA aggregates (6.3 µm ± 0.48) in the area of basal forebrain and thalamus, the SNCA immunoreactivity within the aggregates was decreased in rHsCTSD-treated mice in comparison to PBS-treated animals (). Moreover, pathological intraneuronal SNCA accumulation was detected in the hippocampus and midbrain of ctsd KO mice and was diminished significantly after rHsCTSD treatment (; lower magnification pictures found in Figure S7B). To validate the MJFR positive immunosignals, co-stainings with another SNCA antibody (syn-1), which detects total SNCA level. Stainings revealed colocalization of both SNCA antibody signals, especially within aggregated and dense SNCA structures, mainly present in the hypothalamus, fornix and hippocampus (Figure S7C, S7D). Exemplary stainings of another SNCA antibody (“Acris”) also exhibited an overall decrease in total SNCA signal intensities and a visible reduction of SNCA aggregated structures, between ctsd KO treated with PBS and rHsCTSD (Figure S7E), strengthening the results obtained by utilizing the MJFR antibody.
To study intracellular effects of rHsCTSD treatment on a neuronal level, primary neurons derived from WT, heterozygous (Het) and homozygous ctsd KO mice were analyzed after exposure to exogenous CTSD by confocal microscopic analyses. No CTSD signal was detected in homozygous ctsd KO neurons (, S7F). Before treatment, a gradual increase of SNCA signal intensity was detected in primary neurons from heterozygous and homozygous ctsd KO animals compared to WT, indicating that the degree of CTSD expression is an important regulator in SNCA homeostasis within neurons (, S7F). Treatment of primary neurons with rHsCTSD resulted in a drastically increased CTSD signal (, S7F), confirming efficient endocytosis of external enzyme by murine neurons. Concomitantly, SNCA level significantly decreased in primary neurons of ctsd KO animals after exposure to rHsCTSD (, S7F).
Altogether, these results indicate that CTSD is vital for SNCA turnover, and treatment with rHsCTSD can reduce pathological SNCA aggregation both, in vivo and in primary neurons.
Effect of rHsCTSD on intraneuronal SNCA/α-synuclein and synaptic vesicles
The physiological function of SNCA is still under debate, but the general understanding involves its important role in vesicular trafficking and neurotransmitter release by its association with synaptic vesicles [Citation77–80]. We therefore examined whether CTSD deficiency and SNCA aggregation influence synaptic vesicles homeostasis and if rHsCTSD treatment is able to restore physiological distribution of SYN-1 (synapsin I)-positive vesicles in primary mouse neurons and human DA-iPSn.
Primary mouse neurons deficient for ctsd were characterized by the presence of profound SNCA aggregation within neuronal processes (; red) and respectively with a reduced number (p < 0.05) and size (p = 0.101 WT vs. KO) of SYN-1-positive vesicles (). Notably, rHsCTSD treatment not only drastically decreased intraneuronal SNCA aggregation (, red) but also increased the number (p < 0.001) of SYN-1-positive structures in the neuronal processes back to WT levels (‒7B; green). The same types of IF analyses were performed in DA-iPSn and likewise, high SNCA aggregates resulted in a decrease of vesicles positive for SYN-1 (). Treatment with rHsCTSD led to profound reductions of aggregated SNCA (, red) and a significant increase in SYN-1-positive clusters () that were also augmented in size (). To analyze the localization of SNCA and SYN-1 in more detail, structured illumination microscopy (SIM) was applied. Primary mouse neurons derived from ctsd KO animals exhibited strong aggregated SNCA signals (magenta), that colocalized with synaptic structures (white) in particular regions (, left). Treatment with rHsCTSD resulted in less profound SNCA aggregates (magenta) and reduced overlaps of both proteins (, right). A detailed look into the interaction of SNCA and SYN-1 in DA-iPSn revealed similar effects: rHsCTSD treatment of A53T mutant line resulted in less aggregated SNCA (magenta) (, right, more disperse SNCA pattern). SNCA aggregation within the A53T DA-iPSn followed clustered colocalization of SNCA and SYN-1 in particular areas (, white, see magnification). After rHsCTSD treatment, less events of clustered SNCA and SYN-1 overlap were observed. Interestingly, SNCA-positive structures were still in close contact with SYN-1-puncta (, right, magnification), proposing a physiological interaction of SNCA and SYN-1, as found on the outside of synaptic vesicles.
Figure 7. Intraneuronal effect of rHsCTSD on SNCA and synaptical vesicles in primary neurons and in DA-iPSn. (A) Representative immunostaining of neuronal processes of primary neurons derived from WT, ctsd KO and ctsd KO +rHsCTSD animals. SNCA shown by antibody anti-syn-1 in red and SYN-1 (synapsin I) in green. Scale bar: 5 µm. (B) Quantification of SYN-1-positive vesicle cluster number per µm and (C) of the average SYN-1-positive vesicle size per punctum (µm) in primary neurons from WT, ctsd KO and ctsd KO +rHsCTSD (analysis of n = 11-13 individual neurons per group). (D) Representative immunostaining of SNCA (LB509; red) and SYN-1 (green) in neuronal processes of DA-iPSn of isogenic control (A53T corr) and mutant line (A53T) with and without rHsCTSD treatment. Scale bar: 5 µm. (E) Quantification of SYN-1-positive vesicle cluster numbers per µm and (F) analyses of average SYN-1-positive vesicle size per punctum (µm) in neuronal processes of DA-iPSn A53T corr. +PBS, A53T +PBS and A53T +rHsCTSD (n = 13-16 individual neurons per group). (G and H) Representative structured illumination microscopy (SIM) images providing detailed localization of SNCA respective to SYN-1 signal in (G) primary neurons derived from KO +PBS and KO +rHsCTSD animals and (H) DA-iPSn from A53T mutant +PBS and +rHsCTSD. Neuronal processes were immunostained with SNCA (Antibody: syn-1 for primary neurons and LB509 for DA-iPSn; magenta) and SYN-1 (green). Scale bar: overview 2 µm and inset 1 µm. Images highlighted here (G and H) correspond to experimental conditions in (A) and (D) and highlighted findings from respective experiment. Data represent mean ± SEM. All statistical analyses were performed by using one-way ANOVA followed by Tukey’s multiple comparison test. ****p < 0.0001, ***p < 0.001, *p < 0.05 n.s., not significant.
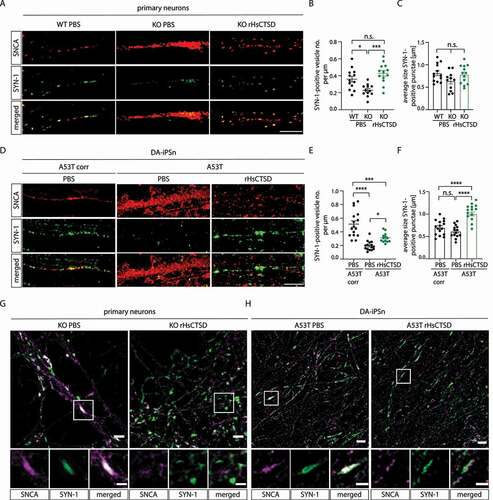
In total, boosting lysosomal CTSD activity in murine and human neurons results in less intraneuronal SNCA aggregates, restores the number and size of SYN1-positive puncta and fosters peripheral interaction of SNCA with synaptical vesicles, as visualized by immunostaining of SYN-1.
Discussion
Cells rely on a quality control system such as the autophagy-lysosomal pathway to avoid abnormal protein modification, aggregation and organelle damage. Malfunctioning autophagy and lysosomal impairment consequently lead to the accumulation of unmetabolized substrates, which underlies LSDs [Citation81] and many neurodegenerative diseases, as most neuronal cells in the brain are post-mitotic and rely on a robust and undisturbed protein homeostasis [Citation82]. Several studies have identified numerous lysosomal enzymes and components of the autophagy-lysosomal pathway to be involved in PD pathogenesis [Citation40]. These also include the lysosomal hydrolases CTSD and CTSB [Citation14,Citation15]. Interestingly, patients carrying heterozygous mutations in the GBA1 gene, known to cause Gaucher disease, a common autosomal recessive LSD, have an increased risk for developing PD [Citation16,Citation83,Citation84]. Given the accumulating evidence about the molecular and genetic associations between lysosomal dysfunction and PD, it is not surprising that therapeutic strategies implied in LSDs are also being explored for treatment of PD.
The lysosomal enzyme CTSD has emerged as a crucial mediator of lysosomal clearance, as it contributes to bulk endo-proteolysis and the clearance of the APP, mutant HTT (huntingtin), MAPT, PRNP, and SNCA [Citation65–67,Citation69-71,Citation85,Citation86]. All of these substrates are prone to pathological aggregation and can cause neurotoxicity if not subjected to efficient degradation [Citation43]. Importantly, CTSD is a key regulator in the proteolysis of SNCA as shown in vitro and in vivo [Citation41,Citation42]. Although SNCA is a cytosolic protein, it can reach lysosomes and be present in physiological as well as pathological assembly states [Citation22,Citation57,Citation87]. Clearance of cytosolic SNCA can be mediated by chaperone-mediated autophagy (CMA [Citation25,Citation26]), which is blocked by mutant SNCA A53T [Citation25]. Imbalance in the degradative capacity of the lysosome might promote lysosomal SNCA aggregation, which is supported by low pH [Citation87,Citation88] and interference with lysosomal glycolipids that trigger SNCA misfolding [Citation53]. Moreover, clearance of aggregated SNCA from the cytosol is mediated via macroautophagy [Citation24,Citation26,Citation29]. However, an overload of aggregated protein within the degradative compartments might further block the endo-lysosomal system, resulting in a toxic feedback loop and eventual cellular collapse [Citation22,Citation57,Citation89].
The link between CTSD and SNCA degradation can be clearly observed within a ctsd-deficient mouse model that exhibits a severe pathological phenotype, such as premature death and increased insoluble and pathology-associated SNCA in the brain, as demonstrated in previous studies [Citation37,Citation44] and in our study (). Here, we could show that SNCA aggregation is dependent on CTSD protein level in a concentration-dependent manner (). Notably, CTSD haploinsufficiency can reduce lysosomal activity and transcellular transmission of SNCA aggregates [Citation45], suggesting that partial enzymatic activity is insufficient to correct SNCA clearance.
Point mutations in the CTSD gene are known to underlie CLN10, a devastating congenital neurodegenerative disease [Citation90]. However, potentially damaging variants in the CTSD gene have also been linked to PD [Citation14]. While consequences of these mutations in PD pathology remain elusive, a recent study suggests that protein transport and maturation were only slightly affected in overexpression studies for PD-associated CTSD variants [Citation91]. In contrast, CLN10-associated variants within CTSD exhibited severe deficiencies in maturation and enzymatic activity [Citation91]. This indicates different pathological mechanisms for CLN10- and PD-associated CTSD variants, resulting in their distinct phenotypes.
Qiao et al. demonstrated that overexpression of CTSD in C. elegans and in mammalian cells protects neurons from SNCA aggregation and toxicity [Citation48]. These results suggest that targeting CTSD function could potentially ameliorate neurodegeneration and SNCA pathology. As deficient enzyme activity underlies the majority of LSDs, the restoration of the affected enzyme is the aim of current treatment strategies. To date, one of the most successful therapeutic approaches for LSDs is ERT [Citation56,Citation92]. This therapy relies on the delivery of the intravenously administered enzyme to the lysosomes via M6P receptors present at cellular membranes [Citation93]. ERT is currently approved for the treatment of the following LSDs: type I Gaucher disease, Fabry disease, Hunter disease, and is in clinical trials for many others [Citation56]. The promising outcome of this strategy and the importance of neuronal homeostasis in PD prompted us to explore the application of recombinant CTSD as a treatment strategy for PD. Here, we use different synucleinopathy models to determine whether human recombinant proCTSD could reduce SNCA burden. For the production of recombinant proCTSD, we followed Marques et al. recently described strategy [Citation47].
Utilizing the recombinant proform of CTSD as a therapeutic approach is advantageous since the proenzyme is not active at neutral pH [Citation34,Citation47]. The recombinant CTSD only undergoes maturation and activation in an acidic environment (pH 3.5–4.5) as present within the lysosomal lumen [Citation28,Citation34]. This reduces any potential risks of rHsCTSD exerting enzymatic activity outside the target organelle (lysosome). During the treatment of DA-iPSn, we evaluated potential side effects of the proenzyme and did not detect any cytotoxic or pro-apoptotic events nor interference with the neurophysiological function of neuronal cells. Moreover, administration of the enzyme into the CNS of ctsd-deficient mice improved disease state, as indicated by better motor coordination and muscle strength, ameliorated neuroinflammation and prolonged survival rate [Citation47]. Importantly, CTSD delivery did not cause any obvious behavioral change in WT mice [Citation47], suggesting the tolerance of the recombinant enzyme.
Our data indicate that recombinant proCTSD is efficiently taken up by human as well as murine neuronal cells and is delivered into the lysosome, where it achieves its mature conformation () [Citation34]. Recently, Marques et al. suggested that cellular uptake of proCTSD relied on M6P and LRP1 receptors on the cell surface [Citation47]. In accordance with proCTSD intracellular trafficking and maturation, we found additionally that the amount of mature CTSD corresponds to the reduction of SNCA protein levels in H4 neuroglioma cells overexpressing SNCA (H4 SNCA; ). Most importantly, we demonstrate that rHsCTSD can reduce insoluble and pathology-associated SNCA conformers in iPSC-derived dopaminergic neurons from a PD patient harboring an A53T SNCA mutation confirmed by different approaches ( and ). In contrast to H4 cells, iPSC-derived dopaminergic neurons are postmitotic, presenting with profound insoluble SNCA aggregation probably due to increased vulnerability to improper cellular proteostasis [Citation94]. More specifically, SNCA conformers could be detected within lysosomal fractions of both cell lines, H4 SNCA and A53T iPSn and decreased by boosting lysosomal CTSD activity (H4: , DA-iPSn: ). Interestingly, the lysosome-derived SNCA form of A53T DA-iPSn was able to seed amyloid protein aggregation (), demonstrating its potentially detrimental effect in pathology [Citation95,Citation96]. Importantly, seeding of amyloid protein aggregation was depleted after rHsCTSD treatment ().
A significant decline of insoluble and pathology-associated SNCA aggregates was detected in synucleinopathy models that expressed profound SNCA aggregation (A53T DA-iPSn and CTSD KO mice) after exogenous treatment with CTSD. In contrast, soluble SNCA conformers remained unchanged ( and 6A). Interestingly, an in vitro degradation assay indicates that soluble monomeric, as well as soluble oligomeric conformers, are more susceptible to CTSD degradation than insoluble fibrils (Figures S2A-S2B), probably due to structural occlusion of the CTSD cleavage site within the fibril [Citation41]. We speculate that the decrease of soluble SNCA conformers (monomers and oligomers) prevents further growth of SNCA fibrils and thus shifts the equilibrium from insoluble to soluble forms, which then become again substrates for CTSD. However, it might also be possible that divergent subcellular localization of SNCA conformers explains their different susceptibility toward CTSD degradation. Although all SNCA forms reach the lysosome for degradation [Citation24,Citation26], high molecular weight forms of SNCA have been shown to leak [Citation97], hence potentially escaping the rescue strategy by CTSD treatment. This might also be the case for other CTSD substrates, like the PRNP that has also been shown to escape lysosomal structures [Citation98]. Studies on escape mechanisms of different soluble/insoluble protein aggregates and their impact on lysosomal degradation will have to be addressed in further investigations.
Restoration of SNCA levels by treatment with rHsCTSD also improved homeostasis of synaptic vesicles (). Under physiological conditions, SNCA has been described to regulate synaptic transport and neurotransmitter release [Citation77,Citation79,Citation80]. Under pathological conditions, SNCA aggregation has been shown to lower SYN-1 level [Citation99] and reduce the size and density of synaptic vesicles, probably due to defects in vesicle recycling [Citation100]. In both of our SNCA overexpressing murine and human neuronal cell models, SNCA-dependent effects on SYN-1-positive vesicles could be observed and importantly, reversed by rHsCTSD treatment (). Structured illumination microscopy revealed a close localization of SNCA and SYN-1, which clustered under disease state and resulted in less puncta positive for both proteins after rHsCTSD treatment (). However, both proteins still came in close contact, suggesting restoration of physiological interaction of SNCA and SYN-1 (), as occurring on synaptic vesicles [Citation101,Citation102]. Consistent with lysosomal dysfunction [Citation61,Citation62], increased lysosomal mass and LAMP1 protein was observed in PD DA-iPSn. Importantly, both effects could be rescued by treatment with rHsCTSD (). Interestingly, identical effects, i.e. upregulation of LAMP1 protein level and the subsequent reduction of the protein after treatment with rHsCTSD were previously observed in different tissues, including the brain of CTSD KO mice [Citation47]. Consistently, our study demonstrates that exposing SNCA overexpressing neuronal cells to rHsCTSD improved the autophagic flux, as indicated by a reduction of the autophagy substrate SQSTM1 (), accompanied by a significant reduction in vesicular structures within the cell body of rHsCTSD-treated PD DA-iPSn (). Remarkably, we also observed an increase in lysosomal GBA activity in neuronal cells exposed to rHsCTSD. Taken together, our data indicate a general improvement of lysosomal function [Citation57,Citation103] and/or enhanced lysosomal trafficking upon rHsCTSD treatment that improved lysosomal performance after reduction of intracellular SNCA pathology as observed in earlier studies [Citation57,Citation58,Citation103]. As GBA degrades the sphingolipid glucosylceramide, which has been shown to interfere with SNCA accelerating its aggregation [Citation53], enhanced lysosomal GBA activity might in conjunction with CTSD proteolysis decrease intraneuronal SNCA burden. Importantly, reduction of pathological SNCA aggregates has been shown to improve intracellular pathways, as observed in this study: 1) correction of lysosomal mass and function, 2) restoration of autophagic flux and 3) rescue of vesicular homeostasis. Moreover, we could show that serine and cysteine proteases were not involved in the SNCA degradation processes after CTSD treatment (Figures S2G, S2H). Additionally, our unbiased proteomic analysis showed that the expression of other lysosomal cathepsins were not significantly stimulated after rHsCTSD treatment (). Next to SNCA, we only found one other CTSD substrate to be reduced after rHsCTSD treatment: SAPC [Citation59,Citation60] (Figure S2G-S2H). SAPC is a lysosomal co-activator of GBA and has been associated with Gaucher disease [Citation104]. Its precise role in PD and SNCA metabolism is still unclear [Citation105]. Hence, we assume that most rHsCTSD-dependent cellular improvements observed here were due to the abolishment of (pathological) SNCA conformers. However, contributive effects resulting from the reduction of other CTSD substrates, like SAPC, cannot be completely excluded. Other pathology-associated substrates of CTSD, like APP [Citation66,Citation67], MAPT [Citation68,Citation69] and PRNP [Citation70,Citation71]), were not found to be changed after rhCSTD treatment (, Table S1).
Importantly, the treatment with recombinant proCTSD mediated highly significant effects in vitro, as it reduced pathological SNCA conformers and corrected intracellular pathways as well as in vivo it improved behavioral outcome [Citation47]. Certainly, weekly or monthly intracranial injections seem not practical for PD patients. Currently, intraventricular infusion for the treatment of the LSD CLN type 2 (CLN2) is in clinical trials [Citation106]. So far, it has been shown that a bi-weekly recombinant enzyme infusion decelerates the motor and language decline in children with CLN2, which are remarkable results as this disease is of a progressive neurodegenerative nature and results in death by early adolescence [Citation107,Citation108]. Conversely, the recombinant CTSD could be re-engineered for delivery across the BBB into the brain in order to avoid an intracranial injection. For example, the use of CTSD in conjunction with several endogenous ligands such as the insulin or the Fc receptor, which are expressed on the membrane of the brain capillary endothelium and are able to deliver large molecules into the brain, is conceivable [Citation109]. Another existing mechanism to bypass the BBB is by focused ultrasound or nanovesicles, which allow precise and controlled ways for the delivery of therapeutic agents [Citation110-112].
It is worth mentioning that to date there is no curative therapy available for PD and other synucleinopathies. A big advantage of this treatment strategy would be its broad implementation, as SNCA burden could be reduced regardless of the genetic background. Since in familial PD patients, which represent around ~10% of all PD cases [Citation3], onset of disease is usually already in the fourth decade of life (age 30-39), intracranial application of rHsCTSD could be a possible strategy to improve pathology and disease progression. Moreover, rHsCTSD treatment could also be exploited in other synucleinopathies, like multiple system atrophy (MSA) and dementia with Lewy bodies (DLB), since their common pathological hallmark is SNCA aggregation that could be targeted by specific degradation. Important for a potential use of rHsCTSD as therapeutic target is the fact that application of the enzyme was able to rescue intracellular effects like lysosomal function, autophagy pathways and homeostasis of synaptic vesicles even when profound SNCA aggregation existed before the beginning of the treatment.
Although further improvements are necessary for the clinical use of the human recombinant proCTSD, our study strongly supports the role of CTSD in SNCA degradation in PD neurons as well as in vivo. Our work provides an important proof of concept for a potential therapeutic use of the recombinant proCTSD in PD and other synucleinopathies.
Materials and Methods
Cell culture and animal model
HEK 293-EBNA culture
For production of recombinant human proCTSD (rHsCTSD), human embryonic kidney (HEK) 293 cells stably expressing the Epstein-Barr virus nuclear antigen 1 under the control of the CMV promoter (HEK 293-EBNA) were utilized (Invitrogen, R620-07). Cells were maintained in Dulbecco’s modified Eagle medium (DMEM; Life Technologies, 41965) containing 4 mM L-glutamine and 4.5 g/L glucose and supplemented with 10% fetal calf serum (FCS), 1% PenStrep (Sigma, P0781) and 0.25 mg/mL G-418 (Life Technologies, 11811-023) in a humidified 5% CO2 atmosphere at 37 °C. HEK 293-EBNA cells were transfected with pCEP-Pu containing proCTSD as described previously [Citation47] using polyethyleneimine (PEI; Polysciences, 24765) in a 1:3 DNA to PEI ratio. Expressing cells were selected 48 h after transfection with 0.25 mg/mL G-418 and 1 µg/µL puromycin for 3 weeks. A high expressing clone was further selected by serial dilution.
rHsCTSD production and purification
Human recombinant proCTSD was produced as described previously [Citation47]. Briefly, for one round of protein expression, 4 × 10⁶ HEK 293-EBNA cells stably overexpressing rHsCTSD, were seeded in five 175 cm2 flasks with 35 mL of DMEM containing 10% FCS, 1% PenStrep, 0.25 mg/mL G418 (Thermo Fisher Scientific, 10131035) and 1 µg/µL puromycin per flask. Once cells reached 80% confluence, the medium was discarded and replaced by 100 mL DMEM containing 2.5% FCS and 1% PenStrep per flask. After one week, the medium was harvested, vacuum-filtered (0.22 µm; Fisher Scientific, FB12566510) and concentrated to a final volume of 50 ml utilizing an Amicon system and ultracentrifugation disk (10MWCO; Millipore, PLGC07610). The recombinant enzyme was purified by binding of its N-terminal His-tag to a HisTrap 1-mL column (GE Healthcare, 29–0510-21) on an ÄKTA Purifier (GE Healthcare) and subsequent elution with 250 mM imidazole (Millipore, 104716) in phosphate-buffered saline (PBS: 137 mM NaCl, 2.7 mM KCl, 0.8 mM Na2HPO4, 1.5 mM KH2PO4, pH 7.4). An additional purification step was performed by size-exclusion chromatography via a Superdex 75 column (GE Healthcare, GE17-5174-01). Finally, monomeric rHsCTSD was concentrated using a Vivaspin 20 (10MWCO; Sartorious, VS2002) and purity checked by SDS-PAGE.
H4 cell culture
Inducible human H4 neuroglioma cells expressing WT SNCA under the control of a tetracycline inducible promoter (tet-off) have been previously described [Citation57]. Cells were maintained in Optimem medium (Thermo Fisher Scientific, 31985070) containing 5% FCS (tet-free; PAN-Biotech, P30-3602), 200 µg/ml geneticin (Thermo Fisher Scientific, 10131035) and hygromycin (Thermo Fisher Scientific, 10687010), 1% Pen/Strep. If not indicated differently, SNCA expression was turned off by the addition of 2 µg/mL doxycycline (Dox; Sigma, D3447) for 72 h. H4 cells were seeded into 6-well plates for western blot at 2 × 10⁵ or 1.2 × 10⁵ (on 12 mm cover glasses) per well for immunostaining. On the following day, 20 µg/mL of rHsCTSD was added to the media. Cells were then incubated for 24, 48 and 72 h before harvesting. The cellular uptake of rHsCTSD and its effects on SNCA were then evaluated by western blot and immunostaining. To test for potential cytotoxicity, rHsCTSD of different concentration (20, 40, 60, 80, 100 µg/mL) were given to cells for 72 h and cell death was measured by LDH (lactate dehydrogenase) assay, ToxiLight assay (LONZA, LT27-066) and cleaved CASP3. Leupeptin (LeuP; Thermo Fisher Scientific, 78435) was given to the cells to inhibit cysteine-cathepsins (e.g., CTSB and CTSL) and was used at 5 µM for 72 h.
Generation of CTSD-deficient H4 cells
CTSD knockout cells were established using the CRISPR-Cas9 technique as described in Bunk et al. [Citation91]. In brief, H4 cells were transfected by Neon Transfection System (10 μL-Kit; Invitrogen, MPK1025) with ribonucleoprotein (RNP), complexes of CTSD multi-RNA guides and Cas9 protein (Gene Knockout Kit v2; Synthego). The multi-RNA guides used in this study target the exon 2 of the CTSD gene. Successful editing efficiency was determined by western blot analysis and Sanger sequencing of CTSD exon 2. Single CTSD KO cells were grown and expanded for western blot and Sanger sequencing analysis. Clone 2 was used for further analyses in this study. Cells were maintained as described in the section “H4 cell culture”.
iPSC culture and neuronal differentiation
PD patient derived human induced pluripotent stem cells (iPSC) expressing SNCAA53T and the matched isogenic corrected iPSC line were generously provided by Dr. R. Jaenisch (Whitehead Institute MIT) and were previously characterized extensively [Citation63]. iPSCs were maintained in mTeSR1 media (Stemcell, 85850) media or mTeSR plus (Stemcell, 100–0276) on Matrigel (Corning, 354234)-coated plates and differentiated into DA neurons using an established protocol [Citation113]. Between day 25–30 after differentiation, neurons were seeded on coated plates with poly-D-lysine (Merck, P1149) and LAM/laminin (Merck, 11243217001) at a cell number of 3 × 10⁵ per well (24-well plate) on 12-mm cover glasses for immunofluorescence or at 4 × 10⁵ for western blot. Neurons were maintained in Neurobasal media (Thermo Fisher Scientific, 21103049) containing NeuroCult SM1 Neuronal Supplement (Stemcell, 05711) and 1% PenStrep until ~ day 90, when neurons were treated with 10 µg/mL rHsCTSD, replenished every 4 days with media replacement for 21–25 days. Detailed describtion for iPSn culturing during the microelectrode array (MEA) analysis is mentioned in the section ”Microelectrode array (MEA) analysis”.
Animals
CTSD knockout animals (ctsd KO; ctsd−/−) mice were bred from heterozygous founders and genotyped as previously described [Citation47,Citation114]. All animals were housed in individually ventilated cages (IVC) and kept under a day/night rhythm of 12 h:12 h, with free access to water and food ad libitum. The room temperature was maintained at 19–22°C with a humidity of 45–60%. Animal handling and care were performed in agreement with the German animal welfare law according to the guidelines of the Christian-Albrechts University of Kiel. Animal experiments were approved by the Ministry of Energy, Agriculture, the Environment and Rural Areas Schleswig-Holstein under the reference number V242–40,536/2016 (81–6/16). Mice were genotyped at postnatal day 0 (P0). CTSD wildtype (Ctsd WT; Ctsd+/+) or ctsd−/− were selected to be dosed intracranially (i.c.) at P1 and P19 with either PBS or 100 µg rHsCTSD (in 10 µl) using a micro syringe (30 G) connected to a spacing device with an injection depth of 1.15 mm. over a period of 3 min. P1 injections were done in the cauda putamen in the right hemisphere, while P19 injections were done in the left hemisphere. For P19 injections mice were anesthetized with 2% isoflurane in oxygenated air. All mice were sacrificed at P23 as chosen humane end point for untreated CTSD KO mice [Citation47]. The brains were cut into 35 µm thick sections using a Leica SM 2000 R sliding microtome (Leica Microsystems) with dry-ice cooling and stored in PBS containing 0.02% (w:v) sodium azide.
Primary neuronal culture
Primary cortical neurons were cultured from the cortex of crossed heterozygous (ctsd Het; ctsd+/−) mice embryos (resulting in wild type (ctsd+/+), het (ctsd+/−) and homozygous (ctsd−/−)) at day 18.5 as previously described [Citation114]. Briefly, the cortices of the embryo’s brains were aseptically dissected, freed of meninges and minced in Hanks’ Balanced Salt Solution (HBSS; Life Technologies, 14,175–095). After trypsin digestion at 37°C for 15 min and washing, disassociated cells were plated at 7,5 x 10⁴ cells per 12-mm coverslip coated with a 3:1 COL1/collagen 1, rat tail (Thermo Fisher Scientific, A10483-01):poly-D-lysine solution and maintained in Neurobasal Medium supplemented with B27 Supplement (Thermo Fisher Scientific, 17504044), 0.5 mM GlutaMax (Thermo Fisher Scientific, 35050061), 25 µM glutamate (Sigma, G-6904), 5% PenStrep, 1 mM HEPES (Roth, 6761.1), pH 7.4, 10% heat-inactivated horse serum (Thermo Fisher Scientific, 26,050,070). The next day, the medium was replaced by Neurobasal Medium supplemented with B27, 0.5 mM GlutaMax, 5% PenStrep and 1 mM HEPES. Neurons were treated with 20 µg/mL rHsCTSD on day 7 and 10 after seeding and fixed on day 14 for immunofluorescence studies.
Cytotoxicity assays
To exclude potential toxicity of rHsCTSD treatment in H4 cells (CTSD KO and SNCA tet-off cells), LDH assay and ToxiLight assay were conducted. For DA-iPSn potential toxicity was assessed by the quantification of neurofilament (early cell shrinkage) as well as LDH assay after 21–25 days of 10 µg/mL rHsCTSD treatment. Further, H4 cells and DA-iPSn were analyzed by cleaved CASP3 as an indicator for potential apoptotic events.
LDH-assay
The determination of the LDH release in the culture medium from potential damaged cells treated with rHsCTSD at different time points and different concentrations were performed by Pierce LDH Cytotoxicity Assay Kit (Thermo Fisher Scientific, 88953) and were conducted according to the manual. In short, 50 µl of sample media collected from rHsCTSD-treated cells were transferred to a 96-well flat bottom plate (Greiner, 655083) and mixed with 50 µl of reaction mixture. After incubation at room temperature (RT) for 30 min, 50 µl of stop solution was added to each well and mixed. Each value was measured in triplicates. As a positive control, cells were treated with 20 µg/mL puromycin and/or a positive control provided by the Kit was used. The LDH activity was measured with an Infinite M Plex microplate reader (Tecan) or a Clario star plate reader (BMG Labtech) at the absorption wavelengths 490 nm and 680 nm.
ToxiLight assay
The bioluminescent ToxiLight bioassay (LONZA, LT27-066) is another method to determine cytotoxicity. The release of AK (adenylate kinase) from damaged cells into the culture medium can be quantitatively measured by its conversion from ADP to ATP, which is further oxidized to AMP by the bioluminescent firefly luciferase. The emitted light intensity is displayed as an RLU value and linearly related to the AK activity. Here, 20 µl of sample media were transferred to a 96-well flat bottom plate in triplicates and mixed with 100 µl of AK detection reagent in assay buffer. As a positive control, cells were incubated for 4 h with 500 µM hydrogen peroxide. After incubation for 5 min atRT, luminescence was measured using a Clario star plate reader (BMG Labtech).
Neurofilament staining
As marker for neuronal viability and early toxicity of DA-iPSn, the intensity of the cytoskeleton marker neurofilament was quantified by in-cell western analyses. Cells were cultured as described in section “iPSC culture and neural differentiation” and seeded onto 96-well format during neuronal differentiation at a cell number of 8 × 10⁴ per well. Cells were fixed in 4% paraformaldehyde (PFA) for 20 min at RT, permeabilized in 0.3% Triton X-100 (Sigma, T9284) in PBS for 30 min and blocked in Intercept TBS blocking buffer (Li-Cor, 927–60001) for 60 min. The cells were incubated with primary antibody (anti-neurofilament, 1:750, SMI 32 R; BioLegend, 837904) overnight at 4°C. Cells were then washed three times with PBS containing 0.1% Tween 20 (AppliChem, A1389) and the secondary antibody IRdye800-conjugated anti-mouse IgG antibody (1:1000; Li-Cor, 926–32210) as well as CellTag700 (1:500; Li-Cor, 926–41090) were applied to the cells for 60 min at RT. After three steps of washing (0.1% Tween 20 in PBS), image acquisition was performed with an Odyssey imaging system (Li-Cor Biosciences, Lincoln, NE, USA). For analysis, ImageStudioLite 5.2 (Li-Cor Biosciences) was used. The recorded signal intensity for each well was selected and total pixel brightness of the depicted area, as well as background pixel values of the area surrounding the selections were determined. The neurofilament signal from each well (near-infrared channel 800 nm) was normalized to the corresponding Celltag700 signal (near-infrared channel 680 nm).
Cleaved CASP3/caspase-3
For the analysis of cleaved-CASP3, H4 cells or DA-iPSn were fixed in 4% PFA for 20 min. Cells were permeabilized and simultaneously blocked in 0.4% fish skin gelatin buffer (Sigma, G7041) containing 1% bovine serum albumin (BSA; Millipore, 82–100-6) and 0.3% Triton X-100 in TBS for 1 h. Primary antibodies were diluted in fish skin gelatin buffer and incubated overnight at 4°C (rabbit anti-cleaved CASP3, 1:500; Cell Signaling Technology, 9661). Detection was carried out using a fluorescent anti-rabbit antibody conjugated with AlexaFluor 594, diluted 1:500 in blocking buffer. As a positive control for apoptosis, cells were incubated with hydrogen peroxide at 500 µM for 4 h prior to immunostaining. Finally, cells were mounted on microscope slides using DAPI-Fluoromount G (Southern Biotech, 0100–20) and imaged using a confocal laser scanning microscope (Zeiss LSM 780, Carl Zeiss Microscopy GmbH) or for DA-iPSn stainings an cell imaging system (EVOS FL, Life Technologies). Digital images were processed using Zen Blue software (ZEN lite 2012).
Biochemical analyses
CTSD activity assay
H4 CTSD KO cells were lysed in a Triton X-100 buffer (50 mM sodium acetate, 0.1 M NaCl, 1 mM EDTA, 0.2% Triton X-100), pH 4.5, centrifuged (17,000 x g 10 min, 4°C) and the supernatant was immediately used for determination of activity. 2 µg of cell lysates or rHsCTSD were incubated in 100 µL of lysis buffer containing 0.1 µM quenched fluorogenic peptide (Enzo, BML-P145) and 0.025 mM leupeptin (Enzo, ALX-260-009-M025) at 37°C for 30 min. The addition of CTSD inhibitor pepstatin A (PepA; Sigma-Aldrich, P5318) was used as a negative control. CTSD activity was measured for each sample in triplicates with an Infinite M Plex microplate reader (Tecan) or with SpectraMax Gemini (Molecular Devices, San José, CA, USA) (ex: 322 nm; em: 381 nm). All values were corrected for background fluorescence.
Live-cell GBA activity assay and staining of lysosomal volume
GBA/β-glucocerebrosidase activity was determined to assess overall lysosomal function and activity in H4 cells and DA-iPSn. H4 cells were seeded onto a black 96-well plate with clear bottom (Thermo Fisher Scientific, 265301) at a cell number of 5 × 10⁴ and on the next day treated with 20 µg/mL rHsCTSD for 72 h. DA-iPSn were plated onto a 96-well plate 25–30 days after the start of differentiation at a cell density of 8 × 10⁴ cells per well and were treated with 10 µg/mL rHsCTSD for 21 days. 24 h before GBA activity was measured, cells were treated with 1 mg/mL Dextran-Cascade Blue (Thermo Fisher Scientific, D1976). On the next day, cells were treated with DMSO or 0.2 µM bafilomycin A1 (BafA1; Sigma, 88899–55-2) for 1 h. Dextran-Cascade Blue was washed out with warm media, and cell-permeable fluorescent enzyme substrate 5-(pentafluoro-benzoylamino) fluorescein di-ß-D-glucopyranoside (PFB-FDGluc; Thermo Fisher Scientific, P11947) was applied to the cells at a concentration of 100 µg/mL for 1 h. Cells were then washed with media, and replaced with phenol red-free Optimen for H4 cells (Thermo Fisher Scientific, 11058021) or phenol red-free neurobasal media for DA-iPSn (Thermo Fisher Scientific, 12348017). Florescence intensity was measured every 30 min for 3 h with SpectraMax Gemini (Molecular Devices, San Jose, CA, USA) at excitation of 485 nm and emission of 530 nm (cutoff: 495 nm) for PFB-FDGluc substrate and at excitation of 400 nm and emission of 430 nm for Dextran-Cascade Blue (cut-off: 420 nm). Afterward, cells were fixed in 4% PFA for 20 min, permeabilized with 0.3% Triton X-100 and blocked in Intercept TBS blocking buffer (Li-Cor, 927–60001) for 60 min. Next, Celltag700 (Li-Cor, 926–41090) was diluted 1:500 in Intercept TBS blocking buffer with 0.1% Tween 20 and added to the cells for 1 h at RT. The plate was then washed three times in PBS containing 0.1% Tween 20 and once with only PBS, before analysis of Celltag700 staining using an Odyssey imaging system (Li-Cor Biosciences, Lincoln, NE, USA). For quantification, ImageStudioLite 5.2 (Li-Cor Biosciences, Lincoln, NE, USA) was used. For each well, substrate turnover (fluorescence at 530 nm) was normalized to Celltag700 or Dextran-Cascade Blue signal, graphed as normalized fluorescence intensity (y-axis) and time (x-axis). Total GBA activity was calculated by the area under the curve (AUC) of the DMSO curve and the lysosomal activity was analyzed by subtracting AUC of DMSO vs BafA1. The results of the GBA lysosmal activity measurment are shown as bar graphs . Lysosomal mass values (Dextran-Cascade Blue signal) were normalized to general cell stain (Celltag700) and also depicted as bar graphs.
Lysosomal enrichment
For lysosomal enrichment, H4 cells (CTSD KO and SNCA tet-off) were seeded onto 15-cm dishes (Sarstedt, 83.3903) at a concentration of 2 × 10⁶ cells per dish. Cells were treated with 20 µg/mL rHsCTSD for 72 h one day after seeding. For DA-iPSn, four wells of a 24-well plate of each condition were combined. rHsCTSD treatment in DA-iPSn was done as described (see part “iPSC culture and neuronal differentiation”). Cells were harvested and washed with PBS. After centrifugation at 400 x g for 5 min at 4°C, PBS was removed. 400 µL sucrose HEPES buffer (SHB; 250 mM sucrose [AppliChem, A2211], 10 mM HEPES, 100 mM EDTA, pH 7.4) were added. For western blot analysis, SHB was supplemented with 1X protease inhibitor cocktail (PIC; Roche diagnostic, 11836145001). Cells were then homogenized utilizing a cell homogenizer (Glas-Col, 099D GT31) and centrifuged at 6,800 x g for 5 min at 4°C to remove unbroken cells and debris. The supernatant, containing lysosomes, was then collected. The homogenization step of the pellet was repeated and the combined supernatant was centrifuged once more (17,000 x g, 10 min, 4°C). For CTSD activity assay and in vitro SNCA seeding assay, the lysosome-containing pellet was lysed in Triton buffer (50 mM sodium acetate, 0.1 M NaCl, 1 mM EDTA, 0.2% Triton X-100), pH 4.5 followed by a 10-min incubation in ice-slurry and subsequently centrifuged (20,000 x g, 15 min, 4°C). For western blot analysis and mass spectrometry analysis, pellets were lysed in Triton base buffer (1% Triton X-100, 10% glycerol, 150 mM NaCl, 25 mM HEPES pH 7.4, 1 mM EDTA, 1.5 mM MgCl2), pH 7.4 containing 1 mM PMSF (Thermo Fisher Scientific, 36978), 2 mM NaVO3 (Sigma, S6508), 50 mM NaF (Sigma, S7920) and 1X PIC. Protein concentration was determined via BCA (Thermo Fisher Scientific, 23225).
In vitro SNCA seeding assay
For amplification and purification of pathological SNCA in lysosomes, 10 µg protein of enriched lysosome extracted from DA-iPSn of A53T isogenic control (corr.), A53T mutant and A53T mutant treated with rHsCTSD for 25 days were added to 7 µM of recombinant monomeric SNCA in a total volume of 100 µL PBS in a dark 96-well plate (Thermo Fisher Scientific, 237108). The plates were constantly shaken at 1,000 rpm using a plate shaker (MTS 4, IKA) at 37°C for indicated time points. To minimize evaporation, the plates were sealed with a silicon lid (Thermo Fisher Scientific, AB0566) and additionally covered with parafilm. 1 µL of thioflavin T (ThioT, 1 mM stock solution; Sigma, T3516-25 G) was given to each indicated time point. The elevation of ThioT fluorescence signal was used to quantify amyloid protein formation and measured at excitation of 410 nm and emission of 475 nm utilizing with a SpectraMax Gemini (Molecular Devices, San Jose, CA, USA) plate reader. The seeding assay was repeated for an additional round to amplify SNCA aggregates. For that, 10 µL of the amplified lysate of first round of seeding assay were again added to 7 µM of recombinant monomeric SNCA in total volume of 100 µL PBS and shaken as described above. As negative controls 10 µL of 10 ng/µL (0.07 nM) recombinant monomeric SNCA (mono only) and 10 µL of 0.34 ng/µL (0.0024 nM) SNCA pre-formed fibrils (fibrils only) in 90 µL PBS, without seeds, were used. For the corresponding positive control, the pre-formed SNCA fibrils (10 µL of 0.34 ng/µL) were incubated together with 7 µM recombinant SNCA monomer. ThioT signal intensity of each sample was normalized to the positive control (fibril + SNCA monomer) at time point 40 h and were presented in relative fluorescence units (RFU). To visualize pathological SNCA forms derived from lysosomes after two rounds of amplification, 2.5 µL of the seeding assay product were applied onto a nitrocellulose membrane (Amersham Biosciences, 10600001), air-dried for 4 h, blocked in 5% (w:v) nonfat dry milk (Roth, T145.3) in TBS for 1 h, and then incubated with anti-SNCA-filament MJFR-14-6-4-2 (Abcam, 209538) in 5% milk with 0.1% Tween 20 overnight). Secondary fluorescent-conjugated anti-rabbit antibodies were incubated for 1 h after washing of the membranes with 0.01% TBS Tween 20. The dot blots were scanned using the Odyssey (Li-Cor Biosciences, Lincoln, NE, USA) imaging system. The recombinant SNCA was produced as described in Xiang et al. [Citation115].
Soluble and insoluble SNCA/α-synuclein fractionation
Fractionation of Triton-soluble (T-sol) and Triton-insoluble (T-insol) SNCA was performed as described in Stojkovska and Mazzulli [Citation116]. Cells (H4 and DA-iPSn) or frozen whole brain tissue were lysed in Triton base buffer (1% Triton X-100, 10% glycerol, 150 mM NaCl, 25 mM HEPES pH 7.4, 1 mM EDTA, 1.5 mM MgCl2) containing 1 mM PMSF, 2 mM NaVO3, 50 mM NaF and 1X PIC by incubation on ice-water slurry for 30 min, frozen and thawed three times, and ultracentrifuged at 100,000 x g, 4°C for 30 min. The remaining pellet was extracted in 2% SDS buffer containing 50 mM Tris, pH 7.4 and 1X PIC by boiling at 99°C for 10 min and sonicating three times. The T-insol fraction was cleared by ultracentrifugation at 100,000 x g, 22°C for 30 min. Protein concentrations were determined using a BCA assay.
Western blot analysis
Triton-soluble (T-sol) and Triton-insoluble (T-insol) lysates (40 µg per lane for H4 cells and 30 µg for DA-iPSn) were denatured by adding 5X Laemmli buffer (0.3 M Tris-HCl, pH 6.8, 10% w:v SDS, 50% v:v glycerol, 5% v:v β-mercaptoethanol, 5% w:v bromophenol blue) to the samples in a 1:5 ratio and heating the samples for 5 min at 95°C for 12% SDS-PAGE gels or adding 1X NuPAGE LSD sample buffer (Thermo Fisher Scientific, NP007) with 1X sample reducing agent (Thermo Fisher Scientific, B0009) and boiled for 10 min at 70°C . Samples were loaded onto 12% SDS-PAGE gels or 4–12% Bis-Tris gradient gel (Thermo Fisher Scientific, NP0323BOX) and separated by electrophoresis run at 125 V. Proteins were then transferred onto PVDF membranes (Millipore, IPFL00010) at a constant voltage (30 V) for 1 h. The membranes were fixed in 0.4% paraformaldehyde as described previously [Citation117] for 20 min, blocked in Tris-buffered saline (TBS; 50 mM Tris, 150 mM NaCl) containing 5% nonfat dry milk or in Intercept blocking buffer (Li-Cor, 927–60001) for 1 h, and then incubated in primary antibodies overnight (rabbit anti-SNCA/α-synuclein: C-20, Santa Cruz Biotechnology, sc-7011-R, 1:1000; mouse anti-SNCA/α-synuclein: syn-1, BD, 610787, 1:500; rabbit anti-CTSD [kindly provided by Prof. Andrej Hasilik, Philipps-University Marburg, Germany]; mouse anti-CTSD, BD Biosciences, 610800, 1:500; mouse anti-LAMP1: DSHB, H4A3, 1:1000; mouse anti-SQSTM1/p62, Millipore, MABC32; mouse anti-SAPC, Santa Cruz Biotechnology, sc-374118). Antibodies against ACTB/β-actin, TUBB3/βiii-tubulin, GAPDH and NSE were used as a loading control (mouse anti-ACTB, Sigma, A5441, 1:1000; mouse anti-TUBB3, BioLegend, 802001, 1:1000; rabbit anti-GAPDH, Cell signaling Technology, 14C10, 1:1000; ENO2/NSE, BioLegend, 804901, 1:500). Secondary fluorescent-conjugated anti-rabbit or anti-mouse antibodies (Alexa Fluor 680, Thermo Fisher Scientific, A100038; or IRDye800, Li-Cor, 926–32213) were incubated for 1 h after washing of the membranes with TBS-Tween 20 (0.1%). The blots were scanned using the Amersham Typhoon Biomolecular Imager (GE Lifesciences) or Odyssey (LI-COR Biosciences, Lincoln, NE, USA) imaging system. Coomassie Brilliant Blue (CBB)-stained SDS-PAGE-gels were used as additional loading control to check for protein loading. Protein quantification was performed with the Image StudioLite Software (Version 5.2.5, Li-Cor) by densitometry. To acquire signal intensity values, each protein band of interest was selected. For each selected band, total pixel brightness of the selected area, as well as background pixel values of the area surrounding the selections were determined. The protein-specific signal intensity was then calculated by subtracting the background signal from the total selection signal (done automatically by the software). To correct for differences in overall intensity values between replicate experiments (due to variances in the immunoblotting process), each replicate experiment was normalized internally as follows: First, individual signals for a protein of interest were normalized to the mean protein-specific intensity across all samples (done separately for each protein). Then, protein of interest signal was normalized to their respective loading control (GAPDH, ACTB or CBB stained SDS-PAGE gel).
Dot blot analysis
Soluble fractions of whole brain murine samples (see section “Soluble and insoluble SNCA/ α-synuclein fractionation”) were subjected to dot blot analyses under native conditions for conformation specific readouts. After lysis, native samples (20 µg of total protein in 5 µl) were applied onto nitrocellulose membranes (Amersham Biosciences, 10600001), air-dried for 4 hours, blocked in Intercept Blocking Buffer (Li-Cor, 927–60001) for 1 h, and then incubated in primary antibodies overnight (rabbit anti-SNCA/α-synuclein-filament MJFR-14-6-4-2, Abcam, 209538, 1:1000; mouse anti-SNCA/α-synuclein: syn505, Thermo Fisher Scientific, 35–8300; 1:500). Secondary fluorescent-conjugated anti-rabbit antibodies were incubated for 1 h after washing of the membranes with TBS-Tween 20 (0.1%). ACTB antibody or Direct Blue71 (Sigma, 212407), to stain for total protein, were used as a loading control. For Direct Blue71 (total protein) staining, the membrane was washed with water and incubated with 0.008% Direct Blue 71 dye in 40% ethanol and 10% acetic acid for 5 min and again washed three times with water. The blots were scanned using the Amersham Typhoon Biomolecular Imager and protein quantification was performed with the Image StudioLite Software. Quantification of signal intensities was performed as described in the section “Western blot analysis”.
In vitro degradation of SNCA/α-synuclein
In vitro degradation of recombinant SNCA by CTSD was performed in a Triton X-100-based buffer, pH 4.5 or pH 7.4 (50 mM sodium acetate, 0.1 M NaCl, 1 mM EDTA, 5 mM EDTA, 3.5 mM DTT, 0.2% Triton X-100). Recombinant SNCA (2.9 µg; 20 µM) and 0.5 µg of rHsCTSD (0.3 µM) were incubated in a total volume of 10 µl and agitated at 300 rpm 37°C for 1 h or 24 h. After incubation, samples were prepared for SDS-PAGE by adding 4X NuPAGE sample buffer (Thermo Fisher Scientific, NP007) and heating at 85°C for 5 min. Separation was done using a 4–12% Bis-Tris gel (Thermo Fisher Scientific, NP0323BOX) at 120–150 V. For visualization, gels were stained with Coomassie Brilliant Blue G-250 as described by Dyballa and Metzger [Citation118].
Digestion of aggregated recombinant SNCA by recombinant CTSD
The preparation of different SNCA aggregation states (oligomer, fibril) was performed as described in [Citation87]. For the digestion mix, 1.5 µg SNCA (monomers, oligomers or fibrils; final concentration: 3.5 µM) were added to 30 µL buffer (see previous paragraph) alongside 0.65 µg of rHsCTSD (0.3 µM). The mixture was then incubated at 37°C for 1, 24 or 48 h before adding denaturing buffer and heating the samples to 70°C for 5 min. The samples were separated on a 4–12% Bis-Tris via SDS-PAGE and analyzed using CBB staining or western blot. As non-digested controls, reaction mixtures without rHsCTSD were prepared and incubated at 37°C for 48 h.
Imaging analyses
Immunofluorescence staining
H4 cells, DA-iPSn or primary neurons were fixed in 4% paraformaldehyde for 20 min, permeabilized with 0.3% Triton X-100 in PBS for 30 min, then blocked in 2% BSA, 5% FCS in PBS-Triton X-100 for 1 h. Primary antibodies were diluted in blocking buffer and incubated overnight at 4°C (mouse anti-LB509, Abcam, 27,766, 1:100; mouse anti-syn-1, BD, 610787,1:100; rabbit anti-SYN-1/synapsin I, Invitrogen, A6442, 1:50; rabbit anti-CTSD [kindly provided by Prof. Andrej Hasilik, Philipps-University Marburg, Germany], 1:200; mouse anti-LAMP2, DSHB, H4B4, 1:250; rabbit anti-TH, Millipore, 657012, 1:100). Detection was performed with fluorescent donkey anti-rabbit or mouse antibodies with Alexa Fluor 594 (Invitrogen, A21203) or Alexa Fluor 488 (Invitrogen, A21206), diluted 1:500 in blocking buffer. The horizontal slices from mice brain were permeabilized with 0.3% Triton X-100 in PBS for 30 min and blocked in 3% BSA in PBS-Triton X-100. Primary antibodies were diluted in blocking buffer and incubated overnight at 4°C (rabbit anti-SNCA/α-synuclein-filament MJFR 14-6-4-2 1:1000; mouse anti-neurofilament 1:1000; rabbit anti-SNCA/α-synuclein “Acris” [Acris, AP15807] 1:250 and mouse anti-SNCA/α-synuclein syn-1 1:1000). Secondary Alexa Fluor antibodies were diluted 1:300 in blocking buffer. Cells and brain slices were mounted on slides using DAPI-Fluoromount G (SouthernBiotech, 0100–20) and imaged using a confocal laser scanning microscope (IX83, Olympusor ZEISS LSM 780). Images belonging to the same experiments were taken at same settings for comparability. Digital images were processed using Imspector Image Acquisition and Analysis Software (Abberior Instruments) or ZEN software (Zeiss). All analyses of immunofluorescence pictures were performed using the ImageJ Software. Images were adjusted equally to allow for direct comparison. For colocalization analysis, H4 cells and neurons were marked by a region of interest and colocalization of two stainings was determined by the Pearson correlation coefficient [Citation119]. Positive values described a positive correlation between both stainings (colocalization). The levels for SNCA, CTSD and SYN-1 were analyzed by quantification of the fluorescence intensity signal in a region of interest. Analyses of SNCA aggregates found in the mouse brain was done semi-automatically by thresholding to a similar fluorescence intensity for length measurement (µm). Each aggregate was then measured manually by drawing a straight line from top to bottom. Next, a region of interest was marked around each aggregate to quantify the SNCA intensity. Analyses of SYN-1-positive vesicles size found in primary neurons and DA-iPSn was done as described for SNCA aggregates by thresholding to a similar fluorescence intensity for counting and length measurement. The neurite/neuronal structures, where the SYN-1-positive vesicles were found, were measured by length. The total number of SYN-1-positive vesicles was divided by the length of the analyzed structure.
Structured Illumination Microscopy (SIM)
DA-iPSn and primary neurons were fixed, permeabilized, blocked and incubated with primary as well as secondary antibodies as described in section “Immunofluorescence staining”. The following primary antibodies were used for structured illumination microscopy: mouse anti-SNCA/α-synuclein (LB509, 1:100; Abcam, 27766 and syn-1, 1:100, BD, 610787) and rabbit anti-SYN-1/synapsin I (1:50, Invitrogen, A6442). As secondary antibodies fluorescent anti-rabbit or mouse with Alexa Fluor 594 or Alexa Fluor 488 were used. Immunostained primary neurons and DA-iPSn were imaged on a commercial Zeiss ELYRA 7 system with ZEN software applying new SIM2 algorithm. Imaging was performed using a Plan-Apochromat 63x/1.40 oil immersion objective. After excitation with suitable laser lines (488 nm and 561 nm) signals were recorded applying 13 phase transitions and resulting signals were passed through respective emission filter sets to be recorded on a sCMOS camera (PCO edge, 4.2 M). The image was reconstructed in ZEN software (ZEN black, Carl Zeiss Microscopy GmbH, Jena, Germany) and for correction of aberration channel alignment was performed applying affine transformations in ZEN software generated from z-stacks recorded from tetraspeck beads (Invitrogen). In FIJI [Citation120], brightness and contrast of exemplary SIM images were adjusted linearly.
Transmission electron microscopy analysis
To visualize SNCA fibril formation after the 2nd round of the in vitro SNCA seeding assay (see section “In vitro SNCA seeding assay”) or after 24 h SNCA fibril digest by rHsCTSD (see section “Digestion of recombinant SNCA/α-synuclein aggregations states by recombinant CTSD), samples were analyzed by negative-stain transmission electron microscopy (TEM). Negative-stain TEM was performed as previously described [Citation121,Citation122]. Briefly, 5 µl of each sample were applied on a previously negative glow discharged (25 mA for 30s) carbon coated electron microscopy (EM) grid (Science Service Munich, ECF300-Cu-50). Access sample was removed using filter paper followed by immediate staining with 5 µl of a 1% aqueous uranyl acetate solution (Science Service Munich, E22400) that was washed over the grid two times. Here, the excess solution was blotted from the edge of the EM grid with filter paper before air drying. TEM micrographs were recorded using a JEOL 1400 Plus TEM (JEOL Germany, Munich, Germany), operating at 100 kV with magnifications of 30.000x to 50.0000x.
For ultrastructural analysis of DA-iPSn, cells were grown on plastic support layers. Cells were fixed in ITO buffer (2.5% PFA, 2.5% glutaraldehyde, 0.1% picric acid in 0.1 M cacodylate buffer, pH 7.3) and then processed following standard protocol for embedding in epon (Roth, 8619.2) [Citation123]. After removal of the plastic support layer using a temperature shock applying liquid nitrogen, samples were sectioned (Ultracut R, Eichert-Jung, Wien, Austria) and contrasted using uranyl acetate. TEM images were acquired using a JEOL 1400Plus TEM (JEOL Germany, Munich, Germany) operating at 120 kV at 2000x magnification. For quantification of intracellular vesicles, individual cell borders were masked out (ImageJ) and the cell area was measured. Vesicles were counted and then the quotient between these and the cell area (in µm2) was calculated.
Mass spectrometry analyses
Sample preparation
For mass spectrometry (MS) analysis 25 µg of DA-iPSn derived-lysosomal enriched fractions (described in section “Lysosomal enrichment”) were boiled in 1X NuPAGE LSD sample buffer (Thermo Fisher Scientific, NP007) with 100 mM DTT at 70°C for 10 min. The 25 µg proteins were run on the 10% SDS PAGE for 10 min at 180 V to allow the proteins to move into the resolving gel and then proteins were fixated in the gel for 15 min in a 7% acetic acid, 40% methanol solution. The gels were subsequently stained for 15 min with a solution of 0.25% Coomassie Brilliant Blue G-250 (Roth, 9598.1), 7% acetic acid and 45% ethanol. The gels were washed several times with deionized water on the shaker to remove excess dye. The in-gel digestion was performed in principle as described previously [Citation124] and detailed as follows: Each gel lane was cut separately using the new sharp scalpel and then minced and transferred to the Eppendorf tubes. Gel pieces were destained (50% ethanol in 25 mM NH4HCO3) for 15 min to remove the Coomassie dye. The supernatant was removed and the gel pieces were dehydrated by adding 100% acetonitrile for 10 min on the rotator. The acetonitrile was dispensed off by pipetting and the samples were dried to completion using a vacuum evaporator (Eppendorf). The dried samples were rehydrated and disulfide bonds in the proteins were reduced using reduction buffer (10 mM DTT in 50 mM NH4HCO3, pH 8.0) for 1 h at 56°C. Buffer was removed by pipetting and cysteine residues of proteins were subsequently alkylated with 50 mM iodoacetamide in 50 mM NH4HCO3, pH 8.0 for 45 min at room temperature in the dark. Samples were dehydrated again by adding 100% acetonitrile and dried by vacuum evaporation. The vacuum dried gel slices were incubated with 1 µg trypsin per tube in 50 mM triethylammonium bicarbonate buffer pH 8.0 at 37°C overnight. Digested peptides were extracted twice by adding 150 µl of 30% acetonitrile and the supernatant containing the digested peptides was transferred to the new Eppendorf tube. The second time, the peptide extraction was done by adding 150 µl of 100% acetonitrile to the gel pieces for 15 min at 25°C agitating at 1,400 rpm in a shaker (Eppendorf) and the supernatant was transferred to the previous Eppendorf tube. The reductive demethylation step was performed as described previously [Citation125]. Each sample pair including a replicate was switched with the dimethyl labels. Equal amounts of peptides from all labeled samples were mixed and the purification and desalting of the peptides was done using the C18 stage-tips (M3 company) as previously described [Citation126]. The eluted peptides were loaded on the silica column of 75 µm inner diameter (New Objective, FS360-75-8-N-5-C30) packed to 25-cm length with 1.9-µm C18 ReproSil beads (Dr. Maisch GmbH, 11-1-9- aq.0001) using the EasyLC1000 liquid chromatography (Thermo Fisher Scientific).
Mass spectrometry and data analysis
Peptides were separated on the C18 column using an EasyLC1000 HPLC (Thermo Fisher Scientific) with the following 5 h reversed-phase chromatography gradient: 0–4 min, 2–5% solvent B; 4–197 min, 5–22% solvent B; 197–268 min, 22–40% solvent B; 268–272 min, 40–95% solvent B; 272–277 min, 95% solvent B; 277–281 min, 95–2% solvent B; and 281–285 min, 2% solvent B (solvent A: 0.1% formic acid, solvent B: 80% acetonitrile containing 0.1% formic acid) and directly sprayed into a Q-Exactive Plus mass spectrometer (Thermo Fisher Scientific) for the data acquisition. The mass spectrometer was operated in the positive ion scan mode with a full scan resolution of 70,000; AGC target 3x10⁶; max. IT = 20 ms; Scan range 300–1650 m/z with a top10 MS/MS DDA method. Normalized collision energy was set to 25 and MS/MS scan mode operated at a resolution of 17,000; AGC target 1 × 10⁵ and max IT of 120 ms.
For the proteomics data analysis, RAW data was analyzed using the MaxQuant search engine (version 1.6.10.43) with the default parameters except for the following changes in the settings. For the dimethyl double label search, Dimethyl Lys0 and Dimethyl Nter0 modifications were set for the light labels and the Dimethyl Lys4 and Dimethyl Nter4 modifications were set for the heavy labels in the group specific standard parameters. Match between runs (MBR) and Re-quantify parameter options were disabled. The search was performed against the Human Uniprot reference database version UP000005640 containing ~98,000 sequences.
The results were then filtered for minimum of 2 peptides per protein group (one unique) and reverse database binders, also known contaminants and proteins only identified by site modification were removed.
Neurophysiological analyses
Microelectrode array (MEA) analysis
To determine neuronal network activity of the DA-iPSn after treatment with 10 µg/mL rHsCTSD, cells were plated on poly-D-lysine (1 mg/ml, Sigma P1149)- and laminin (100X; Merck, 11243217001)-coated 48-well MEA plate (Axion Biosystems, M768-tMEA-48 W) on day 26 after induction of differentiation at a density of 30–80,000 neurons/well dotted on the electrode grid. A53T corr. neurons were plated on 16- and A53T mutants were plated on 32 wells of the 48 well MEA plate. Half of the A53T mutant neurons were treated with rHsCTSD, and the other half with PBS. Cells were fed with fresh medium every four days for 14 days. Extracellular spontaneous neuronal spikes were recorded for 5 min in culture medium at 37°C, 95% O2 and 5% CO2 using a MEA Maestro and AxIS software (both Axion Biosystems). The signal was sampled at a rate of 12.5 kHz with a hardware frequency bandwidth of 200–5000 Hz and subsequently digitally filtered using a single-order Butterworth band-pass filter (200 Hz-3000 Hz). The adaptive threshold for spike detection was set to 5.5 Standard deviation over the background noise of each electrode. An active electrode was defined as an electrode with spike rates ≥ 5 spikes/min. Spike histograms were generated using the neural metric tool from Axion Biosystems. Burst networks were calculated using the envelope algorithm setting the threshold factor at 1.25, a minimum inter burst interval of 100 ms, the minimal amount of electrodes participating in the burst of 50%, and 75% burst inclusion.
Statistical analysis
For statistical analysis, GraphPad Prism version 8 (Graph Pad Software, Inc., San Diego, USA) was used. Data were analyzed with one-way analysis of variance (ANOVA) followed by Dunnett’s or Tukey’s post hoc test for multiple comparisons or with two-sided, unpaired Student’s t-test for two groups comparisons. Data are expressed as mean ± SEM. P < 0.05 was considered statistically significant.
Supplemental Material
Download PDF (957.8 KB)Supplemental Material
Download PDF (13.8 MB)Acknowledgments
We acknowledge Melanie Boss, Jessica Falkowski, Dwayne Götze, Lina Schmidt (all CAU Kiel) and Julia Vandrey, and Dr. Johanna Kaindl (University Hospital Erlangen) for excellent technical support and the Institute of Anatomy, University of Kiel for the support with the confocal laser microscope.
Disclosure statement
Orfo Neuro ApS develops products related to lysosomal storage disorders and enzyme replacement therapies. Authors did not receive funding from Orfo Neuro ApS for this study.
Supplementary material
Supplemental data for this article can be accessed here
Additional information
Funding
Related Research Data
References
- Baba M, Nakajo S, Tu PH, et al. Aggregation of alpha-synuclein in Lewy bodies of sporadic Parkinson’s disease and dementia with Lewy bodies. Am J Pathol. 1998 Apr;152(4):879–884.
- Kalia LV, Lang AE. Parkinson’s disease. Lancet. 2015 Aug 29;386(9996):896–912.
- Lees AJ, Hardy J, Revesz T. Parkinson’s disease. Lancet. 2009 Jun 13;373(9680):2055–2066.
- Soldner F, Stelzer Y, Shivalila CS, et al. Parkinson-associated risk variant in distal enhancer of alpha-synuclein modulates target gene expression. Nature. 2016 May 5;533(7601):95–99.
- Nalls MA, Pankratz N, Lill CM, et al. Large-scale meta-analysis of genome-wide association data identifies six new risk loci for Parkinson’s disease. Nat Genet. 2014 Sep;46(9):989–993.
- Conway KA, Harper JD, Lansbury PT. Accelerated in vitro fibril formation by a mutant alpha-synuclein linked to early-onset Parkinson disease. Nat Med. 1998 Nov;4(11):1318–1320.
- Polymeropoulos MH, Lavedan C, Leroy E, et al. Mutation in the alpha-synuclein gene identified in families with Parkinson’s disease. Science. 1997 Jun 27;276(5321):2045–2047.
- Chartier-Harlin MC, Kachergus J, Roumier C, et al. alpha-synuclein locus duplication as a cause of familial Parkinson’s disease. Lancet. 2004 Sep 25;364(9440):1167–1169.
- Singleton AB, Farrer M, Johnson J, et al. alpha-Synuclein locus triplication causes Parkinson’s disease. Science. 2003 Oct 31;302(5646):841.
- Moors T, Paciotti S, Chiasserini D, et al. Lysosomal dysfunction and alpha-Synuclein aggregation in Parkinson’s disease: diagnostic links. Mov Disord. 2016 Jun;31(6):791–801.
- Wong YC, Krainc D. Lysosomal trafficking defects link Parkinson’s disease with gaucher’s disease. Mov Disord. 2016 Nov;31(11):1610–1618.
- Di Fonzo A, Chien HF, Socal M, et al. ATP13A2 missense mutations in juvenile parkinsonism and young onset Parkinson disease. Neurology. 2007 May 8;68(19):1557–1562.
- Ramirez A, Heimbach A, Grundemann J, et al. Hereditary parkinsonism with dementia is caused by mutations in ATP13A2, encoding a lysosomal type 5 P-type ATPase. Nat Genet. 2006 Oct;38(10):1184–1191.
- Robak LA, Jansen IE, van Rooij J, et al. Excessive burden of lysosomal storage disorder gene variants in Parkinson’s disease. Brain. 2017 Dec 1;140(12):3191–3203.
- Chang D, Nalls MA, Hallgrimsdottir IB, et al. A meta-analysis of genome-wide association studies identifies 17 new Parkinson’s disease risk loci. Nat Genet. 2017 Oct;49(10):1511–1516.
- Sidransky E, Nalls MA, Aasly JO, et al. Multicenter analysis of glucocerebrosidase mutations in Parkinson’s disease. N Engl J Med. 2009 Oct 22;361(17):1651–1661.
- Migdalska-Richards A, Schapira AHV. The relationship between glucocerebrosidase mutations and Parkinson disease. J Neurochem. 2016 Oct;139:77–90.
- Gordon PB, Hoyvik H, Seglen PO. Prelysosomal and lysosomal connections between autophagy and endocytosis. Biochem J. 1992 Apr 15;283:361–369.
- Saftig P, Klumperman J. Lysosome biogenesis and lysosomal membrane proteins: trafficking meets function. Nat Rev Mol Cell Biol. 2009 Sep;10(9):623–635.
- Jackson MP, Hewitt EW. Cellular proteostasis: degradation of misfolded proteins by lysosomes. Essays Biochem. 2016 Oct 15;60(2):173–180.
- Galluzzi L, Baehrecke EH, Ballabio A, et al. Molecular definitions of autophagy and related processes. EMBO J. 2017 Jul 3;36(13):1811–1836.
- Bellomo G, Paciotti S, Gatticchi L, et al. The vicious cycle between alpha-synuclein aggregation and autophagic-lysosomal dysfunction. Mov Disord. 2020 Jan;35(1):34–44.
- Xilouri M, Stefanis L. Chaperone mediated autophagy to the rescue: a new-fangled target for the treatment of neurodegenerative diseases. Mol Cell Neurosci. 2015 May;66(Pt A):29–36.
- Webb JL, Ravikumar B, Atkins J, et al. alpha-synuclein is degraded by both autophagy and the proteasome. J Biol Chem. 2003 Jul 4;278(27):25009–25013.
- Cuervo AM, Stefanis L, Fredenburg R, et al. Impaired degradation of mutant alpha-synuclein by chaperone-mediated autophagy. Science. 2004 Aug 27;305(5688):1292–1295.
- Vogiatzi T, Xilouri M, Vekrellis K, et al. Wild type alpha-synuclein is degraded by chaperone-mediated autophagy and macroautophagy in neuronal cells. J Biol Chem. 2008 Aug 29;283(35):23542–23556.
- Xilouri M, Brekk OR, Stefanis L. alpha-Synuclein and protein degradation systems: a reciprocal relationship. Mol Neurobiol. 2013 Apr;47(2):537–551.
- Stoka V, Turk V, Turk B. Lysosomal cathepsins and their regulation in aging and neurodegeneration. Ageing Res Rev. 2016 Dec;32:22–37.
- Tofaris GK, Kim HT, Hourez R, et al. Ubiquitin ligase Nedd4 promotes alpha-synuclein degradation by the endosomal-lysosomal pathway. Proc Natl Acad Sci U S A. 2011 Oct 11;108(41):17004–17009.
- Bennett MC, Bishop JF, Leng Y, et al. Degradation of alpha-synuclein by proteasome. J Biol Chem. 1999 Nov 26;274(48):33855–33858.
- von Figura K, Hasilik A. Lysosomal enzymes and their receptors. Annu Rev Biochem. 1986;55:167–193.
- Boonen M, Staudt C, Gilis F, et al. Cathepsin D and its newly identified transport receptor SEZ6L2 can modulate neurite outgrowth. J Cell Sci. 2016 Feb 1;129(3):557–568.
- Canuel M, Korkidakis A, Konnyu K, et al. Sortilin mediates the lysosomal targeting of cathepsins D and H. Biochem Biophys Res Commun. 2008 Aug 22;373(2):292–297.
- Zaidi N, Maurer A, Nieke S, et al. Cathepsin D: a cellular roadmap. Biochem Biophys Res Commun. 2008 Nov 7;376(1):5–9.
- Koike M, Nakanishi H, Saftig P, et al. Cathepsin D deficiency induces lysosomal storage with ceroid lipofuscin in mouse CNS neurons. J Neurosci. 2000 Sep 15;20(18):6898–6906.
- Nakanishi H, Zhang J, Koike M, et al. Involvement of nitric oxide released from microglia-macrophages in pathological changes of cathepsin D-deficient mice. J Neurosci. 2001 Oct 1;21(19):7526–7533.
- Saftig P, Hetman M, Schmahl W, et al. Mice deficient for the lysosomal proteinase cathepsin D exhibit progressive atrophy of the intestinal mucosa and profound destruction of lymphoid cells. EMBO J. 1995 Aug 1;14(15):3599–3608.
- Koike M, Shibata M, Waguri S, et al. Participation of autophagy in storage of lysosomes in neurons from mouse models of neuronal ceroid-lipofuscinoses (batten disease). Am J Pathol. 2005 Dec;167(6):1713–1728.
- Shachar T, Lo Bianco C, Recchia A, et al. Lysosomal storage disorders and Parkinson’s disease: gaucher disease and beyond. Mov Disord. 2011 Aug 1;26(9):1593–1604.
- Klein AD, Mazzulli JR. Is Parkinson’s disease a lysosomal disorder? Brain. 2018 Aug 1;141(8):2255–2262.
- McGlinchey RP, Lee JC. Cysteine cathepsins are essential in lysosomal degradation of alpha-synuclein. Proc Natl Acad Sci U S A. 2015 Jul 28;112(30):9322–9327.
- Sevlever D, Jiang PZ, Yen SHC. Cathepsin D is the main lysosomal enzyme involved in the degradation of alpha-synuclein and generation of its carboxy-terminally truncated species. Biochemistry. 2008 Sep 9;47(36):9678–9687.
- Vidoni C, Follo C, Savino M, et al. The role of cathepsin d in the pathogenesis of human neurodegenerative disorders. Med Res Rev. 2016 Sep;36(5):845–870.
- Cullen V, Lindfors M, Ng J, et al. Cathepsin D expression level affects alpha-synuclein processing, aggregation, and toxicity in vivo. Mol Brain. 2009 Feb 9;2:5.
- Bae EJ, Yang NY, Lee C, et al. Haploinsufficiency of cathepsin D leads to lysosomal dysfunction and promotes cell-to-cell transmission of alpha-synuclein aggregates. Cell Death Dis. 2015 Oct 8;6:e1901.
- Hossain MI, Marcus JM, Lee JH, et al. Restoration of CTSD (cathepsin D) and lysosomal function in stroke is neuroprotective. Autophagy. 2020 May 27;17(5):1330–1348.
- Marques ARA, Di Spiezio A, Thiessen N, et al. Enzyme replacement therapy with recombinant pro-CTSD (cathepsin D) corrects defective proteolysis and autophagy in neuronal ceroid lipofuscinosis. Autophagy. 2020 May 3;16(5):811–825.
- Qiao LY, Hamamichi S, Caldwell KA, et al. Lysosomal enzyme cathepsin D protects against alpha-synuclein aggregation and toxicity. Mol Brain. 2008:1.
- Marques ARA, Saftig P. Lysosomal storage disorders - challenges, concepts and avenues for therapy: beyond rare diseases. J Cell Sci. 2019 Jan 16;132(2).
- Cuddy LK, Wani WY, Morella ML, et al. Stress-induced cellular clearance is mediated by the SNARE protein ykt6 and disrupted by alpha-synuclein. Neuron. 2019 Dec 4;104(5):869–884 e11.
- Stojkovska I, Wani WY, Zunke F, et al. Rescue of alpha-synuclein aggregation in Parkinson’s patient neurons by synergistic enhancement of ER proteostasis and protein trafficking. Neuron. 2021 Nov 9.
- den Heijer JM, Kruithof AC, van Amerongen G, et al. A randomized single and multiple ascending dose study in healthy volunteers of LTI-291, a centrally penetrant glucocerebrosidase activator. Br J Clin Pharmacol. 2021 Sep;87(9):3561–3573.
- Zunke F, Moise AC, Belur NR, et al. Reversible conformational conversion of alpha-Synuclein into toxic assemblies by glucosylceramide. Neuron. 2018 Jan 3;97(1):92–107 e10.
- Fredriksen K, Aivazidis S, Sharma K, et al. Pathological alpha-syn aggregation is mediated by glycosphingolipid chain length and the physiological state of alpha-syn in vivo. Proc Natl Acad Sci U S A. 2021 Dec 14;118(50). https://doi.org/10.1073/pnas.2108489118.
- Peterschmitt MJ, Saiki H, Hatano T, et al. Safety, Pharmacokinetics, and pharmacodynamics of oral venglustat in patients with parkinson’s disease and a GBA Mutation: results from part 1 of the randomized, double-blinded, placebo-controlled MOVES-PD trial. J Parkinsons Dis. 2021 Dec 10;10(1):86–98.
- Li M. Enzyme replacement therapy: a review and its role in treating lysosomal storage diseases. Pediatr Ann. 2018 May 1;47(5):e191–e197.
- Mazzulli JR, Xu YH, Sun Y, et al. Gaucher disease glucocerebrosidase and alpha-synuclein form a bidirectional pathogenic loop in synucleinopathies. Cell. 2011 Jul 8;146(1):37–52.
- Mazzulli JR, Zunke F, Isacson O, et al. alpha-Synuclein-induced lysosomal dysfunction occurs through disruptions in protein trafficking in human midbrain synucleinopathy models. Proc Natl Acad Sci U S A. 2016 Feb 16;113(7):1931–1936.
- Hiraiwa M, Martin BM, Kishimoto Y, et al. Lysosomal proteolysis of prosaposin, the precursor of saposins (sphingolipid activator proteins): its mechanism and inhibition by ganglioside. Arch Biochem Biophys. 1997 May 1;341(1):17–24.
- Tayebi N, Lopez G, Do J, et al. Pro-cathepsin D, prosaposin, and progranulin: lysosomal networks in parkinsonism. Trends Mol Med. 2020 Oct;26(10):913–923.
- Lieberman AP, Puertollano R, Raben N, et al. Autophagy in lysosomal storage disorders. Autophagy. 2012 May 1;8(5):719–730.
- Bonam SR, Wang F, Muller S. Lysosomes as a therapeutic target. Nat Rev Drug Discov. 2019 Dec;18(12):923–948.
- Soldner F, Laganiere J, Cheng AW, et al. Generation of isogenic pluripotent stem cells differing exclusively at two early onset Parkinson point mutations. Cell. 2011 Jul 22;146(2):318–331.
- Lassen LB, Gregersen E, Isager AK, et al. ELISA method to detect alpha-synuclein oligomers in cell and animal models. PLoS One. 2018;13(4):e0196056.
- Schechter I, Ziv E, Cathepsins S. B and L with aminopeptidases display beta-secretase activity associated with the pathogenesis of Alzheimer’s disease. Biol Chem. 2011 Apr;392(6):555–569.
- Chevallier N, Vizzavona J, Marambaud P, et al. Cathepsin D displays in vitro beta-secretase-like specificity. Brain Res. 1997 Mar 7;750(1–2):11–19.
- Ladror US, Snyder SW, Wang GT, et al. Cleavage at the amino and carboxyl termini of Alzheimer’s amyloid-beta by cathepsin D. J Biol Chem. 1994 Jul 15;269(28):18422–18428.
- Kenessey A, Nacharaju P, Ko LW, et al. Degradation of tau by lysosomal enzyme cathepsin D: implication for Alzheimer neurofibrillary degeneration. J Neurochem. 1997 Nov;69(5):2026–2038.
- Khurana V, Elson-Schwab I, Fulga TA, et al. Lysosomal dysfunction promotes cleavage and neurotoxicity of tau in vivo. PLoS Genet. 2010 Jul 15;6(7):e1001026.
- Lewis PA, Properzi F, Prodromidou K, et al. Removal of the glycosylphosphatidylinositol anchor from PrP(Sc) by cathepsin D does not reduce prion infectivity. Biochem J. 2006 Apr 15;395(2):443–448.
- Kovacs GG, Gelpi E, Strobel T, et al. Involvement of the endosomal-lysosomal system correlates with regional pathology in creutzfeldt-jakob disease. J Neuropathol Exp Neurol. 2007 Jul;66(7):628–636.
- Offenhauser C, Lei N, Roy S, et al. Syntaxin 11 binds Vti1b and regulates late endosome to lysosome fusion in macrophages. Traffic. 2011 Jun;12(6):762–773.
- Zhang A, He X, Zhang L, et al. Biogenesis of lysosome-related organelles complex-1 subunit 1 (BLOS1) interacts with sorting nexin 2 and the endosomal sorting complex required for transport-I (ESCRT-I) component TSG101 to mediate the sorting of epidermal growth factor receptor into endosomal compartments. J Biol Chem. 2014 Oct 17;289(42):29180–29194.
- van der Sluijs P, Hull M, Webster P, et al. The small GTP-binding protein rab4 controls an early sorting event on the endocytic pathway. Cell. 1992 Sep 4;70(5):729–740.
- Shevtsova Z, Garrido M, Weishaupt J, et al. CNS-expressed cathepsin D prevents lymphopenia in a murine model of congenital neuronal ceroid lipofuscinosis. Am J Pathol. 2010 Jul;177(1):271–279.
- Duda JE, Giasson BI, Mabon ME, et al. Novel antibodies to synuclein show abundant striatal pathology in Lewy body diseases. Ann Neurol. 2002 Aug;52(2):205–210.
- Burre J. The synaptic function of alpha-Synuclein. J Parkinsons Dis. 2015;5(4):699–713.
- Wang L, Das U, Scott DA, et al. alpha-synuclein multimers cluster synaptic vesicles and attenuate recycling. Curr Biol. 2014 Oct 6;24(19):2319–2326.
- Sulzer D, Edwards RH. The physiological role of alpha-synuclein and its relationship to Parkinson’s disease. J Neurochem. 2019 Sep;150(5):475–486.
- Sun J, Wang L, Bao H, et al. Functional cooperation of alpha-synuclein and VAMP2 in synaptic vesicle recycling. Proc Natl Acad Sci U S A. 2019 Jun 4;116(23):11113–11115.
- Futerman AH, van Meer G. The cell biology of lysosomal storage disorders. Nat Rev Mol Cell Biol. 2004 Jul;5(7):554–565.
- Kulkarni A, Chen J, Maday S. Neuronal autophagy and intercellular regulation of homeostasis in the brain. Curr Opin Neurobiol. 2018 Aug;51:29–36.
- Tayebi N, Walker J, Stubblefield B, et al. Gaucher disease with parkinsonian manifestations: does glucocerebrosidase deficiency contribute to a vulnerability to parkinsonism? Mol Genet Metab. 2003 Jun;79(2):104–109.
- Halperin A, Elstein D, Zimran A. Increased incidence of Parkinson disease among relatives of patients with gaucher disease. Blood Cell Mol Dis. 2006May-Jun;36(3):426–428.
- Liang Q, Ouyang X, Schneider L, et al. Reduction of mutant huntingtin accumulation and toxicity by lysosomal cathepsins D and B in neurons. Mol Neurodegener. 2011 Jun 1;6:37.
- Kim YJ, Sapp E, Cuiffo BG, et al. Lysosomal proteases are involved in generation of N-terminal huntingtin fragments. Neurobiol Dis. 2006 May;22(2):346–356.
- Eymsh B, Drobny A, Heyn TR, et al. Toxic metamorphosis-how changes from lysosomal to cytosolic pH modify the alpha-Synuclein aggregation pattern. Biomacromolecules. 2020 Dec 14;21(12):4673–4684.
- Candelise N, Schmitz M, Thune K, et al. Effect of the micro-environment on alpha-synuclein conversion and implication in seeded conversion assays. Transl Neurodegener. 2020;9:5.
- Wong YC, Krainc D. alpha-synuclein toxicity in neurodegeneration: mechanism and therapeutic strategies. Nat Med. 2017 Feb 7;23(2):1–13.
- Siintola E, Partanen S, Stromme P, et al. Cathepsin D deficiency underlies congenital human neuronal ceroid-lipofuscinosis. Brain. 2006 Jun;129(Pt 6):1438–1445.
- Bunk J, Prieto Huarcaya S, Drobny A, et al. Cathepsin D variants associated with neurodegenerative diseases show dysregulated functionality and modified alpha-Synuclein degradation properties. Front Cell Dev Biol. 2021;9:581805.
- Pastores GM. Therapeutic approaches for lysosomal storage diseases. Ther Adv Endocrinol Metab. 2010 Aug;1(4):177–188.
- Desnick RJ, Schuchman EH. Enzyme replacement therapy for lysosomal diseases: lessons from 20 years of experience and remaining challenges. Annu Rev Genomics Hum Genet. 2012;13:307–335.
- Vilchez D, Saez I, Dillin A. The role of protein clearance mechanisms in organismal ageing and age-related diseases. Nat Commun. 2014 Dec 8;5:5659.
- Karpowicz RJ Jr., Trojanowski JQ, Lee VM. Transmission of alpha-synuclein seeds in neurodegenerative disease: recent developments. Lab Invest. 2019 Jul;99(7):971–981.
- Schaeffer E, Kluge A, Bottner M, et al. Alpha synuclein connects the gut-brain axis in Parkinson’s disease patients - a view on clinical aspects, cellular pathology and analytical methodology. Front Cell Dev Biol. 2020;8:573696.
- Dilsizoglu Senol A, Samarani M, Syan S, et al. alpha-Synuclein fibrils subvert lysosome structure and function for the propagation of protein misfolding between cells through tunneling nanotubes. PLoS Biol. 2021 Jul;19(7):e3001287.
- Victoria GS, Zurzolo C. The spread of prion-like proteins by lysosomes and tunneling nanotubes: implications for neurodegenerative diseases. J Cell Biol. 2017 Sep 4;216(9):2633–2644.
- Larson ME, Greimel SJ, Amar F, et al. Selective lowering of synapsins induced by oligomeric alpha-synuclein exacerbates memory deficits. Proc Natl Acad Sci U S A. 2017 Jun 6;114(23):E4648–E4657.
- Nemani VM, Lu W, Berge V, et al. Increased expression of alpha-synuclein reduces neurotransmitter release by inhibiting synaptic vesicle reclustering after endocytosis. Neuron. 2010 Jan 14;65(1):66–79.
- Atias M, Tevet Y, Sun J, et al. Synapsins regulate alpha-synuclein functions. Proc Natl Acad Sci U S A. 2019 Jun 4;116(23):11116–11118.
- Betzer C, Movius AJ, Shi M, et al. Identification of synaptosomal proteins binding to monomeric and oligomeric alpha-synuclein. PLoS One. 2015;10(2):e0116473.
- Mazzulli JR, Zunke F, Tsunemi T, et al. Activation of beta-glucocerebrosidase reduces pathological alpha-synuclein and restores lysosomal function in Parkinson’s patient midbrain neurons. J Neurosci. 2016 Jul 20;36(29):7693–7706.
- Tamargo RJ, Velayati A, Goldin E, et al. The role of saposin C in Gaucher disease. Mol Genet Metab. 2012 Jul;106(3):257–263.
- Amar Bencheikh B O, Leveille E, Ruskey JA, et al. Sequencing of the GBA coactivator, saposin C, in Parkinson disease. Neurobiol Aging. 2018 Dec;72:187 e1–187 e3.
- Schulz A, Ajayi T, Specchio N, et al. Study of intraventricular cerliponase Alfa for CLN2 disease. N Engl J Med. 2018 May 17;378(20):1898–1907.
- Kohlschutter A, Schulz A. CLN2 disease (classic late infantile neuronal ceroid lipofuscinosis). Pediatr Endocrinol Rev. 2016 Jun;13 Suppl 1:682–688.
- Worgall S, Kekatpure MV, Heier L, et al. Neurological deterioration in late infantile neuronal ceroid lipofuscinosis. Neurology. 2007 Aug 7;69(6):521–535.
- Pardridge WM. Blood-brain barrier and delivery of protein and gene therapeutics to brain. Front Aging Neurosci. 2019;11:373.
- Phenix CP, Togtema M, Pichardo S, et al. High intensity focused ultrasound technology, its scope and applications in therapy and drug delivery. J Pharm Pharm Sci. 2014;17(1):136–153.
- LeWitt PA, Lipsman N, Kordower JH. Focused ultrasound opening of the blood-brain barrier for treatment of Parkinson’s disease. Mov Disord. 2019 Sep;34(9):1274–1278.
- Sun Y, Liou B, Chu Z, et al. Systemic enzyme delivery by blood-brain barrier-penetrating SapC-DOPS nanovesicles for treatment of neuronopathic Gaucher disease. EBioMedicine. 2020 May;55:102735.
- Kriks S, Shim JW, Piao J, et al. Dopamine neurons derived from human ES cells efficiently engraft in animal models of Parkinson’s disease. Nature. 2011 Nov 6;480(7378):547–551.
- Seibenhener ML, Wooten MW. Isolation and culture of hippocampal neurons from prenatal mice. J Vis Exp. 2012. Jul. 26. 65. https://doi.org/10.3791/3634
- Xiang W, Schlachetzki JC, Helling S, et al. Oxidative stress-induced posttranslational modifications of alpha-synuclein: specific modification of alpha-synuclein by 4-hydroxy-2-nonenal increases dopaminergic toxicity. Mol Cell Neurosci. 2013 May;54:71–83.
- Stojkovska I, Mazzulli JR. Detection of pathological alpha-synuclein aggregates in human iPSC-derived neurons and tissue. STAR Protoc. 2021; Mar,;19 2(1):100372. doi
- Lee BR, Kamitani T. Improved immunodetection of endogenous alpha-synuclein. PLoS One. 2011;6(8):e23939.
- Dyballa N, Metzger S. Fast and sensitive colloidal coomassie G-250 staining for proteins in polyacrylamide gels. J Vis Exp. 2009 Aug;3(30):1431.
- Pearson K. Determination of the coefficient of correlation. Science. 1909 Jul 2;30(757):23–25.
- Schindelin J, Arganda-Carreras I, Frise E, et al. Fiji: an open-source platform for biological-image analysis. Nat Methods. 2012 Jun 28;9(7):676–682.
- Arnold P, Himmels P, Weiss S, et al. Antigenic and 3D structural characterization of soluble X4 and hybrid X4-R5 HIV-1 Env trimers. Retrovirology. 2014 May 30;11:42.
- Luckstadt W, Bub S, Koudelka T, et al. cell surface processing of cd109 by meprin beta leads to the release of soluble fragments and reduced expression on extracellular vesicles. Front Cell Dev Biol. 2021;9:622390.
- Foggetti A, Baccini G, Arnold P, et al. Spiny and non-spiny parvalbumin-positive hippocampal interneurons show different plastic properties. Cell Rep. 2019 Jun 25;27(13):3725–3732 e5.
- Shevchenko A, Tomas H, Havlis J, et al. In-gel digestion for mass spectrometric characterization of proteins and proteomes. Nat Protoc. 2006;1(6):2856–2860.
- Boersema PJ, Raijmakers R, Lemeer S, et al. Multiplex peptide stable isotope dimethyl labeling for quantitative proteomics. Nat Protoc. 2009;4(4):484–494.
- Rappsilber J, Mann M, Ishihama Y. Protocol for micro-purification, enrichment, pre-fractionation and storage of peptides for proteomics using StageTips. Nat Protoc. 2007;2(8):1896–1906.