
ABSTRACT
Idiopathic pulmonary fibrosis (IPF) is characterized by lung scarring and has no effective treatment. Fibroblast-to-myofibroblast differentiation and myofibroblast proliferation and migration are major clinical manifestations of this disease; hence, blocking these processes is a practical treatment strategy. Here, highly upregulated LINC00941/lncIAPF was found to accelerate pulmonary fibrosis by promoting fibroblast-to-myofibroblast differentiation and myofibroblast proliferation and migration. Assay for transposase-accessible chromatin using sequencing and chromatin immunoprecipitation experiments elucidated that histone 3 lysine 27 acetylation (H3K27ac) activated the chromosome region opening in the LINC00941 promoter. As a consequence, the transcription factor ATF3 (activating transcription factor 3) bound to this region, and LINC00941 transcription was enhanced. RNA affinity isolation, RNA immunoprecipitation (RIP), RNase-RIP, half-life analysis, and ubiquitination experiments unveiled that LINC00941 formed a RNA-protein complex with ELAVL1/HuR (ELAV like RNA binding protein 1) to exert its pro-fibrotic function. Dual-fluorescence mRFP-GFP-MAP1LC3/LC3 (microtubule associated protein 1 light chain 3) adenovirus monitoring technology, human autophagy RT2 profiler PCR array, and autophagic flux revealed that the LINC00941-ELAVL1 axis inhibited autophagosome fusion with a lysosome. ELAVL1 RIP-seq, RIP-PCR, mRNA stability, and rescue experiments showed that the LINC00941-ELAVL1 complex inhibited autophagy by controlling the stability of the target genes EZH2 (enhancer of zeste 2 polycomb repressive complex 2 subunit), STAT1 (signal transducer and activators of transcription 1) and FOXK1 (forkhead box K1). Finally, the therapeutic effect of LINC00941 was confirmed in a mouse model and patients with IPF. This work provides a therapeutic target and a new effective therapeutic strategy related to autophagy for IPF.
Abbreviations: ACTA2/a-SMA: actin alpha 2, smooth muscle; ATF3: activating transcription factor 3; ATG: autophagy related; Baf-A1: bafilomycin A1; BLM: bleomycin; CDKN: cyclin dependent kinase inhibitor; CLN3: CLN3 lysosomal/endosomal transmembrane protein, battenin; COL1A: collagen type I alpha; COL3A: collagen type III alpha; CXCR4: C-X-C motif chemokine receptor 4; DRAM2: DNA damage regulated autophagy modulator 2; ELAVL1/HuR: ELAV like RNA binding protein 1; EZH2: enhancer of zeste 2 polycomb repressive complex 2 subunit; FADD: Fas associated via death domain; FAP/FAPα: fibroblast activation protein alpha; FOXK1: forkhead box K1; FVC: forced vital capacity; GABARAP: GABA type A receptor-associated protein; GABARAPL2: GABA type A receptor associated protein like 2; IGF1: insulin like growth factor 1; IPF: idiopathic pulmonary fibrosis; LAMP: lysosomal associated membrane protein; lncRNA: long noncoding RNA; MAP1LC3/LC3: microtubule associated protein 1 light chain 3; NPC1: NPC intracellular cholesterol transporter 1; RGS: regulator of G protein signaling; RPLP0: ribosomal protein lateral stalk subunit P0; ROC: receiver operating characteristic; S100A4: S100 calcium binding protein A4; SQSTM1/p62: sequestosome 1; STAT1: signal transducers and activators of transcription 1; TGFB1/TGF-β1: transforming growth factor beta 1; TNF: tumor necrosis factor; UIP: usual interstitial pneumonia; ULK1: unc-51 like autophagy activating kinase 1; VIM: vimentin.
Introduction
Idiopathic pulmonary fibrosis (IPF) is generally defined as a specific form of chronic, progressive, fibrosing interstitial pneumonia of unknown cause with the histopathological and/or radiological pattern of usual interstitial pneumonia (UIP) [Citation1]. Raghu proposed the acceptance of IPF as a manifestation of irreversible pulmonary fibrosis of many entities that is caused by several occult or overt causative factors, including genetics, sex, age, intrinsic and extrinsic environmental factors, and systemic factors. This proposal is in contrast to the notion that IPF is a specific entity characterized by UIP of unknown cause [Citation2]. The renewal of this concept may change the clinical diagnosis and treatment strategy of IPF and highlight the process of pulmonary fibrosis. Thus, understanding how fibroblast-to-myofibroblast differentiation causes uncontrolled proliferation and high myofibroblast migration and extracellular matrix deposition leading to pulmonary fibrogenesis is necessary.
Long noncoding RNAs (lncRNAs) belong to a class of regulatory noncoding RNAs that have a length more than 200 nt and are usually unable to code protein but can control multiple biological processes [Citation3]. Their regulatory functions mainly depend on distinct processing and different subcellular localizations. For example, lncRNA FAST orthologs exhibit different subcellular localization in human embryonic stem cells (HsESCs) and murine ESCs (MmESCs) because of differential RNA processing. In HsESCs, cytoplasm-localized HsFAST binds to the WD40 domain of the E3 ubiquitin ligase BTRC/b-TrCP and blocks its interaction with phosphorylated CTNNB1/b-catenin to prevent degradation. As a result, WNT signaling, which is required for pluripotency, is activated. By contrast, MmFAST is retained in the nucleus of MmESCs, and its processing is suppressed by the splicing factor PPIE, which is highly expressed in MmESCs but not HsESCs [Citation4]. Further study on these differentially expressed lncRNAs may provide a novel approach for the diagnosis and treatment of certain diseases. The prostate-specific lncRNAs of PCA3 (prostate cancer associated 3) and PCGEM1 (PCGEM prostate-specific transcript) detected in urine or blood have been used to differentiate prostate tumor and normal tissues and have diagnostic specificity and sensitivity of 83% and 67%, respectively, relative to those from the biopsy data [Citation5]. The fat-specific lncRNA Lep/Ob controls the quantitative expression of the Lep (leptin) gene, and its defects can lead to a hypoleptinemic form of obesity that is responsive to LEP treatment [Citation6]. In fibrosis, many lncRNAs are involved in various organs fibrosis, such as the liver, lung, heart and kidney. The pro-fibrotic lncRNA NONMMUT022555/lncRNA PFL contributes to cardiac fibrosis by functioning as a competing endogenous RNA of MIRLET7D/let-7d [Citation7]. LncRNA H19-mediated M2 polarization of macrophages promotes myofibroblast differentiation in pulmonary fibrosis induced by arsenic exposure [Citation8]. LncRNA Erbb4-IR (intron region) contributes to TGFB1/TGF-β1 (transforming growth factor beta 1)-SMAD3 (SMAD family member 3)-mediated renal fibrosis via downregulating SMAD7 (SMAD family member 7) [Citation9]. In general, the study of lncRNAs associated with fibrosis, particularly pulmonary fibrosis, is only in the preliminary stage.
Our previous studies revealed that different lncRNAs regulate pulmonary fibrogenesis in different cell types. LncITPF (a novel lncRNA renamed by its function) forms an RNA-protein complex with HNRNPL (heterogeneous nuclear ribonucleoprotein L) to control its host gene ITGBL1 in fibroblasts, thus accelerating lung fibrosis. LncRNA BC158825/LncPCF promotes pulmonary fibrosis by sponging microRNA (miRNA) Mir344-5p to target MAP3K11 in alveolar epithelial cells [Citation10–12]. However, the regulatory mechanism of lncRNA on cellular differentiation remains largely unknown. In the present work, whole-transcriptome analysis was performed to screen differentially expressed lncRNAs in human lung fibroblasts. The upregulated RNA transcript of LINC00941/lncIAPF was further investigated. Recent research showed that LINC00941 promotes proliferation and invasion of colon cancer by acting on the MIR205-5p-MYC axis as a ceRNA mechanism [Citation13]. However, its upregulation mechanism and the underlying mechanism by sequestering RNA-binding protein (RBP) remain largely unknown. Here, highly expressed LINC00941 regulation on fibroblast-to-myofibroblast differentiation through sequestering RBP to target macroautophagy/autophagy process and its potential clinical relevance in patients with IPF was further explored. Due to its inhibitory function on autophagy, we renamed LINC00941 as lncIAPF (Inhibit Autophagy in Pulmonary Fibrogenesis). The findings can provide a diagnostic biomarker in blood, or a potential therapeutic target related to autophagy for IPF.
Results
Mechanism of LINC00941/lncIAPF upregulation in pulmonary fibrosis
TGFB1 was used to activate fibroblast differentiation into myofibroblast in human fetal lung fibroblast MRC-5 cell. Whole-transcriptome sequencing was first conducted to test the differentially expressed lncRNAs in normal MRC-5 cells and MRC-5 cells activated with TGFB1 for 72 h. LINC00941 RNA transcript had markedly higher expression than other RNAs (). With the use of Affymetrix Human Transcriptome Array 2.0 microarray, LINC00941 was found to have the highest expression among lncRNAs and the highest co-expression degree with the mRNAs of fibrotic markers [Citation14] and thus selected for further investigation. For sequencing data confirmation, lncIAPF expression was assessed in MRC-5 cells activated with TGFB1 for 0, 6, 12, 24, 48 and 72 h. qRT-PCR results reflected that lncIAPF was upregulated (). Afterward, 5′- and 3′-rapid amplification of complementary DNA ends (RACE) experiment was performed to analyze the full-length sequence of lncIAPF. The results uncovered that lncIAPF has 1967 base pairs in length (Fig. S1A). The protein-coding ability scores of lncIAPF were evaluated using the following tools: Coding Potential Calculator (http://cpc.cbi.pku.edu.cn/) and Coding Potential Assignment Tool (http://lilab.research.bcm.edu/cpat/index.php). The scores were 0.187173 and 0.1735537, respectively, indicating that lncIAPF was devoid of protein-coding potential. In the UCSC and Ensemble databases, lncIAPF was also annotated as a lncRNA.
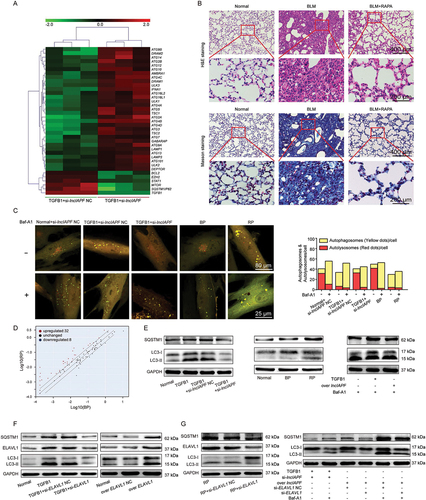
Figure 1. Highly expressed mechanism of LINC00941/lncIAPF. (A) Whole-transcriptome sequencing tested the differentially expressed lncRNAs in normal MRC-5 cells and MRC-5 activated with TGFB1 for 72 h. LINC00941 RNA transcript had markedly higher expression. (B) qRT-PCR confirmed the highly expressed lncIAPF RNA transcript in the samples used for whole-transcriptome sequencing. (C) qRT-PCR results showed that lncIAPF was upregulated in MRC-5-treated with TGFB1 for 0, 6, 12, 24, 48 and 72 h. (D) Gene tracking of ATAC-seq signal for lncIAPF after TGFB1 treatment for MRC-5 cells for 6 h revealed that TGFB1 increased the chromatin accessibility in the lncIAPF promoter compared with that in the normal group. 1 K indicates the length of lncIAPF promoter, and Hg38 indicates the human reference genome. (E) ChIP-seq revealing a significant H3K27ac modification peak in the transcription start sites of lncIAPF in each group. Significant difference in peak value was found between the TGFB1-treated and normal groups. (F) ChIP-seq indicating significant H3K4me3 modification peak in the transcription start sites of lncIAPF in each group. No significant difference in peak value was found between the TGFB1-treated and normal groups. (G) Motif analysis of ATF3 binding site with lncIAPF promoter (above). ChIP-purified DNA targeting of the indicated genes analyzed by qPCR revealed ATF3 binding at the lncIAPF promoter region with or without TGFB1 treatment. Primers 1–3 were designed for lncIAPF promoter. ACTB/β-actin was used as negative control. Human ortholog coiled-coil domain containing 124 (CCDC124) was used as positive control. (H) qRT-PCR showed that si-ATF3 reduced lncIAPF expression, and overexpressed ATF3 increased lncIAPF. Each bar represents the mean ± SD; n = 6; *p < 0.05.
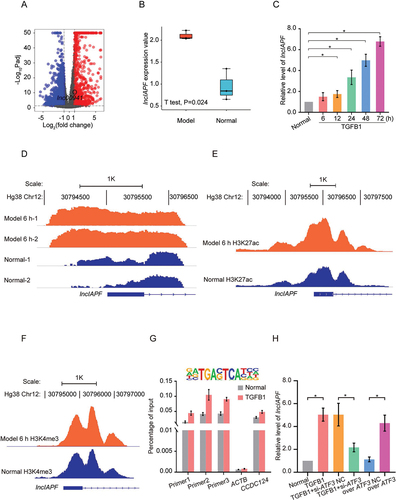
Subsequently, the factor underlying the considerable increase in lncIAPF expression in lung fibrosis was investigated. Chromatin undergoes dynamic, organizational changes in normal or disease state; hence, an assay for transposase-accessible chromatin using sequencing (ATAC-seq) was performed to test chromosome-region opening during pulmonary fibrosis [Citation15]. Considering that chromosome-region opening occurs prior to gene expression, normal cells and those treated with TGFB1 for 6 h were tested. ATAC-seq findings revealed that TGFB1 considerably increased the chromosome opening peak in lncIAPF promoter compared with that in the normal group (). This result indicated that lncIAPF transcription is more active in the TGFB1-treated group than in the normal group. Chromatin immunoprecipitation (ChIP)-seq was then performed to study histone modification. Significant histone H3 lysine 4 trimethylation (H3K4me3) and H3K27ac modification peaks were found near the transcription start sites of lncIAPF in each group. Significant difference was found in the H3K27ac modification peak () but not in the peak value of H3K4me3 () between the TGFB1-treated and normal groups. Therefore, the differential expression of lncIAPF was related to H3K27ac modification but not to H3K4me3 modification. Further analysis was performed on the transcription factors that specifically bound to lncIAPF promoter. ATF3 ranked first according to p values based on ATAC-seq and hence was selected for further study. After the motif analysis of the ATF3 binding site, ChIP was performed to confirm the binding between ATF3 and lncIAPF promoter (). qRT-PCR results verified that ATF3 knockdown markedly reduced lncIAPF expression and vice-versa (). These findings indicated that H3K27ac modification contributes to chromosome-region opening in lncIAPF promoter. After chromosome-region opening, ATF3 binds to lncIAPF promoter and initiates lncIAPF transcription. It may be one of the reasons that lncIAPF upregulates in pulmonary fibrosis.
LncIAPF accelerated pulmonary fibrogenesis by promoting fibroblast-to-myofibroblast differentiation
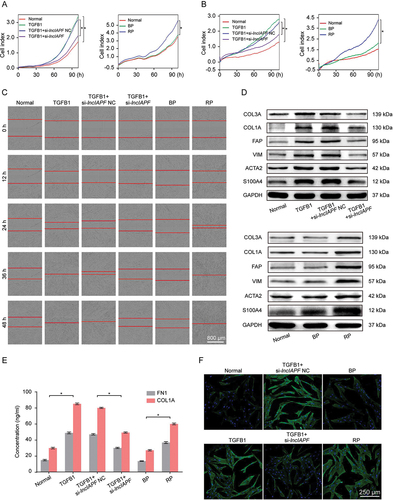
The smart silencer consisting of six RNA interference sites (si-lncIAPF) and overexpression vector (recombinant plasmid, RP) of lncIAPF were designed and transfected into MRC-5 cells to investigate lncIAPF function. The effects of si-lncIAPF and RP on fibroblast-to-myofibroblast differentiation were assessed by cell shape, differentiation-related proteins, fibrotic protein markers, and myofibroblast proliferation and migration. Real-time cellular analysis system manifested that myofibroblast proliferation and migration was considerably increased by lncIAPF overexpression but blocked by lncIAPF smart silencer compared with those in the TGFB1-treated groups (, B). These results were further confirmed by scratch wound-healing assay (). Western blot analysis revealed that TGFB1 rapidly increased the amount of fibrotic markers, including ACTA2/a-SMA (actin alpha 2, smooth muscle), COL1A (collagen type I alpha), COL3A (collagen type III alpha), and VIM (vimentin), and differentiation-related proteins, including FAP/FAPα (fibroblast activation protein alpha) and S100A4 (S100 calcium binding protein A4). However, their expression was reduced by lncIAPF smart silencer and promoted by lncIAPF overexpression (). Expression of COL1A and FN1 (fibronectin 1) in the media of the cultured cells also reduced by lncIAPF smart silencer and promoted by lncIAPF overexpression (). Immunofluorescence staining images depicted that the TGFB1-treated fibroblasts appeared in a spindle shape and had strong proliferation and migration abilities and rapidly increased ACTA2. LncIAPF overexpression had the same effect as TGFB1. Meanwhile, lncIAPF smart silencer weakened the proliferation and migration abilities and decreased ACTA2 (). All these results suggest that lncIAPF is a pro-fibrotic factor that can accelerate pulmonary fibrosis by promoting fibroblast differentiation into myofibroblasts and myofibroblast proliferation and migration.
Figure 2. Pro-fibrotic function of lncIAPF. (A) Real-time cellular analysis system reflected that myofibroblast proliferation was slowed by the lncIAPF smart silencer and enhanced by lncIAPF overexpression. (B) Real-time cellular analysis system reflected that myofibroblast migration was slowed by the lncIAPF smart silencer and enhanced by lncIAPF overexpression. (C) Wound-healing assay was automatically monitored with an IncuCyte S3 instrument under lncIAPF smart silencer and overexpression treatment. LncIAPF smart silencer blocked myofibroblast migration. Conversely, lncIAPF overexpression promoted myofibroblast migration. (D) Western blot results exhibited that ACTA2, COL1A, COL3A, VIM, FAP and S100A4 were highly upregulated by TGFB1. LncIAPF smart silencer inhibited the expression of ACTA2, COL1A, COL3A and VIM. Conversely, lncIAPF overexpression elevated the expression of ACTA2, COL1A, COL3A, VIM, FAP and S100A4. GAPDH served as the control. (E) Expression of COL1A and FN1 in the media of the cultured cells reduced by lncIAPF smart silencer and promoted by lncIAPF overexpression. (F) Immunofluorescence staining observed that cells became spindle-shaped, ACTA2 was increased, and cell proliferation was enhanced in the TGFB1-treated MRC-5 group compared with those in normal cells. LncIAPF smart silencer repressed ACTA2 and cell proliferation compared with those in the TGFB1-treated group. LncIAPF overexpression considerably increased the ACTA2 and cell proliferation. Blue indicates nucleus marked with DAPI. Green indicates ACTA2 in cytoplasm. NC indicates a negative control of si-lncIAPF, BP indicates blank plasmid, and RP indicates the recombinant plasmid of overexpressed lncIAPF. Each bar represents the mean ± SD; n = 6; *p < 0.05.
Regulatory mechanism of lncIAPF on the binding protein ELAVL1
LncRNA can form an RNA-protein complex with its binding protein to exert certain functions. Hence, RNA affinity isolation, protein mass spectrometry, and western blot analyses were performed to search for the binding protein of lncIAPF by dividing its full-length sequence into two sections, namely, 1–1017 and 1005–1895 nt sections. After segmentation, high-quality RNA transcriptions were obtained (). Silver staining was performed to detect lncIAPF-bound proteins from RNA pull-down. Staining images depicted that the active functional domain was in the 1005–1895 nt section, and the 1–1017 nt section had no differently expressed protein compared with the control (). The lncIAPF-bound proteins were further analyzed by mass spectrometry. Considering the varying protein bands found in the 1005–1895 nt section, it was divided into a, b, and c groups for further mass spectrometry. The results preliminarily exhibited that ELAVL1 was the major lncIAPF-binding protein. Mass spectrometry and western blot findings confirmed their binding relation (). RNA immunoprecipitation (RIP) results also revealed that ELAVL1 was specifically enriched by lncIAPF to prove their binding relationship. LncRNA overexpressed in colon carcinoma-1 (OCC-1) serves as positive control because it is upregulated in a subset of colon carcinomas () [Citation16].
Figure 3. Identification of lncIAPF and its binding protein ELAVL1. (A) LncIAPF was divided into two sections, namely, 1–1017 nt and 1005–1895 nt (above) verified with high quality (below). (B) Silver staining indicated the lncIAPF-bound proteins from RNA affinity isolation in 1–1017 and 1005–1895 nt sections compared with those in the EGFP RNA group. Red arrow showed that 1005–1895 nt section had many differently expressed protein binds compared with the control. This section was divided into a, b, and c groups for further mass spectrometry analysis. (C) Mass spectrometry validated that ELAVL1 was the binding protein of lncIAPF. (D) Western blot results revealed that ELAVL1 was the binding protein of lncIAPF. (E) RIP results verified that ELAVL1 specifically concentrated large quantities of lncIAPF. RN7SK RNA served as negative control, lncRNA OCC1 as positive control. (F) Full length 1005–1895 nt (FL) was further divided into 6 sections: 1# 1005–1047, 2# 1048–1895, 3# 1048–1613, 4# 1330–1895, 5# 1614–1895 and 6# 1048–1329. The RNA affinity isolation showed that ELAVL1 blot appeared in 2#, 3#, and 4# sections which shared the same sequence 1330–1613 section. (G) RNase-RIP experiments showed 9#, 10#, and 11# primers amplification regions of lncIAPF combined with ELAVL1. This region was in 1330–1613 nt of lncIAPF. 13 pairs of primers were designed for lncIAPF full length. (H) Western blot results showed that ELAVL1 expression increased/decreased under over-expressed/knockdown lncIAPF action. (I) Immunofluorescence results illustrated that ELAVL1 expression was increased by lncIAPF overexpression and decreased by lncIAPF knockdown. (J) Images of RNA FISH revealed that lncIAPF was located in the nucleus and cytoplasm. After TGFB1 treatment, a small amount of lncIAPF translocated from the nucleus to cytoplasm. (K) Nuclear and cytosolic fraction confirmed that lncIAPF was present in the nucleus and cytoplasm. Neat1 was primarily found in the nucleus, and ACTB was primarily located in the cytoplasm. (L) Nuclear and cytosolic fraction exhibited that ELAVL1 was mainly located in the nucleus in normal cells. TGFB1 and lncIAPF overexpression promoted minimal ELAVL1 translocation from the nucleus to cytoplasm, and lncIAPF knockdown reduced the total amount of ELAVL1 protein but did not trigger nucleocytoplasmic translocation. Each bar represents the mean ± SD; n = 6; *p < 0.05.
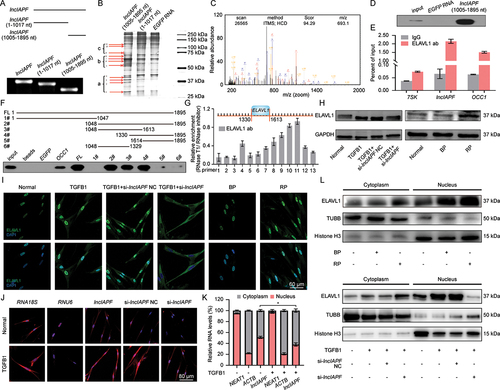
The 1005–1895 sequence of lncIAPF was further divided into six sections: 1005–1047, 1048–1895, 1048–1613, 1330–1895, 1614–1895, and 1048–1329 to identify the binding domain. RNA pull-down analysis showed that ELAVL1 blot appeared in three sections: 1048–1895, 1048–1613, and 1330–1895, indicating that the binding domain was approximately in the 1330–1613 section of lncIAPF (). For confirmation, 13 pairs of primers for lncIAPF and RNase-RIP experiment were designed (Table S1). The RNase-RIP results showed that ELAVL1 anchored at the 9#, 10#, and 11# primers in the amplification region of lncIAPF (). This region was also located in 1330–1613 nt in lncIAPF. ELAVL1 expression was then assessed by western blot. When the duration of TGFB1 treatment was increased from 0 to 72 h, its expression was higher compared with that in normal cells (Fig. S1B). Western blot and immunofluorescence results showed that ELAVL1 expression was increased by lncIAPF overexpression but reduced by lncIAPF knockdown (). Hence, ELAVL1 was selected for further study.
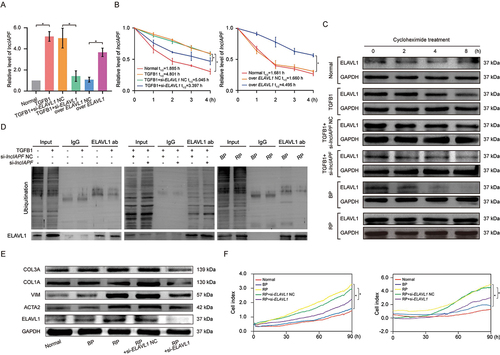
The underlying mechanism between lncIAPF and ELAVL1 was further explored. LncRNA location determines its regulatory mechanisms, such as the transcriptional or posttranscriptional modification of mRNA and protein activity modulation. Thus, RNA fluorescence in situ hybridization (RNA FISH) and nuclear-cytosol fractionation were performed to detect lncIAPF location. RNA FISH analysis revealed that lncIAPF was visible in the nucleus and cytoplasm (). Nuclear-cytosol fractionation revealed that after TGFB1 treatment, only a small amount of lncIAPF translocated from the nucleus to cytoplasm (). ELAVL1 translocation was also detected. Primarily located in the nucleus in normal cells, a small amount of ELAVL1 translocated from the nucleus to cytoplasm after TGFB1 or overexpressed lncIAPF treatment. LncIAPF knockdown reduced the total amount of ELAVL1 protein but did not trigger its nucleocytoplasmic translocation (). ELAVL1 regulates numerous genes in the nucleus and cytoplasm through different mechanisms. We inferred that lncIAPF and ELAVL1 expression are affected by their stabilities, and not by their translocations. Hence, stability experiments were performed to explore the underlying mechanism. Gain- and loss-of-function studies revealed that ELAVL1 overexpression increased lncIAPF level, and ELAVL1 knockdown decreased lncIAPF expression (). Half-life of lncIAPF analysis indicated that lncIAPF stability was enhanced by ELAVL1 overexpression but reduced by ELAVL1 knockdown (). The stability of ELAVL1 protein was also measured by using cycloheximide experiments, and the results showed that ELAVL1 stability was enhanced by lncIAPF overexpression but reduced by lncIAPF knockdown (). Ubiquitination experiments also elucidated that lncIAPF overexpression decreased ELAVL1 ubiquitination, which led to ELAVL1 stability. LncIAPF knockdown promoted ELAVL1 ubiquitination, which resulted in ELAVL1 degradation (). The above results suggest that lncIAPF and ELAVL1 affect each other’s stability. The rescue experiment showed that the levels of fibrotic markers such as ACTA2, VIM, COL1A and COL3A were increased by lncIAPF overexpression, but this effect was reversed by the interference of ELAVL1 (). Myofibroblast proliferation and migration were enhanced by lncIAPF overexpression. However, these trends reversed by interference of ELAVL1 expression (). Thus, the effect of lncIAPF on fibrosis depends on ELAVL1.
Figure 4. Effect of lncIAPF on fibrosis depends on ELAVL1. (A) qRT-PCR results showed that lncIAPF expression was increased by ELAVL1 overexpression and reduced by ELAVL1 knockdown. (B) Half-life of lncIAPF analysis unveiled that lncIAPF stability was enhanced by ELAVL1 overexpression and reduced by ELAVL1 knockdown. (C) Stability testing uncovered that ELAVL1 stability was promoted by lncIAPF overexpression and decreased by lncIAPF knockdown. Half-life of each group was 5.96, 20.84, 18.99, 6.10, 6.63, 22.59 h in normal, TGFB1, TGFB1+ si-lncIAPF NC, TGFB1+ si-lncIAPF, BP and RP group, respectively. (D) Ubiquitination experiments revealed ELAVL1 ubiquitination was reduced by lncIAPF overexpression and enhanced by lncIAPF knockdown. (E) Rescue experiments elucidated that lncIAPF overexpression enhanced the expression of fibrotic proteins including ACTA2, VIM, and COL1A and COL3A. Interference of ELAVL1 blocked these proteins’ expression. (F) Rescue experiments manifested that lncIAPF overexpression promoted the myofibroblast proliferation and migration. Interference of ELAVL1 expression caused their expression trends to be reversed. Each bar represents the mean ± SD; n = 6; *p < 0.05.
Inhibition of lncIAPF–ELAVL1 complex on autophagy
Which signaling pathway is regulated by lncIAPF? Differentially expressed mRNAs were obtained in TGFB1+ knockdown lncIAPF NC and TGFB1+ knockdown lncIAPF groups by using RNA sequencing. Go analysis and functional enrichment of differential mRNA showed that lncIAPF regulation mainly enriched in autophagy signaling pathway. Some autophagy-related genes (ATGs) were up-regulated and some were down-regulated by knockdown lncIAPF (). Autophagy can function as a cytoprotector or deleterious effector to participate in the pathogenesis of pulmonary fibrosis [Citation17]. Hence, the autophagy role was first studied in bleomycin (BLM)-treated mice model. The in vivo results indicated that excess collagen was deposited and the alveolar wall became thicker in BLM group. Rapamycin is known as autophagy inducer. H&E and Masson images revealed that rapamycin alleviated fibrosis (). The findings showed that autophagy can function as a cytoprotector in pulmonary fibrosis. For further illustration which stage of autophagy is blocked, real-time detection of tandem dual-fluorescence mRFP-GFP-LC3 adenovirus was performed to investigate the effects on autophagy by the knockdown and overexpression of lncIAPF. If autophagy is activated, then GFP green fluorescence will be quenched due to the decrease in pH value. Red fluorescence is still emitted even when the pH stability of mRFP red fluorescent is higher than that of GFP. Hence, red fluorescence indicates autolysosomes. Yellow fluorescence represents the co-localization of both GFP and mRFP fluorescence indicating the autophagosomes. This color indicates that the fusion proteins failed to completely fuse with lysosome, and autophagy is partially blocked. The percentage of yellow fluorescence spots reflects the autophagosome-lysosome fusion rate. So we used the IncuCyte S3 live-cell analysis system to observe the autophagy processes under various conditions. Videos of the whole autophagy process within 20 h in normal, TGFB1, overexpressed lncIAPF/NC and knockdown lncIAPF/NC groups were recorded as Supplementary Video. These videos vividly displayed the autophagy processes at different times for different groups. The videos showed that autophagosome formed normally and the fusion between autophagosome and lysosome was blocked in TGFB1 group. Overexpressed lncIAPF inhibited autophagy by blocking the fusion between autophagosome and lysosome, not blockade of autophagosome formation. Knockdown lncIAPF promoted the fusion between autophagosome and lysosome. Baf-A1 (Bafilomycin A1) is an autophagy inhibitor, which can inhibit the fusion between autophagosome and lysosome and enhanced yellow fluorescence [Citation18]. Therefore, Baf-A1 was added to confirm blockade of the fusion between autophagosome and lysosome, not autophagosome formation in TGFB1 and overexpressed lncIAPF groups, whereas knockdown of lncIAPF promoted the fusion between autophagosomes and lysosomes (Video S1–S4). Meanwhile, the images of fluorescence changes were detected with the laser confocal microscope. Dual-fluorescence images revealed that the normal group emitted red and yellow fluorescence. The numbers of yellow fluorescence spots were markedly increasing in TGFB1 group compared with normal group. The yellow fluorescence was enhanced in the overexpressed lncIAPF-treated group but weakened in the lncIAPF knockdown-treated group. After adding Baf-A1, we observed a constant increase in the number of cells accumulating yellow fluorescence spots compared with every group without Baf-A1, which is suggestive of defective fusion of autophagosomes with lysosomes (). On the basis of the above findings, overexpressed lncIAPF inhibits autophagy by blocking autophagosome fusion with lysosome, not blockade of autophagosome formation. Knockdown lncIAPF promotes autophagosome fusion with lysosome.
Figure 5. Effect of lncIAPF on autophagic flux depending on ELAVL1. (A) RNA sequencing was performed to test the differentially expressed mRNAs in TGFB1+ knockdown lncIAPF NC and TGFB1+ knockdown lncIAPF groups. Altered mRNAs were enriched in ATGs. Green to red indicated the low-to-high expression levels. (B) H&E and Masson images revealed that excess collagen was deposited and the alveolar wall became thicker in BLM group. Rapamycin alleviated fibrosis. (C) Dual-fluorescence mRFP-GFP-LC3 adenovirus monitoring technology was used to observe autophagy with the laser confocal microscope. The normal group emitted red and yellow fluorescence. TGFB1-treated group emitted strong yellow fluorescence. The yellow fluorescence was enhanced in the overexpressed lncIAPF-treated group but weakened in the lncIAPF knockdown-treated group. The number of autophagosomes (GFP+mRFP+ spots) was increased, while the number of autolysosomes (GFP–mRFP+ spots) was decreased in Baf-A1 treatment groups compared with the non-treatment groups, respectively. (D) Human autophagy RT2 profiler PCR array showed that lncIAPF overexpression caused changes in 84 ATGs. Red dot indicates the 32 upregulated ATGs; blue dot indicates the 8 downregulated ATGs; and black dot indicates the remaining 44 ATGs. (E) Western blot results revealed that LC3-II:LC3-I and SQSTM1 decreased in the normal group compared with those in the other groups. However, lncIAPF smart silence decreased LC3-II:LC3-I and SQSTM1 compared with those in the TGFB1 group and lncIAPF overexpression increased LC3-II:LC3-I and SQSTM1. (F) LC3-II:LC3-I and SQSTM1 levels were decreased by si-ELAVL1 but increased by ELAVL1 overexpression. (G) Rescue experiments revealed that lncIAPF overexpression promoted the levels of autophagic proteins including LC3-II:LC3-I, and SQSTM1. After interfering with ELAVL1 expression, these proteins’ expression trends were reversed.
Subsequently, the 84 ATGs were analyzed using human autophagy RT2 profiler PCR array. According to the expressed profiles of ATGs, 32 and 8 were upregulated and downregulated, respectively, in the lncIAPF overexpressed group compared with the normal group (). These changed genes include two parts: autophagy machinery components and autophagy regulators. Autophagy machinery components contain genes encoding proteins that are involved in autophagic vacuole formation (ATG4B, ATG4C, ATG4D, ATG9A, ATG9B, ATG10, ATG16 L1, ULK1, RGS19, AMBRA1, and GABARAPL2) and those linking autophagosome to lysosome (GABARAP, LAMP1 and NPC1). Autophagy regulators include the co-regulators of autophagy and apoptosis (IFNG, BCL2, BCL2L1, CDKN1B, CDKN2A, CXCR4, FADD, FAS, CLN3, CASP3, IGF1, SNCA, SQSTM1/P62, TGFB1, TNF, and TNFSF10) and those responsible for the response to other intracellular signals (EIF4G1, HGS, CRPK1, CTSS, DRAM2 [DNA damage regulated autophagy modulator 2], PIK3C3, RAB24, ACTB, TMEM74, and RPLP0) ().
Table 1. The altered ATGs in overexpressed lncIAPF group.
Given that autophagy function is activated by autophagic flux, western blot was used to detect the expression of autophagic flux marker proteins, such as LC3-II:LC3-I and SQSTM1. The expression of SQSTM1 and LC3-II:LC3-I decreased in the normal group. Gain- and loss-of-function studies indicated that LC3-II:LC3-I and SQSTM1 levels were decreased by lncIAPF knockdown but increased by lncIAPF overexpression (). Inhibition of ELAVL1 in autophagy was confirmed by ELAVL1 effect on autophagic flux. The results identified that LC3-II:LC3-I and SQSTM1 levels were decreased by si-ELAVL1 but increased by ELAVL1 overexpression (). The rescue experiment elucidated that interference on ELAVL1 expression reversed the increasing effect of lncIAPF overexpression for autophagic proteins including LC3-II:LC3-I, SQSTM1 (). Therefore, the effect of lncIAPF on autophagy depends on ELAVL1.
LncIAPF-ELAVL1 complex regulated autophagy through the target genes EZH2, STAT1 and FOXK1
Potential interactions between ELAVL1 and other genes were analyzed using GeneMANIA to investigate the effect of lncIAPF-ELAVL1 axis on autophagy. The results showed that ELAVL1 directly bound to and regulated the EZH2 (enhancer of zeste 2 polycomb repressive complex 2 subunit), STAT1 (signal transducers and activators of transcription 1) and FOXK1 (forkhead box K1) (Fig. S1C). Emerging evidence has confirmed that both nuclear and cytosolic events can regulate the induction or repression of autophagy [Citation19]. FOXK1, STAT1 and EZH2 can repress autophagy by controlling the genes associated with autophagy such as LC3-I, LC3-II and SQSTM1 via the MTOR pathway in muscle development [Citation20], breast cancer [Citation21] and tumorigenesis [Citation22]. However, this function has not been reported in pulmonary fibrosis. Given their roles in autophagic regulation, EZH2, STAT1 and FOXK1 were selected for subsequent studies.
First, RNA binding protein immunoprecipitation sequencing (RIP-seq) was performed to identify the target mRNAs to ELAVL1. ELAVL1 RIP-seq data revealed that ELAVL1 bound to the mRNAs of EZH2, STAT1 and FOXK1 (). RIP-PCR results further confirmed that ELAVL1 bound to EZH2, STAT1 and FOXK1 (). RIP-PCR was then used to examine the effects of lncIAPF on the binding between ELAVL1 and its target genes EZH2, STAT1 and FOXK1 at the mRNA level. The binding degree of ELAVL1 with EZH2, STAT1 and FOXK1 was inhibited by lncIAPF knockdown but intensified by lncIAPF overexpression (). In general, ELAVL1 can influence mRNA stability. Hence, the mRNA stabilities of EZH2, STAT1 and FOXK1 were detected by using half-life experiments. The data reflected that the stabilities of EZH2, STAT1 and FOXK1 were promoted by lncIAPF overexpression but reduced by lncIAPF knockdown (). Western blot results further confirmed that the protein expression of EZH2, STAT1 and FOXK1 was decreased by lncIAPF knockdown but increased by lncIAPF overexpression (). Whether the controlling effect of lncIAPF on EZH2, STAT1 and FOXK1 depends on ELAVL1 was confirmed by rescue experiments (). EZH2, STAT1 and FOXK1 expression levels were enhanced by lncIAPF overexpression. However, these trends reversed by interference of ELAVL1 expression, suggesting that the regulating ability of lncIAPF for EZH2, STAT1 and FOXK1 depends on ELAVL1. The effects of EZH2, STAT1 and FOXK1 on fibrotic proteins and autophagic flux were tested by gain- and loss-of-function studies. The results demonstrated that overexpressed EZH2, STAT1 and FOXK1 promoted the expression of fibrotic proteins and inhibited autophagic flux (). Also, Baf-A1 was added to confirm blockade of the fusion between autophagosome and lysosome in overexpressed EZH2, STAT1 and FOXK1 groups, not autophagosome formation. Overexpressed EZH2, STAT1 and FOXK1 inhibited the fusion of autophagosome and lysosome (). Knockdown EZH2, STAT1 and FOXK1 inhibited the expression of fibrotic proteins and promoted autophagic flux (). The rescue experiments elucidated that overexpressed EZH2, STAT1 and FOXK1 reversed the downward trend of fibrotic and autophagic proteins caused by si-lncIAPF (), whereas knockdown of EZH2, STAT1 and FOXK1 reversed the upward trend of these proteins caused by overexpressed lncIAPF ().
Figure 6. LncIAPF-ELAVL1 complex regulated autophagy through the target genes EZH2, STAT1 and FOXK1. (A) ELAVL1 RIP-seq peaks were categorized according to the distribution on different genomic elements of ELAVL1 and compared with the genomic background. (B) Representative ELAVL1 RIP-seq peaks were shown as track signals in an integrative genomic viewer. Peak area is highlighted in light green. The mRNAs of EZH2, STAT1 and FOXK1 bound to ELAVL1. (C) RIP-PCR results confirmed that the mRNAs of EZH2, STAT1 and FOXK1 bound to ELAVL1. (D) RIP-PCR results validated that lncIAPF knockdown repressed the binding amount of ELAVL1 with EZH2, STAT1 and FOXK1, whereas lncIAPF overexpression increased the binding amount. (E) Half-life experiments detected the mRNAs stabilities of EZH2, STAT1 and FOXK1. LncIAPF overexpression promoted their stabilities and si-ELAVL1 reduced the growing trend of stabilities. (F) Western blot results manifested that lncIAPF knockdown expression decreased EZH2, STAT1 and FOXK1 levels, lncIAPF overexpression increased their expression trends. (G) Rescue experiments indicated that lncIAPF overexpression increased EZH2, STAT1 and FOXK1 levels. Interference of ELAVL1 expression induced their expression trends reversed. (H) Overexpressed EZH2, STAT1 and FOXK1 promoted the expression of ACTA2, COL1A, COL3A and VIM. (I) Effects of the target genes EZH2, STAT1 and FOXK1 on autophagic flux. Overexpression of EZH2, STAT1 and FOXK1 promoted SQSTM1 and LC3-II:LC3-I expression. (J) Red fluorescence was weakened in the groups of EZH2, STAT1 and FOXK1 overexpression, indicating that their overexpression reduced the autophagosome-lysosome fusion. Baf-A1 worked the same as EZH2, STAT1 and FOXK1. (K) Knockdown EZH2, STAT1 and FOXK1 inhibited the expression of fibrotic proteins and promoted autophagic flux. (L) The rescue experiment elucidated that overexpressed EZH2, STAT1 and FOXK1 reversed the downward trend of fibrotic and autophagic proteins caused by si-lncIAPF. (M) Knockdown EZH2, STAT1 and FOXK1 reversed the downward trend of fibrotic and autophagic proteins caused by overexpressed lncIAPF. Each bar represents the mean ± SD; n = 6; *p < 0.05.
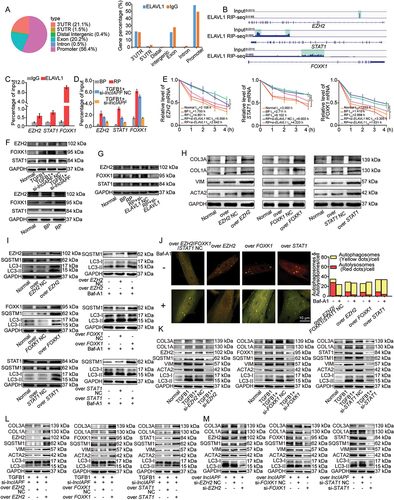
The effects of EZH2, STAT1 and FOXK1 on autophagy were further studied by using human autophagy RT2 profiler PCR array (). The overexpression of EZH2, STAT1 and FOXK1 co-regulated 30 upregulated and 13 downregulated ATGs (). Among these genes, 21 upregulated ATGs, namely, ATG4B, ATG4D, ATG9B, ATG9A, ATG10, ATG16L1, ULK1, RGS19, AMBRA1, LAMP1, NPC1, BCL2L1, CDKN1B, FADD, CLN3, IGF1, SQSTM1, TGFB1, TNFSF10, HGS, and ACTB, overlapped with those regulated by lncIAPF overexpression. Two downregulated ATGs, namely, DRAM2 and GABARAP (GABA type A receptor-associated protein), overlapped with those regulated by lncIAPF overexpression (). Western blot analysis further confirmed that DRAM2 and GABARAP levels were increased by lncIAPF knockdown but decreased by lncIAPF overexpression. ULK1 (unc-51-like autophagy activating kinase 1) and TGFB1 were decreased by lncIAPF knockdown but increased by lncIAPF overexpression (). DRAM2 and GABARAP contribute to autophagy via autophagosome-lysosome fusion [Citation23,Citation24]. ULK1 mainly help for the early stage of autophagy. This finding supports the conclusion that lncIAPF overexpression inhibits autophagy by blocking autophagosome fusion with lysosome. Gain- and loss-of-function studies were performed to measure the effect of GABARAP on fibrosis. Overexpressed GABARAP reduced fibrotic protein expression and knockdown GABARAP promoted their expression (). The rescue experiments elucidated that si-GABARAP reversed the decreasing trend of fibrosis and the increasing trend of autophagic flux caused by lncIAPF knockdown. Overexpressed GABARAP reversed the increasing trend of fibrosis and the decreasing trend of autophagic flux caused by overexpressed lncIAPF (). To further clarify the correlation between fibrosis and autophagy, si-GABARAP packaged into the adenovirus vector was transfected into MRC-5 cell. Western blot demonstrated that overexpressed EZH2, STAT1, FOXK1 and ELAVL1 promoted fibrotic proteins expression (). These results reflected that the regulatory signals of lncIAPF on autophagy are mainly exhibited through EZH2, STAT1 and FOXK1.
Figure 7. Coregulation of overexpressed EZH2, STAT1 and FOXK1 on ATGs and fibrotic proteins. (A) Effects of overexpressed EZH2, STAT1 and FOXK1 on autophagy were tested by human autophagy RT2 profiler PCR array. (B) Venn diagrams showed the number of changed ATGs co-regulated by overexpressed EZH2, STAT1, FOXK1 and lncIAPF. (C) Western blot showed that DRAM2 and GABARAP levels decreased by overexpressed lncIAPF and increased by knockdown lncIAPF. ULK1 and TGFB1 levels increased by overexpressed lncIAPF and decreased by knockdown lncIAPF. (D) Overexpressed GABARAP reduced fibrotic protein expression and knockdown GABARAP promoted their expression. (E) The rescue experiments elucidated that si-GABARAP reversed the decreasing trend of fibrosis and the increasing trend of autophagic flux caused by lncIAPF knockdown. Overexpressed GABARAP reversed the increasing trend of fibrosis and the decreasing trend of autophagic flux caused by overexpressed lncIAPF. (F) Western blot demonstrated that the pro-fibrotic function of EZH2, STAT1, FOXK1 was not strengthened.
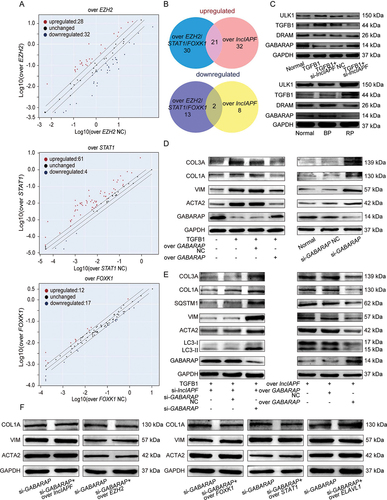
Table 2. The altered ATGs in overexpressed EZH2 group.
Table 3. The altered ATGs in overexpressed STAT1 group.
Table 4. The altered ATGs in overexpressed FOXK1 group.
LncIAPF as a potential therapeutic target for pulmonary fibrosis
Animal experiments and clinical studies were performed to evaluate the potential of lncIAPF as a therapeutic target. Given that lncIAPF was screened from human fibroblast, it has a relatively low degree of homology to that in mice. Therefore, we first test whether overexpressed humanized lncIAPF was effective in mice to validate the mouse model is relevant to the proposed mechanism. In mouse fibroblast L929 cells, qRT-PCR results indicated that overexpressed lncIAPF promoted lncIAPF expression (Fig. S2A). Western blot results illustrated that overexpressed lncIAPF promoted fibrogenesis and inhibited autophagy (Fig. S2B,C). In BLM-treated mice model, bleomycin also promoted these proteins expression (Fig. S2D). The findings corroborated the human fibroblast results, which suggest that the mouse model is relevant to the proposed mechanism. Hence, we can use mice model to further confirm the proposed mechanism.
Due to poor homology, perhaps lncIAPF interference does not work effectively in mice model. According to the similar study [Citation25], overexpressed lncIAPF was selected for mice experiments. Overexpressed lncIAPF was packaged into the adenovirus vector marked with green fluorescent protein and sprayed into the mouse lung from the trachea (). The efficiency of overexpressed lncIAPF was detected by qRT-PCR. The data proved the high expression of lncIAPF in the overexpressed lncIAPF-treated mice, indicating that the overexpressed lncIAPF adenovirus vector is highly efficacious (). Lung-function assessment revealed that lncIAPF overexpression affected the forced vital capacity (FVC) of mice (). H&E and Masson staining results presented massive collagen deposits, fibrosis lesions, and distorted lung architecture in the overexpressed lncIAPF group compared with those in the sham group (, E). Western blot results further confirmed that lncIAPF overexpression increased the levels of fibrotic and differentiation-related proteins including COL1A, VIM, ACTA2, FAP, S100A4 and decreased that of epithelial marker CDH1/E-cadherin (). Meanwhile, the expression of enhanced autophagic proteins including SQSTM1, LC3II:LC3I, ELAVL1, EZH2, STAT1 and FOXK1 () was increased, suggesting that lncIAPF promotes pulmonary fibrosis by blocking autophagy in vivo.
Figure 8. Assessment of lncIAPF as a potential therapeutic target in mice. (A) Adenoviral lncIAPF was inhaled by mice through spraying. (B) qRT-PCR results clarified that overexpressed lncIAPF was highly expressed in the mouse model, indicating that the adenovirus vector was constructed successfully. (C) FVC results described that overexpressed lncIAPF affected the lung function of mice compared with that in the control group. (D) Histological images of lung paraffin sections stained with H&E manifested that the alveolar walls were thickened and filled with pink collagen in the overexpressed lncIAPF group. (E) Collagen deposition increased in the lung tissue of overexpressed lncIAPF-treated mice detected by Masson’s trichrome staining. (F) Fibrotic proteins such as COL1A, VIM and ACTA2 increased in the overexpressed lncIAPF-treated mice. The levels of differentiation-related proteins FAP and S100A4 also increased, but that of the epithelial marker CDH1 decreased. (G) Autophagy proteins SQSTM1 and LC3II:LC3I had increased levels in overexpressed lncIAPF-treated mice. (H) Body weight monitoring revealed that BLM-treated mice lost substantial body mass compared with sham mice. si-ELAVL1 effectively blocked this loss compared with the control group. (I) MicroCT imaging system for small animal demonstrated that fibrosis changes occurred in both lungs in BLM group, and the degree of fibrosis was significantly reduced in si-ELAVL1 group. (J) Lung function assessment demonstrated that the FVC was improved in si-ELAVL1 group. (K) H&E and Masson images revealed that excess collagen was deposited and the alveolar wall became thicker in BLM group, and si-ELAVL1 attenuated collagen deposition. (L) Western blot results showed that the levels of fibrotic, differentiation-related proteins and autophagic proteins reduced in si-ELAVL1 group. Each bar represents the mean ± SD; n = 6; *p < 0.05.
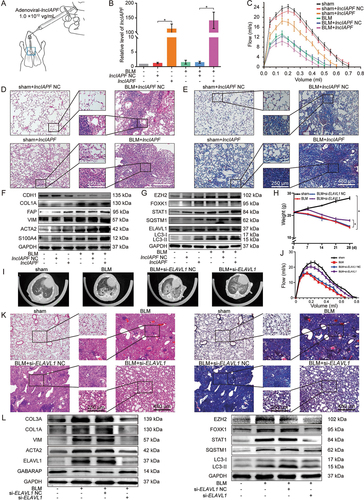
To improve the convincing mechanism and overcome the low degree homology of lncIAPF in mice, we synthesized si-ELAVL1 packaged into the adenovirus vector to spray into the mouse lung. Body weight monitoring revealed that BLM-treated mice lost substantial body mass compared with sham mice. However, si-ELAVL1 effectively blocked this loss compared with the control group (). The results of MicroCT imaging system for small animal demonstrated that fibrosis changes occurred in both lungs in BLM group, and the degree of fibrosis was significantly reduced in si-ELAVL1 group (). Lung function assessment demonstrated that the FVC was improved in si-ELAVL1 group (). H&E and Masson images revealed that excess collagen was deposited and the alveolar wall became thicker in BLM group, and si-ELAVL1 attenuated collagen deposition (). Western blot results further confirmed that the levels of fibrotic, differentiation-related and autophagic proteins reduced in si-ELAVL1 group (). The findings indicated that si-ELAVL1 had significant therapeutic effect. Meanwhile, the findings also suggested that lncIAPF promotes pulmonary fibrosis by blocking autophagy in vivo through the proposed mechanism.
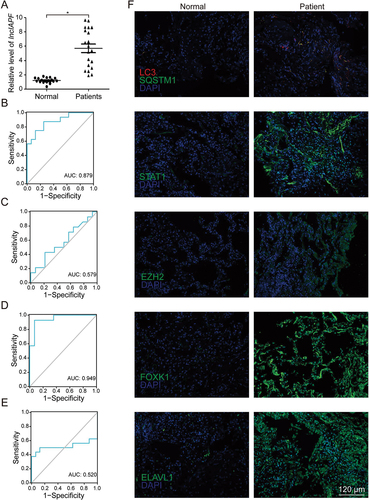
Finally, to assess the clinical application value, lncIAPF and the related gene expression were explored in patients with IPF. The characteristics and physiologies of patients with IPF were shown in . LncIAPF was highly upregulated in the blood collected from patients with IPF (). The receiver operating characteristic curve (ROC) between lncIAPF and FVC showed that the sensitivity and specificity values are 87.5% and 75.0% in IPF patients, respectively. The area under the ROC curve was 0.879 (). ROC curve between lncIAPF and DLco showed that the sensitivity and specificity values are 42.9% and 78.6%, respectively. The area under the ROC curve was 0.579 (). ROC curve between lncIAPF and PaO2 showed that the sensitivity and specificity values are 92.9% and 92.0%, respectively. The area under the ROC curve was 0.949 (). ROC curve between lncIAPF and PaCO2 showed that the sensitivity and specificity values are 50.0% and 87.5%, respectively. The area under the ROC curve was 0.520 (). Immunofluorescence staining of lung tissues revealed that LC3 and SQSTM1 increased in the patients with IPF. These findings imply that autophagy was blocked. The levels of ELAVL1 and its target genes EZH2, STAT1 and FOXK1 also increased in the patients with IPF (). These clinical findings corroborated the in vivo and in vitro results, indicating that interference in lncIAPF expression may offer a novel biomarker or therapeutic approach against IPF.
Table 5. Characteristics and physiologies of IPF patients and the normal.
Figure 9. Assessment of lncIAPF value in IPF patients. (A) Expression levels of lncIAPF increased in 20 patients with IPF as detected by qRT-PCR. (B) ROC curve between lncIAPF and FVC showed that the sensitivity and specificity values are 87.5% and 75.0% in IPF patients, respectively. The area under the ROC curve was 0.879. Confidence interval (CI): 0.762–0.996. (C) ROC curve between lncIAPF and DLco showed that the sensitivity and specificity values are 42.9% and 78.6% in IPF patients, respectively. The area under the ROC curve was 0.579. Confidence interval (CI): 0.360–0.798. (D) ROC curve between lncIAPF and PaO2 showed that the sensitivity and specificity values are 92.9% and 92.0% in IPF patients, respectively. The area under the ROC curve was 0.949. Confidence interval (CI): 0.872–1.000. (E) ROC curve between lncIAPF and PaCO2 showed that the sensitivity and specificity values are 50.0% and 87.5% in IPF patients, respectively. The area under the ROC curve was 0.520. Confidence interval (CI): 0.281–0.758. (F) Red fluorescence of autophagosome and the expression of SQSTM1, ELAVL1, EZH2, STAT1, and FOXK1 all increased in IPF patients compared with those in the normal group. Blue fluorescence indicated DAPI. The images are representative of six independent experiments.
Discussion
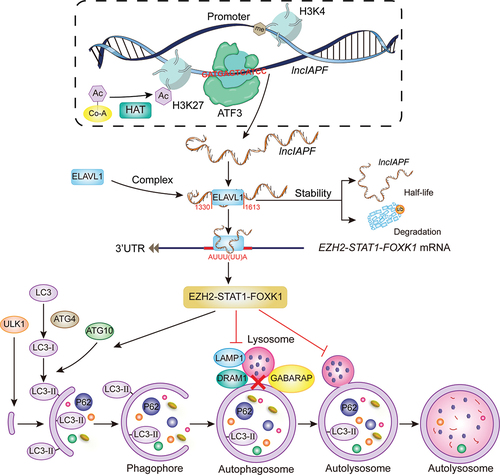
LncRNAs are crucial to epigenetic regulation and participate in the pathogenesis of various diseases [Citation26,Citation27]. Their location determines their regulatory mechanisms. Nuclear lncRNA mainly regulates chromatin, transcription, or alternative splicing; and cytoplasmic lncRNA mainly affects mRNA stability, protein translation, or posttranslational modification. For example, the nuclear lncRNA MALAT1 suppresses antiviral innate responses by directly binding to TARDBP/TDP43 (TAR DNA binding protein) in the nucleus and prevents the activation of TARDBP43 by blocking the activated CASP3 (caspase 3)-mediated TARDBP43 cleavage to TARDBP35. The cleaved TARDBP35 increases the nuclear IRF3 protein level by binding and degrading Rbck1 pre-mRNA to prevent IRF3 proteasomal degradation upon viral infection, thus selectively promoting antiviral IFN-I production [Citation28]. The cytoplasmic lncRNA H19-DMD (dystrophin) interactions inhibit E3-ligase-dependent polyubiquitination at Lys 3584 in Duchenne muscular dystrophy, thus preventing protein degradation [Citation29]. The pan-cancer lncRNA MILIP mainly located in cytoplasm is critical for cancer cell survival, division, and tumorigenicity. Yu et al. reported that MYC/c-Myc can alternatively inactivate TP53/p53 through the lncRNA MILIP, which restrains TP53 SUMOylation by suppressing the SUMO E3 ligase TRIML2 (tripartite motif family like 2) and consequently facilitates TP53 polyubiquitination and turnover [Citation30]. In the present study, lncIAPF was found in the nucleus and cytoplasm and functioned as a pro-fibrotic factor to facilitate pulmonary fibrosis by promoting fibroblast-to-myofibroblast differentiation and myofibroblast proliferation and migration. Mechanistic studies revealed that H3K27ac and ATF3 bind to the chromatin open region of lncIAPF promoter and thereby enhance lncIAPF transcription. The highly expressed lncIAPF forms an RNA-protein complex with ELAVL1 to inhibit autophagosome fusion with lysosome by controlling the stability of the target genes EZH2, STAT1 and FOXK1 (). Moreover, the clinical value of lncIAPF as a therapeutic target for IPF was verified.
Figure 10. Mechanism of lncIAPF functioned as a pro-fibrotic factor that promotes pulmonary fibrosis.
Many factors can cause lncRNA expression changes. For example, 8p12 loci loss of LINCTSLNC8 reduces LINCTSLNC8 expression, leading to hepatocellular carcinoma malignancies [Citation31]. H3K27 acetylation-activated lncCCAT1 affects cell proliferation and migration by regulating SPRY4 and HOXB13 expression in esophageal squamous cell carcinoma [Citation32]. The transcription factor TP63 binds to the super enhancer at the LINC01503 locus and activates its transcription, leading to squamous cell carcinoma cell proliferation, migration, invasion, and xenograft tumor growth [Citation33]. However, no direct factors that induce lncRNA change in pulmonary fibrosis have been reported. Here, H3K27ac was found to activate the chromosome region of lncIAPF promoter opening during fibrogenesis. As a regulator, the transcription factor ATF3 bound to lncIAPF promoter and enhanced the lncIAPF expression.
LncRNAs are closely associated with the development of pulmonary fibrosis, particularly by acting as pro- or anti-fibrotic factors in several process such as alveolar epithelial cell injury [Citation34], fibroblast-to-myofibroblast transition, extracellular-matrix deposition [Citation35], and macrophage activation [Citation36]. LncRNA participation in fibroblast differentiation into myofibroblasts is one of the research focus on pulmonary fibrogenesis. For example, lncRNA DNM3OS contributes to fibroblast differentiation into myofibroblast function as a reservoir of three miRNAs, namely, MIR199A-5p, MIR199A-3p and MIR214-3p, through the TGFB signaling pathway [Citation37,Citation38]. LncPFAR enhances lung fibroblast activation by sponging MIR138 to regulate the YAP1-Twist axis [Citation39]. LncFENDRR [Citation40], lncCDKN2B-AS1 [Citation41] and lncPFAL [Citation42] can accelerate lung fibrosis by accelerating fibroblast differentiation into myofibroblast. Various kinds of ncRNAs, such as lncRNA, miRNA, circRNA and mRNA, can even form a fine regulatory network to control fibroblast differentiation into myofibroblast. Lnc865, lnc556, circ949, circ057, Mir29b-2-5p and STAT3 are typical examples. Among which, lnc865 and lnc556 can crosstalk with circ949 and circ057 by sponging Mir29b-2-5p to target STAT3 translocation. After phosphorylation, p-STAT3 as a transcription factor can be transported into the nucleus from the cytoplasm and activate gene expression [Citation43]. However, the lncRNA regulation of fibroblast-to-myofibroblast differentiation through the autophagy signal pathway in pulmonary fibrosis is poorly investigated. Our data reported that the highly upregulated lncIAPF promotes fibroblast-to-myofibroblast differentiation and myofibroblast proliferation and migration by blocking autophagy in pulmonary fibrosis.
Autophagy is a type II programmed cell death in which cellular components are sequestered in an autophagosome, which then fuses with a lysosome to degrade those contents. Dysregulated autophagy has implications in health and diseases [Citation44,Citation45]. In general, autophagy is a protective mechanism in the lung of patients with IPF [Citation46]. Autophagy deficiency in macrophages exacerbates inflammation and fibrosis following silica exposure [Citation47] and bleomycin challenge [Citation48]. Targeting autophagy in IPF, including the use of IL17A (interleukin 17A) neutralizing antibodies [Citation49], Mir449a [Citation50], or PDGFRB (platelet derived growth factor receptor beta) inhibitors, may offer a therapeutic potential [Citation51]. Recently, more and more lncRNAs are revealed to be involved in the regulation of autophagy. In-vitro and in-vivo experiments uncover that lncRNA EIF3J-DT activates autophagy and induced drug resistance in gastric cancer cells by targeting ATG14 [Citation52]. LncRNA SNHG11 aggravates oncogenic autophagy to facilitate cell proliferation, stemness, migration, invasion and epithelial-to-mesenchymal transition in gastric cancer [Citation53]. LncRNA BCYRN1-induced autophagy enhances asparaginase resistance in extranodal NK/T-cell lymphoma [Citation54]. In pulmonary fibrosis, Ni’s group found that silica-induced pulmonary fibrosis is facilitated by lncHOTAIR through the sponging of MIR326 and attenuated by the increased MIR326 expression through the promotion of the autophagy activity of fibroblasts by targeting PTBP1 (polypyrimidine tract binding protein 1). However, the direct regulation between lncHOTAIR and autophagy has not yet been clarified [Citation55]. The present study revealed that lncIAPF directly controls autophagy by blocking autophagosome fusion with lysosome depending on ELAVL1 in pulmonary fibrosis; knockin lncIAPF blocked autophagy, whereas lncIAPF knockdown enhanced this process. We reasoned that lncIAPF binds to ELAVL1 protein and blocks ELAVL1 susceptibility to ubiquitination and degradation, thereby increasing the levels of ELAVL1 and its target autophagy-related mRNAs such as EZH2, STAT1 and FOXK1 that are negatively associated with autophagy. These changes prevent autophagy.
As an RNA-binding protein, ELAVL1 participates in disease occurrence and progression by binding to lncRNAs. The macrophage-specific lncMAARS regulates apoptosis and atherosclerosis by tethering ELAVL1 in the nucleus [Citation56]. LncOCC-1 suppresses cell growth by destabilizing ELAVL1 protein in colorectal cancer [Citation16]. However, ELAVL1 binding to lncRNA in pulmonary fibrosis has not yet been reported. In this work, lncIAPF bound to ELAVL1 in pulmonary fibrosis and that the lncIAPF-ELAVL1 complex regulated autophagy flux through the target genes EZH2, STAT1 and FOXK1. EZH2 functions as a histone methyltransferase by catalyzing histone methylation at H3 Lys27. STAT1 and FOXK1 function as transcription factors and play important roles in cell growth, differentiation and death [Citation57–59]. As cytosolic genes, these three genes can control autophagy [Citation19–22]; however, this function has not been reported in pulmonary fibrosis. The findings indicated that together with the lncIAPF-ELAVL1 complex, these three genes negatively regulate autophagy in pulmonary fibrosis.
Although lncRNAs have been found in humans, only a small number of lncRNAs have been functionally characterized in pulmonary fibrosis, and most of their mechanisms are largely unknown. Our observations confirmed that lncIAPF overexpression accelerates fibroblast-to-myofibroblast differentiation by blocking autophagy in pulmonary fibrosis, and this effect is dependent on ELAVL1. This finding provides a novel treatment strategy related to autophagy for IPF.
Materials and methods
IPF patients
IPF patients were diagnosed in accordance with the American Thoracic Society and European Respiratory Society criteria for IPF, and age-matched healthy controls at Binzhou Medical University Hospital were included. All patients provided written informed consent, and ethical consent was obtained from the Committee of Binzhou Medical University.
Animal treatment
Experiments on the studied animals were approved by the Committee on the Ethics of Animal Experiments of Binzhou Medical University. Eight-week-old C57BL/6 mice were obtained from the Model Animal Research Center of Nanjing University (Nanjing, China). All mice were bred and maintained in a 12 h light/dark cycle and allowed free access to food and water. The mice were divided into different groups (10 mice in each group) according to the experimental requirements. The BLM-treated mouse was administered 5 mg/kg bleomycin, which was sprayed into the lungs using a Penn-Century MicroSprayer (Penn-Century Inc., Wyndmoor, PA, USA). The experimental mice were administered 1.0 × 10¹² vg/mL adenoviral-lncIAPF/NC or adenoviral-si-ELAVL1/NC, which was also sprayed into the lungs using a Penn-Century MicroSprayer. The sham group only received the same amount of normal saline as the control group. Lung tissues were harvested on the 28th day following treatment.
Cell model
Human fetal lung fibroblast (MRC-5 cell line) and mouse fibroblast (L929 cell line) were obtained from American Type Culture Collection (CCL-171™ and CCL-1™) and cultured at 37°C in an atmosphere containing 5% CO2 and in advanced minimum essential medium (MEM; Gibco, 11,090,081), supplemented with 10% fetal bovine serum. The cells were treated with 5 ng/mL TGFB1 (Gibco, PHG9202) for different times according to the requirement of experiments.
Western-blotWestern blot were performed using standard protocols established in our laboratory, specific steps were referred to published articles [Citation11]. The item number and brand of the antibody were listed in .
Table 6. The item number and brand of the antibody.
ATAC-seq
Fifty μL pre-cooled RSB (containing 0.1% NP40 [Thermo Scientific, 85,124], 0.1% Tween-20 [Thermo Scientific, 28,320], 0.01% digitalis saponin [MedChemExpress, HY-N4000]) was added to 5 × 10⁴ living cells, which were incubated on ice for 3 min. Then, 1 mL pre-cooled RSB only contained 0.1% Tween-20 was added and centrifuged at 500 g for 5 min. The supernatant was removed. The precipitate was resuspended with 50 μL transposition mix (TD, 2× reaction buffer from Nextera kit [Illumina, FC-121-1030], 25 µL; TDE1, Nextera Tn5 Transposase from Nextera kit, 2.5 µL; and nuclease-free H2O 22.5 µl; total volume 50 µL), and placed into a mixometer (Youning, Hangzhou China) at 177 × g for 30 min. The DNA was first purified with Qiagen MinElute PCR Purification Kit (QIAGEN, 28,004), and was further purified with Zymo DNA Clean and Concentrator-5 Kit (ZYMO RESEARCH, D4004). Then PCR was performed in a 50 μL final volume as follows: 7 cycles of 98°C for 3 min, 98°C for 15s, and 63°C for 30s, finally, 72°C for 30s, 72°C for 5 min. The PCR product was sequenced by illuminaHiSeq/NextSeq platform. Subsequently, the data was analyzed using unique mapped reads.
Real-time cellular proliferation and migration analyses
Cells (5 × 10⁴) were cultured in E-plate (proliferation plate; Agilent, 5,469,830,001) and CIM-plate (migration plate; Agilent, 05665817001), respectively, in an RTCA DPlus instrument system. The proliferation and migration curves were automatically recorded by the system. Cell index representing the amount of proliferating or migrating cells was calculated by using RTCA from ACEA Biosciences (ACEA Biosciences, China), as previously described in a study [Citation11].
Wound healing assay
Cells (5 × 10⁵) were seeded in a 96-well plate and incubated in an incubator. After overnight incubation, the cells were wounded with cell scratcher, washed with PBS (SparkJade, CR0013-500ML), replaced with complete medium culture, and placed in IncuCyte S3 live-cell analysis system (Essen BioScience, USA) for real-time dynamic observation. Images were taken on IncuCyte S3 software.
RNA affinity-isolation assay
RNA affinity-isolation assay was carried out as previously described [Citation11]. Briefly, lncIAPF transcripts were transcribed using T7 and SP6 RNA polymerase in vitro, then by using the RNeasy Plus Mini Kit (QIAGEN, 74,134) and treated with TURBO DNase I. Purified RNAs were biotin-labeled using Biotin RNA Labeling Mix (Roche Diagnostics, 11,685,597,910). The biotinylated lncIAPF and its antisense RNAs were mixed and incubated with cell lysates. Then, avidin magnetic beads were added to each binding reaction, and the mixtures were incubated. The binding proteins were separated by SDS-PAGE, visualized by silver staining and identified by regular liquid chromatography-mass spectrometry and western blot analysis.
Human autophagy RT2 profiler PCR arrary
Cells were collected and extracted RNA. Complementary DNA synthesis was performed according to the RT2 First Strand kit (QIAGEN, 330,404). After cDNA obtainment, the PCR reaction was carried out in a 25 μL final volume using 40 ng cDNA as follows: initial denaturation at 95°C for 10 min, followed by 40 cycles of 95°C for 15s, 55°C for 35s and 72°C for 30 min.
RNA FISH observation
RNA FISH was performed with the FISH kit according to the manufacturer’s protocol (Ribo Bio Technology, C10910). Cells were seeded in a 24-well plate. When the cell density reached 50–60%, the medium was discarded and 4% paraformaldehyde was added. After washing with PBS, 500 μL of pre-cooled permeate solution was added into cell samples for 3 min. Then permeate solution was washed away with PBS, 200 μL pre-hybridization buffer was added to each well and incubated for 30 min. Subsequently, 100 μL 20 μM lncIAPF, RNA18S and RNU6 FISH Probe Mix were added to each well and incubated overnight. Cells were washed with SSC (Solarbio, S1030) and PBS solution, and stained with DAPI staining solution for 10 min. Finally, the images were observed with a confocal microscope.
RIP analysis
RIP assays were performed using an EZ-Magna RIP™ RNA-binding protein immunoprecipitation kit (Millipore, 17–701) according to the manufacturer’s instructions. Cells at approximately 90% confluence was lysed using complete RIP lysis buffer containing RNase inhibitor and protease inhibitor and then 100 μL of whole cell extract was incubated with RIP buffer containing magnetic beads conjugated to specific antibody (Cell Signaling Technology, 12,582). The nonspecific control was normal rabbit anti-IgG antibody (Cell Signaling Technology, 2729). Purified RNA was subjected to qRT-PCR analysis.
ChIP-PCR
ChIP-PCR was performed following the SimpleChIP® Plus Sonication Chromatin IP Kit protocol (Cell Signaling Technology, 56,383). Briefly, cells were crosslinked with 1% formaldehyde in culture medium for 10 min at room temperature, and chromatin from lysed nuclei was sheared to 200–600 bp fragments. Chromatin was immunoprecipitated with antibody of ATF3 (Cell Signaling Technology, 18,665) or normal rabbit IgG (Cell Signaling Technology, 2729) overnight. Antibody/antigen complexes were recovered with Protein G agarose beads (Cell signaling technology, 9007) for 2 h at 4°C. Two sequential elutions were performed. Eluted chromatin was diluted 1:3 with lysis buffer, supplemented with 1% Triton X-100 (Sigma-Aldrich, 9036–19-5) and incubated with 3 mg of normal rabbit IgG or anti-ATF3 antibody, overnight at 4°C. The immunoprecipitated DNA was collected. Purified DNA was performed with ChIP-PCR. The amount of immunoprecipitated DNA in each sample was determined as the fraction of the input and normalized to the IgG control.
Half-life of mRNAs analysis
1 × 10⁶/mL MRC-5 cells were seeded in a six-well plate including the control group, TGFB1-induced group, si-ELAVL1-treated group. Cells in control group were treated with 5 μg/mL actinomycin D (Aladdin, A13142-5 mg) alone for 4 h. Cells in TGFB1-induced group were first treated with 5 μg/mL TGFB1 for 24 h, then co-treated with 5 μg/mL actinomycin D for 4 h. Cells in si-ELAVL1-treated group were first treated with 5 μg/mL TGFB1 for 24 h, then co-treated with 10 μg/mL si-ELAVL1 for 24 h, finally co-treated with 5 μg/mL actinomycin D for 4 h. EZH2, STAT1 and FOXK1 levels were measured by qRT-PCR at actinomycin D treatment for different times. GAPDH was used as an internal standard.
ELAVL1 stability assay
MRC-5 cells were seeded in a 6-cm cell culture plate. Cycloheximide (HX-R, T181074-1 g) was added to the medium at a final concentration of 10 μg/mL, thereby inhibited the synthesis of ELAVL1 protein. After cycloheximide treatment for different times, MRC-5 cell was harvested. The levels of ELAVL1 and GAPDH (Affinity, AF7021) proteins were detected by western blot.
Ubiquitination analysis
Cell samples were lysed in NP-40 lysis buffer (Thermo Scientific, 85,124) at 4°C for 30 min. The cell lysates were first incubated with antibodies of ELAVL1 and control IgG at 4°C overnight, and then were incubated with protein A/G (Absin, F08D04) beads for 3 h at 4°C. The beads were washed for three times with NP-40 lysis buffer. Western blotting analysis was carried out against anti-ubiquitin antibody (Abcam, ab134953).
Dual-fluorescence mRFP-GFP-LC3 detection
MRC-5 cell samples were seeded in a 24-well plate. 3 μL Dual-fluorescence mRFP-GFP-LC3 virus stock solution (Hanbio Inc, Shanghai, China) was diluted in 250 μL 10% FBS MEM medium and added into each well. After hatching for 2 h, the MEM medium contained virus was removed and the fresh MEM medium without FBS was added. After hatching for 12 h, real time dynamic changes of cells were monitored under the IncuCyte S3 (Essen BioScience, USA) instrument and images were collected using a confocal microscope.
Statistical analysis
Statistical analysis were performed using SPSS version 19.0 software. Data were presented as the mean ± SD of at least three independent experiments. Unpaired Student’s t test was used for experiments comparing two groups, whereas one-way ANOVA with Student-Newman-Keuls post hoc test was applied for experiments comparing three or more groups. Statistical significance was considered at p < 0.05.
Supplemental Material
Download Zip (8.2 MB)Acknowledgments
This work was supported by the National Natural Science Foundation of China (81970064, 81870001, 82170085, 81670064, and 31670365), the Important Project of Research and Development of Shandong Province (2019GSF108040), and the Natural Science Foundation of Shandong Province (ZR2020MH009, ZR2020MH010, ZR2019PH101, ZR2018PH001).
Disclosure statement
No potential conflict of interest was reported by the author(s).
Supplementary material
Supplemental data for this article can be accessed here
Additional information
Funding
References
- Raghu G, Remy-Jardin M, Myers JL, et al. Diagnosis of idiopathic pulmonary fibrosis. An official ATS/ERS/JRS/ALAT clinical practice guideline. Am J Respir Crit Care Med. 2018;198(5):e44–e68.
- Raghu G. Idiopathic pulmonary fibrosis: shifting the concept to irreversible pulmonary fibrosis of many entities. Lancet Respir Med. 2019;7(11):926–929.
- Sarropoulos I, Marin R, Cardoso-Moreira M, et al. Developmental dynamics of lncRNAs across mammalian organs and species. Nature. 2019;571(7766):510–514.
- Guo CJ, Ma XK, Xing YH, et al. Distinct processing of lncRNAs contributes to non-conserved functions in stem cells. Cell. 2020;181(3):621–636.e22.
- Hessels D, Klein GJ, van Oort I, et al. DD3(PCA3)-based molecular urine analysis for the diagnosis of prostate cancer. Eur Urol. 2003;44(1):8–15.
- Dallner OS, Marinis JM, Lu YH, et al. Dysregulation of a long noncoding RNA reduces leptin leading to a leptin-responsive form of obesity. Nat Med. 2019;25(3):507–516.
- Liang H, Pan Z, Zhao X, et al. LncRNA PFL contributes to cardiac fibrosis by acting as a competing endogenous RNA of let-7d. Theranostics. 2018;8(4):1180–1194.
- Xiao T, Zou Z, Xue J, et al. LncRNA H19-mediated M2 polarization of macrophages promotes myofibroblast differentiation in pulmonary fibrosis induced by arsenic exposure. Environ Pollut. 2021;268(Pt A):115810.
- Feng M, Tang PM, Huang XR, et al. TGF-β mediates renal fibrosis via the Smad3-Erbb4-IR long noncoding RNA axis. Mol Ther. 2018;26(1):148–161.
- Zhang S, Chen H, Yue D, et al. Long non-coding RNAs: Promising new targets in pulmonary fibrosis. J Gene Med. 2021;23(3):e3318.
- Song X, Xu P, Meng C, et al. lncITPF promotes pulmonary fibrosis by targeting hnRNP-L depending on its host gene ITGBL1. Mol Ther. 2019;27(2):380–393.
- Liu H, Wang B, Zhang J, et al. A novel lnc-PCF promotes the proliferation of TGF-β1-activated epithelial cells by targeting miR-344a-5p to regulate map3k11 in pulmonary fibrosis. Cell Death Dis. 2017;8(10):e3137.
- Chang L, Zhou D, Luo S. Novel lncRNA LINC00941 promotes proliferation and invasion of colon cancer through activation of MYC. Onco Targets Ther. 2021;14:1173–1186.
- Liu H, Zhao X, Xiang J, et al. Interaction network of coexpressed mRNA, miRNA, and lncRNA activated by TGF-beta1 regulates EMT in human pulmonary epithelial cell. Mol Med Rep. 2017;16(6):8045–8054.
- Li Z, Schulz MH, Look T, et al. Identification of transcription factor binding sites using ATAC-seq. Genome Biol. 2019;20(1):45.
- Lan Y, Xiao X, He Z, et al. Long noncoding RNA OCC-1 suppresses cell growth through destabilizing HuR protein in colorectal cancer. Nucleic Acids Res. 2018;46(11):5809–5821.
- Nakahira K, Pabon Porras MA, Choi AM. Autophagy in pulmonary diseases. Am J Respir Crit Care Med. 2016;194(10):1196–1207.
- Mauthe M, Orhon I, Rocchi C, et al. Chloroquine inhibits autophagic flux by decreasing autophagosome-lysosome fusion. Autophagy. 2018;14(8):1435–1455.
- Füllgrabe J, Klionsky DJ, Joseph B. The return of the nucleus: transcriptional and epigenetic control of autophagy. Nat Rev Mol Cell Biol. 2014;15(1):65–74.
- Bowman CJ, Ayer DE, Dynlacht BD. Foxk proteins repress the initiation of starvation-induced atrophy and autophagy programs. Nat Cell Biol. 2014;16(12):1202–1214.
- Ambjørn M, Ejlerskov P, Liu Y, et al. IFNB1/interferon-beta-induced autophagy in MCF-7 breast cancer cells counteracts its proapoptotic function. Autophagy. 2013;9(3):287–302.
- Chen H, Tu SW, Hsieh JT. Epigenetic regulation of autophagy by the methyltransferase EZH2 through an MTOR-dependent pathway. Autophagy. 2015;11(12):2309–2322.
- McEwan DG, Popovic D, Gubas A, et al. PLEKHM1 regulates autophagosome-lysosome fusion through HOPS complex and LC3/GABARAP proteins. Mol Cell. 2015;57(1):39–54.
- Yu M, Jiang Y, Feng Q, et al. DRAM1 protects neuroblastoma cells from oxygen-glucose deprivation/reperfusion-induced injury via autophagy. Int J Mol Sci. 2014;15(10):19253–19264.
- Zeng Y, Du WW, Wu Y, et al. A circular RNA binds to and activates AKT phosphorylation and nuclear localization reducing apoptosis and enhancing cardiac repair. Theranostics. 2017;7(16):3842–3855.
- Goodall GJ, Wickramasinghe VO. RNA in cancer. Nat Rev Cancer. 2021;21(1):22–36.
- Statello L, Guo CJ, Chen LL, et al. Gene regulation by long non-coding RNAs and its biological functions. Nat Rev Mol Cell Biol. 2021;22(2):96–118.
- Liu W, Wang Z, Liu L, et al. LncRNA Malat1 inhibition of TDP43 cleavage suppresses IRF3-initiated antiviral innate immunity. Proc Natl Acad Sci U S A. 2020;117(38):23695–23706.
- Zhang Y, Li Y, Hu Q, et al. The lncRNA H19 alleviates muscular dystrophy by stabilizing dystrophin. Nat Cell Biol. 2020;22(11):1332–1345.
- Yu CF, Xiao YL, Liu T, et al. c-Myc inactivation of p53 through the pan-cancer lncRNA MILIP drives cancer pathogenesis. Nat Commun. 2020;11(1):4980.
- Zhang J, Li Z, Liu L, et al. Long noncoding RNA TSLNC8 is a tumor suppressor that inactivates the interleukin-6/STAT3 signaling pathway. Hepatology. 2018;67(1):171–187.
- Zhang E, Han L, Yin D, et al. H3K27 acetylation activated-long non-coding RNA CCAT1 affects cell proliferation and migration by regulating SPRY4 and HOXB13 expression in esophageal squamous cell carcinoma. Nucleic Acids Res. 2017;45(6):3086–3101.
- Xie JJ, Jiang YY, Jiang Y, et al. Super-Enhancer-Driven long non-coding RNA LINC01503, regulated by TP63, is over-expressed and oncogenic in squamous cell carcinoma. Gastroenterology. 2018;154(8):2137–2151.e1.
- Fukushima K, Satoh T, Sugihara F, et al. Dysregulated expression of the nuclear exosome targeting complex component Rbm7 in nonhematopoietic cells licenses the development of fibrosis. Immunity. 2020;52(3):542–556.e13.
- Liu P, Luo G, Dodson M, et al. The NRF2-LOC344887 signaling axis suppresses pulmonary fibrosis. Redox Biol. 2021;38:101766.
- Cui H, Banerjee S, Guo S, et al. Long noncoding RNA Malat1 regulates differential activation of macrophages and response to lung injury. JCI Insight. 2019;4(4):e124522.
- Savary G, Dewaeles E, Diazzi S, et al. The long noncoding RNA DNM3OS is a reservoir of fibromiRs with major functions in lung fibroblast response to TGF-β and pulmonary fibrosis. Am J Respir Crit Care Med. 2019;200(2):184–198.
- Jiang D, Liang J. A long noncoding RNA links TGF-β signaling in lung fibrosis. Am J Respir Crit Care Med. 2019;200(2):123–125.
- Zhao X, Sun J, Chen Y, et al. lncRNA PFAR promotes lung fibroblast activation and fibrosis by targeting miR-138 to regulate the YAP1-Twist axis. Mol Ther. 2018;26(9):2206–2217.
- Huang C, Liang Y, Zeng X, et al. Long noncoding RNA FENDRR exhibits antifibrotic activity in pulmonary fibrosis. Am J Respir Cell Mol Biol. 2020;62(4):440–453.
- Du Y, Hao X, Liu X. Low expression of long noncoding RNA CDKN2B-AS1 in patients with idiopathic pulmonary fibrosis predicts lung cancer by regulating the p53-signaling pathway. Oncol Lett. 2018;15(4):4912–4918.
- Li X, Yu T, Shan H, et al. lncRNA PFAL promotes lung fibrosis through CTGF by competitively binding miR-18a. FASEB J. 2018;32(10):5285–5297.
- Li C, Wang Z, Zhang J, et al. Crosstalk of mRNA, miRNA, lncRNA, and circRNA and their regulatory pattern in pulmonary fibrosis. Mol Ther Nucleic Acids. 2019;18:204–218.
- Levine B, Kroemer G. Biological functions of autophagy genes: a disease perspective. Cell. 2019;176(1–2):11–42.
- Dong X, Yang Y, Zou Z, et al. Sorting nexin 5 mediates virus-induced autophagy and immunity. Nature. 2021;589(7842):456–461.
- Racanelli AC, Kikkers SA, Choi AMK, et al. Autophagy and inflammation in chronic respiratory disease. Autophagy. 2018;14(2):221–232.
- Jessop F, Hamilton RF, Rhoderick JF, et al. Autophagy deficiency in macrophages enhances NLRP3 inflammasome activity and chronic lung disease following silica exposure. Toxicol Appl Pharmacol. 2016;309:101–110.
- Abdel Fattah E, Bhattacharya A, Herron A, et al. Critical role for IL-18 in spontaneous lung inflammation caused by autophagy deficiency. J Immunol. 2015;194(11):5407–5416.
- Mi S, Li Z, Yang HZ, et al. Blocking IL-17A promotes the resolution of pulmonary inflammation and fibrosis via TGF-beta1-dependent and -independent mechanisms. J Immunol. 2011;187(6):3003–3014.
- Han R, Ji X, Rong R, et al. MiR-449a regulates autophagy to inhibit silica-induced pulmonary fibrosis through targeting Bcl2. J Mol Med (Berl). 2016;94(11):1267–1279.
- Kobayashi K, Araya J, Minagawa S, et al. Involvement of PARK2-mediated mitophagy in idiopathic pulmonary fibrosis pathogenesis. J Immunol. 2016;197(2):504–516.
- Luo Y, Zheng S, Wu Q, et al. Long noncoding RNA (lncRNA) EIF3J-DT induces chemoresistance of gastric cancer via autophagy activation. Autophagy. 2021;17(12):4083–4101.
- Wu Q, Ma J, Wei J, et al. lncRNA SNHG11 promotes gastric cancer progression by activating the Wnt/β-Catenin pathway and oncogenic autophagy. Mol Ther. 2021;29(3):1258–1278.
- Wang L, Yang J, Wang HN, et al. LncRNA BCYRN1-induced autophagy enhances asparaginase resistance in extranodal NK/T-cell lymphoma. Theranostics. 2021;11(2):925–940.
- Xu T, Yan W, Wu Q, et al. MiR-326 inhibits inflammation and promotes autophagy in silica-Induced pulmonary fibrosis through targeting TNFSF14 and PTBP1. Chem Res Toxicol. 2019;32(11):2192–2203.
- Simion V, Zhou H, Haemmig S, et al. A macrophage-specific lncRNA regulates apoptosis and atherosclerosis by tethering HuR in the nucleus. Nat Commun. 2020;11(1):6135.
- Li B, Chng WJ. EZH2 abnormalities in lymphoid malignancies: underlying mechanisms and therapeutic implications. J Hematol Oncol. 2019;12(1):118.
- Duke KS, Taylor-Just AJ, Ihrie MD, et al. STAT1-dependent and -independent pulmonary allergic and fibrogenic responses in mice after exposure to tangled versus rod-like multi-walled carbon nanotubes. Part Fibre Toxicol. 2017;14(1):26.
- Sukonina V, Ma H, Zhang W, et al. FOXK1 and FOXK2 regulate aerobic glycolysis. Nature. 2019;566(7743):279–283.