
ABSTRACT
The mammalian Atg18 ortholog WIPI2 is a key regulator of LC3 lipidation to promote autophagosome biogenesis during nonselective macroautophagy, while its functions in selective autophagy such as mitophagy remain largely unexplored. In this study, we explored the role of WIPI2 in PINK1-PRKN/parkin-mediated mitophagy. First, we found that WIPI2 is recruited to damaged mitochondria upon mitophagy induction. Second, loss of WIPI2 impedes mitochondrial damaging agents-induced mitophagy. Third, at molecular level, WIPI2 binds to and promotes AAA-ATPase VCP/p97 (valosin containing protein) to damaged mitochondria; and WIPI2 depletion blunts the recruitment of VCP to damaged mitochondria, leading to reduction in degradation of outer mitochondrial membrane (OMM) proteins and mitophagy. Finally, WIPI2 is implicated in cell fate decision as cells deficient in WIPI2 are largely resistant to cell death induced by mitochondrial damage. In summary, our study reveals a critical regulatory role of WIPI2 in mitochondrial recruitment of VCP to promote OMM protein degradation and eventual mitophagy.
Abbreviations: ATG, autophagy related; CALCOCO2/NDP52, calcium binding and coiled-coil domain 2; CCCP, carbonyl cyanide chlorophenylhydrazone; CYCS, cytochrome c, somatic; HSPD1/HSP60, heat shock protein family D (Hsp60) member 1; IMM, inner mitochondrial membrane; MAP1LC3/LC3, microtubule associated protein 1 light chain 3; NPLOC4, NPL4 homolog, ubiquitin recognition factor; OMM, outer mitochondrial membrane; OPTN, optineurin; PtdIns3P, phosphatidylinositol-3-phosphate; PINK1, PTEN induced kinase 1; PRKN/Parkin, parkin RBR E3 ubiquitin protein ligase; UBXN6/UBXD1, UBX domain protein 6; UFD1, ubiquitin recognition factor in ER associated degradation 1; VCP/p97, valosin containing protein; WIPI2, WD repeat domain, phosphoinositide interacting 2
Introduction
Macroautophagy (refers to as autophagy hereafter) is an evolutionarily conserved process in which cytosolic contents are targeted for lysosomal degradation, which is essential for the maintenance of cellular homeostasis and cell survival [Citation1–3]. Mitophagy is a form of selective autophagy designated for the removal of damaged and superfluous mitochondria as a critical mechanism for mitochondria quality control [Citation4]. While both autophagy and mitophagy are important for health, compromised autophagy and mitophagy are drivers of aging and age-predisposed diseases, such as Alzheimer´s disease [Citation5,Citation6]. Mechanistic studies of the underlying molecular pathways of these fundamental cellular processes thus have clinical implications. At present, the molecular mechanisms of mitophagy have been extensively studied, mainly focusing on the PINK1 (PTEN induced kinase 1)-PRKN (parkin RBR E3 ubiquitin protein ligase)-dependent pathway in response to mitochondrial stress [Citation7,Citation8]. During PINK1-PRKN-dependent mitophagy, PINK1 phosphorylates ubiquitin (Ub) at Ser65 on mitochondria, with phospho-Ub serving as docking sites for PRKN binding to partly activate its E3 ligase activity [Citation9–11]. Upon binding to phospho-Ub, PRKN is subsequently phosphorylated by PINK1 within its ubiquitin-like (Ubl) domain, leading to full activation of PRKN [Citation12,Citation13]. In this way, PINK1 and PRKN form a feedforward loop to mediate the ubiquitination and proteasomal degradation of outer mitochondrial membrane (OMM) proteins and subsequent mitophagy [Citation8,Citation14]. Although the mechanism of PINK1-Parkin mitophagy has been extensively studied, the involvement of other key autophagy regulators in this process remains to be fully understood.
WIPI2 (WD repeat domain, phosphoinositide interacting 2) is a key autophagy protein coded by WIPI2, a mammalian homolog of yeast autophagy related gene Atg18 [Citation15]. WIPI2 binds to phosphatidylinositol 3-phosphate (PtdIns3P) and is responsible for recruitment of the ATG12–ATG5-ATG16L1 complex to mediate the conjugation of MAP1LC3/LC3 (microtubule associated protein 1 light chain 3) to phosphatidylethanolamine (PE) and subsequent autophagosome formation [Citation16]. Recent studies have shown that WIPI2 is a determinant of basal autophagy [Citation17–19] and is also required for selective autophagy such as xenophagy which eliminates invading pathogens [Citation16,Citation20]. Because xenophagy and mitophagy share similar pathways [Citation5], it is thus possible that WIPI2 may participate in mitophagy. However, the functions of WIPI2 in mitophagy have not been fully investigated. It was initially shown that WIPI2 plays a critical role in mitochondrial homeostasis, albeit the underlying mechanisms were not studied [Citation21]. It was found that phospho-S65-PRKN (p-PRKN S65) is upregulated at steady state in the cells with WIPI2 deletion [Citation21], suggesting that WIPI2 could be an upstream player to regulate PINK1-PRKN-mediated mitophagy. A more recent study has linked WIPI2 depletion to compromised PINK1-PRKN-dependent mitophagy [Citation22], with several important findings. First, proximity proteomics of OPTN (optineurin; one of the key mitophagy receptors) by using APEX2-tagged OPTN identified WIPI2 as a top hit. Second, reconstitution of WIPI2 in the WIPI2−/− cells revealed its localization on mitochondrial surface in depolarized cells. Third, there was a striking reduction of mitophagic flux in the WIPI2−/− cells. Finally, compared to other ATG proteins (including ULK1 (unc-51 like autophagy activating kinase 1), ATG2A, ATG3, ATG4B, ATG5, ATG7, ATG9A, ATG12, ATG14, ATG16L1 and ATG101) that were identified, depletion of WIPI2 displayed more pronounced inhibition of mitophagy [Citation22]. These studies together suggest a potential regulatory role of WIPI2 in mitophagy and in mitochondrial quality control.
Here, by using various cellular and imaging approaches to measure mitophagy, we first showed that WIPI2 was recruited to damaged mitochondria. WIPI2 mutually interacted with the VCP-UFD1-NPLOC4 complex and deletion of WIPI2 impaired mitochondrial translocation of VCP, leading to impaired degradation of OMM proteins and eventual mitophagy. Functionally, WIPI2 is implicated in cell fate as cells deficient in WIPI2 are largely resistant to cell death induced by mitochondrial damage. Thus, our study reveals a novel function of WIPI2 in mediating mitophagy, sheds lights on the molecular mechanisms of mitophagy regulation, and provides new clues for development of novel therapeutic strategies for mitophagy-related diseases.
Results
WIPI2 is recruited to damaged mitochondria upon mitochondrial depolarization
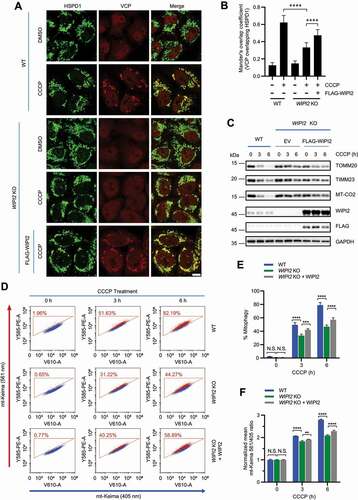
It has been previously reported that ectopically expressed WIPI2 localizes to mitochondrial surface in depolarized cells [Citation22]. To confirm whether endogenous WIPI2 goes through similar changes, we first performed a cellular fractionation assay in HeLa cells stably expressing PRKN (referred hereafter as YPH cells) to analyze the distribution of WIPI2 and observed an increase of WIPI2 in the mitochondrial fraction when mitochondrial depolarization was induced by oligomycin-antimycin (O/A) (). Next, we checked endogenous WIPI2 mitochondrial translocation by immunofluorescence staining upon mitochondrial depolarization induced by a mitochondrial uncoupler carbonyl cyanide chlorophenylhydrazone (CCCP) at various time points. While WIPI2 was almost diffused in the cytosol in untreated cells, it formed puncta upon mitochondrial depolarization in YPH cells post CCCP treatment (). Notably, these WIPI2 puncta were in close proximity to depolarized mitochondria (). We subsequently tested whether WIPI2 puncta formation during mitophagy requires PRKN. Unlike what were observed in YPH cells, there was no similar mitochondrial translocation of WIPI2 following CCCP treatment in HeLa cells that do not express PRKN (Figure S1A-S1C), suggesting that mitochondrial translocation of WIPI2 requires PRKN.
Figure 1. WIPI2 is recruited to damaged mitochondria. (A) YPH cells were treated with or without 1 μM O/A for 4 h. Subcellular fractionation was then performed to isolate the cytosolic and mitochondrial fractions. TIMM23 and GAPDH were used as mitochondrial and cytosolic markers, respectively. (B-D) YPH cells were treated with or without 20 μM CCCP. Subsequently, the cells were fixed at the indicated time points and stained with antibodies against WIPI2 and HSPD1. The cells were then imaged under a confocal microscope (B). Scale bar: 10 μm. The number of WIPI2 puncta per cell was quantified and presented in (C) and colocalization of WIPI2 with HSPD1 was quantified by Mander’s overlap coefficient (D). 120 cells from three independent experiments were analyzed. Columns, mean; bars, ± S.D. (*, P < 0.05; **, P < 0.01; ****, P < 0.0001; One way ANOVA with Dunnett’s multiple comparisons test). (E) YPH cells were treated with or without 20 μM CCCP. Subsequently, the cells were fixed at the indicated time points and stained with antibodies against WIPI2 and CALCOCO2. The cells were then imaged under a confocal microscope. Scale bar: 10 μm. (F) The percentage of WIPI2 puncta colocalized with CALCOCO2 was quantified in cells treated as in (E). 120 cells from three independent experiments were analyzed. Columns, mean; bars, ± S.D. (*, P < 0.05; ***, P < 0.001; ****, P < 0.0001; One way ANOVA with Dunnett’s multiple comparisons test). (G) YPH cells were treated with or without 20 μM CCCP. Subsequently, the cells were fixed at the indicated time points and stained with antibody against WIPI2 and OPTN. The cells were then imaged under a confocal microscope. Scale bar: 10 μm. (H) The percentage of WIPI2 puncta colocalized with OPTN was quantified in cells treated as in (G). 120 cells from three independent experiments were analyzed. Columns, mean; bars, ± S.D. (**, P < 0.01; ****, P < 0.0001; One way ANOVA with Dunnett’s multiple comparisons test).
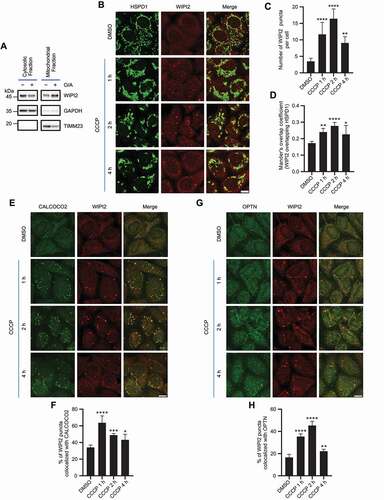
The autophagy receptors such as CALCOCO2/NDP52 (calcium binding and coiled-coil domain 2) and OPTN are recruited to mitochondria upon mitophagy initiation [Citation23–25]. Here we also observed that WIPI2 colocalized with the autophagy receptors including CALCOCO2 () and OPTN () upon mitochondrial damage induced by CCCP. Collectively, these data suggest that WIPI2 is recruited to damaged mitochondria upon treatment with depolarizing agents such as CCCP.
Deletion of WIPI2 inhibits mitophagy
To further study the role of WIPI2 in mitophagy, we first knocked down WIPI2 expression using siRNA against WIPI2 (siWIPI2) in YPH cells. Transfection of siWIPI2 in YPH cells for 72 h markedly reduced endogenous WIPI2 expression (Figure S2A). Upon mitophagy induction by CCCP, WIPI2 KD significantly attenuated the degradation of OMM proteins, such as MFN2 (mitofusin 2) and TOMM20 (translocase of outer mitochondrial membrane 20); it also impaired the reduction of inner mitochondrial membrane (IMM) proteins, such as TIMM23 (translocase of inner mitochondrial membrane 23) and MT-CO2 (mitochondrially encoded cytochrome c oxidase II) (Figure S2A). To further confirm this result, we generated a YPH-WIPI2 KO cell line by CRISPR-Cas9 technique. Consistent with a previous report [Citation15], LC3 lipidation is impaired in WIPI2 KO cells (Figure S2B-S2C). Impaired reduction of OMM and IMM proteins was also observed in YPH-WIPI2 KO cells upon mitochondrial depolarization induced by CCCP (). YPH-WIPI2 KO cells generated with a different sgRNA (YPH-WIPI2 KO-2) showed similar results (Figure S2D). Moreover, the reduction in OMM or IMM proteins was also inhibited in YPH-WIPI2 KO cells when mitophagy was induced by O/A (). Consistently, we also observed delayed degradation of TOMM20 in WIPI2 KO cells upon mitochondrial depolarization by immunofluorescence staining (Figure S2E-S2F). Additionally, in HEK293A cells which express endogenous PRKN (Figure S2G) [Citation26], WIPI2 KO also attenuated the reduction of OMM or IMM proteins upon CCCP treatment (Figure S2H). Together, these data suggest that depletion of WIPI2 impairs reduction of both OMM and IMM proteins induced by mitochondrial damage agents.
Figure 2. Depletion of WIPI2 inhibits mitophagy. (A and B) YPH wild-type (WT) or WIPI2 KO cells were treated with either 20 μM CCCP (A) or 1 μM O/A (B) and harvested at the indicated time points for western blotting analysis with the indicated antibodies. (C) YPH-mt-Keima WT or WIPI2 KO cells were lysed for western blotting analysis to confirm the knockout effects of WIPI2. (D-F) YPH-mt-Keima WT or WIPI2 KO cells were treated with 20 μM CCCP and harvested at the indicated time points for FACS analysis by excitation at 405 nm (neutral pH) and 561 nm (acidic pH). The gated area encloses cells undergoing mitophagy, and the percentage of cells within this gate is indicated in the top-left corner of each plot (D). The percentage of cells undergoing mitophagy (E) and the relative mean mt-Keima 561/405 ratio (F) were quantified in cells treated as in (D). Columns, mean; bars, ± S.D. of 3 independent experiments (N.S., no significance; *, P < 0.05; **, P < 0.01; ****, P < 0.0001; Two-way ANOVA with Sidak’s multiple comparisons test). (G and H) YPH WT or WIPI2 KO cells were treated with either DMSO or 20 μM CCCP for 6 h and then fixed with 4% PFA. The cells were then stained with anti-DNA antibody and imaged under microscope (G). Scale bar: 20 μm. The relative intensity of mtDNA in the samples treated as in (G) was quantified (n = 30) (H). The intensity of the mtDNA in the WT group treated with DMSO was normalized as 1. Columns, mean; bars, ± S.D. (N.S., no significance; ****, P < 0.0001; Two-way ANOVA with Sidak’s multiple comparisons test).
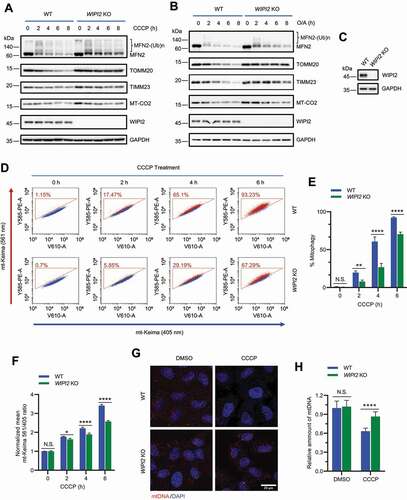
To further examine the effects of WIPI2 on mitophagy, we also utilized the mitochondrial targeted Keima (mt-Keima) assay as a quantitative approach to measure mitophagy [Citation27,Citation28]. As shown in Figure S2I, YPH-mt-Keima cells displayed a striking spectral shift upon mitochondrial depolarization induced by CCCP, which was reversed by treatment of bafilomycin A1 (a lysosome inhibitor), confirming the effectiveness of this assay. We observed that WIPI2 KO largely attenuated the spectral shift upon mitochondrial depolarization, suggesting a lower level of mitophagy in WIPI2 KO cells (). We further confirmed this result in two other WIPI2 KO cell lines generated from YPH-mt-Keima cells with different sgRNAs (Figure S2J-S2M). The clearance of damaged mitochondrial DNA (mtDNA) is another quantitative approach to measure mitophagy [Citation25]. We also compared the level of mtDNA in both WT and WIPI2 KO cells upon mitophagy induction and found that the clearance of mtDNA was markedly blocked in WIPI2 KO cells, but not in WT cells (). Together, these data suggest that mitophagy is inhibited when WIPI2 is depleted.
WIPI2 interacts with the VCP complex
Having established the positive regulatory role of WIPI2 in mitophagy, we next attempted to explore the underlying molecular mechanisms. Here we performed a Mass Spectrometry (MS) analysis to identify the WIPI2-interacting proteins by FLAG pulldown in YPH cells overexpressing FLAG-WIPI2. We identified ~280 interacting proteins and among them about 50 were mitochondrial proteins, such as ATP5F1A/ATP5A (ATP synthase F1 subunit alpha), ATP5F1C/ATP5C (ATP synthase F1 subunit gamma), ATP5MF/ATP5J2 (ATP synthase membrane subunit f), IMMT/MIC60 (inner membrane mitochondrial protein), OPA1 (OPA1 mitochondrial dynamin like GTPase), PHB2 (prohibitin 2), and TOMM20 (Figure S3A and Table S1). Among the list of the interacting proteins identified, we were particularly interested in VCP (valosin containing protein) and its co-factor UFD1 (ubiquitin recognition factor in ER associated degradation 1), due to their well-established function in mitophagy and mitochondrial quality control [Citation29–33].
We next performed co-immunoprecipitation assays and verified the interaction between endogenous WIPI2 and VCP (). Reciprocal co-immunoprecipitation assays showed that ectopically expressed WIPI2 and VCP mutually interacted with each other (). There are four domains within VCP including the N domain, D1 domain, D2 domain and C-terminus domain (). To understand which domain of VCP is required for its interaction with WIPI2, we generated various FLAG-VCP constructs lacking one or two of these domains as described in . Deletion of the N domain or the D2 domain appeared to reduce the interaction of VCP with WIPI2 (). The N domain of VCP is known to mediate the binding of co-factors [Citation34,Citation35]. Consistently, NPLOC4 (NPL4 homolog, ubiquitin recognition factor), as one of the well-known co-factors for VCP, was unable to interact with VCP in the absence of the N domain (). We thus asked whether WIPI2 also interact with the VCP co-factors.
Figure 3. WIPI2 interacts with the VCP complex. (A) YPH cells were treated with or without 20 μM CCCP for 2 h. Subsequently, the cells were harvested for immunoprecipitation with anti-WIPI2 antibody and analyzed by western blotting. (B and C) HEK293T cells were transfected with WIPI2-MYC and/or FLAG-VCP as indicated for 24 h and were lysed with IP lysis buffer. The cell lysates were subjected to MYC IP (B) or FLAG IP (C) and analyzed by western blotting. (D) Schematic diagram of VCP full length construct or VCP constructs deleted by the indicated domains. (E) HEK293T cells were transfected with plasmids described in (D) for 24 h. The cells were then lysed and subjected to IP with antibody against HA and analyzed by western blotting. (F) HEK293T cells were transfected with WIPI2-MYC and either empty vector, UBXN6-HA, UFD1-HA or NPLOC4-HA as indicated for 24 h and were lysed with IP lysis buffer. The cell lysates were then subjected to immunoprecipitation with anti-HA antibody and blotted with the indicated antibodies. (G and H) YPH cells were treated with 20 μM CCCP for 4 h, fixed with 4% PFA, stained with antibodies against NPLOC4 and HSPD1, and imaged under microscope (G). Scale bar: 10 μm. Colocalization between NPLOC4 and HSPD1 as in (G) was evaluated by Mander’s overlap coefficient (H). 120 cells from three independent experiments were analyzed. Columns, mean; bars, ± S.D. (**, P < 0.01; Student t-test).
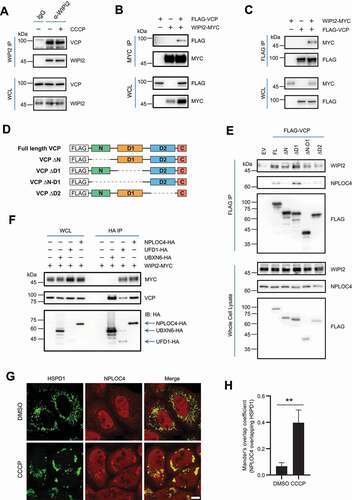
Various co-factors for VCP have been reported and among them, NPLOC4 and UFD1 are the most studied ones that interact with VCP to form the VCP-UFD1-NPLOC4 complex [Citation36]. Importantly, this complex has been shown to translocate to mitochondria upon mitophagy induction [Citation37]. The main function of this complex is to extract the ubiquitinated proteins from membrane structures and deliver them to the 26S proteasome for degradation [Citation36]. We found that WIPI2 was also able to interact with both co-factors (). Moreover, similar to VCP which translocate to damaged mitochondria [Citation29], we observed a substantial translocation of NPLOC4 from the cytosol to damaged mitochondria (), consistent with an earlier report [Citation37]. We next evaluated the interaction of WIPI2 with VCP, UFD1 or NPLOC4 under mitophagy induction condition. Generally, we did not observe significant changes of the interaction between WIPI2 and VCP or the two co-factors under mitophagy induction conditions ( and S3B-S3D), suggesting that the interaction between WIPI2 and the VCP-UFD1-NPLOC4 complex is constitutive. Of note, the interaction of UFD1 or NPLOC4 with VCP also remains unchanged under mitophagy induction condition (Figure S3C-S3D). UBXN6/UBXD1 (UBX domain protein 6) is another co-factor of VCP and has been shown to translocate to damaged mitochondria to promote mitophagy via recruiting VCP [Citation30]. Here we also observed mitochondrial translocation of UBXN6 upon mitochondrial damage induced by CCCP (Figure S3E). However, we failed to detect evident interaction between WIPI2 and UBXN6 under either basal condition () or mitophagy induction condition (Figure S3F).
WIPI2 is required for mitochondrial recruitment of VCP
VCP has been shown to be recruited to mitochondria to mediate mitophagy upon mitochondrial depolarization [Citation29,Citation37]. Consistently, we also observed that mitochondrial depolarization triggered by CCCP effectively induced mitochondrial recruitment of VCP (). Moreover, inhibition of VCP by NMS873, a potent and specific allosteric inhibitor of VCP [Citation38], dramatically impaired mitochondrial recruitment of VCP () and prevented TOMM20 degradation under mitochondrial depolarization conditions (), which is consistent with a previous study [Citation31]. However, inhibition of VCP by NMS873 did not prevent mitochondrial translocation of WIPI2 (Figure S4). It is known that mitochondrial recruitment of VCP is highly relied on PINK1 and PRKN [Citation29,Citation39,Citation40]. Here we also confirmed that mitochondrial recruitment of VCP was defective in HeLa cells deficient in PRKN (Figure S5A). Consistently, mitochondrial depolarization triggered degradation of OMM proteins was largely attenuated in cells deficient in PINK1 or PRKN (Figure S5B). These data therefore confirm the importance of mitochondrial recruitment of VCP in OMM proteins degradation in the course of PINK1-PRKN-mediated mitophagy. As degradation of OMM proteins was impaired in WIPI2 KO cells (), we wondered whether this is related to impaired PRKN translocation. However, translocation of PRKN to damaged mitochondria appeared to be unaffected in WIPI2 KO cells (Figure S5C-S5D), suggesting that other key players downstream of PRKN are involved.
Figure 4. WIPI2 KO impaired mitochondrial recruitment of VCP. (A and B) YPH cells were pretreated with or without NMS873 (10 μM) for 1 h and were then treated with either DMSO or CCCP (20 μM) as indicated for 4 h. The cells were subsequently fixed with 4% PFA, stained with antibodies against VCP and HSPD1, and imaged under microscope (A). Scale bar: 10 μm. Colocalization between VCP and HSPD1 as in (A) was evaluated by Mander’s overlap coefficient (B). 120 cells from three independent experiments were analyzed. Columns, mean; bars, ± S.D. (****, P < 0.0001; One way ANOVA with Dunnett’s multiple comparisons test). (C) YPH cells were pretreated with or without NMS873 (10 μM) for 1 h and were then treated with either DMSO or O/A (1 μM) as indicated. The cells were then harvested at the indicated time points and subjected to western blotting analysis with the indicated antibodies. (D) YPH cells were pretreated with either DMSO, CQ (25 μM), BafA1 (50 nM) or MG132 (10 μM) for 1 h. Subsequently, the cells were treated with or without CCCP (20 μM) for 6 h and subjected to western blotting analysis with the indicated antibodies. (E) YPH WT and WIPI2 KO cells were pretreated with or without NMS873 (10 μM) for 1 h. The cells were then treated with either DMSO or CCCP (20 μM) for 4 h and subjected to western blotting analysis with the indicated antibodies. (F and G) YPH WT and WIPI2 KO cells were treated with either DMSO or CCCP (20 μM) for 4 h. The cells were subsequently fixed with 4% PFA, stained with antibodies against VCP and HSPD1, and imaged under microscope (F). Scale bar: 10 μm. Colocalization between VCP and HSPD1 as in (F) was analyzed by Mander’s overlap coefficient (G). 120 cells from three independent experiments were analyzed. Columns, mean; bars, ± S.D. (N.S., no significance; ****, P < 0.0001; Two-way ANOVA with Sidak’s multiple comparisons test).
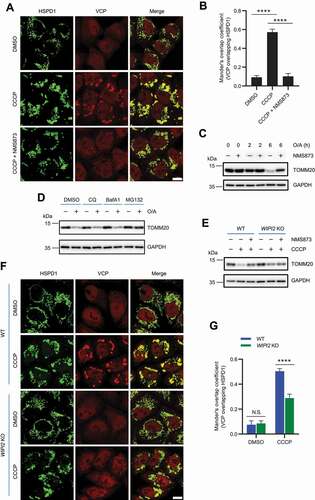
Consistent with an earlier report [Citation41], we also found that degradation of OMM proteins (such as MFN1, MFN2 and TOMM20) upon mitophagy induction could be blocked by the proteasome inhibitor MG132 ( and S5E). In comparison, inhibition of autophagy by lysosome inhibitors including chloroquine (CQ) and bafilomycin A1 (BafA1) was unable to block the degradation of OMM proteins under mitophagy induction conditions ( and S5F-S5G), indicating that degradation of OMM proteins during this process relies mainly on proteasome. It is thus possible that the impaired degradation of OMM proteins in WIPI2 KO cells is related to impaired VCP functions. Moreover, while degradation of TOMM20 was impaired in WIPI2 KO cells upon mitochondrial depolarization, addition of NMS873 did not further stabilize TOMM20 (), suggesting that WIPI2 and VCP work in the same pathway to regulate the turnover of OMM proteins in response to mitochondrial damage.
We therefore checked whether translocation of VCP to mitochondria upon mitochondrial depolarization was affected in WIPI2 KO cells and found that the amount of VCP recruited to damaged mitochondria was dramatically reduced compared to that in WT cells (). As the VCP total protein level in WIPI2 KO cells was comparable to that in WT cells (Figure S6A), the reduced level of VCP at mitochondria is most likely due to impaired recruitment to mitochondria in WIPI2 KO cells. Because WIPI2 requires PtdIns3P for its localization, we examined the effects of PIK3C3/VPS34 (phosphatidylinositol 3-kinase catalytic subunit type 3) inhibition on VCP mitochondrial recruitment with a potent and selective inhibitor SAR405 [Citation42]. As expected, SAR405 treatment, without affecting the total protein level of VCP (Figure S6B), inhibited VCP mitochondrial recruitment (Figure S6C-S6D). These data together demonstrate the importance of WIPI2 for mitochondrial recruitment of VCP in response to mitochondrial damage.
Reconstitution of WIPI2 rescues the impaired mitochondrial recruitment of VCP and defective mitophagy in WIPI2 KO cells
Having established that the impairment of VCP translocation to damaged mitochondria resulted in attenuated degradation of OMM proteins and defective mitophagy in WIPI2 KO cells, we next tried to rescue these defects by reconstitution of WIPI2. First, we observed that reconstitution of WIPI2 in WIPI2 KO cells promoted the translocation of VCP to damaged mitochondria (). Second, reconstitution of WIPI2 partially restored the impaired reduction of OMM protein (TOMM20) and IMM proteins (TIMM23 and MT-CO2) (). Finally, reconstitution of WIPI2 restored mitophagy in WIPI2 KO cells induced by CCCP, as detected by mt-Keima assay ().
Figure 5. Reconstitution of WIPI2 rescues the impaired mitochondrial recruitment of VCP and defective mitophagy in WIPI2 KO cells. (A and B) YPH WT and WIPI2 KO cells transfected with or without FLAG-WIPI2 were treated with either DMSO or CCCP (20 μM) for 4 h. The cells were then fixed with 4% PFA, stained with anti-HSPD1 and anti-VCP antibodies and imaged under microscope (A). Scale bar: 10 μm. Colocalization between VCP and HSPD1 as in (A) was evaluated by Mander’s overlap coefficient (B). 120 cells from three independent experiments were analyzed. Columns, mean; bars, ± S.D. (****, P < 0.0001; One way ANOVA with Dunnett’s multiple comparisons test). (C) YPH WT and WIPI2 KO transfected with either empty vector (EV) or FLAG-WIPI2 for 24 hours were treated with CCCP (20 μM) and harvested at the indicated time points for western blotting analysis with the indicated antibodies. (D-F) YPH-mt-Keima WT and WIPI2 KO cells transfected with or without FLAG-WIPI2 were treated with 20 μM CCCP. The cells were then harvested at the indicated time points for FACS analysis by excitation at 405 nm (neutral pH) and 561 nm (acidific pH). The gated area encloses cells undergoing mitophagy, and the percentage of cells within this gate is indicated in the top-left corner of each plot (D). The percentage of cells undergoing mitophagy (E) and the relative mean mt-Keima 561/405 ratio (F) were then quantified in cells treated as in (D). Columns, mean; bars, ± S.D. of 3 independent experiments (N.S., no significance; **, P < 0.01; ***, P < 0.001; ****, P < 0.0001; Two-way ANOVA with Sidak’s multiple comparisons test).
WIPI2 KO cells are resistant to cell death induced by mitochondrial depolarization
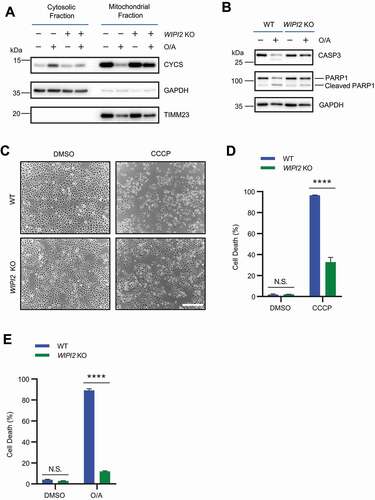
It has been shown that PRKN-mediated ubiquitination and proteasome-dependent degradation of OMM proteins results in mitochondrial membrane rupture upon mitochondrial depolarization [Citation41,Citation43]. Such mitochondrial membrane rupture has been linked to apoptotic cell death and could be prevented by proteasome inhibitors [Citation44]. As we observed defective degradation of OMM proteins in depolarized WIPI2 KO cells, we wondered whether mitochondrial depolarization-induced cell death could be attenuated in WIPI2 KO cells. To test this hypothesis, we first checked the subcellular distribution of CYCS (cytochrome c, somatic) which has been shown to be released from mitochondria in depolarized cells [Citation45]. Consistent with a previous study [Citation46], CCCP induced the release of CYCS from mitochondria to the cytosol in WT cells, which is inhibited in WIPI2 KO cells (). Consistently, CCCP also induced the cleavage of CASP3 (caspase 3) and PARP1 (poly(ADP-ribose) polymerase 1) in WT cells, which was also inhibited in WIPI2 KO cells (). We next checked the cell viability of YPH WT and WIPI2 KO cells under CCCP treatment condition and found that WIPI2 KO cells were much more resistant to cell death compared to WT cells (). Similar results were observed in cells depolarized by O/A (). Thus, it appears that deficiency of WIPI2 makes the cells more resistant to apoptotic cell death induced by mitochondrial damage agents.
Figure 6. WIPI2 KO cells are resistant to cell death induced by mitochondrial depolarization. (A) Subcellular fractionation was performed to isolate the cytosolic and mitochondrial fractions in YPH WT and WIPI2 KO cells treated with O/A (1 μM) for 4 h. The samples were then analyzed by western blotting with the indicated antibodies. TIMM23 and GAPDH (glyceraldehyde-3-phosphate dehydrogenase) were used as mitochondrial and cytosolic markers, respectively. (B) YPH WT and WIPI2 KO cells were treated with either DMSO or O/A (1 μM) for 24 h. The cells were then harvested for western blotting analysis with the indicated antibodies. (C) YPH WT and WIPI2 KO cells were treated with either DMSO or CCCP (20 μM) for 24 h. The cells were then imaged with phase contrast microscopy. Scale bar: 50 μm. (D) YPH WT and WIPI2 KO cells treated as in (C) were stained with propidium iodide (PI) and subjected to FACS analysis. Columns, mean; bars, ± S.D. of 3 independent experiments (N.S., no significance; ****, P < 0.0001; Two-way ANOVA with Sidak’s multiple comparisons test). (E) YPH WT and WIPI2 KO cells were treated with either DMSO or O/A (1 μM) for 24 h. Subsequently, the cells were stained with PI and subjected to FACS analysis. Columns, mean; bars, ± S.D. of 3 independent experiments (N.S., no significance; ****, P < 0.0001; Two-way ANOVA with Sidak’s multiple comparisons test).
Discussion
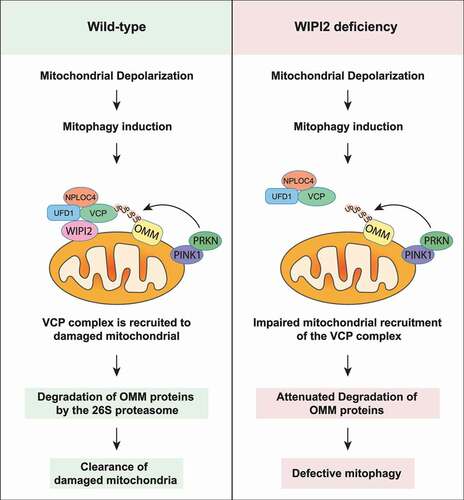
In this study, we discovered a novel function of WIPI2 in regulation of mitophagy. First, we found that WIPI2 was recruited to mitochondria upon mitochondrial depolarization and knockdown or knockout of WIPI2 impaired PINK1-PRKN-mediated mitophagy. Next, we revealed WIPI2 as an important binding partner of the VCP-UFD1-NPLOC4 complex, while deletion of WIPI2 impaired the recruitment of VCP to damaged mitochondria, subsequent degradation of OMM proteins, and eventual mitophagy. Finally, we found that WIPI2 KO cells were much more resistant to cell death induced by mitochondrial depolarization when compared to WT cells. In summary, we reveal a critical regulatory role of WIPI2 in mitophagy where WIPI2 interacts with and promotes VCP mitochondrial translocation, leading to OMM protein degradation and eventual mitophagy ().
Figure 7. Schematic model for the positive regulatory role of WIPI2 in mitophagy. Upon mitochondrial depolarization, WIPI2 and the VCP complex are recruited to damaged mitochondria. VCP then extracts the OMM proteins ubiquitinated by PRKN and delivered them to the 26S proteasome for degradation. This process ultimately promotes the clearance of damaged mitochondria via mitophagy. Upon WIPI2 deficiency, mitochondrial recruitment of VCP is impaired, which impairs degradation of OMM proteins and delays mitophagy.
WIPI2 is well known as a key PtdIns3P effector required for recruitment of ATG12–ATG5-ATG16L1 complex to facilitate LC3 lipidation and autophagosome biogenesis during nonselective macroautophagy [Citation16,Citation17]. However, the role of WIPI2 in selective autophagy has not been fully explored. Previous studies revealed that WIPI2 is involved in xenophagy [Citation16,Citation20]. A proximity-based screening with APEX2-OPTN revealed WIPI2 as a key player in mitophagy [Citation22]. Of note, deletion of WIPI2 displayed the most striking impacts on mitophagy inhibition when compared to other ATG proteins identified. Similarly, WIPI2 deletion was found to have a much stronger effect on mitophagy blockade than ATG16L1 KO [Citation47].These findings together indicate that WIPI2 may have more functions than autophagosome biogenesis during mitophagy. Consistent with such an assumption, we showed that WIPI2 promoted degradation of OMM proteins which relies mainly on proteasome rather than the autophagy-lysosome system ().
In the course of PINK1-PRKN-mediated mitophagy, it has been well established that degradation of OMM proteins relies on PRKN-mediated ubiquitination and subsequent proteasomal degradation [Citation29,Citation41]. In this process, accumulating evidence confirms that VCP is recruited to damaged mitochondria to extract and deliver the ubiquitinated OMM proteins to the 26S proteasome for degradation [Citation29,Citation31,Citation32,Citation48]. In this study, we showed that WIPI2 deficiency does not affect PRKN E3 ligase activity while degradation of OMM proteins is impaired ( and S5C-S5D). We further showed that WIPI2 interacted and promoted the recruitment of VCP complex to damaged mitochondria to accelerate the degradation of OMM proteins (). We report a novel regulatory function of WIPI2 in the turnover of OMM proteins under mitochondrial damage conditions via recruitment of VCP.
At present, various co-factors of VCP are reported to regulate mitochondrial recruitment of VCP in response to mitochondrial damage. There was evidence that two co-factors UBXN1 and UBXN6 translocate to damaged mitochondria and overexpression of either of these co-factors promotes VCP translocation to damaged mitochondria [Citation30,Citation32]. In cells with deletion of UBXN1, VCP translocation to damaged mitochondria upon CCCP treatment is not affected, while the dynamics of VCP mitochondrial distribution is altered [Citation32]. Although the effect of UBXN6 deletion on mitochondrial recruitment of VCP has not been reported, overexpression of UBXN6 promotes mitochondrial recruitment of VCP [Citation30]. Different from these studies, knockdown of another two VCP co-factors UFD1 or NPLOC4 has been shown to impair mitochondrial recruitment of VCP [Citation37]. UFD1 and NPLOC4 are known to bind the N domain of VCP [Citation34,Citation35]. Here we also showed that the N domain was critical for the binding of WIPI2 and interaction between WIPI2 and these two co-factors were constitutive ( and S3C-S3D). In contrast, there was no evident interaction between WIPI2 and UBXN6 under basal or mitophagy induction condition ( and S3F), suggesting that WIPI2 and UBXN6 may function differently to regulate mitochondrial recruitment of VCP. It remains to be further determined how different VCP co-factors interact differently with WIPI2 and how such interactions regulate mitochondrial recruitment of VCP and WIPI2.
Apart from its functions in mitophagy, VCP is also known as an essential player for autophagosome maturation as dysfunction of VCP is associated with accumulation of immature autophagic vesicles and defective autophagic clearance [Citation49,Citation50]. Recently, it has been reported that under amino acid starvation condition, inhibition of VCP suppressed the assembly of ATG14-PIK3C3 complex, resulting in suppression of WIPI2 puncta formation [Citation51]. On the other hand, results from the current study support the notion that WIPI2 works upstream to promote mitochondrial recruitment of VCP during mitophagy. First, deletion of WIPI2, without affecting PRKN mitochondrial translocation (Figure S5C-S5D), reduced VCP mitochondrial translocation under mitophagy induction condition (). Second, upon VCP inhibition by NMS873, WIPI2 was still able to translocate to damaged mitochondria under mitophagy induction condition (Figure S4). Further studies are needed to elucidate how WIPI2 and VCP coordinates with each other to regulate mitophagy.
Mitochondria play essential roles in cellular metabolism, energy production and programed cell death [Citation52]. On one hand, depolarization of mitochondria triggers PINK1-PRKN-mediated mitophagy to remove damaged mitochondria, which serves as a pro-survival mechanism [Citation53]. On the other hand, acute mitochondrial depolarization is closely associated with apoptosis via releasing pro-apoptotic factors such as CYCS [Citation45]. It have been shown that PRKN sensitizes cells toward apoptosis induced by depolarization-inducing reagents such as CCCP and O/A [Citation44,Citation54,Citation55]. This is mainly due to PRKN-mediated ubiquitination of OMM proteins which are subsequently extracted by the VCP complex and delivered to the 26S proteasome for degradation, leading to mitochondrial membrane rupture, CYCS release and eventual apoptosis [Citation29,Citation41,Citation43]. Inhibition of OMM protein degradation by proteasome inhibitors is able to effectively block apoptotic cell death triggered by mitochondrial depolarization [Citation44]. Consistently, in cells lacking PINK1 or PRKN, degradation of OMM proteins was attenuated (Figure S5B). As a result, apoptotic cell death induced by mitochondrial depolarization was inhibited (Figure S7A-S7B). In this study, we showed that WIPI2 KO inhibited the mitochondrial recruitment of VCP upon mitochondrial depolarization, which impaired degradation of OMM proteins (). Consistently, WIPI2 KO cells were much more resistant to apoptosis resulted from mitochondrial depolarization (). Interestingly, WIPI2 KO cells were much more sensitive to amino acids starvation (EBSS)-induced cell death (Figure S7C), indicating that WIPI2 may function differently in different types of cell death induced by different stimuli. The selective involvement of WIPI2 in cell death related to PINK1-PRKN-mediated mitophagy may have therapeutic implications in mitophagy and cell death-related human diseases such as neurodegenerative disorders.
In summary, WIPI2 is a critical positive upstream regulator of mitophagy that controls VCP recruitment to damaged mitochondria to mediate PINK1-PRKN-dependent mitophagy. As mitophagy is impaired in common neurodegenerative diseases such as Alzheimer disease and Parkinson disease [Citation5,Citation56,Citation57], genetic and pharmacological approaches targeting WIPI2 to upregulate mitophagy may provide novel therapeutic approaches for these currently uncurable diseases.
Materials and methods
Reagents and antibodies
Reagents used in this study: Antimycin A (Sigma-Aldrich, A8674), bafilomycin A1 (BafA1; Sigma-Aldrich, B1793), chloroquine (CQ; Sigma-Aldrich, C6628), carbonyl cyanide 3-chlorophenylhydrazone (CCCP; Sigma-Aldrich, C2759), Earle’s Balanced Salts (EBSS; Sigma-Aldrich, E2888), oligomycin (Sigma-Aldrich, 11,342), propidium iodide (Sigma-Aldrich, P4170), MG132 (Boston Biochem, I-130-05 M), NMS873 (Cayman Chemical, 17,674), SAR405 (Selleckchem, S7682), DDDDK-tagged Protein PURIFICATION GEL (Medical & Biological Laboratories, 3328 R).
Primary antibodies used in this study: anti-PINK1 (Cell Signaling Technology, 6946), anti-PRKN/Parkin (Cell Signaling Technology, 4211S), anti-TOMM20 (Cell Signaling Technology, 42,406), anti-MFN2/mitofusin 2 (Cell Signaling Technology, 11,925), anti-MFN1/mitofusin 1 (Cell Signaling Technology, 14,739), anti-HSPD/HSP60 (Cell Signaling Technology, 12,165), anti-MYC-tag (Cell Signaling Technology, 2276S), anti-CYCS/cytochrome c (Cell Signaling Technology, 11940S), anti-PARP1/PARP (Cell Signaling Technology, 9542S), anti-CASP3/Caspase 3 (Cell Signaling Technology, 9662S), mouse IgG (Cell Signaling Technology, 5415), anti-TOMM20 (Santa Cruz Technology, sc-17,764), anti-VCP (Santa Cruz Technology, sc-57,492), anti-NPLOC4/NPL4 (Santa Cruz Technology, sc-365,796), anti-HA (Santa Cruz Technology, sc-7392) and anti-PRKN (Santa Cruz Technology, sc-32,282), anti-TIMM23 (BD Biosciences, 611,223), anti-WIPI2 (Merck Millipore, MABC91) and anti-phospho-ubiquitin (Merck Millipore, ABS1513-I), anti-DNA (Progen Biotechnik, 61,014), anti-CALCOCO2/NDP52 (Abcam, ab68588), anti-LC3B (Abcam, ab192890), anti-WIPI2 (Abcam, ab105459) and anti-MT-CO2 (Abcam, ab110258), anti-GAPDH (Proteintech, 60,004-1-Ig) and anti-OPTN (Proteintech, 10,837-1-AP), Anti-FLAG (Medical & Biological Laboratories, M185-3 L), anti-MYC-tag (Medical & Biological Laboratories,M192-3), anti-GFP (Thermo fisher scientific, MA5-15,256)
Secondary antibodies used in this study: goat anti-Mouse IgG H&L (Alexa Fluor® 594; Abcam, ab150116), donkey anti-mouse IgG H&L (Alexa Fluor® 405; Abcam, ab175658) and donkey anti-rabbit IgG H&L (Alexa Fluor® 405; Abcam, ab175649), Alexa Fluor-405 goat anti-mouse (Thermo fisher scientific, A-31553), Alexa Fluor-488 goat anti-mouse (Thermo fisher scientific, A-32723), Alexa Fluor-488 anti-rabbit (Thermo fisher scientific, A-11034), Alexa Fluor-594 goat anti-mouse (Thermo fisher scientific, A-11032), Alexa Fluor-594 goat anti-rabbit (Thermo fisher scientific, R37117) and Alexa Fluor-633 goat anti-rabbit (Thermo fisher scientific, A-21072), Peroxidase-conjugated affinity pure goat anti-mouse IgG, light chain specific (Jackson Immuno Research, 115–035-174), peroxidase-conjugated IgG fraction monoclonal mouse antirabbit, light chain specific (Jackson Immuno Research, 211–032-171),
Cell line, siRNA and plasmids
Cell lines used in this study: HEK293T (CRL-3216) and HeLa (CCL-2) cells were purchased from American Type Culture Collection (ATCC). HeLa cells stably expressing YFP-PRKN (YPH cells) and YPH cells stably expressing mitoKeima (YPH-mt-Keima) were kind gifts from Dr. Richard Youle (National Institute of Neurological Disorders and Stroke, NIH, USA). HEK293A WT and WIPI2 KO cells were kind gifts from Dr. Sharon A. Tooze (The Francis Crick Institute, UK).
siRNA used in this study: siRNA targeting WIPI2 (hs.Ri.WIPI2.13) were purchased from Integrated DNA Technologies (https://www.idtdna.com/).
Plasmids used in this study: pcDNA5-FRT/TO-UFD1-Strep-HA (Addgene, 113,474) [Citation58], pcDNA5-FRT/TO-NPLOC4-Strep-HA (Addgene, 113,495) [Citation58] and Pires-puro2-UBXN6-3x HA (Addgene, 31,836) [Citation59] were gifts from Dr. Hemmo Meyer; pSpCas9(BB)-2A-Puro (PX459) (Addgene, 48,139) [Citation60] was a gift from Dr. Feng Zhang. VCP-EGFP (Addgene, 23,971) [Citation50] was a gift from Dr. Nico Dantuma. FLAG-WIPI2 [Citation17], WIPI2-MYC [Citation17], PX459-WIPI2-1, PX459-WIPI2-2, PX459-WIPI2-3, PX459-PINK1, FLAG-VCP and FLAG-VCP deletion constructs were generated in Dr. Han-Ming Shen’s lab. The DNA oligos used to generate these constructs were shown in Table S2.
WIPI2 KO cell generation by CRISPR-Cas9
sgRNA1 targeting WIPI2 (GAAGACCTGCACCTCTCCGA) was selected from Moffat Lab Toronto Knock Out library (TKO) (https://www.addgene.org/pooled-library/moffat-crispr-knockout/); sgRNA2 targeting WIPI2 (GCAGAATGGCAGGCGGACCG) and sgRNA3 targeting WIPI2 (ACCCACCAACAACCG) were selected from Sabatini/Lander Labs High Activity Library (https://www.addgene.org/pooled-library/sabatini-crispr-human-high-activity-3-sublibraries/). These sgRNAs were cloned into the pSpCas9(BB)-2A-Puro (PX459) to generate PX459-WIPI2-1, PX459-WIPI2-2 and PX459-WIPI2-1 following Dr. Feng Zhang’s protocol [Citation60]. Either YPH cells or YPH-mt-Keima cells were transfected with these plasmids for 24 h. Subsequently, the cells were reseeded at a confluency of 1:100, 1:250, and 1:500, respectively. Followed by puromycin (400 ng/ml; Merck, P9620) selection for 2 weeks. The WIPI2 knockout effect in puromycin-resistant cells was then verified by T7E1 assays and immunoblotting.
Cell culture
HeLa and HEK293T cells were cultured in DMEM (HyClone, SH30022.01) supplemented with 10% fetal bovine serum (HyClone, SV30160.03), 100 U/ml penicillin and 100 μg/ml streptomycin (Gibco, 15,140,122). The cells were maintained at 37°C in a humidified incubator with 5% CO2. All cell lines were tested and confirmed to be negative for mycoplasma infection.
Western blotting
After the designed treatments, the harvested cells were lysed with Laemmli SDS buffer (62.5 Mm Tris-HCl, pH 6.8, 25% glycerol, 2% SDS, phosphatase inhibitor and proteinase inhibitor cocktail [Thermo Fisher Scientific, 78,446]). An equal amount of protein was resolved by SDS-PAGE and transferred to PVDF membrane (Bio-Rad Laboratories, 1,620,177). After blocking with 5% nonfat milk (Bio-Rad Laboratories, 1,706,404) for 1 h, the membrane was probed with primary and secondary antibodies, developed with the enhanced chemiluminescence method (Thermo Fisher Scientific, 34,076) and visualized with the ImageQuant LAS 500 (GE Healthcare).
Immunoprecipitation
After the designed treatments, the cells were suspended with the immunoprecipitation (IP) lysis buffer (10 mM Tris-HCl, pH 7.4 [Vivantis Technologies, PB0852], 100 mM NaCl [Vivantis Technologies, PB0570], 2.5 mM MgCl2, 0.5% Triton X-100 [Sigma-Aldrich, T8787], phosphatase inhibitor and proteinase inhibitor cocktail), followed by sonication and centrifuged at 12,000 g for 10 min. Part of the supernatant (1–1.5 mg) was transferred to a new tube and diluted with the IP lysis buffer to achieve the concentration at 1–1.5 μg/μl. The supernatant was incubated with either control IgG or antibodies following the instructions of antibody datasheets overnight with gentle rotation at 4°C and was subsequently incubated with 10 μl protein A/G (Thermo Fisher Scientific, 20,421) for additional 4 h. For FLAG IP or MYC IP, the supernatant was incubated with 10 μl anti-FLAG M2 Affinity Gel (Sigma-Aldrich, A2220) or Pierce™ Anti-c-Myc Agarose (Thermo Fisher Scientific, 20,168) and mixed overnight with gentle rotation at 4°C. Next, the immunoprecipitates were washed with IP lysis buffer 3 times. The immunoprecipitants were then eluted by boiling for 5 min in sample loading buffer (Bio-Rad Laboratories, 1,610,737) and analyzed with immunoblotting.
Subcellular fractionation
Subcellular fractionation was performed based on the protocol described previously [Citation61]. Briefly, 2 × 10⁶ YPH WT or WIPI2 KO cells were lysed in 400 ul Digitonin buffer (150 mM NaCI, 50 mM HEPES pH 7.4, 25 ug/ml digitonin [Sigma-Aldrich, D141], protease and phosphatase inhibitors) and incubated on a rotator at 4°C for 10 min. Samples were then centrifuged at 2,000 g for 10 min at 4°C (Step One). Supernatants were transferred to fresh tubes and centrifuged three times at 20,000 g for 20 min at 4°C (Step Two). The resultant supernatants from Step Two were then transferred to fresh tubes as the cytosolic fractions. To obtain the crude mitochondrial fraction, the remaining pellet from Step One was resuspended in ice-cold PBS (Cytiva, SH30256.01) to wash away Digitonin buffer and then centrifuged at 2,000 g for 5 min at 4°C. The pellet was then resuspended in 400 ul NP-40 buffer (150 mM NaCI, 50 mM HEPES pH 7.4, 1% NP-40 [Sigma-Aldrich, 56,741], protease and phosphatase inhibitors) and incubated on ice for 30 min. Samples were centrifuged at 7,000 g for 10 min at 4°C to yield the crude mitochondrial fraction.
Immunofluorescence staining and confocal microscopy
YPH WT or WIPI2 KO cells were seeded to a cover glass slide at the confluency of approximately 50%. After the designed treatment, the cells were fixed with 4% paraformaldehyde (PFA; Santa Cruz Biotechnology, sc-281,692) for 10–15 min at room temperature and were washed 3 times with PBS. Followed by permeabilization with 0.25% Triton X-100 for 20 min. The cells were next blocked with 1% BSA (Sigma-Aldrich, A2153) for 4 h at room temperature and incubated with specific primary antibody overnight at 4°C. In the next day, the primary antibody was removed, and the cells were washed 3 times with cold PBS for 3 min each and incubated with Alexa Fluor secondary antibody (1:200 ~ 1:500; Invitrogen, A-11029, A-11034, A-11032 or A-11037) at room temperature for 1 h. The cells were again washed 3 times with cold PBS for 5 min each. The cells were visualized using a confocal microscope (Olympus Fluoview FV3000, Olympus America Inc., PA) and representative cells were selected and photographed.
Colocalization analysis
WIPI2 puncta colocalization with CALCOCO2 or OPTN was analyzed by FIJI ComDet plugin v.0.5.5 (https://imagej.net/plugins/spots-colocalization-comdet). For mitochondrial recruitment of WIPI2, NPLOC4 and VCP analysis, Fiji JACoP plugin (https://imagej.nih.gov/ij/plugins/track/jacop2.html) was used to calculate the Mander’s overlap coefficient values following the instructions described previously [Citation62,Citation63].
Statistics analysis
The statistical significance of the mean differences observed between two samples was determined by the student two-tailed t test using GraphPad Prism 8. One-way ANOVA with Dunnett’s multiple comparisons test was used to compare means of more than 3 samples using GraphPad Prism 8. Two-way ANOVA with Sidak’s multiple comparisons test were used to compare multiple groups of two factors using GraphPad Prism 8. Data are shown as means ± S.D. of the results of at least 3 independent experiments. Values of P < 0.05 were considered significant.
Conflicts of interest
E.F.F. has a CRADA arrangement with ChromaDex and is a consultant to Aladdin Healthcare Technologies, the Vancouver Dementia Prevention Centre and Intellectual Labs. All others have no conflicts of interest to be declared.
Supplemental Material
Download Zip (13.8 MB)Acknowledgement
We thank members of Shen’s laboratory for valuable discussion. We thank Dr. Sharon. A. Tooze from The Francis Crick Institute, Dr. Shih-Yin Tsai from National University of Singapore and Dr. Kal-Leong Lim from Nanyang Technology University for their critical comments toward the study. We thank Shu-Ying Lee, Xiaoning Wang and Delia Pang from Confocal Microscopy and Flow Cytometry laboratory at National University of Singapore, for helping us with the confocal and FACS related studies. This study was supported by research grants from Singapore National Medical Research Council (NMRC/CIRG/1490/2018) and Singapore Ministry of Education grant (MOE2018-T2-1-060), University of Macau (UM) SRG2020-00002-FHS and CPG2020-00029-FHS, CPG2021-00004-FHS, and Macau Science and Technology Development Fund (FDCT0078/2020/A2 and 0031/2021/A1) to HMS.
Supplementary material
Supplemental data for this article can be accessed here.
Disclosure Statement
No potential conflict of interest was reported by the authors.
Additional information
Funding
References
- Mizushima N. A brief history of autophagy from cell biology to physiology and disease. Nat Cell Biol. 2018 May;20(5):521–527.
- Dikic I, Elazar Z. Mechanism and medical implications of mammalian autophagy. Nat Rev Mol Cell Biol. 2018 Jun;19(6):349–364.
- Lu G, Wang L, Zhou J, et al. A destiny for degradation: interplay between cullin-RING E3 ligases and autophagy. Trends Cell Biol. 2021 Jun;31(6):432–444. DOI:10.1016/j.tcb.2021.01.005.
- Killackey SA, Philpott DJ, Girardin SE. Mitophagy pathways in health and disease. J Cell Biol. 2020 Nov 2;219(11): DOI: 10.1083/jcb.202004029.
- Aman Y, Schmauck-Medina T, Hansen M, et al. Autophagy in healthy aging and disease. Nature Aging. 2021 Aug 01;1(8):634–650. DOI: 10.1038/s43587-021-00098-4.
- Fang EF, Hou Y, Palikaras K, et al. Mitophagy inhibits amyloid-beta and tau pathology and reverses cognitive deficits in models of Alzheimer’s disease. Nat Neurosci. 2019 Mar;22(3):401–412. DOI:10.1038/s41593-018-0332-9.
- Pickles S, Vigie P, Youle RJ. Mitophagy and quality control mechanisms in mitochondrial maintenance. Curr Biol. 2018 Feb 19;28(4):R170–R185.
- Wang L, Qi H, Tang Y, et al. Post-translational modifications of key machinery in the control of mitophagy. Trends Biochem Sci. 2020 Jan;45(1):58–75. DOI:10.1016/j.tibs.2019.08.002.
- Kane LA, Lazarou M, Fogel AI, et al. PINK1 phosphorylates ubiquitin to activate Parkin E3 ubiquitin ligase activity. J Cell Biol. 2014 Apr 28;205(2):143–153.
- Koyano F, Okatsu K, Kosako H, et al. Ubiquitin is phosphorylated by PINK1 to activate parkin. Nature. 2014 Jun 5;510(7503):162–166.
- Kazlauskaite A, Kondapalli C, Gourlay R, et al. Parkin is activated by PINK1-dependent phosphorylation of ubiquitin at Ser65. Biochem J. 2014 May 15;460(1):127–139.
- Shiba-Fukushima K, Imai Y, Yoshida S, et al. PINK1-mediated phosphorylation of the Parkin ubiquitin-like domain primes mitochondrial translocation of Parkin and regulates mitophagy. Sci Rep. 2012;2:1002.
- Kondapalli C, Kazlauskaite A, Zhang N, et al. PINK1 is activated by mitochondrial membrane potential depolarization and stimulates Parkin E3 ligase activity by phosphorylating Serine 65. Open Biol. 2012 May;2(5):120080. DOI:10.1098/rsob.120080.
- Ordureau A, Sarraf SA, Duda DM, et al. Quantitative proteomics reveal a feedforward mechanism for mitochondrial PARKIN translocation and ubiquitin chain synthesis. Mol Cell. 2014 Nov 6 56(3):360–375. DOI: 10.1016/j.molcel.2014.09.007.
- Polson HE, de Lartigue J, Rigden DJ, et al. Mammalian Atg18 (WIPI2) localizes to omegasome-anchored phagophores and positively regulates LC3 lipidation. Autophagy. 2010 May;6(4):506–522. DOI:10.4161/auto.6.4.11863.
- Dooley HC, Razi M, Polson HE, et al. WIPI2 links LC3 conjugation with PI3P, autophagosome formation, and pathogen clearance by recruiting Atg12-5-16L1. Mol Cell. 2014 Jul 17;55(2):238–252.
- Lu G, Yi J, Gubas A, et al. Suppression of autophagy during mitosis via CUL4-RING ubiquitin ligases-mediated WIPI2 polyubiquitination and proteasomal degradation. Autophagy. 2019 Nov;15(11):1917–1934. DOI:10.1080/15548627.2019.1596484.
- Wan W, You Z, Zhou L, et al. mTORC1-regulated and HUWE1-mediated WIPI2 degradation controls autophagy Flux. Mol Cell. 2018 Oct 18;72(2):303–315 e6.
- Stavoe AK, Gopal PP, Gubas A, et al. Expression of WIPI2B counteracts age-related decline in autophagosome biogenesis in neurons. Elife. 2019 Jul16;8:e44219.
- Thurston TL, Boyle KB, Allen M, et al. Recruitment of TBK1 to cytosol-invading salmonella induces WIPI2-dependent antibacterial autophagy. EMBO J. 2016 Aug 15;35(16):1779–1792.
- Martinez-Martin N, Maldonado P, Gasparrini F, et al. A switch from canonical to noncanonical autophagy shapes B cell responses. Science. 2017 Feb 10 355(6325):641–647. DOI: 10.1126/science.aal3908.
- Heo JM, Harper NJ, Paulo JA, et al. Integrated proteogenetic analysis reveals the landscape of a mitochondrial-autophagosome synapse during PARK2-dependent mitophagy. Sci Adv. 2019 Nov;5(11):eaay4624. DOI:10.1126/sciadv.aay4624.
- Heo JM, Ordureau A, Paulo JA, et al. The PINK1-PARKIN mitochondrial ubiquitylation pathway drives a program of OPTN/NDP52 recruitment and TBK1 activation to promote mitophagy. Mol Cell. 2015 Oct 1;60(1):7–20.
- Wong YC, Holzbaur EL. Optineurin is an autophagy receptor for damaged mitochondria in parkin-mediated mitophagy that is disrupted by an ALS-linked mutation. Proc Natl Acad Sci U S A. 2014 Oct 21;111(42):E4439–48.
- Lazarou M, Sliter DA, Kane LA, et al. The ubiquitin kinase PINK1 recruits autophagy receptors to induce mitophagy. Nature. 2015 Aug 20;524(7565):309–314.
- Ahmed MR, Zhan X, Song X, et al. Ubiquitin ligase parkin promotes Mdm2-arrestin interaction but inhibits arrestin ubiquitination. Biochemistry. 2011 May 10;50(18):3749–3763.
- Sun N, Yun J, Liu J, et al. Measuring In Vivo mitophagy. Mol Cell. 2015 Nov 19;60(4):685–696.
- Fang EF, Palikaras K, Sun N, et al. In vitro and in vivo detection of mitophagy in human cells, C. elegans, and mice. J Vis Exp. 2017 Nov 22;(129):e56301.
- Tanaka A, Cleland MM, Xu S, et al. Proteasome and p97 mediate mitophagy and degradation of mitofusins induced by Parkin. J Cell Biol. 2010 Dec 27;191(7):1367–1380.
- Bento AC, Bippes CC, Kohler C, et al. UBXD1 is a mitochondrial recruitment factor for p97/VCP and promotes mitophagy. Sci Rep. 2018 Aug 17;8(1):12415.
- McLelland GL, Goiran T, Yi W, et al. Mfn2 ubiquitination by PINK1/parkin gates the p97-dependent release of ER from mitochondria to drive mitophagy. Elife. 2018 Apr 20;7: DOI:10.7554/eLife.32866.
- Mengus C, Neutzner M, Bento A, et al. VCP/p97 cofactor UBXN1/SAKS1 regulates mitophagy by modulating MFN2 removal from mitochondria. Autophagy. 2021;9:1–20.
- Guo X, Sun X, Hu D, et al. VCP recruitment to mitochondria causes mitophagy impairment and neurodegeneration in models of Huntington’s disease. Nat Commun. 2016 Aug 26;7(1):12646.
- Niwa H, Ewens CA, Tsang C, et al. The role of the N-domain in the ATPase activity of the mammalian AAA ATPase p97/VCP. J Biol Chem. 2012 Mar 9;287(11):8561–8570.
- Sato Y, Tsuchiya H, Yamagata A, et al. Structural insights into ubiquitin recognition and Ufd1 interaction of Npl4. Nat Commun. 2019 Dec 13;10(1):5708.
- van den Boom J, Meyer H. VCP/p97-mediated unfolding as a principle in protein homeostasis and signaling. Mol Cell. 2018 Jan 18;69(2):182–194.
- Kimura Y, Fukushi J, Hori S, et al. Different dynamic movements of wild-type and pathogenic VCPs and their cofactors to damaged mitochondria in a Parkin-mediated mitochondrial quality control system. Genes Cells. 2013 Dec;18(12):1131–1143. DOI:10.1111/gtc.12103.
- Magnaghi P, D’Alessio R, Valsasina B, et al. Covalent and allosteric inhibitors of the ATPase VCP/p97 induce cancer cell death. Nat Chem Biol. 2013 Sep;9(9):548–556. DOI:10.1038/nchembio.1313.
- Kim NC, Tresse E, Kolaitis RM, et al. VCP is essential for mitochondrial quality control by PINK1/Parkin and this function is impaired by VCP mutations. Neuron. 2013 Apr 10;78(1):65–80.
- Wang ZH, Clark C, Geisbrecht ER. Drosophila clueless is involved in Parkin-dependent mitophagy by promoting VCP-mediated Marf degradation. Hum Mol Genet. 2016 May 15;25(10):1946–1964.
- Yoshii SR, Kishi C, Ishihara N, et al. Parkin mediates proteasome-dependent protein degradation and rupture of the outer mitochondrial membrane. J Biol Chem. 2011 Jun 3;286(22):19630–19640.
- Pasquier B. SAR405, a PIK3C3/Vps34 inhibitor that prevents autophagy and synergizes with MTOR inhibition in tumor cells. Autophagy. 2015 Apr 3;11(4):725–726.
- Wei Y, Chiang WC, Sumpter R Jr., et al. Prohibitin 2 is an inner mitochondrial membrane mitophagy receptor. Cell. 2017 Jan 12;168(1–2):224–238 e10.
- Liang JR, Martinez A, Lane JD, et al. USP30 deubiquitylates mitochondrial Parkin substrates and restricts apoptotic cell death. EMBO Rep. 2015 May;16(5):618–627. DOI:10.15252/embr.201439820.
- Heiskanen KM, Bhat MB, Wang HW, et al. Mitochondrial depolarization accompanies cytochrome c release during apoptosis in PC6 cells. J Biol Chem. 1999 Feb 26;274(9):5654–5658.
- Gottlieb E, Armour SM, Harris MH, et al. Mitochondrial membrane potential regulates matrix configuration and cytochrome c release during apoptosis. Cell Death Differ. 2003 Jun;10(6):709–717. DOI:10.1038/sj.cdd.4401231.
- Wang C. A sensitive and quantitative mKeima assay for mitophagy via FACS. Curr Protoc Cell Biol. 2020 Mar;86(1):e99.
- Ordureau A, Paulo JA, Zhang J, et al. Global landscape and dynamics of parkin and USP30-dependent ubiquitylomes in iNeurons during mitophagic signaling. Mol Cell. 2020 Mar 5;77(5):1124–1142 e10.
- Ju JS, Fuentealba RA, Miller SE, et al. Valosin-containing protein (VCP) is required for autophagy and is disrupted in VCP disease. J Cell Biol. 2009 Dec 14;187(6):875–888.
- Tresse E, Salomons FA, Vesa J, et al. VCP/p97 is essential for maturation of ubiquitin-containing autophagosomes and this function is impaired by mutations that cause IBMPFD. Autophagy. 2010 Feb;6(2):217–227. DOI:10.4161/auto.6.2.11014.
- Hill SM, Wrobel L, Ashkenazi A, et al. VCP/p97 regulates Beclin-1-dependent autophagy initiation. Nat Chem Biol. 2021 Apr;17(4):448–455. DOI:10.1038/s41589-020-00726-x.
- Bock FJ, Tait SWG. Mitochondria as multifaceted regulators of cell death. Nat Rev Mol Cell Biol. 2020 Feb;21(2):85–100.
- Matsuda N, Sato S, Shiba K, et al. PINK1 stabilized by mitochondrial depolarization recruits Parkin to damaged mitochondria and activates latent Parkin for mitophagy. J Cell Biol. 2010 Apr 19;189(2):211–221.
- Carroll RG, Hollville E, Martin SJ. Parkin sensitizes toward apoptosis induced by mitochondrial depolarization through promoting degradation of Mcl-1. Cell Rep. 2014 Nov 20;9(4):1538–1553.
- Akabane S, Matsuzaki K, Yamashita S, et al. Constitutive activation of PINK1 protein leads to proteasome-mediated and non-apoptotic cell death independently of mitochondrial autophagy. J Biol Chem. 2016 Jul 29;291(31):16162–16174.
- Lautrup S, Sinclair DA, Mattson MP, et al. NAD(+) in brain aging and neurodegenerative disorders. Cell Metab. 2019 Oct 1;30(4):630–655.
- Kobro-Flatmoen A, Lagartos-Donate MJ, Aman Y, et al. Re-emphasizing early Alzheimer’s disease pathology starting in select entorhinal neurons, with a special focus on mitophagy. Ageing Res Rev. 2021 May;67:101307.
- Hulsmann J, Kravic B, Weith M, et al. AP-SWATH reveals direct involvement of VCP/p97 in integrated stress response signaling through facilitating CReP/PPP1R15B degradation. Mol Cell Proteomics. 2018 Jul;17(7):1295–1307. DOI:10.1074/mcp.RA117.000471.
- Ritz D, Vuk M, Kirchner P, et al. Endolysosomal sorting of ubiquitylated caveolin-1 is regulated by VCP and UBXD1 and impaired by VCP disease mutations. Nat Cell Biol. 2011 Aug 7;13(9):1116–1123.
- Ran FA, Hsu PD, Wright J, et al. Genome engineering using the CRISPR-Cas9 system. Nat Protoc. 2013 Nov;8(11):2281–2308. DOI:10.1038/nprot.2013.143.
- Aarreberg LD, Esser-Nobis K, Driscoll C, et al. Interleukin-1beta induces mtDNA release to activate innate immune signaling via cGAS-STING. Mol Cell. 2019 May 16;74(4):801–815 e6.
- Bolte S, Cordelieres FP. A guided tour into subcellular colocalization analysis in light microscopy. J Microsc. 2006 Dec;224(Pt 3):213–232.
- Stauffer W, Sheng H, Lim HN. EzColocalization: an ImageJ plugin for visualizing and measuring colocalization in cells and organisms. Sci Rep. 2018 Oct 25; 8(1):15764. DOI: 10.1038/s41598-018-33592-8.