
ABSTRACT
The notion that macroautophagy/autophagy is a potentially attractive therapeutic target for a variety of diseases, including cancer, largely stems from pre-clinical mouse studies. Most of these examine the effects of irreversible and organ confined autophagy deletion using site specific Cre-loxP recombination of the essential autophagy regulating genes Atg7 or Atg5. Model systems with the ability to impair autophagy systemically and reversibly at all disease stages would allow a more realistic approach to evaluate the consequences of authophagy inhibition as a therapeutic concept and its potential side effects. Here, we present shRNA transgenic mice that via doxycycline (DOX) regulable expression of a highly efficient miR30-E-based shRNA enabled knockdown of Atg7 simultaneously in the majority of organs, with the brain and spleen being noteable exceptions. Induced animals deteriorated rapidly and experienced profound destruction of the exocrine pancreas, severe hypoglycemia and depletion of hepatic glycogen storages. Cessation of DOX application restored apparent health, glucose homeostasis and pancreatic integrity. In a similar Atg5 knockdown model we neither observed loss of pancreatic integrity nor diminished survival after DOX treatment, but identified histological changes consistent with steatohepatitis and hepatic fibrosis in the recovery period after termination of DOX. Regulable Atg7-shRNA mice are valuable tools that will enable further studies on the role of autophagy impairment at various disease stages and thereby help to evaluate the consequences of acute autophagy inhibition as a therapeutic concept.
Abbreviations: ACTB: actin, beta; AMY: amylase complex; ATG4B: autophagy related 4B, cysteine peptidase; ATG5: autophagy related 5; ATG7: autophagy related 7; Cag: CMV early enhancer/chicken ACTB promoter; Col1a1: collagen, type I, alpha 1; Cre: cre recombinase; DOX: doxycycline; GCG: glucagon; GFP: green fluorescent protein; INS: insulin; LC3: microtubule-associated protein 1 light chain 3; miR30-E: optimized microRNA backbone; NAFLD: non-alcoholic fatty liver disease; NASH: non-alcoholic steatohepatitis; PNLIP: pancreatic lipase; rtTA: reverse tetracycline transactivator protein; SQSTM1/p62: sequestome 1; TRE: tetracycline responsive element.
Introduction
Amongst the different types of autophagy, macroautophagy (hereafter autophagy) is most extensively studied. Pre-clinical mouse studies are instrumental in establishing the importance of autophagy for many physiological and pathological states [Citation1,Citation2]. Largely, these investigations rely on genetically engineered mouse models that utilize the Cre-loxP system to modify essential autophagy related (Atg) genes [Citation1]. Recombination after induction of the Cre recombinase irreversibly modifies the genomic locus and thereby renders the targeted genes, frequently Atg5 or Atg7, nonfunctional. In the majority of these experimental setups autophagy is not just reduced, but instead completely blocked. Depending on the driver of the Cre recombinase, autophagy knockdown is largely organ confined and often simultaneously combined with other disease promoting mutations in healthy tissue [Citation3,Citation4]. As a consequence of the latter, most models examine disease development in the absence of autophagy and are to be considered prevention rather than treatment studies. To demonstrate the efficacy of authophagy inhibition as a therapeutic concept, the function of authophagy regulators would have to be impaired in an already established, initially autophagy competent disease state, such as a malignant tumor. Furthermore, any therapeutic intervention is unlikely to completely inhibit autophagy. Instead, it is probable that autophagy will only be impaired partially and, due to systemic application, the whole body will be affected with possible detrimental side effects. Several strategies have been employed to partially overcome the aforementioned limitations of preclinical studies, such as combination of the Cre-loxP system with mouse codon optimized Flp recombinase (FlpO), autophagy inhibition via expression of a mutant ATG4B protein or systemic application of chloroquine [Citation1,Citation5–7]. Acute, systemic autophagy inhibition in adult mice by blocking either Atg7 or Atg5 reveals strong systemic phenotypes [Citation8,Citation9]. Karsli-Uzunbas et al. employed the Cre-loxP system and a ubiquitously expressed, tamoxifen inducible Cre recombinase (Ubc-CreERT2) to delete Atg7. Atg7 ablation renders mice susceptible to pulmonary infections, impacts on glucose homeostasis and tumor growth [Citation8]. Despite the complexity of this study an inherent limitation is the irreversibility and absoluteness of the Atg7 knockdown. This was addressed in a study from the Kimmelman laboratory [Citation7]. The authors developed animals that systemically impair autophagy via regulable expression of a dominant negative form of ATG4B (ATG4B[CA]). Interestingly, these animals remain essentially healthy for one year, but the effectiveness of their model is demonstrated with tissue specific expression in murine pancreatic cancer models.
We now characterize Atg7-shRNA transgenic mice that permit doxycycline (DOX) regulable, simultaneous inhibition of autophagy in the majority of organs with the exceptions of the brain and the spleen. We also describe phenotypical differences to analogous Atg5-shRNA knockdown animals that are very similar to a previously published model [Citation9].
Results
Mouse models for regulable inhibition of autophagy
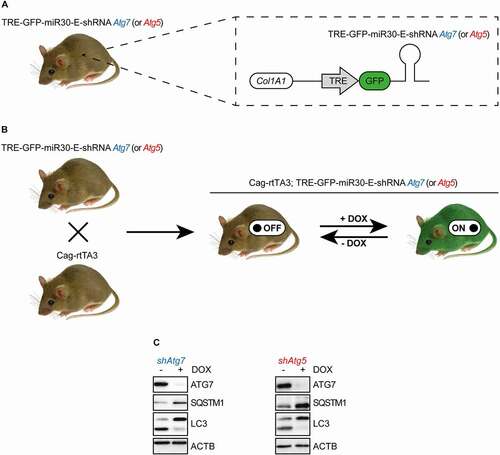
TRE-GFP-miR30-E-shRNA Atg7 and TRE-GFP-miR30-E-shRNA Atg5 mice were modified at the Col1A1 locus to enable the expression of green fluorescent protein (GFP)-linked shRNAs against either Atg7 or Atg5 that are embedded in an optimized mircoRNA backbone (miR30-E) and are under control of a tetracycline (tet) response element (TRE) () [Citation10–12]. Notably, animals harbored a single copy of the miR30-E-shRNA construct and thereby bypassed potential shRNA toxicity from high copy integration [Citation12,Citation13]. TRE-GFP-miR30-E-shRNA mice were crossed to C57BL/6 mice that expressed a highly sensitive reverse tet-transactivator (rtTA3) downstream of the CMV early enhancer/chicken ACTB promoter (Cag) (Cag-rtTA3) in order to enable induction of shRNAs. This facilitated systemic expression of TRE-regulated shRNAs that was largely limited by the bioavailability of DOX (), that is known to be essentially non-existent in the central nervous system upon oral application [Citation10]. MiR30-E-shRNAs were designed and tested by Mirimus Inc. based on methodology developed by Fellman et al. [Citation11,Citation12]. Specificity was confirmed by BLAT analysis using the UCSC genome browser (data not shown). Furthermore, both shRNAs were validated in previously established murine pancreatic cancer cell lines via viral infection and subsequent application of DOX () [Citation14]. Recently characterized inducible Atg5-shRNA transgenics contain the same TRE-GFP-miR30-E-shRNA cassette downstream of the Col1A1 locus as our model, and likewise shRNA transcription is driven by a Cag-rtTA3 promoter [Citation9]. However, in the study by Cassidy et al. the latter was initially spatially restricted via a loxP-stop-loxP element between Cag and rtTA3 that was removed by crossing to mice that expressed a Pgk1 (phosphoglycerate kinase 1) promoter-Cre transgene under maternal control [Citation15]. Subsequently, Pgk1-Cre was bred out and animals were kept on a mixed C57BL/6 x 129 background [Citation9]. Likewise, our animals were of mixed background.
Figure 1. Transgenic mouse models. (A) Schematic representation of the genetic modifications of TRE-GFP-miR30-E-shRNA Atg5 or TRE-GFP-miR30-E-shRNA Atg7 transgenic mice. (B) Generation and induction of Cag-rtTA3; TRE-GFP-miR30-E-shRNA Atg7 and Cag-rtTA3; TRE-GFP-miR30-E-shRNA Atg5 animals. (C) Western blots to validate the knockdown of miR30-E-shRNA constructs against Atg7 or Atg5, their effect on SQSTM1 protein expression and LC3 levels in murine pancreatic cancer cell lines.
Induction of Atg7-shRNA mice caused destruction of the pancreas
At the start of all subsequent experiments animals were 77 ± 3 days of age, all cohorts were mixed male and female and we did not observe any gender bias. To initiate target knockdown, Atg7-shRNA and Atg5-shRNA expressing transgenics (hereafter referred to as Atg7ind and Atg5ind) and their respective controls (hereafter Atg7ctrl and Atg5ctrl) were subjected to a DOX containing diet. Strikingly, after a median of approx. 29 d, Atg7ind, but not Atg5ind animals showed signs of disease (weakness, inactivity) and had to be sacrificed (). The remaining cohorts were terminated after 36 d with all animals being in good health. In order to explore the pathology behind this profound impact on survival, we repeated the experiment but limited it to 21 days of DOX exposure. Only Atg7ind mice, but none of the other cohorts, experienced significant weight loss ( and Fig. S1A). In Atg7ind mice the pancreas was grossly barely detectable during necropsy and histologically completely atrophic (), which was reminiscent of chronic pancreatitis that is defined as the progressive, fibrotic destruction of the acinar parenchyma [Citation16]. Atg5ind animals did not experience any grossly apparent pancreatic alterations (Fig. S1B).
Figure 2. Induction of Atg7-shRNA mice causes pancreatic destruction. (A) Kaplan-Meier-Survival curves of the indicated cohorts. Statistics: Log-Rank-Test (n Atg7ctrl, Atg7ind, Atg5ctrl, Atg5ind: 4, 7, 4, 4). (B) Relative weight change from start to end of the experiment of the indicated cohorts. Statistics: Wilcoxon signed-rank test (n from left to right: 10, 10). (C) Representative HE-stained sections of pancreata from the indicated cohorts with size quantifications. Scale bars: 1000 µm. Statistics: Welch’s t-test (n from left to right: 5, 4). (D) Representative images of pancreatic tissue from all cohorts stained as indicated. Scale bars: 20 µm. Inserts are higher magnifications of the boxed area. For easier recognition the dashed areas highlight islets in Atg7ind mice. (E) Western blots as indicated to validate target knockdown and its effect on SQSTM1 protein expression and LC3 levels. *P < 0.05, ***P < 0.01.
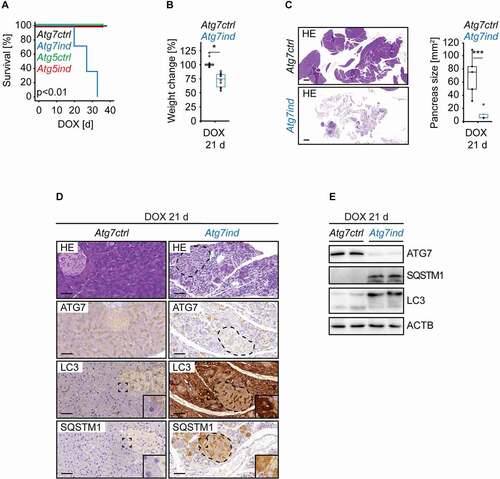
Immunohistochemistry for ATG7, ATG5, LC3, and SQSTM1/p62 confirmed target knockdown and impairment of autophagy in the pancreas ( and Fig. S1C). As expected, DOX application caused a strong reduction of ATG7 or ATG5 expression in induced mice, led to the conversion of a punctate LC3 staining pattern to a homogenous cytoplasmic signal and accumulation of SQSTM1. Non autophagosome-bound LC3-I can be part of aggregates in an autophagy-independent manner and a punctate immunohistochemical staining pattern does not always represent autophagic structures [Citation17]. However, in the context of the SQSTM1 staining pattern, elevated LC3-I, decreased LC3-II levels and increased protein expression of SQSTM1 in immunoblots, we consider the LC3 puncta to be mostly reflective of autophagosomes. Western blot analysis of pancreatic tissue lysates illustrated a strong target knockdown, an increased LC3-I:LC3-II ratio and elevated SQSTM1 levels, thus confirming the inhibition of autophagy ( and Fig. S1D). Sometimes, throughout the respective figures the SQSTM1 antibody, detected two closely spaced protein bands, of which the upper band is the expected size. ACTB (actin, beta) served as loading control for all western blots.
Pancreatic destruction in Atg7-shRNA transgenics coincided with increased apoptosis of acinar cells and was reversible
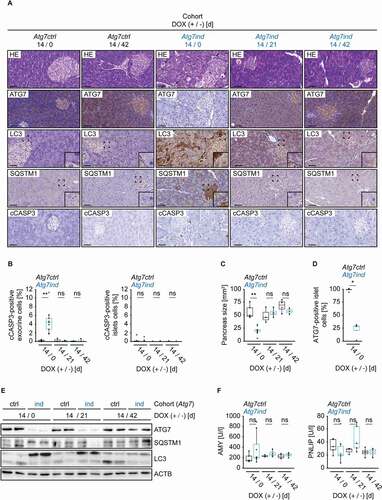
In order to explore the cause for the profound effect on pancreatic integrity and to determine whether the phenotype is reversible, we treated Atg7-shRNA transgenics with DOX for 14 days, followed by a regular, DOX-free diet for 21 or 42 days. We opted for a two-week exposure to DOX as this shorter treatment was tolerated well, unlike a 21 day application which severely impaired the mice. The pancreas contains two distinct components. The exocrine portion consists largely of acinar cells that provide digestive enzymes, whereas the islets of Langerhans comprise the endocrine portion and amongst other functions produce hormones that are essential for glucose homeostasis [Citation18,Citation19]. After 14 days of treatment, the pancreata of Atg7ind animals showed signs of exocrine tissue damage, including increased numbers of apoptotic cells detected on HE-stained sections () and expression of cleaved CASP3 (caspase 3) in acinar tissue, but not in the islets of Langerhans ( and 3B). In parallel, the pancreas size was reduced in Atg7ind mice (). 21 or 42 days after termination of DOX application, these changes were no longer detectable (, 3B and 3C). Immunohistochemistry for ATG7, LC3 and SQSTM1, as well as immunoblot analysis of pancreatic tissue lysates confirmed target knockdown, partial inhibition of autophagy and its restoration upon cessation of DOX application ( and 3E). As expected, target knockdown and its effect on LC3 conversion were reduced compared to the 21 days DOX regimen (compare and 3E with and 2E). SQSTM1 expression levels varied between individual mice and an accumulation could not be demonstrated after just 14 d of DOX treatment (). Interestingly, a fraction of islet cells seemed to retain ATG7 expression (, 3A and 3D). Blood serum levels of AMY/α-amylase (amylase complex) and PNLIP (pancreatic lipase), two potential indicators of exocrine pancreatic function, were not significantly altered upon Atg7 inhibition after 14 days of DOX treatment ().
Figure 3. Induction of Atg7-shRNA mice induces apoptosis of the exocrine pancreas. (A) Representative images of pancreatic tissue stained as indicated. Arrows on HE-stained sections indicate dying acinar cells. Scale bars: 20 µm. Inserts are higher magnifications of the boxed area. (B) Quantification of cleaved CASP3 (cCASP3) expression in exocrine and endocrine pancreatic tissue. Statistics: Welch’s t-test (n from left to right: 5, 9, 3, 4, 4, 3 (exocrine) and 5, 9, 3, 5, 4, 3 (endocrine)). (C) Size quantification of pancreata from the indicated cohorts. Statistics: Welch’s t-test (n from left to right: 5, 6, 3, 4, 4, 3). (D) Quantification of ATG7-expressing cells in endocrine (islet) pancreatic tissue. Statistics: Welch’s t-test (n from left to right: 4, 4). (E) Western blots as indicated to validate target knockdown and its effect on SQSTM1 protein expression and LC3 levels. (F) Blood serum AMY and PNLIP activity levels of the indicated cohorts. Statistics: Welch’s t-test (n from left to right: 5, 8, 3, 4, 4, 4 (AMY) and 5, 6, 3, 5, 4, 4 (PNLIP)). *P < 0.05, **P < 0.01, ns: not significant.
Similar experiments were carried out with silencing of Atg5. Here, we opted for a prolonged DOX treatment of 42 days in order to recognize a potentially delayed onset of the phenotype. Atg5ind mice neither showed any signs of distress, nor displayed grossly apparent pancreatic alterations (Fig. S2A). We only found a very minor and transient increase in the expression of cleaved caspase in acinar cells, but not in endocrine tissue (Fig. S2B). In addition, pancreas size remained unchanged (Fig. S2C). Autophagy impairment and recovery therefrom was verified using immunohistochemistry and western blots (Fig. S2A and S2E). Similar to their Atg7 knockdown counterparts, a fraction of islet cells still retained ATG5 expression (Fig. S2A and S2D). Like in Atg7ind mice blood serum levels of AMY and PNLIP were unaltered (Fig. S2F).
Of note, the islets of Langerhans comprise only 1–4% of total pancreatic volume [Citation19]. Therefore, the western blots ( and Fig. S2E) essentially reflect the exocrine portion of the pancreas and indicate a strong target knockdown and autophagy impairment. As reported by Cassidy and colleagues, we also found degenerated acinar and islet cells in both Atg7ind and Atg5ind animals, albeit at a very low frequency (approx. 1% in acinar cells (Atg5ind > Atg7ind), and even less in islets cells). These were negative for cleaved CASP3 (data not shown).
Macrophages accumulated in the pancreas of induced Atg7-shRNA mice
Atrophy and fibrosis of the pancreas are often, but not always associated with underlying inflammation [Citation16]. We detected increased numbers of macrophages in the pancreas of Atg7ind mice ( and 4B). The number of lymphocytes (B-cells and T-cells) was negligible and did not differ between Atg7ctrl and Atg7ind animals; neutrophils were absent ( and 4B).
Figure 4. Macrophages accumulate in the pancreas of induced Atg7-shRNA mice. (A) Representative pancreatic tissue stained as indicated to highlight macrophages (ADGRE1/F4/80) and lymphocytes: B-cells (PTPRC; isoform CD45R/B220), T-cells (CD3). Arrows point toward lymphocytes. The chloracetate esterase reaction (CAE) did not detect any neutrophils. Scale bars: 20 µm. (B) Quantification of the inflammatory infiltrate. Statistics: Welch’s t-test (n from left to right: 6, 6 (macrophages), 6, 6 (B-cells) and 5, 6 (T-cells)). *P < 0.05.

Atg7-shRNA transgenics experienced severe, but reversible hypoglycemia and depletion of hepatic glycogen storages
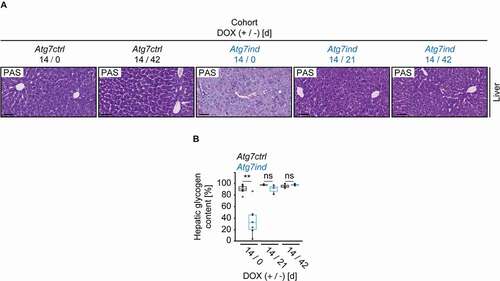
To expand the assessment of ATG7 in the regulation of pancreatic function, we also evaluated its endocrine portion. Serum glucose levels drastically dropped in Atg7ind animals receiving DOX containing chow for 14 days, but reversed to normal levels 21 days after commencing a normal diet (). INS (insulin) and GCG (glucagon) are the two major hormonal regulators of glucose homeostasis: INS lowers blood glucose levels, GCG raises them [Citation20]. INS levels were not affected by Atg7 silencing, whereas GCG levels were upregulated in Atg7ind mice after DOX exposure (). While the total number and size of islets did not change upon Atg7 silencing ( and 5C), we observed a modest, statistically significant reduction in INS-producing islet β-cells, which was paralleled by a significant increase of glucagon producing islet α-cells (). The increase in α-cells was still detectable after 21 days of normal chow, but resolved when mice were kept for 42 days on a regular diet ( and 5D). Morever, the Periodic Acid-Schiff (PAS) reaction demonstrated a substantially decreased hepatic glycogen content in Atg7ind mice that were exposed to DOX for 14 days, and this was restored upon switch to a normal diet for 21 or 42 days ( and 6B).
Figure 5. Induction of Atg7-shRNA mice affects glucose metabolism. (A) Blood serum levels of glucose, INS and GCG of the indicated cohorts. Statistics: Welch’s t-test (n from left to right: 5, 8, 3, 4, 4, 4 (glucose), 7, 4 (INS) and 8, 10 (GCG)). (B) Representative islets stained as indicated. Scale bars: 20 µm. (C) and (D) Quantification of total islet number, median islet size and percentage of islet cells expressing INS or GCG. Statistics: Welch’s t-test (n from left to right: 5, 9, 3, 5, 4, 3 (islet number), 5, 9, 3, 5, 4, 3 (islet size), 5, 9, 3, 5, 3, 3 (INS-positive islet cells) and 5, 9, 3, 5, 3, 3 (GCG-positive islet cells)). *P < 0.05, **P < 0.01, ***P < 0.001, ns: not significant.
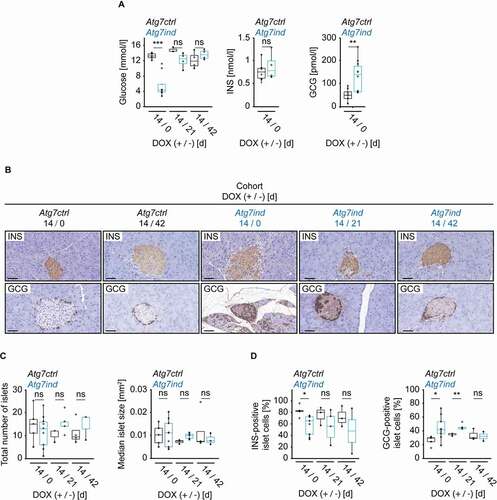
Figure 6. Induction of Atg7-shRNA mice leads to depletion of hepatic glycogen. (A) Representative images of hepatic tissues stained as indicated. Scale bars: 20 µm. (B) Quantification of the hepatic glycogen content. Statistics: Welch’s t-test (n from left to right: 8, 7, 3, 3, 3, 4). **P < 0.01, ns: not significant.
Notably, islet numbers and size, as well as blood glucose levels were not affected in Atg5ind mice upon DOX treatment for 42 days (Fig. S3A). Since the pancreata of Atg5ind animals were largely unaffected, we did not perform further functional analysis.
Atg7-shRNA transgenics did not develop pathological alterations in the liver after 14d of induction and recovery therefrom
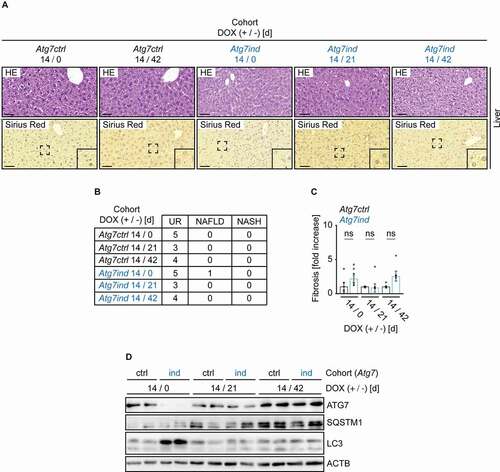
Autophagy deletion in the liver causes pathological alterations linked to the development of nonalcoholic fatty liver disease (NAFLD) [Citation21]. Histologically, NAFLD is characterized by steatosis without hepatocellular swelling or steatosis combined with hepatocellular swelling and the absence of inflammation [Citation22]. Nonalcoholic steatohepatitis (NASH) carries an increased risk of progression to fibrosis. Microscopic criteria consistent with NASH are steatosis in the presence of hepatocellular swelling and lobular inflammation [Citation22]. Previously described Atg5-shRNA transgenic mice develop liver fibrosis and accumulate hepatocellular proteinaceous aggregates after reestablishing autophagy [Citation9]. On HE-stained sections a single Atg7ind mouse showed very subtle and early signs of emerging NAFLD, but histological evidence of NAFLD or NASH was not found in the remainder of the cohort ( and 7B). Sirius Red staining illustrated no signs of hepatic fibrosis upon DOX application or recovery therefrom in Atg7ind animals ( and 7C). Target knockdown and inhibition of autophagy were indicated by reduced ATG7 expression and elevated LC3-I levels in lysates from Atg7-depleted livers, whereas SQSTM1 expression varied considerably between individual animals and an accumulation could not be demonstrated ().
Figure 7. NASH and fibrosis do not occur after 14 d induction of Atg7-shRNA mice. (A) Representative images of liver tissue from all cohorts stained as indicated. Scale bars: 20 µm. Inserts are higher magnifications of the boxed area. (B) Number of mice with unremarkable livers (UR), livers with histological evidence of nonalcoholic fatty liver disease (NAFLD) and nonalcoholic steatohepatitis (NASH) in the indicated cohorts. (C) Quantification of fibrosis. Statistics: Welch’s t-test (n from left to right: 5, 6, 3, 5, 4, 4). ns: not significant. (D) Western blots as indicated to validate target knockdown and its effect on SQSTM1 protein expression and LC3 levels.
Atg5-shRNA transgenics developed NASH upon induction and hepatic fibrosis in the recovery period
In stark contrast, nearly all Atg5ind mice developed histological changes reminiscent of NASH, with one control animal also displaying steatosis (Fig. S3B and S3C). In addition, mallory hyaline and proteinaceous aggregates, as previously described by Cassidy and colleagues [Citation9], were also readily detectable (Fig. S3B, upper insert 1 and 2). Reversal to a normal diet abrogated all evidence of NAFLD or NASH (Fig. S3B and S3C), but resulted in the formation of hepatic fibrosis as detected by Sirius Red staining (Fig. S3B and S3D). This indicated irreversible changes to hepatic function that culminated in the induction of fibrosis. Target knockdown and restoration, as well as autophagy inhibition were confirmed by western blot (Fig. S3E). SQSTM1 levels were slightly increased in Atg5ind animals, but against a heterogenous background in different mice.
Other major organs are not affected in both knockdown models
Using the same treatment regimes as above, silencing of either Atg7 (Fig. S4) or Atg5 (Fig. S6) did not induce grossly or microscopically overt alterations in other major organs: stomach, small intestine, colon, kidney, spleen, lung, heart, and brain. Target knockdown and inhibition of autophagy in the analyzed organs were assessed by western blot (Fig. S5 and S7). As expected the efficacy and kinetics of autophagy blockage and the recovery therefrom vary in different organs. Atg knockdown was rather strong in the majority of tissues and was accompanied by elevated LC3-I levels and relatively decreased LC3-II levels, with two notable exceptions: brain and spleen. SQSTM1 expression levels showed considerable variations between different mice and were frequently not correlated with Atg knockdown.
Discussion
The effect of therapeutic autophagy modulation is currently being investigated in many clinical trials, especially for cancer. Any therapeutic intervention in humans is likely to cause systemic side effects and to only partially impair autophagy. Here, we described a mouse strain that via expression of a doxycycline-regulated, miR30-E-based shRNA enables systemic knockdown of Atg7. As a consequence, autophagy was inhibited in the majority of adult tissues with the exception of the brain and the spleen. Furthermore, we detailed differences to Atg5-shRNA mice that were very similar to a previously published model that mirrors many of the effects of tissue specific knockout studies [Citation9].
Induction of Atg7-shRNA mice, set off destruction of the exocrine pancreas with histological changes akin to chronic pancreatitis, severe hypoglycemia, and depletion of hepatic glycogen stores. While a prolonged inhibition of Atg7 was essentially lethal, the effects of temporary impairment were, in accordance with the well documented regenerative capacity of the pancreas, reversible [Citation18,Citation23]. These changes did not occur in Atg5-shRNA animals, even after prolonged induction. The importance of autophagy for exocrine pancreatic integrity has previously been documented in a number of studies [Citation8,Citation9,Citation14,Citation24–28]. Most reports have demonstrated a protective effect of autophagy for acinar cells; although autophagy might promote early stages of pancreatitis by facilitating the activation of trypsinogen to trypsin. Compared to our observations, phenotypically similar, but attenuated findings are reported for Ubc-CreERT2; Atg7flox/flox mice that allow acute, but irreversible, systemic deletion of Atg7 [Citation8]. While marked damage to the pancreas with intra-acinar vacuolization occurs, unlike in our model, this is less intense and not directly associated with the demise of mice. Furthermore, ATG7 is essential for survival in a Trp53-dependant manner during fasting, but not during regular food intake [Citation8,Citation29]. Still, our data fits well within published reports. Cre-loxP mediated, embryonic deletion of Atg7 causes severe acinar destruction, pancreatic inflammation, and extensive fibrosis [Citation14,Citation24]. Therefore, in various models, impairment of Atg7 triggers similar alterations of the exocrine pancreas, but with varying intensity. These variances are not readily explained, but are likely related to model systems, state of tissue development at which the recombination has taken place, animal background and possibly also different compositions of the “regular” chow. Pancreas-specific deletion of Atg5 during embryogenesis induces tissue injury that is consistent with chronic pancreatitis and in some reports is less pronounced than the damage induced by knockdown of Atg7. Interestingly, pancreas morphology remains largely normal upon Atg5 knockdown in adult tissue [Citation9,Citation26]. Mice that allow systemic, inducible expression of a dominant negative mutant form of ATG4B (ATG4B[CA]) are essentially healthy, even after one year of autophagy blockage [Citation7]. Possible, but speculative explanations could be different levels of mosaicism, and that more residual autophagic activity is retained, partly due to a less stringent expression of rtTA3 from the Rosa26 locus as compared to expression from the Cag promoter.
Inflammation is a frequent, but not required cause of chronic pancreatitis [Citation16,Citation30,Citation31]. We found increased numbers of macrophages in the pancreata of induced Atg7-shRNA mice, whereas the number of lymphocytes (B-cells and T-cells) was negligible and did not differ between induced and control animals. Neutrophils were absent. It is conceivable that macrophages accumulated due to the increased cell death of exocrine tissue and served to clear apoptotic cells. However, at present it cannot be ruled out that they were at least partially causative for the pancreatic destruction. Macrophage infiltration has been reported when Atg5 is deleted in embryonic pancreatic tissue, but not upon deletion in the adult pancreas [Citation26].
Despite features of severe chronic pancreatitis, the blood serum levels of AMY and PNLIP as potential readouts of pancreatic exocrine function were unaffected in induced Atg7-shRNA trangenics. Normal blood levels of AMY and PNLIP do not rule out pancreatic exocrine insufficiency. Both blood levels peak 1–2 days after the onset of acute pancreatitis and then return to normal or may even be reduced, despite persistent disease [Citation30,Citation32]. Both serum markers are not specific for chronic pancreatitis per se and their interpretation requires clinical correlation [Citation30]. It could also be that the tissue damage did not impact on AMY and PNLIP serum levels because vital residual acinar tissue was still present after 14 days of DOX treatment.
It is apparent that systemic silencing of Atg7 caused potentially fatal hypoglycemia. However, the underlying cause of deregulated glucose homeostasis is still unclear, as is the question if it is cause or consequence. We did not observe evidence of functional islet damage. Upregulation of glucagon-producing pancreatic α-cells, increased serum levels of glucagon with unaltered INS levels and the depletion of hepatic glycogen stores suggested an intact physiological hormonal response of the endocrine pancreas. Depletion of hepatic glycogen, impaired gluconeogenesis and reduced blood glucose levels upon deletion of Atg7 have been reported before [Citation8,Citation33]. However, our results are in opposition to previous studies that have linked autophagy defects to hyperglycemia [Citation14,Citation28]. Embryonic, Cre-loxP mediated deletion of either Atg7 or Atg5 in otherwise wildtype pancreata causes destruction of exocrine and endocrine tissue and high blood glucose levels [Citation14]. Atg7 deficiency in INS-producing pancreatic β-cells reduces islet mass and INS production eventually leading to diabetes [Citation28]. It might well be that in the case of the former study mechanisms emerge upon embryonic deletion of Atgs that can partially overcome the deleterious effects of acute inhibition. In addition, in our models, a significant fraction of islet cells retained ATG expression. We believe this was due to mosaicism that has been reported to occur in Cag-rtTA3; TRE-miR30-E-shRNA animals for other tissues such as the spleen and in the islets of Langerhans for DOX-inducible genes embedded in the ColA1 locus as well [Citation10,Citation11,Citation34].
The liver was only affected in our Atg5-shRNA model. While the relatively short induction in Atg7-shRNA transgenics had no immediate effects, the longer induction of Atg5-shRNA animals resulted in histological changes consistent with NAFLD and in most cases NASH. These were reversible upon ATG5 recovery. This finding is in line with the long-established notion that autophagy controls lipid metabolism [Citation35]. RNAi-mediated inhibition of Atg5 increases cellular lipid content and hepatocyte-specific deletion of Atg7 causes steatosis in mice [Citation36]. A recent study using Ubc-CreERT2; Atg7flox/flox animals has also demonstrated hepatic lipid accumulation [Citation29]. Likewise, deletion of Atg5 in liver sinusoidal endothelial cells or monocytes enhances the accumulation of lipid droplets in murine hepatocytes [Citation37]. Of note, in the Atg5-shRNA model of Cassidy et al. autophagy blockage for four month leads to immune cell infiltration in multiple tissues including the lung and liver, but concomitant steatosis was not reported [Citation38]. We cannot completely rule out that the hepatic inflammatory changes in our model were an early sign of an increased generalized inflammatory state, and not a reflection of NASH per se. However, neither did we observe, nor did the Narita group report overt inflammatory aggregates in other tissues during shorter periods of Atg5 blockage [Citation9]. Restoration of ATG expression was associated with the development of liver fibrosis in Atg5-shRNA, but not in Atg7-shRNA transgenic mice. In this regard, our data is consistent with the report from Cassidy and colleagues [Citation9]. They have previously described liver fibrosis occurring during the recovery phase after Atg5 silencing, but no evidence of NAFLD or NASH. Cassidy et al. identified activated stellate cells that are known mediators of hepatic fibrosis in DOX-induced animals, whereas COL1A1 as a major component of liver fibrosis is upregulated only in the recovery phase [Citation9]. Although, we did not examine the regulation of COL1A1 in our system, the resemblance of the models makes it likely that similar changes occur in our Atg5-shRNA transgenic mice. Additional studies have established a link between Atg5 impairment and hepatic fibrosis. Hepatocyte specific deletion of Atg5 induces liver damage and drives fibrosis in a manner dependent on Ne2l2/Nrf2 [Citation39]. Mice that express mutated Atg5 in the myeloid lineage are more susceptible to chemically induced liver damage and hepatic fibrosis compared to wild type animals [Citation40]. Interestingly, differences between hepatocyte specific deletion of either Atg5 or Atg7 have been reported before [Citation37]. While the absence of ATG5 in hepatocytes protects mice from acetaminophen-induced liver damage, the absence of ATG7 exacerbates this process [Citation41,Citation42]. In our model GCG was upregulated upon Atg7 inhibition and GCG is known to induce lipolysis. Although the latter is mainly the consequence of its hypolipidemic action on adipose tissue, it might also affect hepatic steatosis [Citation20]. It could also be that the relatively short time of Atg7 inhibition was simply not long enough for developing overt signs of NAFLD or NASH.
It is important to point out that the discrepant phenotypes of the Atg7-shRNA and Atg5-shRNA knockdown models might well be a consequence of a disparate knockdown efficiency and thus different levels of autophagy impairment. Both knockdowns were, with varying efficacy, strong in most organs, but not complete, because residual levels of LC3-II were still detectable. We tried to assess the potency of the autophagy blockage by virtue of SQSTM1 protein expression levels. SQSTM1 is a receptor protein that targets ubiqutinated protein aggregates to the autophagy system and its abundance can negatively correlate with autophagy levels in certain circumstances [Citation43]. In our study, SQSTM1 increased upon inhibition of either Atg7 or Atg5 in pancreatic cancer cell lines and, after prolonged induction in pancreatic tissue, but fluctuated widely in many other tissues and between individual mice. The suitability of SQSTM1 as a surrogate marker for autophagy impairment is known to be higly context dependent. SQSTM1 levels can remain unaltered despite strong autophagy induction, can vary independent of autophagy and can even yield paradoxical results [Citation43]. Consequently, in our models, we think that variations in SQSTM1 protein expression were unsuitable to gauge or compare the knockdown efficacy between our transgenic models. From the presented data it was not possible to say if one of the two models experienced stronger autophagy blockage. Therefore, it was not reasonable to conclude with sufficient certainty that the phenotypic differences were due to diverse biological functions of Atg7 and Atg5.
Additionally, it cannot be completely ruled out that our study was partially confounded by shRNA off-target effects. However, we do not believe this to be the case for several reasons. Our data, including the differences between Atg7 and Atg5 knockdown was comparable to that of Cre-loxP studies and previously characterized mice that express the same miR30-E-shRNA against Atg5 [Citation9,Citation14,Citation24,Citation26]. Furthermore, BLAT analysis using the UCSC genome browser revealed that the shRNA sequences targeting Atg7 or Atg5 were highly specific to the individual targets. Finally, the miR30-E-based shRNA approach is specifically designed to minimize off-target effects [Citation12].
Despite the aforementioned potential technical limitations, we believe that for the sake of completeness it is prudent to mention, that in recent literature, there is increasing evidence for unconventional roles of ATGs that may involve processes other than the regulation of autophagy [Citation44–49]. ATG7 modulates cell cycle progression and cell death in a manner dependent on TP53 (tumor protein p53) and is implicated in cancer cell invasion and metastasis via stabilization of CD44 [Citation45,Citation49]. ATG5 regulates the MAPK (mitogen-activated protein kinase) pathway and modulates apoptosis and mitotic catastrophe [Citation46–48]. It is very likely that there are additional, yet unknown functions of ATGs that are unrelated to their role in autophagosome biogenesis.
While our models and that of Cassidy and colleagues are well suited to study systemic effects of Atg7 and Atg5 inhibition, a few caveats have to be considered. Foremost, due to the blood brain barrier, only relatively low concentrations of DOX will be achieved in cerebrospinal fluid and brain tissue upon oral application [Citation50]. Accordingly, these models are not exposed to the detrimental effects to the central nervous system that results from impaired autophagy [Citation51–53]. We did not observe a significant knockdown in the spleen, possibly due to mocaicism that occurs in the spleen of Cag-rtTA3; TRE-miR30-E-shRNA mice [Citation10,Citation11]. This limits the applicability of these DOX-inducible models to study the effects of autophagy inhibition on the central nervous system and possibly the hematopoietic system [Citation10,Citation11].
Due to the relatively rapid phenotypic onset upon Atg7 knockdown, long term studies might require a metronomic treatment regime with phases of shRNA induction followed by recovery periods. It is also conceivable that a less stringent expression of rtTA3, for example from the Rosa26 locus, might prevent the complete destruction of the pancreas and thus could be a more suitable experimental approach in some cases [Citation10,Citation54]. Cassidy et al. have demonstrated that prolonged RNAi-mediated inhibition of Atg5 causes additional organ alterations and accelerated aging [Citation38]. For example, they have reported the occurrence of cardiomyopathy, degenerative kidney disease and as mentioned widespread immune infiltration across multiple tissues. It is very likely, that our Atg5-shRNA mice will show similar phenotypes upon prolongued DOX-induction. The same might be the case in organs other than the pancreas for Atg7-shRNA animals if rtTA3 expression is less stringent or constraint to specific organs. For example, Takamura et al. have shown that mice with liver-specific deletion of either Atg5 or Atg7 develop liver adenomas and a very recent report from the Ryan laboratory demonstrates the occurance of hepatic fibrosis after liver-specific, embryonic deletion of Atg7 in 4–5 week old mice [Citation55,Citation56].
In summary, induction of Atg7-shRNA mice triggered a severe phenotype with demise of acinar pancreatic tissue that was reversible up to a certain point, but when prolonged the induction was ultimately lethal. Regulable Atg7-shRNA and Atg5-shRNA mouse models are valuable tools that will enable further studies on the role of autophagy inhibition at various disease stages and thereby help to evaluate the consequences of acute autophagy inhibition as a therapeutic concept.
Materials and methods
Animals
TRE-GFP-miR30-E-shRNA Atg5 and TRE-GFP-miR30-E-shRNA Atg7 mice were custom made by Mirimus Inc. and purchased at an age of six to eight weeks. C57BL6/N Cag-rtTA3 mice were a kind gift from the Zender lab (Lars Zender, University University of Tuebingen, Germany). All animals were housed in a controlled environment with free access to food and water. Doxycycline-containing (625 mg/kg) chow was obtained from Ssniff Spezialdiäten GmbH (A112D70624). All experiments strictly adhered to the relevant ethical and animal safety guidelines. Animals were humanely sacrificed using exposure to CO2 once endpoint criteria (significant weight loss, inappetence, weakness) were met. To initiate target knockdown, both, Atg7-shRNA and Atg5-shRNA expressing transgenics and their respective controls were subjected to a DOX containing diet ad libidum. Knockdown cohorts were kept heterozygous for both Cag-rtTA3 and TRE-GFP-miR30-E-shRNA throughout the study, whereas control animals were lacking only the Cag-rtTA3 promotor. Throughout the manuscript Atg7-shRNA and Atg5-shRNA expressing mice are referred to as Atg7ind or Atg5ind respectively, whereas controls are referred to as Atg7ctrl and Atg5ctrl. The median age of experimental mice was 77 ± 3 days. All groups were mixed male and female and no apparent gender bias was encountered during our experiments.
Targeting shRNA sequences
The following shRNA sequences were generated by Mirimus Inc. and embedded in an improved design variant of miR30-E to produce transgenic mice using published technologies [Citation11,Citation12,Citation57].
Atg5.1065: TATGAAGAAAGTTATCTGGGTA
Atg7.1291: ATATTTTCTGTAGCCGCTCTGC
Genotyping
MiR30-E-shRNA. Genotyping did not distinguish between individual shRNAs but merely confirmed their presence. The following primers (5’ to 3’) and protocols were used:
Col1A1 fw:AATCATCCCAGGTGCACAGCATTGCGG
Col1A1 rev:CTTTGAGGGCTCATGAACCTCCCAGG
Col1A1 DAdpA rev:ATCAAGGAAACCCTGGACTACTGCG
PCR reaction: H2O9 µL; fw primer (10 pmol)1 µL; rev primer (Col1A1 rev or Col1A1 DAdpA rev) (10 pmol) 1 µl, GoTaq G2 Hot Start Green Master Mix (2x) (Promega, M7422) 12.5 µl, DNA (@ 100–250 ng/µl) 1.5 µl
PCR protocol: 94°C 3 min, 30x (94°C 0.5 min, 60°C 0.5 min, 72°C 0.5 min), 72°C 5 min, 4°C infinite
PCR products: wild type 220 bp, transgene 295 bp. For each genotyping two separate PCR reactions are required (1: Col1A1 fw & Col1A1 rev, 2: Col1A1 fw & Col1A1 DAdpA rev)
Cag-rtTA3. The following primers (5’ to 3’) and protocols were used:
Cag-rtTA3 fw:CGAAACTCTGGTTGACATG
Cag-rtTA3 rev (wt):TGCCTATCATGTTGTCAAA
Cag-rtTA3 rev (mut):CTGCTGTCCATTCCTTATTC
PCR reaction: H20 14.05 µl; fw primer (10 pmol) 1 µl, rev primer (Cag-rtTA3 rev (wt) or Cag-rtTA3 rev (mut)) (10 pmol) 1 µl, dNTPs (10 mM) 0.25 µl, MgCl2 (25 mM) 2 µl, GoTaq Green Buffer (5x) 5 µl, GoTaq Flexi polymerase (5 U/µl) (Promega, M7805) 0.2 µl, DNA (@ 150–250 ng/ul) 1.5 µl
PCR protocol: 95°C 5 min, 35x (95°C 0.5 min, 56°C 0.5 min, 72°C), 72°C 5 min, 4°C infinite
PCR products: wild type 330 bp, Cag-rtTA3 360 bp. For each genotyping two separate PCR reactions are required (1: Cag-rtTA3 fw & Cag-rtTA3 rev (wt), 2: Cag-rtTA3 fw & Cag-rtTA3 rev (mut))
Tissue harvest
Mice were sacrificed at the indicated time points and all organs were fixed in 10% neutral-buffered formalin at once for 24 h at room temperature. Tissue processing, paraffin embedding and hematoxylin-eosin (HE) stains were done following standard protocols [Citation14,Citation58].
Pancreas size estimation
In mice, unlike in humans, the pancreas grows in a mesenteric pattern, i. e. its parenchyma is separated by mesenteric fat and stromal elements including lymphoid tissue. In order to isolate the entire pancreatic parenchyma all duodenal, gastric and splenic mesenteric tissue was excised in toto and consistently embedded in paraffin along its longest axis. This ensured that pancreatic tissue is represented in its greatest extent on HE-sections. HE-sections were scanned using a Pannoramic Scan II slide scanner from 3DHistech® and the pancreas was then identified during virtual microscopy based on a retained basic architectural structure with residual acinar tissue distributed in a characteristic lobular manner and dispersed islets of Langerhans. CaseViewer Software from 3DHistech® was used to measure the area of actual pancreas parenchyma on HE-stained sections that serves as a surrogate for pancreas size.
Immunohistochemistry/special stains
Antibody stainings were done as described in detail before [Citation14,Citation58]. The following antibodies were used: ADGRE1 (F4/80) (Abcam, ab6640; 1:1000; TR pH 6.1), ATG5 rabbit monoclonal (Cell Signaling Technology, 12,994; 1:100; TR pH 6.1), ATG7 rabbit monoclonal (Cell Signaling Technology, 8558; 1:100; TR pH 9.0), CD3 (Abcam, ab16669; 1:100; CS pH 6.0), Cleaved CASP3 (Asp175) rabbit monoclonal (Cell Signaling Technology, 9664; 1:200; CS pH 6.0), GCG (glucagon) rabbit polyclonal (Epitomics, AC-0074A; 1:10,000, CS 6.0), INS (insulin) Guinea pig polyclonal (DAKO, A0564; 1:100, CS 6.0), LC3 mouse monoclonal 5F10 (Nanotools, 0231–100/LC3-5F10; 1:100; TR pH 9.0), PTPRC (isoform CD45R/B220; Pharmingen, 550,286; 1:50; CS pH 6.0), SQSTM1/p62 rabbit polyclonal (Enzo, BML-PW9860; 1:500; TR pH 6.1). (TR = antigen retrieval with target retrieval antigen solution from DAKO, CS = target retrieval with citrate buffer).
Cleaved CASP3, ATG7, ATG5, INS, and GCG were quantified using QuPath software [Citation59]. Positive staining was determined using the “positive cell detection” function and defined as the number of positive cells divided by the number of total cells of the analyzed area (cells of at least three representative images at 20X magnification for each animal were counted). For the pancreas, acinar and islets were quantified separately. The numbers of ADGRE1-, CD3- and PTPRC-positive cells were counted manually in at least three representative images at 20X magnification for each mouse and is presented as cells/mm2 tissue. Neutrophils in the pancreas could not be demonstrated by means of their typical nuclear morphology on HE or the chloracetate esterase reaction.
Throughout the manuscript, for control cohorts, we only showed histology pictures for the time points immediately after cessation of DOX application and 42 d after recommencing a normal diet. The 21 d recovery in control animals was omitted because it was essentially identical to the 42 d time point. However, whenever recovery was assessed all time points were included in the respective quantifications and statistics.
Western Blotting. Tissue samples were lysed and homogenized at 4°C in lysis buffer (Merck, CytoBuster™ Protein Extraction Reagent, 71,009) supplemented with a protease inhibitor cocktail (Thermo Scientific, Pierce Protease Inhibitor Mini Tablets, A32953) using the BeatBug homogenizer (Benchmark Scientific) for 3 min. The following primary antibodies were used: ACTB mouse monoclonal (Thermo Fisher Scientific, MA5-15,739; 1:1000), ATG5 rabbit monoclonal (Cell Signaling Technology, 12,994; 1:1000), ATG7 rabbit monoclonal (Cell Signaling Technology, 8558; 1:1000), LC3B rabbit polyclonal (Cell Signaling Technology, 2775; 1:1000), SQSTM1/p62 rabbit polyclonal (Cell Signaling Technology, 5114; 1:1000).
Blood serum parameters. Blood was obtained via cardiac puncture after humanely sacrificing the animals. Serum was obtained via centrifugation at 800 g for 15 min at 4°C and subsequently stored at −80°C for further analysis. Glucose, AMY and PNLIP were measured by a professional laboratory service provider: synlab.de. INS and GCG levels were determined using commercially available kits (Ultra Sensitive Mouse Insulin ELISA Kit, Crystalchem, 90,080; and Mouse Glucagon ELISA Kit, Crystalchem, 81,518) following the manufacturer’s instructions.
Hepatic glycogen content. To assess hepatic glycogen content liver sections from paraffin embedded formalin fixed (FFPE) material were subjected to the Periodic Acid – Schiff (PAS) reaction. Quantification was done using QuPath software as described by Stålhammar and colleagues [Citation59,Citation60]. Briefly, the density of the hepatic PAS-reaction was determined using the “positive pixel count” function and defined as the number of PAS-positive pixels divided by the number of total pixels of the analyzed hepatic area (three representative images at 20X magnification for each animal).
Hepatic fibrosis. Hepatic fibrosis was visualized with Sirius Red using an established standard protocol and quantified as described by Cassidy and colleagues [Citation9].
Statistical analysis. Statistical analysis was done with IBM SPSS statistics software and the respective tests are mentioned in the figure legends.
Supplemental Material
Download MS Word (32.3 MB)Acknowledgments
This project was funded by the German Research Council via the Research Group FOR 2314 „Targeting therapeutic windows in essential cellular processes for tumor therapy“.
Disclosure statement
No potential conflict of interest was reported by the author(s).
Supplementary material
Supplemental data for this article can be accessed here
Additional information
Funding
References
- Mainz L, Rosenfeldt MT. Autophagy and cancer - insights from mouse models. FEBS J. 2018 Mar;285(5):792–808.
- Thorburn A. Autophagy and disease. J Biol Chem. 2018 Apr 13; 293(15):5425–5430.
- Justice MJ, Siracusa LD, Stewart AF. Technical approaches for mouse models of human disease. Dis Model Mech. 2011 May;4(3):305–310.
- Sauer B. Inducible gene targeting in mice using the Cre/lox system. Methods. 1998 Apr;14(4):381–392.
- Ramirez-Peinado S, Leon-Annicchiarico CL, Galindo-Moreno J, et al. Glucose-starved cells do not engage in prosurvival autophagy. J Biol Chem. 2013 Oct 18 288(42):30387–30398.
- Levy JMM, Towers CG, Thorburn A. Targeting autophagy in cancer. Nat Rev Cancer. 2017 Sep;17(9):528–542.
- Yang A, Herter-Sprie G, Zhang H, et al. Autophagy sustains pancreatic cancer growth through both cell-autonomous and nonautonomous mechanisms. Cancer Discov. 2018 Mar;8(3):276–287.
- Karsli-Uzunbas G, Guo JY, Price S, et al. Autophagy is required for glucose homeostasis and lung tumor maintenance. Cancer Discov. 2014 Aug;4(8):914–927.
- Cassidy LD, Young AR, Perez-Mancera PA, et al. A novel Atg5-shRNA mouse model enables temporal control of autophagy in vivo. Autophagy. 2018;14(7):1256–1266.
- Premsrirut PK, Dow LE, Kim SY, et al. A rapid and scalable system for studying gene function in mice using conditional RNA interference. Cell. 2011 Apr 1 145(1):145–158.
- Dow LE, Premsrirut PK, Zuber J, et al. A pipeline for the generation of shRNA transgenic mice. Nat Protoc. 2012 Feb 2 7(2):374–393.
- Fellmann C, Hoffmann T, Sridhar V, et al. An optimized microRNA backbone for effective single-copy RNAi. Cell Rep. 2013 Dec 26 5(6):1704–1713.
- Boudreau RL, Martins I, Davidson BL. Artificial microRNAs as siRNA shuttles: improved safety as compared to shRNAs in vitro and in vivo. Mol Ther. 2009 Jan;17(1):169–175.
- Rosenfeldt MT, O’Prey J, Morton JP, et al. p53 status determines the role of autophagy in pancreatic tumour development. Nature. 2013 Dec 12 504(7479):296–300.
- Lallemand Y, Luria V, Haffner-Krausz R, et al. Maternally expressed PGK-Cre transgene as a tool for early and uniform activation of the Cre site-specific recombinase. Transgenic Res. 1998 Mar;7(2):105–112.
- Brock C, Nielsen LM, Lelic D, et al. Pathophysiology of chronic pancreatitis. World J Gastroenterol. 2013 Nov 14 19(42):7231–7240.
- Kuma A, Matsui M, Mizushima N. LC3, an autophagosome marker, can be incorporated into protein aggregates independent of autophagy: caution in the interpretation of LC3 localization. Autophagy. 2007 Jul-Aug;3(4):323–328.
- Zhou Q, Melton DA. Pancreas regeneration. Nature. 2018 May;557(7705):351–358.
- Dolensek J, Rupnik MS, Stozer A. Structural similarities and differences between the human and the mouse pancreas. Islets. 2015;7(1):e1024405.
- Al-Massadi O, Ferno J, Dieguez C, et al. Glucagon control on food intake and energy balance. Int J Mol Sci. 2019 Aug 11 20(16):3905.
- Ueno T, Komatsu M. Autophagy in the liver: functions in health and disease. Nat Rev Gastroenterol Hepatol. 2017 Mar;14(3):170–184.
- Bedossa P, Poitou C, Veyrie N, et al. Histopathological algorithm and scoring system for evaluation of liver lesions in morbidly obese patients. Hepatology. 2012 Nov;56(5):1751–1759.
- Murtaugh LC, Keefe MD. Regeneration and repair of the exocrine pancreas. Annu Rev Physiol. 2015;77(1):229–249.
- Antonucci L, Fagman JB, Kim JY, et al. Basal autophagy maintains pancreatic acinar cell homeostasis and protein synthesis and prevents ER stress. Proc Natl Acad Sci U S A. 2015 Nov 10 112(45):E6166–74.
- Hashimoto D, Ohmuraya M, Hirota M, et al. Involvement of autophagy in trypsinogen activation within the pancreatic acinar cells. J Cell Biol. 2008 Jun 30 181(7):1065–1072.
- Diakopoulos KN, Lesina M, Wormann S, et al. Impaired autophagy induces chronic atrophic pancreatitis in mice via sex- and nutrition-dependent processes. Gastroenterology. 2015 Mar;148(3):626–638 e17.
- Mareninova OA, Hermann K, French SW, et al. Impaired autophagic flux mediates acinar cell vacuole formation and trypsinogen activation in rodent models of acute pancreatitis. J Clin Invest. 2009 Nov;119(11):3340–3355.
- Quan W, Jung HS, Lee MS. Role of autophagy in the progression from obesity to diabetes and in the control of energy balance. Arch Pharm Res. 2013 Feb;36(2):223–229.
- Yang Y, Karsli-Uzunbas G, Poillet-Perez L, et al. Autophagy promotes mammalian survival by suppressing oxidative stress and p53. Genes Dev. 2020 May 1 34(9–10):688–700.
- Tattersall SJ, Apte MV, Wilson JS. A fire inside: current concepts in chronic pancreatitis. Intern Med J. 2008 Jul;38(7):592–598.
- Kleeff J, Whitcomb DC, Shimosegawa T, et al. Chronic pancreatitis. Nat Rev Dis Primers. 2017 Sep 7;3:17060.
- Ismail OZ, Bhayana V. Lipase or amylase for the diagnosis of acute pancreatitis? Clin Biochem. 2017 Dec;50(18):1275–1280.
- Ezaki J, Matsumoto N, Takeda-Ezaki M, et al. Liver autophagy contributes to the maintenance of blood glucose and amino acid levels. Autophagy. 2011 Jul;7(7):727–736.
- Beard C, Hochedlinger K, Plath K, et al. Efficient method to generate single-copy transgenic mice by site-specific integration in embryonic stem cells. Genesis. 2006 Jan;44(1):23–28.
- Martinez-Lopez N, Singh R. Autophagy and lipid droplets in the liver. Annu Rev Nutr. 2015;35(1):215–237.
- Singh R, Kaushik S, Wang Y, et al. Autophagy regulates lipid metabolism. Nature. 2009 Apr 30 458(7242):1131–1135.
- Allaire M, Rautou PE, Codogno P, et al. Autophagy in liver diseases: time for translation? J Hepatol. 2019 May;70(5):985–998.
- Cassidy LD, Young ARJ, Young CNJ, et al. Temporal inhibition of autophagy reveals segmental reversal of ageing with increased cancer risk. Nat Commun. 2020 Jan 16 11(1):307.
- Ni HM, Woolbright BL, Williams J, et al. Nrf2 promotes the development of fibrosis and tumorigenesis in mice with defective hepatic autophagy. J Hepatol. 2014 Sep;61(3):617–625.
- Lodder J, Denaes T, Chobert MN, et al. Macrophage autophagy protects against liver fibrosis in mice. Autophagy. 2015;11(8):1280–1292.
- Ni HM, Boggess N, McGill MR, et al. Liver-specific loss of Atg5 causes persistent activation of Nrf2 and protects against acetaminophen-induced liver injury. Toxicol Sci. 2012 Jun;127(2):438–450.
- Igusa Y, Yamashina S, Izumi K, et al. Loss of autophagy promotes murine Acetaminophen hepatotoxicity. J Gastroenterol. 2012 Apr;47(4):433–443.
- Klionsky DJ, Abdel-Aziz AK, Abdelfatah S, et al. Guidelines for the use and interpretation of assays for monitoring autophagy (4th edition)(1). Autophagy. 2021 Jan;17(1):1–382.
- Bestebroer J, V’Kovski P, Mauthe M, et al. Hidden behind autophagy: the unconventional roles of ATG proteins. Traffic. 2013 Oct;14(10):1029–1041.
- Lee IH, Kawai Y, Fergusson MM, et al. Atg7 modulates p53 activity to regulate cell cycle and survival during metabolic stress. Science. 2012 Apr 13 336(6078):225–228.
- Martinez-Lopez N, Athonvarangkul D, Mishall P, et al. Autophagy proteins regulate ERK phosphorylation. Nat Commun. 2013;4(1):2799.
- Maskey D, Yousefi S, Schmid I, et al. ATG5 is induced by DNA-damaging agents and promotes mitotic catastrophe independent of autophagy. Nat Commun. 2013;4(1):2130.
- Yousefi S, Perozzo R, Schmid I, et al. Calpain-mediated cleavage of Atg5 switches autophagy to apoptosis. Nat Cell Biol. 2006 Oct;8(10):1124–1132.
- Zhu J, Huang G, Hua X, et al. CD44s is a crucial ATG7 downstream regulator for stem-like property, invasion, and lung metastasis of human bladder cancer (BC) cells. Oncogene. 2019 Apr;38(17):3301–3315.
- Das AT, Tenenbaum L, Berkhout B. Tet-on systems for doxycycline-inducible gene expression. Curr Gene Ther. 2016;16(3):156–167.
- Hara T, Nakamura K, Matsui M, et al. Suppression of basal autophagy in neural cells causes neurodegenerative disease in mice. Nature. 2006 Jun 15 441(7095):885–889.
- Komatsu M, Waguri S, Chiba T, et al. Loss of autophagy in the central nervous system causes neurodegeneration in mice. Nature. 2006 Jun 15 441(7095):880–884.
- Yoshii SR, Kuma A, Akashi T, et al. Systemic analysis of Atg5-null mice rescued from neonatal lethality by transgenic ATG5 expression in neurons. Dev Cell. 2016 Oct 10 39(1):116–130.
- Dow LE, Nasr Z, Saborowski M, et al. Conditional reverse tet-transactivator mouse strains for the efficient induction of TRE-regulated transgenes in mice. PLoS One. 2014;9(4):e95236.
- Takamura A, Komatsu M, Hara T, et al. Autophagy-deficient mice develop multiple liver tumors. Genes Dev. 2011 Apr 15 25(8):795–800.
- Barthet VJA, Brucoli M, Ladds M, et al. Autophagy suppresses the formation of hepatocyte-derived cancer-initiating ductular progenitor cells in the liver. Sci Adv. 2021 Jun;7(23). DOI: 10.1126/sciadv.abf9141.
- Fellmann C, Zuber J, McJunkin K, et al. Functional identification of optimized RNAi triggers using a massively parallel sensor assay. Mol Cell. 2011 Mar 18 41(6):733–746.
- Rosenfeldt MT, Nixon C, Liu E, et al. Analysis of macroautophagy by immunohistochemistry. Autophagy. 2012 Jun;8(6):963–969.
- Bankhead P, Loughrey MB, Fernandez JA, et al. QuPath: open source software for digital pathology image analysis. Sci Rep. 2017 Dec 4 7(1):16878.
- Stalhammar G, See TRO, Phillips SS, et al. Density of PAS positive patterns in uveal melanoma: correlation with vasculogenic mimicry, gene expression class, BAP-1 expression, macrophage infiltration, and risk for metastasis. Mol Vis. 2019;25:502–516.