
ABSTRACT
The N-degron pathway is a proteolytic system in which the N-terminal degrons (N-degrons) of proteins, such as arginine (Nt-Arg), induce the degradation of proteins and subcellular organelles via the ubiquitin-proteasome system (UPS) or macroautophagy/autophagy-lysosome system (hereafter autophagy). Here, we developed the chemical mimics of the N-degron Nt-Arg as a pharmaceutical means to induce targeted degradation of intracellular bacteria via autophagy, such as Salmonella enterica serovar Typhimurium (S. Typhimurium), Escherichia coli, and Streptococcus pyogenes as well as Mycobacterium tuberculosis (Mtb). Upon binding the ZZ domain of the autophagic cargo receptor SQSTM1/p62 (sequestosome 1), these chemicals induced the biogenesis and recruitment of autophagic membranes to intracellular bacteria via SQSTM1, leading to lysosomal degradation. The antimicrobial efficacy was independent of rapamycin-modulated core autophagic pathways and synergistic with the reduced production of inflammatory cytokines. In mice, these drugs exhibited antimicrobial efficacy for S. Typhimurium, Bacillus Calmette–Guérin (BCG), and Mtb as well as multidrug-resistant Mtb and inhibited the production of inflammatory cytokines. This dual mode of action in xenophagy and inflammation significantly protected mice from inflammatory lesions in the lungs and other tissues caused by all the tested bacterial strains. Our results suggest that the N-degron pathway provides a therapeutic target in host-directed therapeutics for a broad range of drug-resistant intracellular pathogens.
Abbreviations: ATG: autophagy-related gene; BCG: Bacillus Calmette–Guérin; BMDMs: bone marrow-derived macrophages; CALCOCO2/NDP52: calcium binding and coiled-coil domain 2; CFUs: colony-forming units; CXCL: C-X-C motif chemokine ligand; EGFP: enhanced green fluorescent protein; IL1B/IL-1β: interleukin 1 beta; IL6: interleukin 6; LIR: MAP1LC3/LC3-interacting region; MAP1LC3/LC3: microtubule associated protein 1 light chain 3; Mtb: Mycobacterium tuberculosis; MTOR: mechanistic target of rapamycin kinase; NBR1: NBR1 autophagy cargo receptor; OPTN: optineurin; PB1: Phox and Bem1; SQSTM1/p62: sequestosome 1; S. Typhimurium: Salmonella enterica serovar Typhimurium; TAX1BP1: Tax1 binding protein 1; TNF: tumor necrosis factor; UBA: ubiquitin-associated.
Introduction
Macroautophagy (hereafter autophagy) is a catabolic process by which cytoplasmic constituents such as misfolded proteins and organelles are sequestered by autophagic membranes and degraded by lysosomal hydrolases [Citation1,Citation2]. Whereas bulk autophagy generates energy and amino acids during nutritional insufficiency, selective autophagy removes cytotoxic or unwanted materials [Citation1,Citation2]. In selective autophagy, cargoes are recognized by specific receptors such as SQSTM1/p62, NBR1 autophagy cargo receptor (NBR1), optineurin (OPTN), TAX1BP1, and CALCOCO2/NDP52 [Citation3] characterized by ubiquitin-associated (UBA) and MAP1LC3/LC3-interacting region (LIR) domains that respectively bind ubiquitin chains assembled on cargoes and LC3 anchored to autophagic membranes [Citation3]. In addition to protein aggregates, selective autophagy mediates the degradation of subcellular organelles such as mitochondria, endoplasmic reticulum, and peroxisomes [Citation2,Citation4–6]. During organellophagy, autophagic receptors typically recognize both the ubiquitin chains on transmembrane receptors and LC3 on autophagic membranes [Citation5,Citation7]. Recent studies showed that invading pathogens such as viruses and bacteria can also be targeted by selective autophagy for lysosomal degradation [Citation6,Citation8–14]. This process, called xenophagy, involves various types of polyubiquitin chains that play distinct roles in recruiting autophagic receptors such as SQSTM1 and NBR1 [Citation15–17].
Upon infection, intracellular bacteria reside within phagosomes to escape from the surveillance of host defense systems [Citation18–24]. A subpopulation of bacteria is exposed to the cytosol during which the secretory system on bacterial membranes secretes bacterial effector proteins to modulate the functions of host cells [Citation23,Citation25–27]. Once cells sense bacteria in the cytosol, specific proteins on bacterial membranes are assembled with ubiquitin chains for targeting to autophagic membranes and lysosomal degradation [Citation28,Citation29]. Several E3 ligases were identified to ubiquitinate specific receptors on bacterial membranes, including PRKN/parkin that mediates K63-linked ubiquitination to target Mycobacterium tuberculosis (Mtb) to autophagic membranes via SQSTM1 and CALCOCO2 [Citation30] and SMURF1 that mediates K48-linked ubiquitination for Mtb and Listeria monocytogenes [Citation31]. In addition, the ubiquitination of Salmonella enterica serovar Typhimurium (S. Typhimurium) involves the cooperative activities of LRSAM1, ARIH1, and RNF31/HOIP (ring finger protein 31) [Citation32–34]. Each type of bacteria may be marked by distinct ubiquitin codes, which are defined by the biochemical specificity of E3 enzyme [Citation34,Citation35]. Ubiquitinated bacteria are recognized by autophagy receptors to be targeted to autophagosome for degradation [Citation36].
Various pathogens have evolved unique strategies to avoid, subvert, or co-opt host defense systems to aid their survival [Citation8]. To inhibit bacterial infection, several generations of antibiotics have been developed, contributing to reducing disease incidence caused by bacterial pathogens [Citation37,Citation38]. However, as the incidences of multidrug resistance of pathogenic bacteria rise and threaten the ability to treat bacterial infection, it is increasingly urgent to develop fundamentally different approaches [Citation39]. In principle, there are several anti-microbial strategies such as phage therapy, vaccines, antibodies, probiotics, antimicrobial peptides, and host-directed therapy [Citation38–41]. Host-directed therapy utilizes small molecule drugs or proteins to augment host defense mechanisms or modulate excessive inflammation [Citation42]. Among host-directed therapies, the pharmaceutical modulation of autophagy is emerging as a universal means to eradicate intracellular bacteria using lysosomal hydrolases [Citation42,Citation43]. To develop xenophagy-inducing drugs, several chemicals were identified to inhibit the infectivity of intracellular bacteria by activating autophagy. Rapamycin enhances colocalization of Mtb with LC3 and acidification of mycobacterial phagosomes in vitro at 50 μM 2 h after infection in a manner independent of autophagy [Citation44,Citation45]. In another study, however, rapamycin facilitated the infectivity of Mtb when treated at 1 μM for 3 days in vitro [Citation44]. The antidiabetic drug metformin upregulates lipidated LC3 form and shows an antimicrobial effect in vitro at 1 mM and in mice at 500 mg/kg (q.o.d. injection, intraperitoneal [i.p.]) [Citation46]. The AMPK activator AICAR inhibits the infectivity of Mtb in vitro at 50–100 μM and in mice at 500 mg/kg i.p. by activating autophagic pathways [Citation47]. Resveratrol, a SIRT1 (sirtuin 1) activator, shows moderate efficacy against Mtb in vitro at 10–100 μM [Citation48]. AR-12, triclosan and D61 also exhibit antimicrobial effects against S. Typhimurium in vitro at various concentrations [Citation49,Citation50]. To date, there are no known xenophagy-inducing drugs with satisfactory efficacy via a clear mode of action.
The N-degron pathway is a proteolytic system that targets proteins harboring destabilizing N-terminal (Nt) residues, called N-degrons [Citation51–53]. The N-degrons such as N-Arg are recognized by the N-recognins UBR1, UBR2, UBR4, and UBR5 that mediate substrate ubiquitination, leading to proteasomal degradation via the ubiquitin-proteasome system (UPS) [Citation54,Citation55]. Recently, we have shown that the N-degron pathway regulates autophagic proteolysis, in which the Nt-Arg is post-translationally conjugated on endoplasmic reticulum (ER)-residing molecular chaperones [Citation56–59]. This autophagic N-degron binds the ZZ domain of the autophagic receptor SQSTM1/p62 and promotes the self-polymerization of SQSTM1 in complex with protein cargoes and SQSTM1 interaction with LC3 on phagophores, leading to lysosomal degradation. We also developed chemical mimics of the autophagic N-degron as synthetic agonists to the ZZ domain of SQSTM1 [Citation58,Citation59]. These agonists were shown to induce in vitro lysosomal degradation of misfolded protein aggregates in neurodegeneration [Citation58] and the autophagic turnover of the ER [Citation59].
In this study, we show that invading bacteria and SQSTM1-dependent selective autophagy mutually counteract each other and developed xenophagy-inducing drugs (XIDs) targeting SQSTM1. These drugs exhibited antimicrobial efficacy against various infectious bacteria by inducing MTOR-independent selective autophagy. Pharmaceutical activation of SQSTM1 facilitated autophagosome biogenesis and SQSTM1 association with bacteria, which in turn recruited autophagic membranes to bacterial membranes, leading to lysosomal degradation. In mice, these xenophagy modulators exhibited strong antimicrobial efficacy for S. Typhimurium, Mtb, and even multidrug-resistant Mtb and suppressed excessive production of inflammatory cytokines. We suggest that these XIDs may be developed into drugs for a broad spectrum of pathogenic bacteria.
Results
Counteractive crosstalk between S. Typhimurium and host cells via autophagy
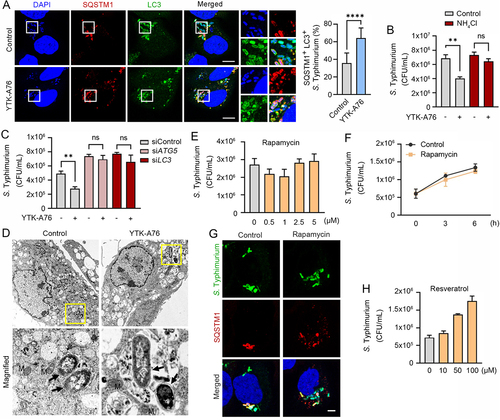
Several studies have characterized autophagic pathways in cells infected with bacteria [Citation19], yet the role of SQSTM1-dependent selective autophagy as a host defense system remains poorly understood. As an initial step to explore autophagy as a target for antimicrobial drugs, we assessed autophagic flux in RAW264.7 and HeLa cells infected with the Gram-negative bacteria S. Typhimurium. Immunoblotting analyses showed that the synthesis of LC3 and its lipidation into LC3-II () were strikingly suppressed in a manner depending on multiplicity of infection (MOI) ( and S1A) and time during 1–6 h post-infection (). Such an activity of LC3 was tightly blocked at a basal level as evidenced by insensitivity to bafilomycin A1, an inhibitor of the lysosomal V-ATPase (). In contrast to bacteria, host cells could robustly induce the synthesis and lipidation of LC3 () and the formation of LC3-positive puncta () in response to lipopolysaccharide (LPS), a pathogen-associated molecular pattern (PAMP). In addition, basal autophagy flux of host cells was dramatically reduced when S. Typhimurium was infected (). These results suggest that the suppression of autophagic pathways is essential for the life cycle of S. Typhimurium.
Figure 1. Counteractive crosstalk between S. Typhimurium and host cells via autophagy. (A) RAW264.7 cells were infected with S. Typhimurium of MOI 10 for 6 h and analyzed by immunoblotting. (B) RAW264.7 cells were infected with S. Typhimurium of indicated multiplicity of infection (MOI) for 6 h and analyzed by immunoblotting. (C) HeLa cells were infected with S. Typhimurium of MOI 10 for indicated time periods and analyzed by immunoblotting. (D) RAW264.7 cells were infected with S. Typhimurium of indicated MOI and treated with 100 nM bafilomycin A1 for 4 h before analyzing by immunoblotting. (E) RAW264.7 cells were treated with 100 ng/mL LPS for 6 h and analyzed by immunoblotting. (F) Puncta formation assay of LC3 (green) in HeLa cells treated with 100 ng/mL LPS for 6 h. Scale bar: 10 μm. (G) RAW264.7 cells were infected with S. Typhimurium for 5 h and followed by 1 h 20 mM NH4Cl treatment for autophagy flux analysis. (H) Relative fold change in mRNA level of autophagy related genes in uninfected and S. Typhimurium-infected HeLa cells were analyzed by RT-qPCR. (I) HeLa cells were infected with S. Typhimurium MOI of 10 for 3 h. Scale bar: 5 μm. (J) Graph of CFU indicating intracellular S. Typhimurium in HeLa cells transfected with siRNA control or siRNA targeting SQSTM1. (K) Graph of CFU indicating intracellular S. Typhimurium in HeLa cells transfected with siRNA control or siRNA targeting LC3 or ATG5 (left panel). Immunoblotting analysis of siRNA-transfected cells for validation of protein depletion (right panel). (L) HeLa cells were infected with S. Typhimurium MOI of 10 for 6 h. (M) Relative fold change in mRNA level of autophagy receptors in uninfected and S. Typhimurium-infected HeLa cells were analyzed by RT-qPCR. UI, uninfected; Sal, S. Typhimurium.
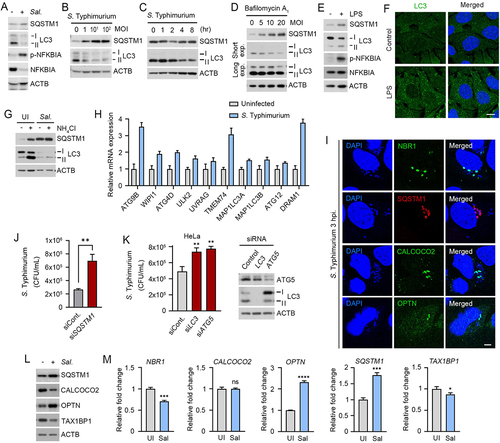
Next, we further monitored the remaining autophagic activities in cells infected with S. Typhimurium. Quantitative real-time PCR (RT-qPCR) showed increased transcription of autophagy-related genes such as ATG9B, WIPI1, TMEM74, ULK2, and DRAM1 (). When visualized using immunostaining analyses, bacterial membranes were associated with LC3-positive autophagic membranes (Figure S1B) as well as various autophagic receptors such as SQSTM1, NBR1, OPTN, and CALCOCO2 with distinct spatiotemporal patterns (). Consistently, the intracellular growth of S. Typhimurium was markedly facilitated by knockdown of SQSTM1 (), LC3B, or ATG5 (). Moreover, the level of SQSTM1 and OPTN increased upon bacterial infection as compared with TAX1BP1, and CALCOCO2 (). A similar induction was observed with mRNA expression of autophagy receptors including SQSTM1 and OPTN (). These results suggest that the infected cells retain residual autophagic activities to degrade intracellular bacteria, providing SQSTM1-dependent selective autophagy as a drug target against a broad range of pathogenic bacteria.
Development of small molecule agonists that exert antimicrobial efficacy
We have previously developed two small molecule ligands, YTK-1105 and YOK-1104, to the ZZ domain of SQSTM1 that induce selective autophagy (Figure S2A) [Citation58,Citation59]. To develop antimicrobial agents with high selectivity and efficacy, we synthesized approximately 120 derivatives of these initial compounds by employing 3D structure modeling of the SQSTM1 ZZ domain associated with SAR (structure-activity relationship). The optimization processes first focused on the activity to induce self-oligomerization of SQSTM1 and to induce the synthesis and lipidation of LC3. Following the initial screening, we assessed the antimicrobial efficacy of the resulting derivatives in the macrophage RAW264.7 and HeLa cells infected with S. Typhimurium by using colony-forming unit (CFU) assays. This screening yielded five compounds (YTK-A76, YT-6-2, YOK-1204, YTK-2205, and YOK-1109) with high antimicrobial efficacy in cultured cells ( and S2B–D). In CFU assays of RAW264.7 cells, these ligands exhibited antimicrobial efficacy in a manner depending on the dose (), time, and MOI (). The efficacy was reproduced in various cell lines such as J774A.1, THP-1, and BMDMs macrophage cell (Figure S2E) as well as the HCT116 and HeLa epithelial cancer cells ().
Figure 2. Development of small molecule agonists that exert antimicrobial efficacy. (A) S. Typhimurium-infected RAW264.7 cells were incubated with SQSTM1 agonists including YTK-A76, YT-6-2, YOK-1204, YTK-2205, and YOK-1109 at indicated concentrations for 6 h. The number of intracellular bacteria was measured by CFU assay. (B) Graph of CFU indicating intracellular S. Typhimurium in RAW264.7 cells treated with indicated concentrations of YTK-A76 for 6 h. (C) RAW264.7 cells were infected with S. Typhimurium MOI of 10 and the cells were incubated with or without YTK-A76 (5 μM) for indicated times. (D) RAW264.7 cells were infected with indicated MOI of S. Typhimurium followed by 10 μM YTK-A76 treatment for 6 h and measured intracellular S. Typhimurium by CFU assay. (E) Graph of colony-forming unit (CFU) indicating the number of intracellular S. Typhimurium in HCT116 and HeLa cells treated with 10 μM YTK-A76 for 6 h. (F) S. Typhimurium was cultured in LB culture media with SQSTM1 agonists (15 μM) or gentamicin (30 μM) at 37°C. The OD600 was measured every hour until 12 h. (G) RAW264.7 cells were treated with SQSTM1 agonists at indicated concentrations for 72 h and cell viability was measured by WST assay. (H) Surface electrostatic potential of SQSTM1 ZZ domain in complex with Arg-Glu peptide (PDB ID: 6MIU). Docked YT-6-2 compound (green) was superimposed with Arg-Glu peptide (yellow) as substrate (left panel). The predicted binding mode of YT-6-2 showing binding site of YT-6-2 to SQSTM1 ZZ domain where expected to overlap the substrate binding site of SQSTM1 (right panel). (I) Pulldown assay using biotinylated YT-6-2 and SQSTM1 wild type or SQSTM1 ZZ point mutant (D147K) plasmids expressed in SQSTM1−/− HeLa cells. 500 μg of total protein was used in pulldown assay, and SQSTM1 was detected by immunoblotting analysis using anti-Flag antibody.
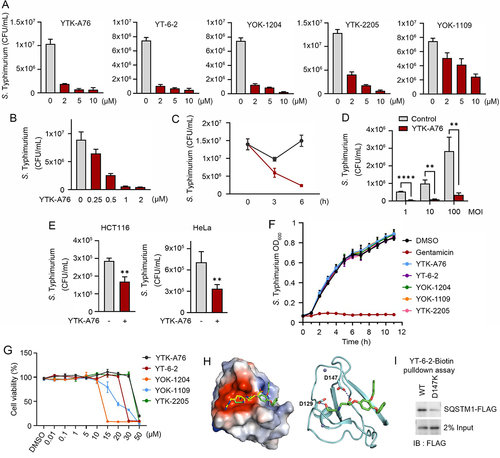
To rule out the possibility that SQSTM1 agonists directly kill intracellular bacteria, we performed disk diffusion assays (Figure S2F). As expected, antibiotics such as ampicillin, kanamycin, and gentamicin effectively killed S. Typhimurium, and the zone of inhibition became larger in a dose-dependent manner. In contrast, SQSTM1 agonists did not form such a zone of inhibition (Figure S2F). Moreover, bacteria normally grew in the growth medium containing as high as 15 μM of SQSTM1 agonists (). During these experiments, viability of host cells also was not significantly affected at the concentrations used for CFU assays ( and S2G). Finally, to rule out the possibility that SQSTM1 agonists affect bacterial entry, we measured the number of intracellular bacteria at 1 hpi following pretreatment of SQSTM1 agonists. No difference was observed (Figure S2H). These results confirm that SQSTM1 agonists exert antimicrobial efficacy by modulating the function of host cells.
In the docking simulation study, the identified compounds located in the position where the first and second residues of N-degron bound (). The binding mode of YT-6-2 showed a hydrogen bond between the oxygen attached to chiral center of YT-6-2 and the side chain of Asp147, which we speculated that play an important role in the binding. To determine the direct binding of the SQSTM1 agonist to SQSTM1 ZZ domain, we performed pulldown assays using biotinylated YT-6-2 and full-length SQSTM1 (Figure S2I). The result showed that biotinylated YT-6-2 bound wild-type SQSTM1 and that the binding was significantly reduced when a point mutation was introduced within ZZ domain (D147K) (). To further support the selectivity of SQSTM1 agonists, we synthesized ATB1095 which lacks the essential amine group required for hydrogen bond with the side chain of Asp147 (Figure S2J). As expected, this compound showed no antimicrobial effect (Figure S2K). These results suggest that SQSTM1 agonists exert their antimicrobial efficacy through specific hydrogen bonds to the ZZ domain of SQSTM1.
SQSTM1 agonists rescue autophagic activities from suppression by S. Typhimurium
To characterize the mode of action of SQSTM1 agonists, we assessed their activities to induce degradative flux via SQSTM1-dependent selective autophagy. Immunoblotting analyses showed that YTK-A76, YT-6-2, YOK-1204, YTK-2205 and YOK-1109 enhanced the synthesis and lipidation of LC3 via non-canonical pathway (, S3A–S3C) associated with the increases in LC3+ autophagic membranes, most of which colocalized with SQSTM1+ puncta ( and S3D). Cells treated with SQSTM1 agonists produced excessive lipidated LC3 which was attributed to the activation of autophagic flux (). As an alternative assay, we also monitored the ratio of autophagosomes and autolysosomes in the macrophage BMDMs using a retrovirus expressing the mCherry-EGFP-LC3B fusion. The treatment of SQSTM1 agonists markedly increased in the number of autolysosomes (mCherry+ EGFP−, red) (Figure S3E). When the cells were co-treated with SQSTM1 agonists and bafilomycin A1, autophagosomes (mCherry+ EGFP+, yellow) failed to turn into autolysosomes (Figure S3E). These results demonstrate that SQSTM1 agonists enhance the degradative flux of autophagic cargoes.
Figure 3. SQSTM1 agonists rescue autophagic activities from suppression by S. Typhimurium. (A) HeLa cells were treated with SQSTM1 agonists (YTK-A76, YT-6-2, YOK-1204, YTK-2205 and YOK-1109) at indicated concentrations for 6 h and lipidation of LC3 was analyzed by immunoblotting assay. (B) HeLa cells were treated with p62 agonists at 5 μM for 6 h and immunostained with SQSTM1 and LC3 antibodies. Scale bar: 10 μm. (C) HeLa cells were treated with 5 μM YTK-A76 alone or with 20 mM NH4Cl for 6 h for autophagy flux analysis. (D) HeLa cells were infected with S. Typhimurium at MOI 10 and SQSTM1 agonist was treated for 6 h and LC3 lipidation analyzed by immunoblotting. (E) BMDMs were infected with S. Typhimurium MOI of 10 and YTK-A76 were treated dose dependently at indicated concentrations for 6 h. (F) S. Typhimurium-infected HeLa cells were treated with 10 μM YTK-A76 alone or with 20 mM NH4Cl for autophagy flux analysis. (G) Uninfected and S. Typhimurium- (MOI 10) infected HeLa cells were treated with rapamycin at indicated concentrations for 6 h. NT, non-treated.
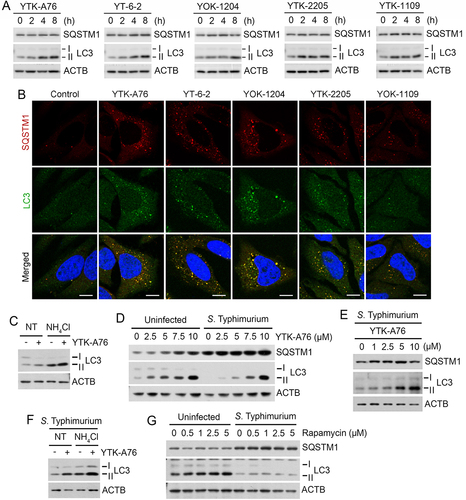
Next, we determined whether SQSTM1 agonists are capable to rescue autophagic flux from suppression by S. Typhimurium. Indeed, SQSTM1 agonists restored the synthesis and lipidation of LC3 to normal levels in HeLa cells () and BMDMs () infected with S. Typhimurium. Autophagic flux assays using NH4Cl showed that the LC3 induction is attributed to the activation of autophagic flux (). In sharp contrast, rapamycin, an inducer of MTOR (mammalian target of rapamycin)-modulated core autophagic pathways, exhibited no such efficacy (). These results suggest that SQSTM1 agonists exert antimicrobial efficacy via a non-canonical pathway and independent of rapamycin-modulated bulk autophagy.
SQSTM1 agonists exert antimicrobial efficacy by binding to the ZZ domain of SQSTM1
To further validate the selectivity of SQSTM1 agonists in therapeutic efficacy, we examined the activity of autophagy with ATB1095. Indeed, ATB1095 exhibited no detectible activity to induce the synthesis and lipidation of LC3 (Figure S4A). Moreover, CFU assays showed that ATB1095 and another negative control compound, ATB1094, failed to inhibit the infectivity of S. Typhimurium in RAW264.7 cells (Figure S2K). These results verify the chemical selectivity of SQSTM1 agonists in therapeutic efficacy.
Next, we determined the binding specificity of YTK-A76 to the ZZ domain of SQSTM1. CFU assay with S. Typhimurium showed that the SQSTM1 agonist lost their efficacy when SQSTM1 was depleted using siRNA (). The SQSTM1 agonist regained antimicrobial efficacy when SQSTM1 knockdown HeLa cells were transfected to express wild-type SQSTM1 but not mutant SQSTM1 lacking ZZ domain that showed comparable transfection efficiency ( and S4B). Furthermore, the activity of the SQSTM1 agonist to induce autophagosome biogenesis was dependent on the ZZ domain of SQSTM1 (Figure S4C).
Figure 4. SQSTM1 agonists exert antimicrobial efficacy by binding to the ZZ domain of SQSTM1. Scale bars: 10 μm. (A) Graph of CFU indicating intracellular S. Typhimurium for validation of SQSTM1-dependent xenophagy in HeLa cells treated with SQSTM1 agonist 10 μM for 5 h. HeLa cells were transfected with control or SQSTM1 targeting siRNA for 48 h before infection. (B) HeLa cells were knockdown by 3’UTR siSQSTM1 for 48 h and SQSTM1-EGFP or SQSTM1-ZZΔ-EGFP was rescued for 24 h. The cells were infected with S. Typhimurium and treated with or without 10 μM YTK-A76 for 5 h and harvested for CFU assay. (C) Colocalization analysis of SQSTM1 (red) and S. Typhimurium (cytosolic DAPI) by using immunostaining. Representative images of S. Typhimurium-infected HeLa cells treated with YTK-A76 for 6 h. (D) 3’UTR SQSTM1 knockdown HeLa cells were transfected with SQSTM1-EGFP or SQSTM1-ZZΔ-EGFP and the cells were infected with S. typhimurium and incubated with or without YTK-A76 10 μM for 5 h. (E) 3’UTR SQSTM1 knockdown HeLa cells were rescued with SQSTM1-MYC or SQSTM1-UBAΔ-MYC or SQSTM1-PB1Δ-MYC and YTK-A76 was treated for 5 h. (F and G) HeLa cells were transfected with siControl or siUBB followed by S. Typhimurium infection (MOI 10). After 30 min of S. Typhimurium infection, cells were treated with or without YTK-A76 at 10 μM for 5 h. Immunofluorescence analyses (F) and CFU assays (G) were performed.
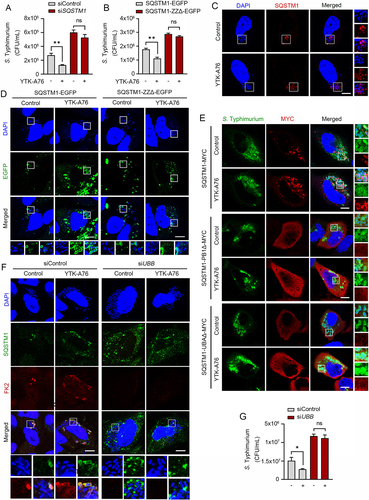
We also tested whether SQSTM1 agonists induced the recruitment of SQSTM1 to S. Typhimurium using colocalization assays. Immunostaining analyses showed that colocalization of SQSTM1 with DAPI-positive S. Typhimurium markedly increased when cells were treated with SQSTM1 agonists ( and S4D). To test whether the activity to recruit SQSTM1 to the bacterial surface is dependent on the SQSTM1 ZZ domain, HeLa cells were depleted of SQSTM1 using siRNA to the 3’-untranslated region (3’-UTR) and subsequently engineered to express SQSTM1-EGFP or SQSTM1-ZZΔ-EGFP. When the cells were treated with YTK-A76, the colocalization between SQSTM1 and bacteria was ~70% with SQSTM1-EGFP and ~30% with SQSTM1-ZZΔ-EGFP ( and S4E). These results demonstrate that SQSTM1 agonists induce the recruitment of SQSTM1 to the membrane of intracellular S. Typhimurium through their binding to the SQSTM1 ZZ domain.
It is known that SQSTM1 undergoes self-polymerization via the PB1 domain and interacts with ubiquitin chains on cargoes via the UBA domain [Citation60,Citation61]. To determine whether SQSTM1 oligomerization is required for the recruitment of SQSTM1 to ubiquitinated bacterial membranes, SQSTM1 was depleted in HeLa cells using siRNA targeting its 3’-UTR, followed by transient expression of wild type SQSTM1-MYC and SQSTM1-PB1Δ-MYC. Immunostaining analyses of the cells infected with S. Typhimurium showed that YTK-A76 induced the association of wild-type SQSTM1, but not SQSTM1-PB1Δ-MYC, with bacteria (). Likewise, mutant SQSTM1 lacking the UBA domain (SQSTM1-UBAΔ-MYC) failed to associate with bacteria (). Consistently, when ubiquitin was depleted using siRNA targeting the UBB mRNA, YTK-A76 almost lost its ability to accelerate the SQSTM1 recruitment on the bacteria (). This inability of SQSTM1 to associate with bacteria in both the absence and presence of SQSTM1 agonists was attributed to the loss of antimicrobial efficacy as determined by CFU assays (). These results suggest that SQSTM1 agonists facilitate the recruitment of SQSTM1 to bacteria through self-polymerization via PB1 domain and the interaction with ubiquitin chains via UBA domain.
SQSTM1 agonists induce xenophagy of S. Typhimurium by facilitating the target of the pathogens to the autophagosome
To determine whether SQSTM1 agonists act as xenophagy-inducing drugs, we characterized the autophagic flux of host cells infected with S. Typhimurium (). Immunostaining analyses of cells treated with SQSTM1 agonists revealed that the majority of SQSTM1-positive bacteria were also positive for LC3-positive autophagic membranes (Figure S1B). The colocalization of SQSTM1+ LC3+ autophagic membranes with DAPI-positive S. Typhimurium markedly increased by SQSTM1 agonists (). Moreover, the ability of SQSTM1 agonists to eradicate bacteria was almost completely blocked by the lysosomal inhibitor NH4Cl (). Consistently, knockdown of either ATG5 or LC3B abolished the activity of SQSTM1 agonists to induce degradation of degradation of intracellular bacteria (). The indispensable role of autophagy was further confirmed by the finding that the antimicrobial efficacy of SQSTM1 agonists were not significantly impaired when proteolytic flux via the UPS was inhibited by using the proteasome inhibitor MG132 (Figure S5A and S5B). Next, to obtain the decisive evidence for xenophagy, we performed transmission electron microscopy (TEM) in RAW264.7 cells. A significantly increased portion of bacteria were sequestered within autophagosomes in cells treated with YTK-A76 ( and S5C). These results demonstrate that SQSTM1 agonists induce the targeting of intracellular bacteria to autophagic membranes, leading to lysosomal degradation.
Figure 5. SQSTM1 agonists induce xenophagy of S. Typhimurium by facilitating the target of the pathogens to the autophagosome. (A) Colocalization analysis of LC3 (green), SQSTM1 (red) and S. Typhimurium (cytosolic DAPI) by immunofluorescence analyses. Representative images (left panel) of S. Typhimurium-infected HeLa cells treated with 10 μM YTK-A76 for 6 h. Quantitative graph represents the average percentage of S. Typhimurium colocalized with SQSTM1+ LC3+ puncta per cells (n = 15). Scale bar: 10 μm. (B) Graph of CFU indicating intracellular S. Typhimurium in HeLa cells treated with SQSTM1 agonist in the presence or absence of 20 mM NH4Cl. (C) Graph of CFU indicating intracellular S. Typhimurium in HeLa cells treated with SQSTM1 agonist for validation of autophagic degradation of S. Typhimurium. HeLa cells were transfected with control, ATG5 or LC3B targeting siRNA for 48 h before infection. The cells were treated with or without YTK-A76 10 μM for 5 h. (D) Representative TEM (transmission electron microscopy) images of RAW264.7 cells treated with or without YTK-A76 at 10 μM for 4 h in the presence of intracellular S. Typhimurium (yellow boxes were magnified). (E) RAW264.7 cells were infected with S. Typhimurium (MOI 10) for 30 min and rapamycin was treated at indicated concentrations for 6 h. (F) S. Typhimurium- (MOI 10) infected RAW264.7 cells treated with rapamycin at 5 μM for indicated time points and the number of intracellular bacteria was measured by CFU analyses. (G) Colocalization analysis of S. Typhimurium (green) and SQSTM1 (red) in HeLa cells with presence or absence of 10 μM rapamycin for 6 h. Scale bar: 5 μm. (H) S. Typhimurium-infected RAW264.7 cells treated with resveratrol at indicated concentrations for 6 h and the number of intracellular bacteria was measured by CFU assay.
It is known that MTOR is a master regulator of various signaling pathways including bulk autophagy, the cell cycle, immune responses, and metabolism [Citation62,Citation63]. We therefore tested whether pharmaceutical activation of autophagy using rapamycin also inhibits intracellular bacterial growth. In sharp contrast to SQSTM1 agonists, rapamycin exhibited no antimicrobial effect ( and S5D). Furthermore, unlike SQSTM1 agonists, rapamycin failed to enhance SQSTM1 recruitment of intracellular bacteria and bacterial targeting to autophagosomes (). Resveratrol, a SIRT1 activator, also showed no antimicrobial activity against S. Typhimurium in RAW264.7 cells at 10–100 μM (). These results suggest that SQSTM1 agonists exert antimicrobial efficacy via selective autophagy and are independent of rapamycin-modulated canonical autophagic pathways.
SQSTM1 agonists enhance host innate immunity against Mtb and other pathogens via SQSTM1-mediated xenophagy
Although xenophagy has been implicated in the lysosomal degradation of Mtb, it has not been fully understood about the underlying mechanisms and xenophagy-inducting reagents against Mtb [Citation14,Citation64]. To investigate whether the SQSTM1 agonists have anti-mycobacterial activities, we treated Mtb-infected BMDMs with YTK-A76, YT-6-2, YTK-2205, and YOK-1109. CFU assays showed that the growth rate of Mtb was dramatically inhibited at 5–10 μM ( and S6A). Similarly, YTK-2205 decreased the intracellular Mtb growth in J774A.1 cells (Figure S6B). Silencing of SQSTM1 in BMDMs significantly abrogated the antimicrobial response induced by YTK-2205 during Mtb infection (). During these experiments, the viability of both host cells and bacterial was not significantly influenced by SQSTM1 agonists at the concentrations used in this study (Figure S6C,D). Likewise, no difference was observed in the entry, i.e., phagocytosis of the Mtb in the absence and presence of SQSTM1 agonists (Figure S6E). These results demonstrate the efficacy of SQSTM1 agonists to inhibit the infectivity of Mtb.
Figure 6. SQSTM1 agonists enhance host innate immunity against Mtb and other pathogens via SQSTM1-mediated xenophagy. (A) Intracellular survival of Mtb assessed in BMDMs treated with YTK-A76 (1, 5, or 10 µM) and YTK-2205 (1, 5, or 10 µM) for 3 days. (B) BMDMs were transduced with lentivirus expressing shNS or shSqstm1, and then treated with YTK-2205 (5 µM) for 3 days. Intracellular survival of Mtb measured by CFU assay. (C) BMDMs were infected with Mtb-ERFP (MOI of 5) for 2 h and then cells were treated with YTK-2205, YTK-A76, or YOK-1109 at 5 μM for 18 h. Colocalization analysis of SQSTM1 (green) and Mtb-ERFP by immunofluorescence analysis. Scale bar: 5 µm. (D) BMDMs were infected with Mtb-ERFP (MOI of 5) and treated with YTK-2205 (5 μM). Colocalization analysis of LC3 (green) and Mtb-ERFP in BMDMs by using immunostaining analysis. Scale bar: 8 µm (left panel). Quantitative graph represents the average percentage of Mtb-ERFP colocalized with LC3 puncta per cells (right panel; n = 11). (E) Representative TEM images of BMDMs treated with YTK-2205 (5 μM) under uninfected or Mtb-infected conditions. Scale bars: 2 µm and 1 µm (left panel). The quantitative graph represents the proportion of Mtb in compartment of autophagosomes or phagosomes in BMDMs (right panel). (F) RAW264.7 cells infected with E. coli for 30 min followed by incubation with SQSTM1 agonist at 10 μM for 6 h. (G) J774A.1 infected with S. pyogenes and treated with SQSTM1 agonist at 10 μM for 6 h. The number of intracellular bacteria was measured by CFU assay.
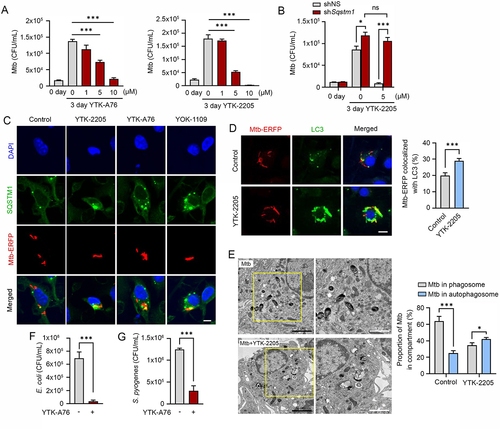
Next, we examined whether SQSTM1 agonists induce the autophagic targeting of Mtb. Co-immunostaining analyses showed that SQSTM1 agonists induced the colocalization of SQSTM1 and Mtb ( and S6F). Moreover, YTK-2205 treatment of Mtb-infected BMDMs led to a significant increase of colocalization between Mtb phagosomes and autophagosomes as compared with the control (). Also, the level of LC3B was significantly upregulated in Mtb-infected BMDMs by YTK-2205 treatment (Figure S6G). Treatment of Mtb-infected BMDMs with YTK-2205 significantly upregulated the colocalization between Mtb phagosomes and lysosomes (Figure S6H), suggesting that SQSTM1 agonists enhance targeting of Mtb to autophagosomes that fuse with lysosomes for degradation. Furthermore, whereas mycobacteria were mostly detected within phagosomal structures in control cells, a significant portion of Mtb was sequestered in morphologically heterogeneous double-membrane vesicles that appeared to be autophagosomes in YTK-2205-treated BMDMs (). Collectively, these data strongly suggest that SQSTM1 agonist-induced xenophagic flux is required for antimicrobial responses against Mtb infection.
Next, we also determined whether SQSTM1 agonists have antimicrobial efficacy against other bacteria including Gram-negative E. coli and the Gram-positive S. pyogenes. CFU assays (MOI of 10) showed that SQSTM1 agonists efficiently inhibited the growth of both strains (). These results suggest that SQSTM1 has the potential as a drug target for a broad range of pathogenic bacteria.
SQSTM1 agonists enhance xenophagy mediated host defense against pathogens in mice
To validate the efficacy of SQSTM1 agonists in xenophagy, we orally infected C57BL/6 male mice with S. Typhimurium (106 per mice), followed by i.p. injection of 20 mg/kg YTK-A76 or YTK-2205 once daily for 6 days. On day 7, the liver and spleen were harvested, and their extracts were used for CFU assays. When compared with the vehicle-treated group, mice injected with YTK-2205 showed approximately a 100-fold reduction in the number of bacteria (). Although the relative efficacy was weaker, a similar inhibition of bacterial infection was observed with YTK-A76 (). Histological examination of H&E-stained paraffin sections from livers revealed inflammation-associated damaged tissues in control mice. Such damages were barely observed in mice injected with YTK-2205 (). These results suggest that SQSTM1 agonists inhibit the infectivity of S. Typhimurium and reduce inflammation caused by bacterial infection.
Figure 7. The SQSTM1 agonists enhance xenophagy-mediated host defense against pathogens in mice. (A) Mice were injected p.o. with 1 × 10⁶ S. Typhimurium in PBS, followed by administration of SQSTM1 agonist (20 mg/kg) by i.p. once daily (n = 4 per group). Bacterial burdens in the liver (upper panel) and spleen (lower panel) were analyzed by CFU assay after 6 dpi. (B) Representative H&E staining images of liver from S. Typhimurium infection model injected i.p. with vehicle (Control) or 20 mg/kg YTK-2205. (C) Bacterial burdens in mouse lung tissues. Mice were infected i.n. with Mtb (5 × 10⁴ CFU). After infection, mice were treated with vehicle, YTK-2205 (i.p. 10 mg/kg; n = 7 per group, left), or YT-6-2 (i.p. 20 mg/kg; n = 5 per group, right). (D) Representative H&E-stained images in lung tissue of mice treated as in c. Scale bars: 2000 µm and 100 µm. (left panel). Quantitative graph represents the average percentage of inflamed area of tissue section (right panel). (E and F) Mice (n = 4 per group) were infected i.n. with BCG (1 × 10⁷ CFU), and treated with vehicle or YTK-2205 (i.p. 20 mg/kg) at 3–6 dpi. (E) Bacterial loads determined by CFU analysis. (F) H&E staining of the BCG-infected lung tissue and representative images are shown. Scale bars: 2000 µm and 100 µm (left panel). Quantitative graph represents the average percentage of inflamed area of tissue section (right panel). (G) Bacterial loads in mouse lung tissues. Mice (n = 4 per group) were infected i.n. with MDR-Mtb (5 × 10³ CFU), and treated with vehicle or YT-6-2 (i.p. 20 mg/kg).
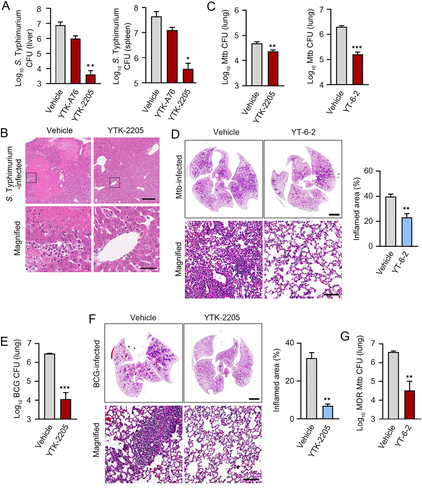
Next, we investigated whether administration of YTK-2205 or YT-6-2 promotes host antimicrobial defense during Mtb infection in mice. We infected mice with Mtb intranasally (5 × 10⁴ CFU), followed by i.p. injection of 10 mg/kg YTK-2205 per 2 days (total 5 injections; for left) or 20 mg/kg YT-6-2 thrice per week (total 11 injections; for right). Notably, CFU assays of lung extracts showed that the bacterial burden was significantly reduced in mice treated with YTK-2205 or YT-6-2 (). Histopathological analyses also revealed significant decreases in the area of lung inflammation in mice treated with YT-6-2 (). Similarly, we infected mice with Bacillus Calmette–Guérin (BCG) (1 × 10⁷ CFU) and administered YTK-2205 by i.p. injection. Treatment with YTK-2205 resulted in reduced BCG burdens in the lungs () and the number of granulomatous lung lesions and inflamed areas decreased (). Additionally, to explore whether SQSTM1 agonist amplified the host defense against multidrug-resistant (MDR) strain of Mtb, mice were infected with MDR-Mtb (5 × 10³ CFU) and then treated with YT-6-2. Relative to a vehicle, injection of YT-6-2 significantly reduced the MDR-Mtb growth in the lungs (). These results demonstrate the efficacy of SQSTM1 agonists to decrease bacterial load in the lungs and pulmonary inflammation in mice.
The SQSTM1 agonists inhibit the production of proinflammatory mediators in vitro and in vivo
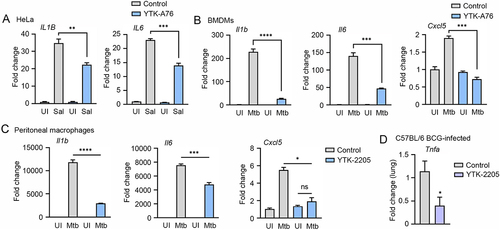
Host defense to bacterial infection depends on the coordinated responses of inflammatory responses induced by innate and adaptive immune cells [Citation65,Citation66]. Because SQSTM1 agonists reduced tissue pathology and enhanced host immune responses in S. Typhimurium – and Mtb-infected mice, we sought to evaluate the possible beneficial effects of the drugs on chronic inflammation associated with S. Typhimurium and Mtb disease. We therefore determined whether SQSTM1 agonists have efficacy to reduce the excessive production of cytokines in HeLa cells infected with S. Typhimurium. RT-qPCR analyses showed that YTK-A76 efficiently counteracted the mRNA induction of IL1B (interleukin 1 beta) and IL6 (). Furthermore, to examine the role of SQSTM1 agonists in the modulation of inflammatory responses during Mtb infection, BMDMs infected with Mtb were treated with YTK-A76. The SQSTM1 agonists efficiently suppressed Mtb-induced upregulation of pro-inflammatory cytokines (Il6 and Il1b) and chemokine (Cxcl5) (). Consistently, in peritoneal macrophages (PMs) and BMDMs infected with Mtb, YTK-2205 at 5 μM inhibited Mtb-induced upregulation of the pro-inflammatory cytokines and chemokine ( and S7). Furthermore, BCG-infected mice injected i.p. with YTK-2205 produced a reduced level of tumor necrosis factor alpha (Tnfa) mRNA in the lung tissues compared to those in the vehicle group (). Collectively, these results indicate that SQSTM1 agonists inhibit the expression of inflammatory mediators during pathogenic bacterial infections.
Figure 8. The SQSTM1 agonists inhibit the production of proinflammatory mediators in vitro and in mice. (A) Relative fold change in mRNA level of IL1B and IL6 in HeLa cells treated with or without YTK-A76 under S. Typhimurium infection was analyzed by RT-qPCR. (B and C) BMDMs (B) or peritoneal macrophages (C) were infected with Mtb (MOI of 5) and treated with YTK-A76 (5 µM; B) or YTK-2205 (5 µM; C) for 6 h. Relative fold change in mRNA level of Il1b, Il6, and Cxcl5 was determined using qRT-PCR. (D) Mice were infected i.n. with BCG (1 × 10⁷ CFU), and treated with vehicle or YTK-2205 (i.p. 20 mg/kg) at 3–6 dpi. Relative fold change in mRNA level of Tnfa from lung tissues was measured by qRT-PCR. UI, uninfected; Sal, S. Typhimurium.
Discussion
Selective autophagy mediates the targeting of specific cellular materials such as misfolded proteins and damaged organelles to phagophores for lysosomal degradation [Citation1,Citation2,Citation5,Citation67,Citation68]. Recent studies showed that intracellular viruses and bacteria can be targeted for lysosomal degradation via selective autophagy [Citation8,Citation9,Citation14]. Several chemical modulators of bulk and selective autophagy have been exploited to induce the targeted degradation of bacteria, yet there are no therapeutic agents available whose mode-of-actions are clearly defined with satisfactory efficacy, selectivity, and safety. In this study, we exploited small-molecule agonists to the ZZ domain of SQSTM1 as anti-microbial agents against a broad range of bacteria such as S. Typhimurium, E. coli, and S. pyogenes as well as Mtb. These agonists induced xenophagy during which SQSTM1 was associated with bacterial membranes to recruit LC3 on autophagic membranes, leading to lysosomal degradation. The anti-microbial efficacy of SQSTM1 agonists was demonstrated in vitro and using mouse models of S. Typhimurium and Mtb. Our results identify SQSTM1 as a potential drug target in host-directed therapy against a broad range of pathogenic bacteria including multi-drug resistant strains.
Our earlier work has identified the autophagic receptor SQSTM1 as an N-recognin that recognizes various types of N-degrons such as the Nt-Arg and targets the cargoes carrying N-degrons to autophagic membranes and lysosomes [Citation56,Citation58]. In this study, we developed novel SQSTM1 agonists that exhibit efficacy in xenophagy of various intracellular bacteria in cultured cells as well as mice. The anti-microbial efficacy involved no detectible activity to directly kill bacteria, further supporting the selective role of SQSTM1-mediated autophagy in host innate immunity. Given our earlier results, we speculate that this xenophagy process is driven by N-degron-mediated intramolecular activation of SQSTM1, which involves the exposure of PB1 domain that facilitates SQSTM1 polymerization and LIR domain that interacts with LC3. Consistently, rapamycin, an inducer of MTOR-modulated bulk autophagy exhibited no efficacy in xenophagy of S. Typhimurium, highlighting the specificity of SQSTM1 agonists to induce selective autophagy to target and eradicate intracellular bacteria. One remaining question involves the molecular mechanism by which SQSTM1 is recruited to bacterial membranes. Our previous studies showed that SQSTM1 agonists facilitated the autophagic degradation of protein aggregates as well as the ER along with its luminal contents [Citation59], with differential preference and selectivity depending on the chemical structures. While further investigations are needed to correlate the chemical structures to the intramolecular conformational changes and the spatiotemporal arrangement of SQSTM1 associated with its cargoes, one could speculate that the oligomerization of SQSTM1 may be a common step for various cargo types. Nonetheless, it should be noted that where SQSTM1 oligomers during aggrephagy grow into large aggregates via uncontrolled formation of disulfide bond formation between SQSTM1 [Citation58], SQSTM1 forms oligomers in an organized topology during the ER-phagy [Citation59]. We therefore suggest that SQSTM1 during xenophagy is associated with an unknown receptor(s) on bacterial membrane in a manner similar to that in the ER-phagy. If this were true, another burning question concerns the receptor for SQSTM1 on bacterial membrane. Screening of such bacterial receptors is underway.
Various pathogens have evolved strategies to escape from or inhibit host defense systems including selective autophagy. In this study, we focused on the antimicrobial effects against S. Typhimurium and Mtb, both of which are well-known intracellular pathogens that can be counteracted by interplay between the UPS and xenophagy activation [Citation69–74]. During infection, S. Typhimurium invade into host cells and reside in Salmonella-containing vacuoles (SCVs), which are damaged by the type III secretion systems (T3SSs), allowing the escape and cytosolic exposure of S. Typhimurium [Citation75–77]. By contrast, Mtb is a more successful pathogen that resides within phagosomes and arrests phagosomal maturation [Citation78,Citation79]. Mtb access into the cytosol through Mtb ESX-1 type seven secretion system via disruption of phagosomal membrane contributes to its virulence mechanism [Citation80,Citation81]. Once exposed to the cytosol, both bacteria are sensed and rapidly ubiquitinated to generate a xenophagy signal, leading to the recruitment of cargo receptors such as SQSTM1, OPTN, and CALCOCO2 [Citation73,Citation74,Citation82–84]. Although multiple anti-Mtb drugs have been developed for decades, it remains challenging to overcome the issues of antibiotic resistance for therapeutics against Mtb infection. In this study, we show that SQSTM1 agonists enhances the ability of host cells to recognize and target cytosolic Mtb to autophagic membranes. Moreover, these xenophagy inducers did not activate inflammatory immune responses, but suppressed several pro-inflammatory cytokines, such as IL1B/IL-1β and TNF/TNF-α. Such an activity to downregulate proinflammatory responses may represent to the function of selective autophagy as a regulator of excessive inflammatory responses (). Importantly, we found the antimicrobial effects of SQSTM1 agonists upon MDR-Mtb infection in vivo, highlighting the potential use of SQSTM1 agonists as host-directed therapeutics against drug-resistant TB. In addition, SQSTM1 agonists were effective against infection with BCG, which lacks genes encoding ESX-1 to promote cytosolic translocation and xenophagy [Citation73,Citation85]. Although one remaining question concerns whether SQSTM1 agonists facilitates the targeting of phagocytosed or exposed Mtb in the cytosol, our results suggest that SQSTM1-dependent xenophagy may provide a therapeutic strategy different from the currently used one.
As multidrug resistance of pathogenic bacteria is rapidly rising, it is increasingly urgent to develop novel strategies fundamentally different from traditional antibiotics. Recent studies explored several anti-microbial strategies such as phage therapy, vaccines, antibodies, probiotics, antimicrobial peptides, and host-directed therapy [Citation38–41]. Host-directed therapy aims to enhance host defense mechanisms or modulate excessive inflammation [Citation42], such as autophagy. Several chemical modulators of autophagy have been used to induce targeted degradation of intracellular bacteria, including rapamycin, metformin, resveratrol, AR-12, and D61 [Citation28,Citation86]. These therapeutic approaches target AMP-activated protein kinase activation, vitamin D receptor signaling, innate immune activation, and sirtuin 1 pathway [Citation19,Citation87,Citation88]. Despite rather extensive studies, there are no generally applicable therapeutic strategies whose mode-of-actions are clearly defined with satisfactory efficacy and safety. Our results show that the chemical activation of SQSTM1-dependent selective autophagy is generally applicable for various bacterial strains. It should be noted that whereas the traditional antibiotics strictly depend on molecular interactions, the mode-of-action of SQSTM1-dependent xenophagy involves the recognition of (universally conserved) ubiquitin chains on bacterial membranes by SQSTM1, which in turn recruits autophagic membranes to the site of degradation. Therefore, in principle, SQSTM1 may be a potential drug target in host-directed therapy against a broad range of multi-drug resistant bacteria. The development of xenophagy-inducing drugs is under way.
Materials and methods
Cell culture
RAW264.7, J774A.1, THP-1, and HCT116 cells were purchased from the Korean Cell Line Bank (40071, 40067, 40202, 10247). CCL2 HeLa cells were purchased from the American Type Culture Collection (ATCC, CCL-2). RAW264.7, J774A.1, and THP-1 cells were cultured in Rosewell Park Memorial Institue (RPMI) medium (Gibco, 22400–089). HeLa cells were cultured in Dulbecco’s Modified Eagle’s Medium (DMEM; Gibco,11995–065). HCT116 cells were cultured in McCoy’s 5a Medium (GIBCO, 16600). All of the media were supplemented with 10% FBS and 100 units/mL penicillin-streptomycin. Primary BMDMs isolated from C57BL/6 mice and cultured in DMEM. BMDMs were differentiated for 3–5 days in the presence of CSF2/M-CSF (colony stimulating factor 2; R&D Systems, 416-ML). For the preparation of PMs, each mouse was injected (i.p.) with 1 ml of 3% thioglycolate (Sigma-Aldrich, T0632) and after 3 days the peritoneal fluid was collected in ice cold phosphate-buffered saline (PBS; 137 mM NaCl, 2.7 mM KCl, 10 mM Na2HPO4, 1.8 mM KH2PO4, pH 7.4) containing 3% FBS. The collected cell suspension was centrifuged and the cells were counted. To generate SQSTM1-knockout HeLa cells, oligos were synthesized and inserted into the px330-puro vector (Addgene, 110403; deposited by Sandra Martha Gomes Dias) using a published protocol to generate gRNA with hCas9 protein [Citation89]. gRNA sequences were designed using an online program provided at http://chopchop.cbu.uib.no/. gRNA sequences were as follows: SQSTM1 – TTGTAGCGGGTTCCTACCAC(-). HeLa cells were transfected with the targeting plasmid using Lipofectamine 2000 reagent according to the manufacturer’s instructions (Invitrogen Life Technologies, 11668019). And then clones propagated from single cells were chosen. Immunoblotting and genomic DNA sequencing were used to confirm the depletion of target genes. All the cell lines were determined to be negative in a mycoplasma test using a MycoAlert detection kit (Lonza, LT07-118). All the culture plates and the cell lines were maintained at 37°C and 5% CO2 in a humidified incubator.
Mice
C57BL/6 mice (sex-matched) aged 6–8 weeks with a wild-type (WT) background were purchased from Samtako Bio Korea (Gyeonggi-do, Korea). Mice were maintained under specific pathogen-free conditions. All mice experiments and maintenance were done in adherence to guidelines set forth by the Institutional Animal Care and Use Committee, Seoul National University (SNU-190531-2-1) and Chungnam National University School of Medicine (202009A-CNU-155, CNUH-A0044-1), and the Korean Food and Drug Administration. For the Salmonella model, C57BL/6 mice aged 8 weeks were given 1 × 10⁶ CFU of S. Typhimurium and SQSTM1 agonist (20 mg/kg) by i.p. injection. The mice were given SQSTM1 agonist (20 mg/kg) by i.p. daily for 6 days and at which point they were killed, the liver and spleen removed, homogenized, and resuspended in PBS, followed by plating on Luria Broth agar plates. The plates were incubated overnight at 37°C and colonies were counted. For the BCG model, C57BL/6 mice aged 8 weeks were given 1 × 10⁷ CFU of BCG intranasally and the SQSTM1 agonist (20 mg/kg) by i.p. injection. After infection, the mice were i.p. injected with YTK-2205 at 3–6 days post-infection (dpi) and sacrificed at 7 dpi. For the Mtb model, C57BL/6 mice aged 8 weeks were given 5 × 10⁴ CFU of Mtb by intranasal injection and the SQSTM1 agonist (10–20 mg/kg) by i.p. injection. After infection, the mice were i.p. injected with YTK-2205 q.o.d. 5 times and sacrificed at day 10 dpi and YT-6-2 t.i.w. for 28 days. For MDR-TB infection model, C57BL/6 mice aged 8 weeks were given 5 × 10³ CFU of MDR-Mtb by intranasal injection and the YT-6-2 (20 mg/kg) by i.p. injection. After infection, the mice were i.p. injected with YT-6-2 t.i.w. for 28 days and lung tissues were collected, homogenized and re-suspended in PBS and plated on 7 H10 agar.
Antibodies
Mouse monoclonal anti-SQSTM1/p62 (Abcam, ab56416; 1:40,000), rabbit polyclonal anti-OPTN/optineurin (Abcam, ab23666; 1:1,000), mouse monoclonal anti-FK2 specific to Ub-conjugated proteins (Enzo Life Science, BML-PW8810; 1:5,000), rabbit polyclonal anti-LC3 (Sigma-Aldrich, L7543; 1:40,000), rabbit polyclonal anti-LC3A/B (Medical & Biological Laboratories International, PM036; 1:500), rabbit polyclonal anti-ACTB/β-actin (BioWorld, AP0060; 1:10,000), rabbit polyclonal anti-Salmonella (Abcam, ab35156; 1:1000), rat monoclonal anti-LAMP1 (Santa Cruz Biotechnology, sc-19992; 1:400), rabbit polyclonal anti-CALCOCO2/NDP52 (Abcam, ab68588; 1:1,000), mosue monoclonal anti-NBR1 (Abcam, ab55474; 1:1,000), rabbit monoclonal anti-TAX1BP1 (Cell Signaling Technology, 5105S; 1:1,000) and rabbit polyclonal anti-MYC (Santa Cruz Biotechnology, sc-764; 1:400). The following secondary antibodies are Alexa fluor 488 goat anti-rabbit IgG (Invitrogen, A11029; 1:500), Texas red goat anti-mouse IgG (Invitrogen, T6390; 1:500), anti-rabbit IgG-HRP (Cell Signaling Technology, 7074; 1:10,000), and anti-mouse IgG-HRP (Cell Signaling Technology, 7076; 1:10,000).
Plasmids and reagents
The recombinant SQSTM1 plasmids were constructed as previously described (Cha-Molstad et al., 2017). PCR amplification of a full-length human SQSTM1 cDNA fragment from the hMU012675 clone (21C Frontier Human Gene Bank) was followed by subcloning into the pcDNA3.1/MYC-His plasmid (Thermo Fisher Scientific, V80020) at EcoRI/XhoI sites. The DPB1 and DUBA domain SQSTM1 mutants were generated identically. Full-length SQSTM1-EGFP and the ZZ domain mutant SQSTM1-EGFP plasmids were subcloned as described above but into the pEGFP-N1 plasmid (Clontech,6085–1) at EcoRI/XhoI sites. These plasmids were transiently transfected with Lipofectamine 2000 reagent following the manufacturer’s instructions. Normal goat serum (ab7481) was obtained from Abcam. Hoechst 33,342 (H21492) was obtained from Invitrogen. 4′,6-Diamidino-2-phenylindole dihydrochloride (DAPI; D8417) was obtained from Sigma-Aldrich. Vectashield antifade mounting medium (H1000) was from the Vector lab. Other reagents used in this study were bafilomycin A1 (Santa Cruz Biotechnology, SC-201550A), and NH4Cl (Sigma-Aldrich, A9434).
Bacterial strains and culture
S. Typhimurium was kindly provided by Eun Jin Lee (Korean University, Seoul, Korea). S. Typhimurium were cultured at 37°C in LB broth with shaking. For the analysis of replication rates of S. Typhimurium, the absorbance of bacterial suspension at 600 nm wavelength were measured. Mtb H37Rv was kindly provided by Dr. R. L. Friedman (University of Arizona, Tucson, AZ, USA). M. bovis BCG and MDR-Mtb (KMRC 00116–00150) were obtained from the Korean Institute of Tuberculosis (Osong, Korea). Mtb and BCG were grown at 37°C with shaking in Middlebrook 7H9 broth (Difco, 271310) supplemented with 0.5% glycerol, 0.05% Tween-80 (Sigma-Aldrich, P1754), and oleic albumin dextrose catalase (OADC; BD Biosciences, 212240). For Mtb-expressing enhanced red fluorescent protein (ERFP) strains were grown in Middlebrook 7H9 medium (Difco, 271310) supplemented with OADC and 50 µg/ml kanamycin (Sigma-Aldrich, 60615). All mycobacterial suspensions were aliquoted and stored at −80°C. For all experiments, mid-log-phase bacteria (absorbance 0.4) were used. Representative vials were thawed and CFUs enumerated by serially diluting and plating on Middlebrook 7H10 agar (Difco, 262710). E.coli (KCCM 21052) and S. pyogenes (KCCM 11814) were obtained from the Korean Culture Center of Microorganisms (Seoul, Korea).
Bacterial infection
S. Typhimurium were inoculated at 2 mL LB broth and cultured at 37°C overnight. A suspension of S. Typhimurium (100 µl) was subcultured in 10 mL LB for 3 h. The absorbance of bacterial suspension was measured and diluted suspension of S. Typhimurium was inoculated to cultured cells with indicated MOI for 30 min. After the incubation the cells were washed with Dulbecco’s Phosphate-Buffered Saline (DPBS; Thermo Fisher Scientific, 14,040,133) and the cells were treated with media containing 100 µg/ml gentamycin (Thermo Fisher Scientific, 15,710,064) for 1 h and the media was exchanged with fresh medium including 10 µg/ml gentamycin. Cells were infected with indicated MOI of Mtb for 2 h. Extracellular bacteria were washed with PBS and infected cells were further cultured in fresh medium for the indicated time. For in vivo infection, frozen Mtb or BCG were thawed and inoculated intranasally (Mtb; 5 × 10⁴ CFU/mice, BCG; 1 × 10⁷ CFU/mice, MDR-Mtb; 5 × 10³ CFU/mice). To measure the bacterial burden, lungs were harvested after sacrificing the mice after 10 days of Mtb infection, 7 days of BCG, and 10 or 28 days of MDR-Mtb infection. Lungs were homogenized in PBS and serial dilutions of the homogenates were plated in 7H10 agar plates. After 2–3 weeks, colonies were counted.
Mouse Sqstm1 lentiviral short hairpin RNA (shRNA) production and transduction
To produce shRNA, packing plasmids (pRSVRev, pMD2.VSV-G, and pMDLg/pRRE purchased from Addgene, 12253, 12259, 12251; deposited by Didier Trono) and pLKO.1-based target shRNA plasmids (mSqstm1, TRCN0000238133; purchased from Sigma-Aldrich, SHC016) were cotransfected into HEK293T cells using Lipofectamine 3000 (Invitrogen,L3000-015). Then, 48 h later, the virus-containing supernatant was collected and filtered. For lentivirus infection, BMDMs in DMEM containing 10% FBS were seeded into 24-well plates and infected with lentiviral vectors (MOI of 10), according to the manufacturer’s protocol. After 3 days, the samples were analyzed for transduction efficiency.
Generation of a tandem LC3B (mCherry-EGFP-LC3B) retroviral vector
Phoenix amphotropic cells (ATCC, CRL-3213) were seeded and co-transfected with 0.75 μg of packaging plasmid pCL-Eco (Addgene, 12371; deposited by Inder Verma), 0.25 μg of envelope plasmid pMD2.G (Addgene, 12259; deposited by Didier Trono), and 1 μg of pBABE puro mCherry-EGFP-LC3B plasmid (Addgene, 22418; deposited by Jayanta Debnath) using Lipofectamine 2000. After 6 h, the medium was replaced with a fresh culture medium. The retrovirus-containing medium was harvested at 24 h post-transfection and filtered through a 0.45-μm syringe filter.
RNA extraction and qRT-PCR analysis
Total RNA from homogenized lung or cell was isolated using TRIzol reagent (Thermo Fisher Scientific, 15596–026), following the manufacturer’s instructions. After RNA quantification, cDNA was synthesized by reverse transcription using the reverse transcriptase premix (Elpis Biotech, EBT-1515). Real-time PCR (qRT-PCR) was performed using SYBR green master mix (Qiagen, 330503) and primers for indicated genes, in Rotor-Gene Q 2plex system (Qiagen). Data were analyzed using 2ΔΔ threshold cycle (Ct) method where mouse Gapdh was used for normalization. Data are expressed as relative fold changes. Primer sequences (human) are as follows: SQSTM1 forward: 5’-CCTCTGGGCATTGAAGTTG-3’, reverse: 5’- TATCCGACTCCATCTGTTCCTC-3’; NBR1 forward: 5’-GGAAGCAGAAGAAGACCTGAGTG-3’, reverse: 5’-CCAGAGTCTGTGAGGTCGTGAG-3’; OPTN forward: 5’-AGCAAACCATTGCCAAGC-3’, reverse: 5’-TTTCAGCATGAAAATCAGAACAG-3’; CALCOCO2 forward: 5’-GCCCATTGACCTAAACAACAAA-3’, reverse: 5’-CACACCATCCTCATCCACATAG-3’; TAX1BP1 forward: 5’-ACAAAGGCCACCTGTCAGAG-3’, reverse: 5’-GGCACATTCTCATCTTCTTTGC-3’. Primer sequences for mouse genes are as follows: Il1b forward: 5’-TGACGGACCCCAAAAGATGA-3’, reverse: 5’-AAAGACACAGGTAGCTGCCA-3’; Il6 forward: 5’-ACAAAGCCAGAGTCCTTCAGA-3’, reverse: 5’-TGGTCCTTAGCCACTCCTTC-3’; Cxcl5 forward: 5’-GCACTCGCAGTGGAAAGAAC-3′, reverse: 5′-CGTGGGTGGAGAGAATCAGC-3′; Tnf forward: 5’- CCCACGTCGTAGCAAACCAC-3’, reverse: 5’- GCAGCCTTGTCCCTTGAAGA-3’; Gapdh forward: 5′-TGGCAAAGTGGAGATTGTTGCC-3′, reverse: 5′-AAGATGGTGATGGGCTTCCCG-3′. The mRNA expression level of autophagy related genes was analyzed by using AccuTarget™ qPCR screening kit (Bioneer, SH-0017-10).
Chemical synthesis and analytical data of SQSTM1 agonists
Agonists to the SQSTM1-ZZ domain – YTK-A76, YT-6-2, and YOK-1204, as well as the negative control ligand ATB1095 – were synthesized as follows. YTK-2205 (2-((3,4-diphenethoxybenzyl)amino)ethan-1-ol) and YOK-1109 ((R)-1-(2-((3-(3,4-bis(benzyloxy)phenoxy)-2-hydroxypropyl)amino)ethyl)guanidine) data that support the findings of this study are openly available in World Intellectual Property Organization (WIPO) at https://patentscope.wipo.int/search/en/detail.jsf?docId=WO2019190172 and https://patentscope.wipo.int/search/en/detail.jsf?docId=WO2020022783, patent number WO2019190172 and WO2020022783.
Scheme 1. Synthesis of 2-(2-((3,4-bis(benzyloxy)benzyl)amino)ethoxy)ethan-1-ol (YTK-A76)
Synthesis of 3,4-bis(benzyloxy)benzaldehyde (A2)
To a solution of A1 (0.5 g, 3.62 mmol) in dimethylformamide was added K2CO3 (1.5 g, 10.86 mmol) and (bromomethyl)benzene (0.92 mL, 7.96 mmol) at RT. The mixture was stirred at 60°C for 4 h. The reaction mixture was cooled at room temperature and extracted with ether and water. The organic layer was washed with brine, dried over anhydrous MgSO4, filtered and concentrated. The residue was purified by column chromatography on silica gel to afford A2 (3,4-bis(benzyloxy)benzaldehyde, 1.04 g, 90%). 1 H-NMR (CDCl3, 300 MHz) δ (ppm) 9.81 (s, 1 H), 7.49–7.31 (m, 12 H), 7.04 (d, J = 8.3 Hz, 1 H), 5.27 (s, 2 H), 5.22 (s, 2 H) LCMS; Mass Calcd.: 318.33; MS Found: 319.13 [MS+1].
Synthesis of 2-(2-((3,4-bis(benzyloxy)benzyl)amino)ethoxy)ethan-1-ol (YTK-A76)
A mixture of A2 (20 g, 62.8 mmol) added in MeOH (500 mL) and tetrahydrofuran (200 mL), Then added 2-(2-aminoethoxy)ethanol (13.2 g, 126 mmol) and sodium triacetoxyborohydrid (40 g, 189 mmol) at room temperature. The mixture reaction was stirred overnight at RT. The reaction mixture was quenched by the addition of saturated aqueous NH4Cl (200 mL). The aqueous layer was extracted with ethyl acetate, and concentrated. The crude was added PE and stirred for 1 h, then filtered to give YTK-A76 (2-(2-((3,4-bis(benzyloxy)benzyl)amino)ethoxy)ethan-1-ol, 10 g, 39.1%) as a white solid.
1 H-NMR (CDCl3, 400 MHz) δ (ppm) 9.57 (s, 1 H), 7.48 (d, J = 7.2 Hz, 2 H), 7.27–7.41 (m, 9 H), 6.99–7.02 (m, 1 H), 6.84 (d, J = 8.4 Hz, 1 H), 5.25 (s, 2 H), 5.09 (s, 2 H), 4.06 (s, 1 H), 3.65–3.70 (m, 4 H), 3.46–3.48 (m, 2 H), 2.87 (t, J = 4.8 Hz, 2 H) LCMS; Mass Calcd.:407.21; MS Found: 408.90 [MS+1].
Scheme 2. Synthesis of (R)-1-(3,4-bis((4-fluorobenzyl)oxy)phenoxy)-3-((2-hydroxyethyl)amino)propan-2-ol (YT-6-2)
Synthesis of 3,4-bis((4-fluorobenzyl)oxy)benzaldehyde (B1)
To a solution of A1 (100 g, 724.6 mmol) in ACN (1 L) were added 1-(bromomethyl)-4-fluorobenzene (301.3 g, 1.59 mol) and K2CO3 (300 g, 2.17 mol). The mixture was stirred at 80°C for 16 h. Then the reaction was concentrated, the residue was purified by silica gel, eluted with EA/PE (1:15 ~ 1:8) to afford B1 (3,4-bis((4-fluorobenzyl)oxy)benzaldehyde, 187 g, 72.8%) as a white solid. 1 H-NMR (DMSO_d6, 400 MHz) δ (ppm) 9.83 (s, 1 H), 7.55–7.48 (m, 6 H), 7.3–7.2 (m, 5 H), 5.25 (s, 2 H), 5.19 (s, 2 H).
Synthesis of 3,4-bis((4-fluorobenzyl)oxy)phenol (B2)
To a solution of B1 (187 g, 526.7 mmol) in DCM (2 L) was added m-CPBA (126 g, 730.4 mmol). The mixture was stirred at RT for 16 h. Then the reaction was washed with saturated sodium bicarbonate solution, concentrated under vacuum. Then the crude product is added to methanol (1.5 L) and water (200 mL) was added KOH (58.9 g, 1.05 mol). The mixture was stirred at RT for 3 h. Then the reaction was filtered and the solid to dryness under vacuum. The crude compound was purified by silica gel, eluted with EA/PE (1:15 ~ 1:5) to afford B2 (3,4-bis((4-fluorobenzyl)oxy)phenol, 151 g, 83.7%) as an off-white solid. 1 H-NMR (DMSO_d6, 400 MHz) δ (ppm) 7.50–7.41 (m, 4 H), 7.24–7.15 (m, 4 H), 6.82 (d, J = 8.4 Hz, 1 H), 6.49 (d, J = 2.4 Hz, 1 H), 6.25 (dd, J = 8.8, 2.8 Hz, 1 H), 5.04 (s, 2 H), 4.95 (s, 2 H).
Synthesis of (R)-2-((3,4-bis((4-fluorobenzyl)oxy)phenoxy)methyl)oxirane (B3)
To a solution of B2 (45.8 g, 134 mmol) in EtOH (500 mL) were added water (25 mL) and KOH (17.2 g, 307 mmol). Then (R)-2-(chloromethyl)oxirane (37 g, 400 mmol) was added to the reaction. The resulting mixture was stirred at RT for 16 h. Then the reaction was quenched by addition water, extracted with EA. The organic layer was washed with brine, dried over Na2SO4, filtered and concentrated. The residue was purified by silica gel, eluted with EA/PE (1:15 ~ 1:10) to afford B3 ((R)-2-((3,4-bis((4-fluorobenzyl)oxy)phenoxy)methyl)oxirane, 26 g, 48.7%) as a white solid. 1 H-NMR (DMSO_d6, 400 MHz) δ (ppm) 7.51–7.43 (m, 4 H), 7.25–7.16 (m, 4 H), 6.94 (d, J = 9.2 Hz, 1 H), 6.73 (d, J = 2.8 Hz, 1 H), 6.45 (dd, J = 8.8, 2.8 Hz, 1 H), 5.10 (s, 2 H), 5.00 (s, 2 H), 4.24 (dd, J = 11.2, 2.8 Hz, 1 H), 3.75 (dd, J = 11.2, 6.4 Hz, 1 H), 3.30–3.28 (m, 1 H), 2.83 (t, J = 5.2 Hz, 1 H), 2.68 (dd, J = 5.2, 2.8 Hz, 1 H).
Synthesis of (R)-1-(3,4-bis((4-fluorobenzyl)oxy)phenoxy)-3-((2-hydroxyethyl)amino)propan-2-ol (YT-6-2)
To a solution of B3 (10 g, 25.1 mmol) and 2-aminoethanol (3.07 g, 50.3 mmol) in MeOH (100 mL) was stirred overnight at 50°C. The mixture was concentrated. Another 20 g batch was carried out as the above procedure. The crude was purified by prep-HPLC, then concentrated to remove acetonitrile, and added the NaHCO3 saturated solution to adjust pH to 7–8. The solution was filtered and washed by water 3 times to give YT-6-2 ((R)-1-(3,4-bis((4-fluorobenzyl)oxy)phenoxy)-3-((2-hydroxyethyl)amino)propan-2-ol, 10 g, 86.7%) as a white solid. 1 H-NMR (CDCl3, 400 MHz) δ (ppm) 7.4–7.33 (m, 4 H), 7.06–6.99 (m, 4 H), 6.83 (d, J = 8.8 Hz, 1 H), 6.57 (d, J = 2.8 Hz, 1 H), 6.38 (dd, J = 9.2, 3.2 Hz, 1 H), 5.04 (s, 2 H), 4.99 (s, 2 H), 4.07 (brs, 1 H), 3.9 (d, J = 4.4 Hz, 2 H), 3.7 (s, 2 H), 2.88–2.77 (m, 7H); ESI-MS Calcd m/z for C25H27F2NO5 [M + H]+ 459.18 Found 460.90.
Scheme 3. Synthesis of (R)-1-(4-(benzyloxy)-3-phenethoxyphenoxy)-3-(isopropylamino)propan-2-ol (YOK-1204)
Synthesis of 4-(benzyloxy)-3-hydroxybenzaldehyde (C1)
To a solution of 3,4-dihydroxybenzaldehyde (A1, 20 g, 145 mmol) and (bromomethyl)benzene (24.8 g, 145 mmol) in acetonitrile (400 mL) was add NaHCO3 (14.6 g, 174 mmol) at 25°C. The mixture was stirred overnight at 80°C. The reaction was concentrated. The residue was quenched with 1 N HCl and extracted with ethyl acetate. The organic layer was washed with brine, dried over Na2SO4, filtered and concentrated. The residue was purified by column chromatography on silica gel, eluted with ethyl acetate/petroleum ether (1:20 ~ 1:10) to afford 4-(benzyloxy)-3-hydroxybenzaldehyde (C1, 10 g, 30%) as a white solid. 1 H-NMR (DMSO_d6, 400 MHz) δ (ppm) 9.76 (s, 1 H), 9.66 (s, 1 H), 7.49–7.48 (m, 2 H), 7.42–7.34 (m, 4 H), 7.29 (d, J = 2.0 Hz, 1 H), 7.20 (d, J = 8.4 Hz, 1 H), 5.23 (s, 2 H); ESI-MS Calcd m/z for C14H12O3 [M + H]+ 229.20 Found 229.08.
Synthesis of 4-(benzyloxy)-3-phenethoxybenzaldehyde (C2)
To a solution of 4-(benzyloxy)-3-hydroxybenzaldehyde (C1, 10 g, 43.9 mmol) and (2-bromoethyl)benzene (9.71 g, 52.6 mmol) in dimethylformamide (100 mL) was added Cs2CO3 (43 g, 132 mmol). The mixture was stirred at 80°C overnight. The mixture was added water and extracted with ethyl acetate. The organic layer was washed with brine, dried over Na2SO4, filtered and concentrated. The residue was purified by column chromatography on silica gel, eluted with ethyl acetate/ petroleum ether (20:1 ~ 10:1) to afford 4-(benzyloxy)-3-phenethoxybenzaldehyde (C2, 3.7 g, 25%). 1 H-NMR (CDCl3, 400 MHz) δ (ppm) 9.83 (s, 1 H), 7.46–7.25 (m, 12 H), 7.02 (d, J = 7.6 Hz, 1 H), 5.22 (s, 2 H), 4.31 (t, J = 6.8 Hz, 2 H), 3.18 (t, J = 6.8 Hz, 2 H); ESI-MS Calcd m/z for C22H20O3 [M + H]+ 333.20 Found 333.14.
Synthesis of 4-(benzyloxy)-3-phenethoxyphenol (C3)
To a solution of 4-(benzyloxy)-3-phenethoxybenzaldehyde (C2, 3.7 g, 11.1 mmol) in dichloromethane (40 mL) was added meta-chloroperoxybenzoic acid (2.9 g, 16.7 mmol) in portions. The mixture was stirred at RT for 2 h. The mixture was washed with saturated NaHCO3 solution, and concentrated. The mixture was dissolved in methanol (25 mL) and added 5 N KOH (2.5 mL, 12.3 mmol). The mixture was stirred at RT for 1 h. The mixture was added ice water and filtered. The solid was concentrated to afford 4-(benzyloxy)-3-phenethoxyphenol (C3, 3.4 g, 96%). 1 H-NMR (DMSO_d6, 400 MHz) δ (ppm) 9.01 (s, 1 H), 7.37–7.21 (m, 10 H), 6.80 (d, J = 8.8 Hz, 1 H), 6.43 (s, 1 H), 6.22 (dd, J = 2.4, 8.4 Hz, 1 H), 4.87 (s, 2H), 4.14 (t, J = 6.8 Hz, 2H), 3.03 (t, J = 6.4 Hz, 2H); ESI-MS Calcd m/z for C21H20O3 [M + H]+ 321.80 Found 321.14.
Synthesis of (R)-2-((4-(benzyloxy)-3-phenethoxyphenoxy)methyl)oxirane (C4)
To a solution of 4-(benzyloxy)-3-phenethoxyphenol (C3, 3.4 g, 10.6 mmol) in ethanol (50 mL) was added KOH (0.7 g, 12.8 mmol) and H2O (5 mL). The mixture was added (R)-2-(chloromethyl)oxirane (2.9 g, 31.9 mmol). The mixture was stirred at 30°C overnight. The mixture was added water and filtered. The solid was concentrated to give (R)-2-((4-(benzyloxy)-3-phenethoxyphenoxy)methyl)oxirane (C4, 3.6 g, 90%). 1H-NMR (DMSO_d6, 400 MHz) δ (ppm) 7.41–7.19 (m, 10 H), 6.9 (d, J = 8.8 Hz, 1H), 6.65 (d, J = 2.8 Hz, 1H), 6.42 (dd, J = 2.4, 8.8 Hz, 1H), 4.93 (s, 2H), 4.26–4.18 (m, 3 H), 3.77–3.72 (m, 1H), 3.3–3.27 (m, 1H), 3.04 (t, J = 6.4 Hz, 2H), 2.82 (t, J = 4.8 Hz, 1H), 2.69–2.67 (m, 1H); ESI-MS Calcd m/z for C24H24O4 [M + H]+ 377.10 Found 377.17.
Synthesis of (R)-1-(4-(benzyloxy)-3-phenethoxyphenoxy)-3-(isopropylamino)propan-2-ol (YOK-1204)
The mixture of (R)-2-((4-(benzyloxy)-3-phenethoxyphenoxy)methyl)oxirane (C4, 3.6 g, 9.6 mmol) and propan-2-amine (2.8 g, 47.9 mmol) in methanol (100 mL) was stirred overnight at 50°C. The reaction mixture was concentrated and purified by chromatography (dichloromethane/methanol = 15/1) to give (R)-1-(4-(benzyloxy)-3-phenethoxyphenoxy)-3-(isopropylamino)propan-2-ol (YOK-1204, 1 g, 24%). 1H-NMR (DMSO_d6, 500 MHz) δ (ppm) 7.37–7.25 (m, 9 H), 7.21 (ddd, J = 7.2, 3.7, 2.1 Hz, 1H), 6.82 (d, J = 8.8 Hz, 1H), 6.56 (d, J = 2.8 Hz, 1H), 6.39 (dd, J = 8.8, 2.8 Hz, 1H), 4.91 (s, 2H), 4.13 (t, J = 6.7 Hz, 2H), 4.03 (t, J = 6.8 Hz, 1H), 3.86 (q, J = 7.2 Hz, 2H), 3.77 (q, J = 5.5 Hz, 2H), 3.00 (t, J = 6.7 Hz, 2H), 2.66 (m, 2H), 2.52 (dd, J = 10, 5 Hz, 1H), 0.96 (dd, J = 6.2, 2.8 Hz, 6 H); 13C-NMR (DMSO_d6, 125 MHz) δ (ppm) 153.85, 149.66, 141.88, 138.56, 137.67, 129.07, 128.25, 128.20, 127.61, 127.49, 126.22, 116.28, 104.88, 101.91, 71.17, 71.08, 68.80, 68.30, 49.93, 48.29, 35.04, 22.75; HRMS Calcd m/z for C27H33NO4 [M + H]+ 436.2482 Found 436.2482.
Scheme 4. Synthesis of 4-(3,4-bis(benzyloxy)phenyl)butan-1-ol (ATB1095)
Synthesis of methyl 4-(3,4-dimethoxyphenyl)butanoate (D1)
To a solution of 4-(3,4-dimethoxyphenyl)butanoic acid (1 g, 4.46 mmol) in MeOH (20 mL) was added H2SO4 (0.5 mL) by dropwise manner. The mixture was refluxed for 8 hours. After the reaction was completed, the resulting mixture was cooled and evaporated to remove MeOH. The residue was dissolved in H2O (20 mL), added saturated NaHCO3 aqueous solution to adjust pH 7 and extracted by dichloromethane (50 mL x 2). Organic layer was washed with 1 N NaOH aqueous solution, dried over anhydrous MgSO4 and concentrated in vacuo to give D1 (methyl 4-(3,4-dimethoxyphenyl)butanoate, 1 g, 4.2 mmol, yield: 94%).
Synthesis of methyl 4-(3,4-dihydroxyphenyl)butanoate (D2)
To a solution of D1 (1 g, 4.2 mmol) in dichloromethane (40 mL) was added 1 M BBr3 in dichloromethane (21 mL, 21 mmol) at 0°C by dropwise manner. The mixture was stirred at 0°C for 2 h. After reaction was completed, ice (30 g) was slowly added to the mixture and the mixture was stirred at room temperature for overnight. Organic layer was washed with brine, dried over anhydrous MgSO4 and concentrated under reduced pressure. The residue was purified by flash column chromatography (n-hexane/ethyl acetate = 5/1) to give D2 (methyl 4-(3,4-dihydroxyphenyl)butanoate, 0.34 g, 1.62 mmol, yield: 39%). ESI-MS Calcd m/z for C11H14O4 [M + H]+ 211.10 Found 211.
Synthesis of methyl 4-(3,4-bis(benzyloxy)phenyl)butanoate (D3)
To a solution of D2 (0.34 g, 1.62 mmol) in anhydrous DMF (8 mL) were added benzyl bromide (0.58 mL, 4.86 mmol) and K2CO3 (1.01 g, 7.29 mmol). The mixture was stirred at 80°C for 4 h. After the reaction was completed, the mixture was cooled and poured into H2O (50 mL). The resulting solid was collected and dissolved with dichloromethane (30 mL). The organic layer was washed with 10% NaOH aqueous solution (30 mL x 2), dried over anhydrous MgSO4 and concentrated in vacuo to give D3 (methyl 4-(3,4-bis(benzyloxy)phenyl)butanoate, 0.39 g, 1 mmol, yield: 62%). ESI-MS Calcd m/z for C25H26O4 [M + H]+ 391.19 Found 391.
Synthesis of 4-(3,4-bis(benzyloxy)phenyl)butan-1-ol (ATB1095)
To a solution of D3 (0.39 g, 1 mmol) in anhydrous THF (5 mL) was added 2.5 M LiAlH4 in THF (0.6 mL, 1.5 mmol) at 0°C by dropwise manner. The mixture was stirred at 0°C for 2 h. After the reaction was completed, the mixture was quenched by H2O (0.1 mL), 2 N NaOH (0.1 mL) and H2O (0.3 mL) sequentially added. The resulting mixture was dried over anhydrous MgSO4 and celite® filtered. The residue was purified by flash column chromatography (n-hexane/ethyl acetate = 2/1) to give ATB1095 (4-(3,4-bis(benzyloxy)phenyl)butan-1-ol, 0.22 g, 0.61 mmol, yield: 61%) as a colorless oil. 1H-NMR (DMSO-d6, 600 MHz) δ (ppm) 1.37–1.41 (m, 2H), 1.51–1.56 (m, 2H), 2.46–2.48 (m, 2H), 3.37–3.40 (m, 2H), 4.37 (t, J = 5.4 Hz, 1H), 5.07 (s, 2H), 5.10 (s, 2H), 6.68 (dd, J = 7.8 Hz, 1.8 Hz, 1H), 6.91 (d, J = 1.8 Hz, 1H), 6.93 (d, J = 7.8 Hz, 1H), 7.29–7.33 (m, 2H), 7.35–7.39 (m, 4H), 7.42–7.46 (m, 4H). ESI-MS Calcd m/z for C19H25FN2O3 [M + H]+ 362.19 Found 363.00, [M-OH] + 345.
Immunofluorescence analysis
Cells were cultured on coverslips and infected with Mtb-ERFP as described above. After the appropriate infection, cells were washed three times with PBS, fixed with 4% paraformaldehyde for 15 min, permeabilized with 0.25% Triton X-100 (Sigma-Aldrich, T8787) for 10 min, and incubated with primary antibodies for 2 hours at room temperature or overnight at 4°C. Cells were washed with PBS to remove excess primary antibodies and then incubated with secondary antibodies for 1 hour at room temperature. Each experiment was completed on duplicate coverslips and the results are expressed as the mean and standard deviation. Images of dynamic cell colocalization were recorded as vertical z-stacks. LAS X small 2.0 and Adobe Photoshop 7 (Adobe Systems) were used for image processing.
Colony-forming unit (CFU) assay
Wild type (WT) strain of Salmonella enterica serovar Typhimurium (S. Typhimurium) strains was utilized for the study. A single colony of S. Typhimurium was grown overnight at 37°C in the shaking incubator. Secondary culture (5% inoculum) was grown for three hours in microaerophilic conditions. HeLa or RAW264.7 cell lines were infected at a MOI of 10 for 30 min. The infected cells were washed with DPBS and the cells were treated with media containing 100 µg/ml gentamycin (Thermo Fisher Scientific, 15710064) for 1 h to exterminate the extracellular bacteria. The media was exchanged with fresh medium including 10 µg/ml gentamycin. The cells were further cultured with and without the chemical SQSTM1 agonist and incubated for the indicated time in figure legends. Finally, the mammalian cells were lysed using lysis buffer (0.1% Triton X-100, 1X PBS (Welgene, LB 204–01). The intracellular S. Typhimurium containing lysates were serially diluted and spread on the Luria broth (LB) agar plate. After overnight incubation at 37°C, the CFU was determined. For intracellular bacterial viability, cells were infected with Mtb for 4 h. Cells were washed with PBS and lysed in distilled water to release the intracellular bacteria. The harvested bacteria were then plated in Middlebrook 7H10 agar with OADC and incubated for 2–3 weeks, and colonies were counted.
RNA interference assay
Reagents for siRNA silencing were purchased from Life Technologies. Transfection was performed at a final concentration of 40 nM using Lipofectamine RNAiMAX reagent (Invitrogen, 13778150) according to the manufacture’s protocol. Approximately 48 h after siRNA silencing, cells were harvested for immunoblotting and immunocytochemical analyses. The sequences of pre-designed siRNAs against SQSTM1/p62 (Bioneer, 4392420; ID 23628) and UBB (Bioneer) are as follows: siSQSTM1/p62 (sense, 5’-GCCUGUUCGAAAGCGCAAA-3’; antisense, 5’-UUUGCGCUUUCGAACAGGC-3’), siUBB (sense, 5’-CCAGCAGAGGCUCAUCUUU-3’; antisense, 5’-AAAGAUGAGCCUCUGCUGG-3’). The sequences of ATG5 and MAP1LC3B siRNAs (Genolution) are as follows: ATG5 (sense, 5’-CAGUAUCAGACACGAUCAU-3’; antisense, 5’-AUGAUCGUGUCUGAUACUG-3’), MAP1LC3B (sense, 5’-CCAAGAUCCCAGUGAUUAUUU-3’; antisense, 5’-AUAAUCACUGGGAUCUUGGUU-3’).
Immunoblotting analysis
Cells were washed with cold PBS and lysed directly with 1X Laemmli sample buffer (Bio-Rad, 161–0737) or with RIPA buffer (50 mM Tris-HCl, 150 mM NaCl, 1% NP-40, 1% sodium deoxycholate and 0.1% SDS; Biosesang, RC2002) containing freshly prepared protease inhibitor cocktail (Sigma-Aldrich, P8340) and phosphatase inhibitor (Sigma-Aldrich, 31,167,051–1). Lysates were centrifuged at 18,500 x g for 20 min at 4°C, and the supernatants were used for immunoblotting. Protein concentrations were measured using the BCA protein assay kit (Pierce, 23225). The samples were diluted with 4X Laemmli sample buffer (65.8 mM Tris-HCl, pH 6.8, 26.3% [w:v] glycerol, 2.1% SDS, 0.01% bromophenol blue; Bio-Rad, 161–0737) or in lithium dodecyl sulfate (LDS) sample buffer (Invitrogen, NP0007) with a reducing reagent, followed by heating for 5 min at 95°C. Whole-cell lysates were separated by sodium dodecyl sulfate (SDS)-polyacrylamide gel electrophoresis and transferred to polyvinylidene difluoride membranes (Millipore, IPVH00010). Blocking was done using PBS-T (20 mM Tris-HCl, pH 7.5, 150 mM NaCl, and 0.05% [v:v] Tween 20 [Bio-Rad, 170–6531]) containing 5% BSA (Biosesang, AC1025) for 1 h at room temperature, and the membrane was incubated with primary antibodies diluted with the blocking solution for overnight at 4°C. Secondary IgG-HRP antibodies were incubated for 1 h at room temperature.
Molecular docking studies
For the docking study, five novel compounds were generated and optimized in Cresset Flare software. The available crystal structure of the SQSTM1 ZZ domain (PDB ID: 6MIU) was downloaded from Protein Data Bank (https://www.rcsb.org). Protein preparation was carried out in Cresset module Flare software. Hydrogen’s and 3D protonation were carried out on the target protein and minimized for the active site residues. Docking experiments were performed by using Cresset Flare software in accurate mode and default settings.
Affinity-isolation assays of YT-6-2
Plasmids expressing SQSTM1 wild type and ZZ point mutant (D147K) constructs were transiently transfected into SQSTM1−/− HeLa cells using Lipofectamine 2000. After 24 h, trypsinized cells were collected in growth medium and centrifuged. The cell pellets were resuspended in a hypotonic buffer (10 mM HCl, 1.5 mM MgCl2, 10 mM HEPES, pH 7.9) and incubated in ice for 30 min. The cell suspensions were subjected to ten freeze-thaw cycles, followed by centrifugation at 12,000 × g at 4°C for 15 min. For the affinity-isolation assay, biotinylated YT-6-2 was incubated with streptavidin agarose resin (272 µg of compound per ml settled resin; Thermo Fisher Scientific, 20359). The X-peptide beads were diluted in five volumes of PBS and incubated overnight at 4°C. The beads were centrifuged at 1000 × g for 3 min and washed three times in an equal volume of PBS. Soluble SQSTM1−/− HeLa cell extracts containing 500 µg of total protein were diluted in 500 µl binding buffer (0.05% Tween 20, 10% glycerol, 0.2 M KCl, 20 mM HEPES, pH 7.9) and mixed with YT-6-2 conjugated beads (30 µl packed volume). The mixtures were incubated at 4°C for 1 h with gentle rotation. The beads were pelleted by centrifugation at 1000 × g for 3 min, washed five times with 500 µl of binding buffer at 4°C for 10 min, resuspended in 30 µl SDS sample buffer, and heated at 100°C for 5 min. Analysis was performed by SDS-PAGE and immunoblotting.
Transmission electron microscopy (TEM)
RAW264.7 cells were infected with S. Typhimurium for 30 min followed by incubation with 5 μM YTK-A76 for 4 h. BMDMs were infected with Mtb for 4 h and treated with 5 μM YTK-2205 for 18 h. The cells were scraped from the culture dish and pelleted by centrifugation at 3000 x g for 5 min. Pellets were resuspended in 2.5% glutaraldehyde in 0.1 M phosphate (pH 7.4) overnight at 4°C. Subsequently, 50 nm sections were cut and stained with uranyl acetate and lead citrate using the Reichert Ultracut S Ultramicrotome (Leica Microsystems) and FEI Vitrobot Mark IV (Thermo Scientific), respectively. Cell sections were examined using the JEOL JEM-1400 series 120 kV Transmission Electron Microscope at the Seoul National University Hospital Biomedical Research Institute.
Histology
For histopathology, liver and lung tissues were fixed in 10% formalin and embedded in paraffin wax. The tissues were sectioned with 4 μm thickness. Paraffin-embedded slides were freshly treated with Neo-Clear (Millipore, 65351) twice for 10 min each, followed by gradual rehydration in EtOH (100%, 90%, 80%, and 70%; 6 min each) and water for 20 min. The tissues were then stained with hematoxylin and eosin (H&E). H&E-stained sections were scanned with an Aperio digital pathology slide scanner (Leica) and imaged using an Aperio ScanScope® CS System.
Immunocytochemistry
Autoclaved 22-mm2 coverslips were placed in 24-well plates. HeLa cells were seeded 2.5 × 10⁵ cells/well and cultured overnight for further experiments. Cells were infected with S. Typhimurium S14028 with an MOI of 10. Cells were fixed in 4% PFA in PBS, for 15 min at room temperature. After washing twice with PBS, the cells were incubated for 1 h in blocking solution (5% bovine serum albumin and 0.3% Triton X-100 in PBS). The samples were incubated with primary antibodies overnight at 4°C and secondary antibodies were incubated at room temperature. After washing out secondary antibodies with PBS, the samples were mounted on a cover slide with the mounting solution. Confocal images were taken with a Zeiss LSM 700 laser scanning confocal microscope equipped with Zeiss C-Apochromat 60x (1.2 NA) and 40x (1.2 NA) water immersion lens and analyzed using ZEN (black edition) 2012 SP5 software (Zeiss). Using the ZEN software, z-stacks of images covering the entire cell thickness were acquired and projected maximally. Image processing and annotation were done with Adobe Photoshop, Adobe Illustrator and Fiji software.
Flow cytometry
BMDMs were analyzed by flow cytometry for phagocytosis using an ACEA NovoCyte flow cytometer as indicated by the manufacturer. BMDMs were infected with Mtb-ERFP for 2 h and treated with SQSTM1 agonist. Flow cytometry data were collected and analyzed using De Novo software (CA, Glendale, USA).
MTT assay
BMDMs were seeded in 96 well plate and treated with SQSTM1 agonists for 72 h treated with 3-(4,5-dimethylthiazol-2-yl)-2,5-diphenyltetrazolium bromide (MTT; Sigma-Aldrich, M5655) solution and incubated for 2 h. The medium was removed and cells were added DMSO to solubilize the crystals. The absorbance was measured with a reader spectrophotometer (Bio-Tek Synergy TH, Winooski, VT, USA) at 570 nm, using 690 nm as a reference.
Quantification and statistical analysis
All experiments were repeated at least three times and all data are presented as the mean ± SD or ± SED. In most data, two-tailed unpaired t-test (for parametric data) or Mann–Whitney U-test (for nonparametric data) were used for comparisons of two groups and one-way analysis of variance (ANOVA; Dunnett’s test) was performed for comparisons of multiple groups. For comparison of the magnitude of changes in different conditions, two-way ANOVA with Bonferroni posttests was used. Statistical significance was determined as values of p < 0.05 (*p < 0.05, **p < 0.01, ***p < 0.001, ****p < 0.0001, ns: not significant). For each experiment, sample size (n) was determined as stated in the figure legends. All statistical analyses were performed with Prism 8.2 software (GraphPad).
Acknkowledgements
We thank the laboratory members of Y.T.K. and E.-K.J. for critical discussions, Eun Jin Lee for the Salmonella enterica serovar Typhimurium 14028S, Ju Young Kim for experimental support, and Wonhyoung Seo for genomic DNA sequencing, Jin-Man Kim for analytical tools and analyzed the data.
Supplemental Material
Download MS Word (9.1 MB)Disclosure statement
No potential conflict of interest was reported by the author(s).
Supplementary material
Supplemental data for this article can be accessed here
Additional information
Funding
References
- Shaid S, Brandts CH, Serve H, et al. Ubiquitination and selective autophagy. Cell Death Differ. 2013;20(1):21–30.
- Gatica D, Lahiri V, Klionsky DJ. Cargo recognition and degradation by selective autophagy. Nat Cell Biol. 2018;20(3):233–242.
- Birgisdottir AB, Lamark T, Johansen T. The LIR motif - crucial for selective autophagy. J Cell Sci. 2013;126(15):3237–3247.
- Okamoto K. Organellophagy: eliminating cellular building blocks via selective autophagy. J Cell Biol. 2014;205(4):435–445.
- Anding AL, Baehrecke EH. Cleaning house: selective autophagy of organelles. Dev Cell. 2017;41(1):10–22.
- Ichimura Y, Waguri S, Sou YS, et al. Phosphorylation of SQSTM1 activates the Keap1-Nrf2 pathway during selective autophagy. Mol Cell. 2013;51(5):618–631.
- Richter B, Sliter DA, Herhaus L, et al. Phosphorylation of OPTN by TBK1 enhances its binding to Ub chains and promotes selective autophagy of damaged mitochondria. Proc Natl Acad Sci U S A. 2016;113(15):4039–4044.
- Sorbara MT, Girardin SE. Emerging themes in bacterial autophagy. Curr Opin Microbiol. 2015;23:163–170.
- Pareja ME, Colombo MI. Autophagic clearance of bacterial pathogens: molecular recognition of intracellular microorganisms. Front Cell Infect Microbiol. 2013;3:54.
- Ishimura R, Tanaka K, Komatsu M. Dissection of the role of p62/Sqstm1 in activation of Nrf2 during xenophagy. FEBS Lett. 2014;588(5):822–828.
- Deretic V, Levine B. Autophagy, immunity, and microbial adaptations. Cell Host Microbe. 2009;5(6):527–549.
- Noda T, Yoshimori T. Molecular basis of canonical and bactericidal autophagy. Int Immunol. 2009;21(11):1199–1204.
- Levine B, Deretic V. Unveiling the roles of autophagy in innate and adaptive immunity. Nat Rev Immunol. 2007;7(10):767–777.
- Vergne I, Singh S, Roberts E, et al. Autophagy in immune defense against Mycobacterium tuberculosis. Autophagy. 2006;2(3):175–178.
- Rogov V, Dotsch V, Johansen T, et al. Interactions between autophagy receptors and ubiquitin-like proteins form the molecular basis for selective autophagy. Mol Cell. 2014;53(2):167–178.
- Wu Y, Cui J. Selective autophagy regulates innate immunity through cargo receptor network. Adv Exp Med Biol. 2019;1209:145–166.
- Fracchiolla D, Sawa-Makarska J, Martens S. Beyond Atg8 binding: the role of AIM/LIR motifs in autophagy. Autophagy. 2017;13(5):978–979.
- Thomas DR, Newton P, Lau N, et al. Interfering with autophagy: the opposing strategies deployed by Legionella pneumophila and Coxiella burnetii effector proteins. Front Cell Infect Microbiol. 2020;10:599762.
- Kimmey JM, Stallings CL. Bacterial pathogens versus autophagy: implications for therapeutic interventions. Trends Mol Med. 2016;22(12):1060–1076.
- Campoy E, Colombo MI. Autophagy subversion by bacteria. Curr Top Microbiol Immunol. 2009;335:167–178.
- Yuk JM, Yoshimori T, Jo EK. Autophagy and bacterial infectious diseases. Exp Mol Med. 2012;44(2):99–108.
- Knodler LA, Celli J. Eating the strangers within: host control of intracellular bacteria via xenophagy. Cell Microbiol. 2011;13(9):1319–1327.
- Wu YW, Li F. Bacterial interaction with host autophagy. Virulence. 2019;10(1):352–362.
- Huang J, Brumell JH. Bacteria-autophagy interplay: a battle for survival. Nat Rev Microbiol. 2014;12(2):101–114.
- Escoll P, Rolando M, Buchrieser C. Modulation of host autophagy during bacterial infection: sabotaging host munitions for pathogen nutrition. Front Immunol. 2016;7:81.
- Xie Z, Zhang Y, Huang X. Evidence and speculation: the response of Salmonella confronted by autophagy in macrophages. Future Microbiol. 2020;15(13):1277–1286.
- Ganesan R, Hos NJ, Gutierrez S, et al. Salmonella Typhimurium disrupts Sirt1/AMPK checkpoint control of MTOR to impair autophagy. PLoS Pathog. 2017;13(2):e1006227.
- Wu S, Shen Y, Zhang S, et al. Salmonella interacts with autophagy to offense or defense. Front Microbiol. 2020;11:721.
- Jo EK, Yuk JM, Shin DM, et al. Roles of autophagy in elimination of intracellular bacterial pathogens. Front Immunol. 2013;4:97.
- Manzanillo PS, Ayres JS, Watson RO, et al. The ubiquitin ligase parkin mediates resistance to intracellular pathogens. Nature. 2013;501(7468):512–516.
- Franco LH, Nair VR, Scharn CR, et al. The ubiquitin ligase Smurf1 functions in selective autophagy of Mycobacterium tuberculosis and anti-tuberculous host defense. Cell Host Microbe. 2017;22(3):421–423.
- Polajnar M, Dietz MS, Heilemann M, et al. Expanding the host cell ubiquitylation machinery targeting cytosolic Salmonella. EMBO Rep. 2017;18(9):1572–1585.
- Huett A, Heath RJ, Begun J, et al. The LRR and RING domain protein LRSAM1 is an E3 ligase crucial for ubiquitin-dependent autophagy of intracellular Salmonella Typhimurium. Cell Host Microbe. 2012;12(6):778–790.
- Noad J, von der Malsburg A, Pathe C, et al. LUBAC-synthesized linear ubiquitin chains restrict cytosol-invading bacteria by activating autophagy and NF-kappaB. Nat Microbiol. 2017;2(7):17063.
- Slowicka K, van Loo G. Optineurin functions for optimal immunity. Front Immunol. 2018;9:769.
- Wild P, Farhan H, McEwan DG, et al. Phosphorylation of the autophagy receptor optineurin restricts salmonella growth. Science. 2011;333(6039):228–233.
- Lopez Romo A, Quiros R. Appropriate use of antibiotics: an unmet need. Ther Adv Urol. 2019;11:1756287219832174.
- Fair RJ, Tor Y. Antibiotics and bacterial resistance in the 21st century. Perspect Medicin Chem. 2014;6:25–64.
- Aslam B, Wang W, Arshad MI, et al. Antibiotic resistance: a rundown of a global crisis. Infect Drug Resist. 2018;11:1645–1658.
- Fauconnier A, Nagel TE, Fauconnier C, et al. The unique role that WHO could play in implementing phage therapy to combat the global antibiotic resistance crisis. Front Microbiol. 2020;11:1982.
- Mendelson M. Practical solutions to the antibiotic resistance crisis. S Afr Med J. 2015;105(5):413.
- Kaufmann SHE, Dorhoi A, Hotchkiss RS, et al. Host-directed therapies for bacterial and viral infections. Nat Rev Drug Discov. 2018;17(1):35–56.
- Tobin DM. Host-directed therapies for tuberculosis. Csh Perspect Med. 2015;5:a021196.
- Andersson AM, Andersson B, Lorell C, et al. Autophagy induction targeting MTORC1 enhances Mycobacterium tuberculosis replication in HIV co-infected human macrophages. Sci Rep. 2016;6(1):28171.
- Zullo AJ, Jurcic Smith KL, Lee S. Mammalian target of Rapamycin inhibition and mycobacterial survival are uncoupled in murine macrophages. BMC Biochem. 2014;15(1):4.
- Singhal A, Jie L, Kumar P, et al. Metformin as adjunct antituberculosis therapy. Sci Transl Med. 2014;6(263):263ra159.
- Yang CS, Kim JJ, Lee HM, et al. The AMPK-PPARGC1A pathway is required for antimicrobial host defense through activation of autophagy. Autophagy. 2014;10(5):785–802.
- Cheng CY, Gutierrez NM, Marzuki MB, et al. Host sirtuin 1 regulates mycobacterial immunopathogenesis and represents a therapeutic target against tuberculosis. Sci Immunol. 2017;2(9). DOI:10.1126/sciimmunol.aaj1789.
- Chiu HC, Kulp SK, Soni S, et al. Eradication of intracellular Salmonella enterica serovar typhimurium with a small-molecule, host cell-directed agent. Antimicrob Agents Chemother. 2009;53(12):5236–5244.
- Nagy TA, Quintana JLJ, Reens AL, et al. Autophagy induction by a small molecule inhibits Salmonella survival in macrophages and mice. Antimicrob Agents Chemother. 2019;63(12). DOI:10.1128/AAC.01536-19.
- Tasaki T, Sriram SM, Park KS, et al. The N-end rule pathway. Annu Rev Biochem. 2012;81(1):261–289.
- Varshavsky A. N-degron and C-degron pathways of protein degradation. Proc Natl Acad Sci U S A. 2019;116(2):358–366.
- Kwon YT, Kashina AS, Davydov IV, et al. An essential role of N-terminal arginylation in cardiovascular development. Science. 2002;297(5578):96–99.
- Sriram SM, Kwon YT. The molecular principles of N-end rule recognition. Nat Struct Mol Biol.2010;17(10):1164–1165.
- Sriram SM, Kim BY, Kwon YT. The N-end rule pathway: emerging functions and molecular principles of substrate recognition. Nat Rev Mol Cell Biol. 2011;12(11):735–747.
- Yoo YD, Mun SR, Ji CH, et al. N-terminal arginylation generates a bimodal degron that modulates autophagic proteolysis. Proc Natl Acad Sci U S A. 2018;115(12):E2716–E24.
- Cha-Molstad H, Sung KS, Hwang J, et al. Amino-terminal arginylation targets endoplasmic reticulum chaperone BiP for autophagy through SQSTM1 binding. Nat Cell Biol. 2015;17(7):917–929.
- Cha-Molstad H, Yu JE, Feng Z, et al. p62/SQSTM1/Sequestosome-1 is an N-recognin of the N-end rule pathway which modulates autophagosome biogenesis. Nat Commun. 2017;8(1):102.
- Ji CH, Kim HY, Heo AJ, et al. The N-degron pathway mediates ER-phagy. Mol Cell. 2019;75(5):1058–72 e9.
- Ciuffa R, Lamark T, Tarafder AK, et al. The selective autophagy receptor p62 forms a flexible filamentous helical scaffold. Cell Rep. 2015;11(5):748–758.
- Wurzer B, Zaffagnini G, Fracchiolla D, et al. Oligomerization of p62 allows for selection of ubiquitinated cargo and isolation membrane during selective autophagy. Elife. 2015;4:e08941.
- Rangaraju S, Verrier JD, Madorsky I, et al. Rapamycin activates autophagy and improves myelination in explant cultures from neuropathic mice. J Neurosci. 2010;30(34):11388–11397.
- Rubinsztein DC, Nixon RA. Rapamycin induces autophagic flux in neurons. Proc Natl Acad Sci U S A. 2010;107(49):E181. author reply E2.
- Gutierrez MG, Master SS, Singh SB, et al. Autophagy is a defense mechanism inhibiting BCG and Mycobacterium tuberculosis survival in infected macrophages. Cell. 2004;119(6):753–766.
- Mayer-Barber KD, Barber DL. Innate and Adaptive Cellular Immune Responses to Mycobacterium tuberculosis Infection. Cold Spring Harb Perspect Med. 2015;5(12). DOI:10.1101/cshperspect.a018424
- Yoshikai Y. Immunological protection against Mycobacterium tuberculosis infection. Crit Rev Immunol. 2006;26(6):515–526.
- Kraft C, Peter M, Hofmann K. Selective autophagy: ubiquitin-mediated recognition and beyond. Nat Cell Biol. 2010;12(9):836–841.
- Zaffagnini G, Martens S. Mechanisms of Selective Autophagy. J Mol Biol. 2016;428(9):1714–1724.
- Ammanathan V, Mishra P, Chavalmane AK, et al. Restriction of intracellular Salmonella replication by restoring TFEB-mediated xenophagy. Autophagy. 2020;16(9):1584–1597.
- Liu W, Zhuang J, Jiang Y, et al. Toll-like receptor signalling cross-activates the autophagic pathway to restrict Salmonella Typhimurium growth in macrophages. Cell Microbiol. 2019;21(12):e13095.
- Fujita N, Morita E, Itoh T, et al. Recruitment of the autophagic machinery to endosomes during infection is mediated by ubiquitin. J Cell Biol. 2013;203(1):115–128.
- Ponpuak M, Deretic V. Autophagy and p62/sequestosome 1 generate neo-antimicrobial peptides (cryptides) from cytosolic proteins. Autophagy. 2011;7(3):336–337.
- Watson RO, Manzanillo PS, Cox JS. Extracellular M. tuberculosis DNA targets bacteria for autophagy by activating the host DNA-sensing pathway. Cell. 2012;150(4):803–815.
- Pilli M, Arko-Mensah J, Ponpuak M, et al. TBK-1 promotes autophagy-mediated antimicrobial defense by controlling autophagosome maturation. Immunity. 2012;37(2):223–234.
- Birmingham CL, Smith AC, Bakowski MA, et al. Autophagy controls Salmonella infection in response to damage to the Salmonella-containing vacuole. J Biol Chem. 2006;281(16):11374–11383.
- Huang J, Brumell JH. Autophagy in immunity against intracellular bacteria. Curr Top Microbiol Immunol. 2009;335:189–215.
- Wang L, Yan J, Niu H, et al. Autophagy and ubiquitination in Salmonella infection and the related inflammatory responses. Front Cell Infect Microbiol. 2018;8:78.
- VanderVen BC, Huang L, Rohde KH, et al. The minimal unit of infection: Mycobacterium tuberculosis in the macrophage. Microbiol Spectr. 2016;4(6). DOI:10.1128/microbiolspec.TBTB2-0025-2016.
- Russell DG. Mycobacterium tuberculosis and the intimate discourse of a chronic infection. Immunol Rev. 2011;240(1):252–268.
- Augenstreich J, Briken V. Host cell targets of released lipid and secreted protein effectors of Mycobacterium tuberculosis. Front Cell Infect Microbiol. 2020;10:595029.
- Fredlund J, Enninga J. Cytoplasmic access by intracellular bacterial pathogens. Trends Microbiol. 2014;22(3):128–137.
- Zhang R, Varela M, Vallentgoed W, et al. The selective autophagy receptors Optineurin and SQSTM1 are both required for zebrafish host resistance to mycobacterial infection. PLoS Pathog. 2019;15(2):e1007329.
- Tattoli I, Sorbara MT, Philpott DJ, et al. Bacterial autophagy: the trigger, the target and the timing. Autophagy. 2012;8(12):1848–1850.
- Cemma M, Kim PK, Brumell JH. The ubiquitin-binding adaptor proteins p62/SQSTM1 and NDP52 are recruited independently to bacteria-associated microdomains to target Salmonella to the autophagy pathway. Autophagy. 2011;7(3):341–345.
- Mahairas GG, Sabo PJ, Hickey MJ, et al. Molecular analysis of genetic differences between Mycobacterium bovis BCG and virulent M. bovis. J Bacteriol. 1996;178(5):1274–1282.
- Kim YS, Silwal P, Kim SY, et al. Autophagy-activating strategies to promote innate defense against mycobacteria. Exp Mol Med. 2019;51:1–10.
- Paik S, Kim JK, Chung C, et al. Autophagy: a new strategy for host-directed therapy of tuberculosis. Virulence. 2019;10(1):448–459.
- Kiran D, Podell BK, Chambers M, et al. Host-directed therapy targeting the Mycobacterium tuberculosis granuloma: a review. Semin Immunopathol. 2016;38(2):167–183.
- Ran FA, Hsu PD, Wright J, et al. Genome engineering using the CRISPR-Cas9 system. Nat Protoc. 2013;8(11):2281–2308.