
ABSTRACT
STING1 (stimulator of interferon response cGAMP interactor 1), the pivotal adaptor protein of CGAS (cyclic GMP-AMP synthase)-STING1 signaling, is critical for type I IFN production of innate immunity. However, excessive or prolonged activation of STING1 is associated with autoinflammatory and autoimmune diseases. Thus, preventing STING1 from over-activation is important to maintain immune homeostasis. Here, we reported that UXT (ubiquitously expressed prefoldin like chaperone), a small chaperone-like protein, was essential to prevent the excessive activation of STING1-mediated type I IFN signaling through autophagic degradation of STING1 via SQSTM1 (sequestosome 1). Upon DNA mimics or cyclic GMP-AMP (cGAMP) stimulation, UXT specifically interacted with STING1 and promoted STING1 degradation through selective macroautophagy/autophagy. Moreover, UXT was required for more efficient autophagic degradation of STING1 by facilitating the interaction of SQSTM1 and STING1. The in vivo role of UXT in attenuating the CGAS-STING1 signaling was further confirmed in the mouse model of DNA-virus infection and the TMPD (2,6,10,14-tetramethylpentadecane)-induced murine lupus model. Intriguingly, the expression of UXT was consistently impaired and exhibited a remarkable inverse correlation with type I IFN signature in the leukocytes and PBMCs (peripheral blood mononuclear cells) of several large SLE (systemic lupus erythematosus) cohorts. Importantly, the replenishment of UXT effectively suppressed the production of IFNs and ISGs in the PBMCs of SLE patients. Taken together, our study reveals a novel regulatory role of UXT in autophagic degradation of STING1 to maintain immune homeostasis. UXT might be a potential therapeutic target for alleviating aberrant type I IFNs in autoimmune diseasesAbbreviations: 3-MA: 3-methyladenine; BMDMs: bone marrow-derived macrophages; cGAMP: cyclic GMP-AMP; CGAS: cyclic gmp-amp synthase; cKO: conditional knockout; CXCL10: C-X-C motif chemokine ligand 10; GAPDH: glyceraldehyde-3-phosphate dehydrogenase; HSV-1: herpes simplex virus type 1; HTDNA: herring testes DNA; IFIT1: interferon induced protein with tetratricopeptide repeats 1; IFNA4: interferon alpha 4; IFNB: interferon beta; IRF3: interferon regulatory factor 3; ISD: interferon stimulatory DNA; ISGs: IFN-stimulated genes; MAP1LC3B/LC3B: microtubule associated protein 1 light chain 3 beta; MEFs: mouse embryonic fibroblasts; RNA-seq: RNA sequencing; PBMCs: peripheral blood mononuclear cells; RSAD2: radical S-adenosyl methionine domain containing 2; SLE: systemic lupus erythematosus; SQSTM1: sequestosome 1; STING1: stimulator of interferon response cGAMP interactor 1; TBK1: TANK binding kinase 1; TMPD: 2,6,10,14-tetramethylpentadecane; UXT: ubiquitously expressed prefoldin like chaperone.
KEYWORDS:
Introduction
The CGAS-STING1 signaling is critical for mediating the production of type I interferons and other proinflammatory cytokines in innate immunity. Upon cytosolic DNA stimulation, CGAS produces an endogenous second messenger named cGAMP, which further activates STING1. Functioning as a pivotal adaptor protein, STING1 orchestrates the signal transduction to trigger IRF3 phosphorylation and subsequent IFNs (type I interferons) production, as well as the downstream expression of multiple ISGs (IFN stimulated genes) and inflammation cytokines [Citation1]. The induction of type I IFNs by DNA is essential for the defense against viral infections and anticancer immunity [Citation2]. However, excessive activation of STING1 has been reported to be associated with autoinflammatory and autoimmune diseases, including Aicardi–Goutières syndrome/AGS, STING1-associated vasculopathy with onset in infancy/SAVI, and SLE (systemic lupus erythematosus) [Citation3–5]. Therefore, the activity of CGAS-STING1 signaling, especially for that of STING1, must be precisely and tightly regulated to maintain immune homeostasis for the avoidance of autoimmune diseases [Citation6,Citation7]. Previous studies have demonstrated the roles of the ubiquitin-proteasome system and the autophagy pathway in the negative regulation of CGAS-STING1 signaling [Citation3,Citation8–10]. It is known that these programs initiate STING1 degradation shortly after the CGAS-STING1 signaling activation. However, detailed mechanisms underlying STING1 turnover are still limited.
Autophagy is an essential and conserved process for eliminating damaged organelles, protein aggregates, and invading pathogens in eukaryotes [Citation11]. The process requires the formation of double membrane-bound autophagosomes that are subsequently fused with the lysosome, leading to degradation and recycling of the sequestered substrates [Citation12]. Autophagy involves in multiple physiological and pathological processes, including cancer, infection, inflammation, neurodegeneration, and immunity [Citation13,Citation14]. The components of the autophagy system can directly inhibit the activation of protein complexes that stimulate type I IFN production. Early studies indicated that ATG9A (autophagy related 9A) negatively controls the trafficking of the ER-associated STING1 and inhibits the activation of TBK1 (TANK binding kinase 1) and downstream type I IFN production [Citation15,Citation16]. In addition, other studies showed that activated STING1 directly drives the autophagy process in which TBK1 phosphorylates SQSTM1 for STING1 degradation [Citation17]. Also, STING1 is a potential autophagy receptor by directly interacting with MAP1LC3/LC3 (microtubule associated protein 1 light chain 3) via its LC3-interacting region motifs to mediate autophagy and its own autophagic degradation to tune the innate immune responses [Citation18]. Another study shows STING1 activates autophagy while this process is independent of TBK1 activation and interferon production [Citation19]. Although previous studies demonstrated a strong association between the STING1 signaling and autophagy process, the detailed regulatory mechanisms underlying the reciprocal modulation relationship between STING1 signaling and autophagy are still unclear. The crosstalk between STING1 signaling and autophagy machinery needs further exploration.
UXT is a small chaperone-like protein, which is widely expressed in most tissues and conserved across the vertebrate species. Previous studies have shown that UXT plays critical roles in retinal degenerative disease in mice [Citation20] and angiogenesis in zebrafish [Citation21]. In addition, UXT was also found to be an essential cofactor in the NFKB/NF-κB (nuclear factor kappa B) transcriptional enhanceosome [Citation22]. The ubiquitous expression pattern and diverse biological pathways in which UXT involved suggested that the function of UXT seems to be pleiotropic. The roles of UXT in other biological pathways still need to be explored. In this study, we uncovered that UXT was a vital negative regulator of STING1-mediated type I IFN signaling through selective autophagic degradation of STING1 via SQSTM1. We found that UXT specifically interacted with and degraded STING1 through selective autophagy to avoid excessive activation of STING1. Mechanistically, UXT dynamically enhanced STING1 autophagic degradation by facilitating the interaction of SQSTM1 and STING1 following the activation of CGAS-STING1 signaling. By integrating gene expression profiling of several large cohorts of SLE leukocytes and PBMCs, we further showed that the expression of UXT is significantly decreased and negatively correlated with type I IFN signature in leukocytes and PBMCs of SLE patients. Notably, overexpression of UXT led to a remarkable reduction of type I IFNs and ISGs in the PBMCs of SLE patients, suggesting that UXT may represent a novel therapeutic target in the treatment of autoimmune diseases. This study uncovers an essential function of UXT in modulating the activity of the CGAS-STING1 signaling pathway and provides new insight into the crosstalk between the STING1 signaling and autophagy process.
Results
UXT is a novel regulator of the CGAS-STING1 signaling pathway
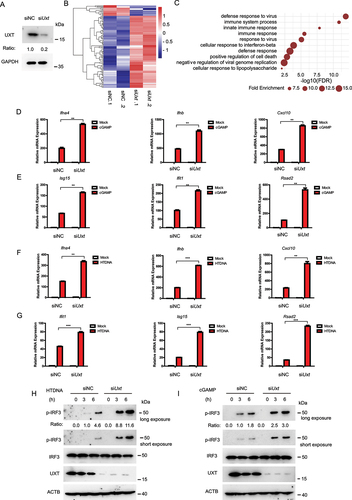
To explore the potential function of UXT in the CGAS-STING1 signaling, we transfected siRNA targeting Uxt into MEFs (mouse embryonic fibroblasts). The siRNA transfection achieved knockdown of UXT (). We then carried out RNA-seq (RNA sequencing) experiments to measure molecular changes at gene expression level in Uxt-knockdown and control MEFs after stimulation of cGAMP, a ligand that specifically activates the CGAS-STING1 signaling [Citation23]. We found knockdown of UXT led to significantly more induction of most of the differentially expressed ISGs (Negative binomial test, FDR <0.05) compared with that in control MEFs ( and Table S1), indicating UXT may play a role in regulating the CGAS-STING1 signaling. In line with this, the significantly upregulated genes were strongly enriched in the biological processes such as innate immune response, immune system process, and cellular response to interferon-beta (), all of which were related to the CGAS-STING1 signaling activation. We further carried out real-time PCR to validate the expression changes of IRF3 (interferon regulatory factor 3)-responsive genes (Ifnb [interferon beta], Ifna4 [interferon alpha 4]) and IFN-stimulated genes (Cxcl10 [c-x-c motif chemokine ligand 10], Isg15, Ifit1 [interferon induced protein with tetratricopeptide repeats 1], Rsad2 [radical s-adenosyl methionine domain containing 2]). In agreement with the RNA-seq data, there is a significant increase in the expression of Ifnb, Ifna4, Cxcl10, Isg15, Ifit1, Rsad2 in the cGAMP treated Uxt-knockdown MEFs (). In addition, the expression of IRF3-responsive genes and ISGs triggered by either herring testes DNA (HTDNA) or interferon stimulatory DNA (ISD; a cytosolic DNA mimic) was also markedly increased in Uxt-knockdown MEFs ( and S1A,B). IRF3 phosphorylation is a hallmark of the activation of the CGAS-STING1 signaling pathway [Citation24]. Compared to that in control MEFs, IRF3 phosphorylation triggered by HTDNA and cGAMP were enhanced in Uxt-knockdown MEFs (). Collectively, these data suggest that UXT is a novel regulator of the CGAS-STING1 signaling pathway.
Figure 1. UXT is a novel regulator of the CGAS-STING1 signaling pathway. (A) MEF cells were transfected with the indicated siRNAs. Cell lysates were collected for western blot analysis of UXT and GAPDH. (B) The heatmap of expression changes of differentially expressed ISGs between negative control (NC) or Uxt siRNA-transfected MEFs stimulated with cGAMP (1 μg per well) for 3 h. For each gene, the expression level was normalized (Z-score) across samples. (C) Significantly enriched biological processes of the upregulated DE genes (FDR<0.01). (D) MEFs transfected with negative control (NC) or Uxt siRNAs were stimulated with cGAMP (1 μg per well) for 3 h. Then, the induction of Ifnb, Ifna4, and Cxcl10 mRNAs was measured by real-time PCR. (E) MEFs transfected with negative control (NC) or Uxt siRNAs were stimulated with cGAMP (1 μg per well) for 3 h. Then, the induction of Isg15, Ifit1, and Rsad2 mRNAs was measured by real-time PCR. (F) MEFs transfected with negative control (NC) or Uxt siRNAs were stimulated with HTDNA (2 μg per well) for 3 h. Then, the induction of Ifnb, Ifna4, and Cxcl10 mRNAs was measured by real-time PCR. (G) MEFs transfected with negative control (NC) or Uxt siRNAs were stimulated with HTDNA (2 μg per well) for 3 h. Then, the induction of Isg15, Ifit1, and Rsad2 mRNAs was measured by real-time PCR. (H) MEFs transfected with negative control (NC) or Uxt siRNAs were stimulated with HTDNA for 0, 3, or 6 h. Then, cell lysates were collected for western blot analysis of UXT, IRF3, IRF3 phosphorylation, and ACTB. (I) MEFs transfected with negative control (NC) or Uxt siRNAs were stimulated with cGAMP for 0, 3, or 6 h. Then, cell lysates were collected for western blot analysis of UXT, IRF3, IRF3 phosphorylation, and ACTB. Graphs show the mean ± SEM, and the data shown are representative of three independent experiments. *p < 0.05; **p < 0.01; ***p < 0.001 (Two-tailed t-test).
UXT represses the CGAS-STING1 signaling responses
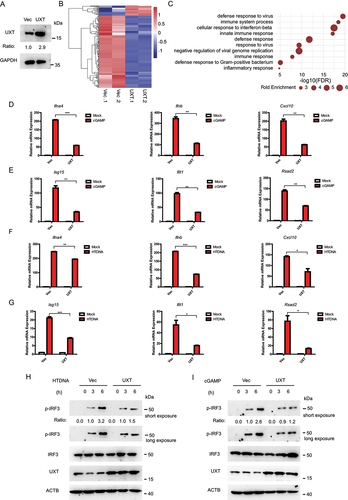
We next investigated whether overexpression of UXT had a substantial effect on the CGAS-STING1 signaling. We transfected UXT expression plasmids and performed RNA-seq experiment to measure molecular changes at gene expression level in UXT-overexpression and control MEFs after cGAMP stimulation. The transfection achieved overexpression of UXT efficiently (). In contrast to the result observed in Uxt-knockdown MEFs, overexpression of UXT dramatically downregulated the most of differentially expressed ISGs expression induced by cGAMP ( and Table S2). Furthermore, the significantly downregulated genes were highly enriched in the biological processes such as innate immune response, immune system process, and cellular response to interferon-beta (), the majority of which were overlapped with that of Uxt knockdown experiments. To further confirm this, real-time PCR was carried out to validate the expression changes of IRF3-responsive genes and downstream ISG genes. Consistently, there is a significant decrease in the expression of Ifnb, Ifna4, Cxcl10, Isg15, Ifit1, Rsad2 in the cGAMP treated UXT-overexpression MEFs (). Moreover, overexpression of UXT also inhibited the expression of IRF3-responsive genes and ISGs triggered by either HTDNA or ISD ( and S2A,B). In addition, the overexpression of UXT attenuated IRF3 phosphorylation induced by HTDNA and cGAMP (). Taken together, these data show that UXT is an inhibitor of the CGAS-STING1 signaling pathway.
Figure 2. UXT represses the CGAS-STING1 signaling responses. (A) MEF cells were transfected with the indicated plasmids. Cell lysates were collected for western blot analysis of UXT and GAPDH. (B) The heatmap of expression changes of differentially expressed ISGs between control vectors (Vec) or UXT expression plasmids (UXT) transfected MEFs stimulated with cGAMP (1 μg per well) for 3 h. For each gene, the expression level was normalized (Z-score) across samples. (C) Significantly enriched biological processes of the downregulated DE genes (FDR<0.01). (D) MEFs transfected control vectors (Vec) or UXT expression plasmids (UXT) were stimulated with cGAMP (1 μg per well) for 3 h. Then, the induction of Ifnb, Ifna4, and Cxcl10 mRNAs was measured by real-time PCR. (E) MEFs transfected control vectors (Vec) or UXT expression plasmids (UXT) were stimulated with cGAMP (1 μg per well) for 3 h. Then, the induction of Isg15, Ifit1, and Rsad2 mRNAs was measured by real-time PCR. (F) MEFs transfected control vectors (Vec) or UXT expression plasmids (UXT) were stimulated with HTDNA (2 μg per well) for 3 h. Then, the induction of Ifnb, Ifna4, and Cxcl10 mRNAs was measured by real-time PCR. (G) MEFs transfected control vectors (Vec) or UXT expression plasmids (UXT) were stimulated with HTDNA (2 μg per well) for 3 h. Then, the induction of Isg15, Ifit1, and Rsad2 mRNAs was measured by real-time PCR. (H) MEFs transfected control vectors (Vec) or UXT expression plasmids (UXT) were stimulated with HTDNA for 0, 3,6 h, respectively. Then, cell lysates were collected for western blot analysis of UXT, IRF3, IRF3 phosphorylation and ACTB. (I) MEFs transfected control vectors (Vec) or UXT expression plasmids (UXT) were stimulated with cGAMP for 0, 3,6 h, respectively. Then, cell lysates were collected for western blot analysis of UXT, IRF3, IRF3 phosphorylation and ACTB. Graphs show the mean ± SEM, and the data shown are representative of three independent experiments. *p < 0.05; **p < 0.01; ***p < 0.001 (Two-tailed t-test).
UXT deficiency enhances the CGAS-STING1 signaling response in vivo
Genetic deletion of Uxt results in early embryonic death. To further confirm the role of UXT in the CGAS-STING1 signaling pathway, we crossed mice homozygous for loxP-flanked Uxt (Uxtfl/fl) with mice expressing Lyz2/LysM-cre to obtain myeloid-cell-specific Uxt-deficient mice (uxtfl/flCre, uxt conditional knockout [cKO]). To examine the efficiency of Uxt deletion, we analyzed UXT expression by western blot on control and uxt cKO BMDMs (bone marrow-derived macrophages). We observed essentially no signal of UXT in uxt cKO BMDMs (), demonstrating that UXT was efficiently deleted in the myeloid cells. We then prepared BMDMs from control and uxt cKO mice and stimulated them with cGAMP. RNA-seq experiments were performed to measure molecular changes at gene expression level in cGAMP treated BMDMs from control and uxt cKO mice. The results showed that most of the differentially expressed ISGs were upregulated in uxt cKO BMDMs relative to that in their control counterparts, after stimulating with cGAMP ( and Table S3). The significantly upregulated genes in uxt cKO BMDMs were strongly enriched in the biological processes related to the CGAS-STING1 signaling, including innate immune response, immune system process, and cellular response to interferon-beta (). In line with the RNA-seq data, the real-time PCR results demonstrated a significant increase in the expression of Ifnb, Ifna4, Cxcl10, Isg15, Ifit1, Rsad2 in the cGAMP treated uxt cKO BMDMs compared to control BMDMs (). Similar results were obtained when HTDNA and ISD were used as stimuli (Figure S3A-D). In addition, the depletion of UXT promoted IRF3 phosphorylation induced by HTDNA and cGAMP (, S3E). Collectively, these data confirmed that UXT plays a role in the negative regulation of the CGAS-STING1 signaling pathway.
Figure 3. UXT deficiency enhances the CGAS-STING1 signaling response. (A) Control and uxt cKO BMDMs were isolated from control and uxt cKO mice. Cell lysates were collected for western blot analysis of UXT and GAPDH. (B) The heatmap of expression changes of differentially expressed ISGs between control and uxt cKO BMDMs stimulated with cGAMP (1 μg per well) for 3 h. For each gene, the expression level was normalized (Z-score) across samples. (C) Significantly enriched biological processes of the upregulated DE genes (FDR<0.01). (D) Control and uxt cKO BMDMs were stimulated with cGAMP (1 μg per well) for 3 h. Then, the induction of Ifnb, Ifna4, and Cxcl10 mRNAs was measured by real-time PCR. (E) Control and uxt cKO BMDMs were stimulated with cGAMP (1 μg per well) for 3 h. Then, the induction of Isg15, Ifit1, and Rsad2 mRNAs was measured by real-time PCR. (F) Control and uxt cKO BMDMs were stimulated with cGAMP for 0, 3, 6 h, respectively. Then, cell lysates were collected for western blot analysis of UXT, IRF3, IRF3 phosphorylation and ACTB. (G) Control and uxt cKO mice were injected intravenously with HSV-1 (2 × 10⁷ pfu per mouse). The survival rates were monitored for 15 days after infection. (H) uxt cKO mice and control littermates were injected intravenously with HSV-1 (1 × 10⁷ pfu per mouse) for 12 h. Then, the serum was collected, and the concentration of IFNB was measured by ELISA. (I) Hematoxylin and eosin staining of lung sections isolated from control and uxt cKO mice infected with HSV-1 by intravenous injection for 16 h (scale bar: 100 μm). (J) Control and uxt cKO mice were injected intravenously with HSV-1 (1 × 10⁷ pfu per mouse) for 9 h. The relative induction of Ifna4, Ifnb mRNA in lungs or spleens from control and uxt cKO mice was measured by real-time PCR. Graphs show the mean ± sem., and the data shown are representative of three independent experiments. * p < 0.05; ** p < 0.01; *** p < 0.001 (Two-tailed t-test).
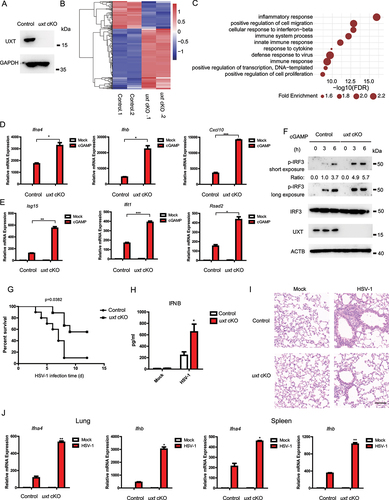
We further examined the in vivo function of UXT based on the mouse model after DNA-virus infection. To do this, uxt cKO mice and control littermates were injected intravenously with HSV-1, and their survival rates were monitored. uxt cKO mice showed lower mortality than that of control littermates after infection with HSV-1 (). Moreover, the abundance of IFNB protein was significantly higher in serum of uxt cKO mice than that of control mice after herpes simplex virus type 1 (HSV-1) infection (). In addition, uxt cKO mice showed an enhanced ability to eliminate virus and reduce inflammatory cell infiltration and tissue damage in the lung after HSV-1 infection (). The expression of Ifnb and Ifna4 mRNAs was markedly higher in lung and spleen tissues of uxt cKO mice than that of control littermates (). These results demonstrated the in vivo roles of UXT in negative regulation of the CGAS-STING1 signaling.
UXT regulates the CGAS-STING1 signaling at the STING1 level
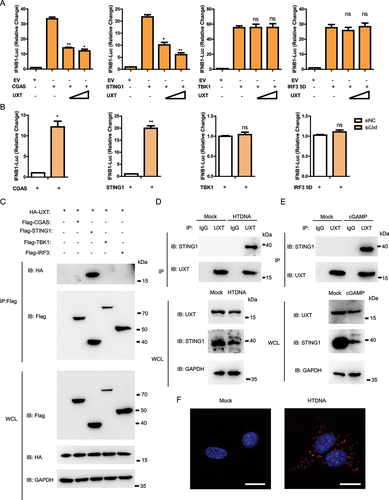
To determine the molecular mechanism underlying how UXT regulates the activity of the CGAS-STING1 signaling, we overexpressed an increasing amount of UXT and CGAS, STING1, TBK1, or IRF3 5D (a persistently active form of IRF3) [Citation18], together with IFNB-luciferase reporter in HEK293 cells. Previous studies found that overexpression of each gene of the CGAS-STING1-TBK1-IRF3 axis strongly activates the CGAS-STING1 signaling and results in IFNB induction. Therefore, manipulation of UXT expression together with the overexpression of CGAS, STING1, TBK1, or IRF3 5D could determine more specific signaling conduction events regulated by UXT. The result showed that UXT attenuated type I IFN signaling induced by CGAS and STING1, but not by TBK1 or IRF3 5D (). Consistently, we only observed the notable increase of CGAS and STING1 mediated type I IFN signaling in Uxt-knockdown cells (). In addition, UXT significantly affected cGAMP-induced activation of IRF3-responsive genes (). Since CGAS and TBK1 act in the upstream and downstream of STING1 in the signaling transduction axis of the CGAS-STING1 signaling, respectively, these data indicate that UXT regulates the CGAS-STING1 signaling mediated type I IFN signaling at STING1 level. Next, we wondered whether the regulation of UXT on STING1 is through their direct interaction. Co-immunoprecipitation and immunoblot analysis revealed that UXT was specifically associated with STING1, whereas UXT did not interact with CGAS, TBK1, or IRF3 (). Notably, we found that the association between UXT and STING1 was dynamically regulated. UXT interacted with STING1 after HTDNA treatment, while negligible interaction between UXT and STING1 was observed before HTDNA treatment, suggesting that UXT was specifically bound to STING1 after the activation of the CGAS-STING1 signaling (). Similar results were observed in the immunoprecipitation experiments of UXT and STING1 after cGAMP stimulation (). Furthermore, proximity ligation assay was carried out to confirm that UXT interacted with STING1 after HTDNA stimulation (). Taken together, these data establish that UXT interacts with STING1 after the CGAS-STING1 signaling activation.
Figure 4. UXT regulates the CGAS-STING1 signaling at the STING1 level. (A) Luciferase activity in HEK293 cells transfected with an IFNB luciferase reporter, together with an empty vector or increasing amount of plasmid expressing UXT, activated by CGAS, STING1, TBK1 or IRF3 5D. The firefly- and renilla luciferase signals were detected with Dual Glo® luciferase assay (Promega). (B) Luciferase activity in HEK293 cells transfected with an IFNB luciferase reporter, together with negative control (NC) or Uxt siRNAs, activated by CGAS, STING1, TBK1 or IRF3 5D. The firefly- and renilla luciferase signals were detected with Dual Glo® luciferase assay (Promega). (C) HEK293T cells were transfected with the indicated plasmids. Then, cell lysates were immunoprecipitated with an anti-Flag antibody and then immunoblotted with the indicated antibodies. (D) MEFs were stimulated with HTDNA for 3 h, and the cell lysates were immunoprecipitated with an anti-UXT antibody or normal IgG, and then immunoblotted with the indicated antibodies. (E) MEFs were stimulated with cGAMP for 3 h, and the cell lysates were immunoprecipitated with an anti-UXT antibody or normal IgG, and then immunoblotted with the indicated antibodies. (F) MEFs were stimulated with HTDNA for 3 h, then PLA analysis was applied to detect the interaction between UXT and STING1. Scale bars: 20 μm. Graphs show the mean ± SEM, and the data shown are representative of three independent experiments. *p < 0.05; **p < 0.01; ***p < 0.001 (Two-tailed t-test).
UXT promotes autophagic degradation of STING1
We next sought to determine the precise mechanism underlying UXT-attenuated type I IFN signaling by targeting STING1. Previous studies reported that STING1 begins to degrade shortly after the CGAS-STING1 signaling activation [Citation18,Citation19]. Consistently, we also noticed that HTDNA treatment significantly reduced the protein level of STING1.
Notably, we found the overexpression of UXT led to accelerated degradation of STING1 after HTDNA stimulation (). Similar results were observed when ISD and cGAMP were used as stimuli (). To further verify these results, we measured protein levels of STING1 in Uxt-knockdown cells after HTDNA stimulation and found that the knockdown of Uxt restrained the degradation of STING1 (). In addition, the knockdown of Uxt also obstructed STING1 degradation after ISD and cGAMP stimulations (). Collectively, these data indicate that UXT promotes the degradation of STING1.
Figure 5. UXT promotes autophagic degradation of STING1. (A) MEFs transfected control vectors (Vec) or UXT expression plasmids (UXT) were stimulated with HTDNA (2 μg per well) for 0, 3, 6 h respectively. Then, Cell lysates were collected for western blot analysis of STING1 and GAPDH. (B) MEFs transfected control vectors (Vec) or UXT expression plasmids (UXT) were stimulated with ISD (2 μg per well) for 0, 3, 6 h respectively. Then, Cell lysates were collected for western blot analysis of STING1 and GAPDH. (C) MEFs transfected control vectors (Vec) or UXT expression plasmids (UXT) were stimulated with cGAMP (1 μg per well) for 0, 3, 6 h respectively. Then, Cell lysates were collected for western blot analysis of STING1 and GAPDH. (D) MEFs transfected negative control (NC) or Uxt siRNAs were stimulated with HTDNA (2 μg per well) for 0, 3, 6 h respectively. Then, Cell lysates were collected for western blot analysis of STING1 and GAPDH. (E) MEFs transfected negative control (NC) or Uxt siRNAs were stimulated with ISD (2 μg per well) for 0, 3, 6 h respectively. Then, Cell lysates were collected for western blot analysis of STING1 and GAPDH. (F) MEFs transfected negative control (NC) or Uxt siRNAs were stimulated with cGAMP (1 μg per well) for 0, 3, 6 h respectively. Then, Cell lysates were collected for western blot analysis of STING1 and GAPDH. (G) MEFs transfected control vectors (Vec) or UXT expression plasmids (UXT) were stimulated with HTDNA (2 μg per well) for 0, 3 h respectively, followed by the treatment of mock, MG132 (10 μM), chloroquine (50 μM), or 3-MA (10 mM). Then, Cell lysates were collected for western blot analysis of STING1 and GAPDH. (H) MEFs transfected control vectors (Vec) or UXT expression plasmids (UXT) were stimulated with cGAMP (1 μg per well) for 0, 3 h respectively, followed by the treatment of mock, MG132 (10 μM), chloroquine (50 μM), or 3-MA (10 mM). Then, Cell lysates were collected for western blot analysis of STING1 and GAPDH. (I) MEFs transfected negative control (NC) or Uxt siRNAs and control vectors (Vec) or UXT expression plasmids (UXT) were stimulated with HTDNA (2 μg per well) for 0, 3, 6 h respectively. Then, Cell lysates were collected for western blot analysis of LC3-II and GAPDH. (J) Luciferase activity in HEK293 cells transfected with an IFNB luciferase reporter, together with STING1 and an empty vector or UXT expressed plasmids, followed by the treatment of mock, MG132 (10 μM), chloroquine (50 μM), or 3-MA (10 mM). The firefly- and renilla luciferase signals were detected with Dual Glo® luciferase assay (Promega). Graphs show the mean ± SEM, and the data shown are representative of three independent experiments. *p < 0.05; **p < 0.01; ***p < 0.001 (Two-tailed t-test).
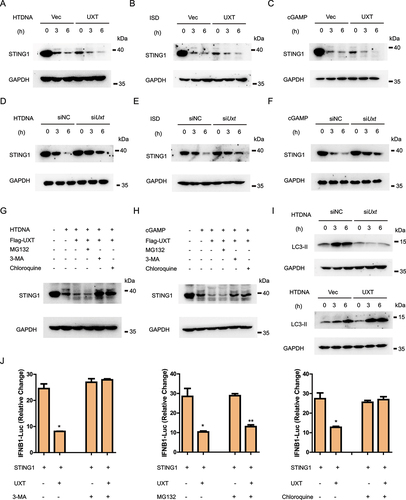
In eukaryotic cells, protein degradation mainly depends on two pathways: the ubiquitin-proteasome system and the autophagy-lysosome pathway [Citation25,Citation26]. We further investigated which of the two pathways may involve in UXT mediated STING1 degradation after stimulation. We found that the downregulation of STING1 protein abundance with the overexpression of UXT was rescued by the treatments with the autophagy inhibitor 3-MA (3-methyladenine) and autolysosome inhibitor chloroquine, but not the proteasome inhibitor MG132 (), suggesting that UXT promotes the autophagic degradation of STING1. To confirm this, we further investigated the influence of UXT in autophagic flux by determining the lipidation of LC3, a well-characterized autophagy indicator that is elevated after autophagy activity increased [Citation27]. The result showed that LC3-II was significantly decreased in Uxt-knockdown cells and increased in UXT-overexpression cells, which indicates that UXT increases autophagy activity (). Additionally, UXT-mediated IFN signaling suppression was also totally abolished in autophagy inhibited cells (). Together, these results demonstrate that UXT promotes the autophagic degradation of STING1, thus further suppressing STING1-mediated type I IFN signaling.
UXT facilitates the interaction of SQSTM1 and STING1
Next, we went on to explore how UXT regulates STING1 autophagic degradation. There are four autophagy receptors known to selectively target proteins for autophagic degradation: SQSTM1, NBR1, CALCOCO2/NDP52, and OPTN (optineurin) [Citation28]. In order to determine which receptor was involved in UXT mediated STING1 autophagic degradation, we examined the interaction of UXT and these four autophagy receptors by immunoprecipitation and immunoblot. Intriguingly, UXT was specifically associated with SQSTM1, whereas no interaction was observed between UXT and the other three autophagy receptors (). To examine the physiological relevance of these findings, we stimulated cells with HTDNA and found that UXT was strongly associated with SQSTM1 after DNA mimics stimulation (). In addition, UXT was also associated with SQSTM1 after cGAMP stimulation (). Collectively, these data indicate that UXT interacts with SQSTM1 upon the CGAS-STING1 signaling activation.
Figure 6. UXT facilitates the interaction of SQSTM1 and STING1. (A, B, C and D) HEK293T cells were transfected with the indicated plasmids. Then, cell lysates were immunoprecipitated with an anti-Flag antibody and then immunoblotted with the indicated antibodies. (E) MEFs were treated with chloroquine and then stimulated with HTDNA for 3 h, and the cell lysates were immunoprecipitated with an anti-UXT antibody or normal IgG, and then immunoblotted with the indicated antibodies. (F) MEFs were treated with chloroquine and then stimulated with cGAMP for 3 h, and the cell lysates were immunoprecipitated with an anti-UXT antibody or normal IgG, and then immunoblotted with the indicated antibodies. (G) MEFs were treated with chloroquine and then stimulated with HTDNA for 3 h, and the cell lysates were immunoprecipitated with an anti-UXT antibody or normal IgG, and then immunoblotted with the indicated antibodies. (H) MEFs transfected negative control (NC) or Uxt siRNAs were treated with chloroquine and then stimulated with HTDNA (2 μg per well) for 3 h, and the cell lysates were immunoprecipitated with an anti-SQSTM1 antibody or normal IgG, and then immunoblotted with the indicated antibodies. (I) MEFs transfected negative control (NC) or Uxt siRNAs were treated with chloroquine and then stimulated with cGAMP (2 μg per well) for 3 h, and the cell lysates were immunoprecipitated with an anti-SQSTM1 antibody or normal IgG, and then immunoblotted with the indicated antibodies. (J) MEFs transfected control vectors (Vec) or UXT expression plasmids (UXT) were treated with chloroquine and then stimulated with cGAMP (2 μg per well) for 3 h, and the cell lysates were immunoprecipitated with an anti-SQSTM1 antibody or normal IgG, and then immunoblotted with the indicated antibodies.
A previous study reported that SQSTM1 interacts with STING1 and mediates STING1 autophagic degradation [Citation17]. We also observed that SQSTM1 interacted with STING1 by immunoprecipitation and immunoblot analysis upon cGAMP stimulation (Figure S4A). Based on these results, we hypothesized that the autophagic degradation of STING1 was mediated by UXT through facilitating the interaction of SQSTM1 and STING1. Indeed, we found UXT interacted with SQSTM1 and STING1 simultaneously after HTDNA stimulation (, S4B). Further, we found that the interaction of SQSTM1 and STING1 was significantly impaired in Uxt-knockdown cells compared to that in control cells after HTDNA stimulation (). Similar results were obtained when cGAMP was used as stimulus (). In contrast, the interaction of SQSTM1 and STING1 was significantly enhanced in UXT overexpressed cells compared to that in control cells after HTDNA or cGAMP stimulation (, S4C). To further identify the domains of UXT responsible for its interaction with SQSTM1 and STING1, we employed a series of deletion mutants of UXT and found the N-terminal region of UXT (amino acids 1–50) was required for UXT-SQSTM1-STING1 interaction (Figure S4D). Taken together, these data indicate that UXT facilitates the interaction of SQSTM1 and STING1, which promotes the autophagic degradation of STING1.
UXT alleviates aberrant type I IFNs in SLE patients
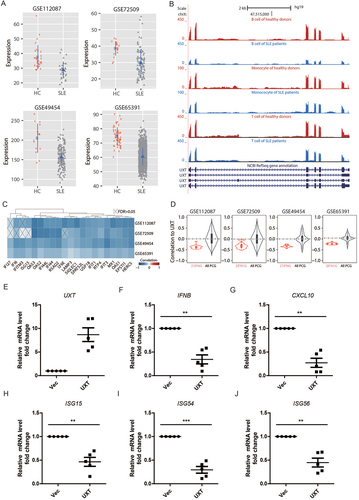
SLE is a common autoimmune disease with the hallmark of aberrant induction of type I IFNs and ISGs [Citation29]. Mounting evidence indicates that the aberrant activation of the CGAS-STING1 signaling pathway has a critical pathogenic role in SLE [Citation4,Citation5]. Considering the prominent role of UXT in regulating STING1-mediated type I IFN signaling, we wondered whether UXT is dysregulated in SLE patients. To investigate this, we took advantage of four large-scale gene expression profiles of leukocytes and PBMCs of 1,211 SLE patients and 139 healthy donors [Citation30–33] and performed an integrative analysis. Intriguingly, we found that the expression of UXT was significantly impaired in all four independent SLE cohorts (, Wilcoxon rank sum test, p < 10e−5). The downregulation of UXT can be observed in T cells, B cells, and monocytes in SLE patients without apparent cell-type specificity (). Notably, the expression of UXT exhibited a strongly negative correlation with type I IFN signature that was measured using well-established 21 ISGs (also referred to as 21 IFNG signature) [Citation34]. The significantly inverse expression correlation was observed between UXT and each of these 21 ISG genes in almost all comparisons in all four SLE cohorts (, Pearson correlation, FDR<0.05), and the global expression correlation between UXT and 21 ISGs was significantly lower than that between UXT and all expressed genes in all four SLE cohorts which were used as background (, Wilcoxon rank sum test, p < 10e−10). These observations prompted us to examine whether manipulation of UXT expression could regulate type I IFN signature in SLE patients. To check this, we isolated PBMCs from the blood samples of SLE patients and transfected them with control empty vectors (Vec) or UXT expression plasmids (UXT) by electroporation. After transfection with UXT expression plasmids (UXT) or its control plasmids for 48 h, the levels of UXT mRNA were significantly higher in UXT-treated PBMCs of SLE patients than in Vec-treated PBMCs of SLE patients (). The mRNA levels of IFNB and ISGs (CXCL10, ISG15, ISG54, ISG56) were markedly decreased in UXT-treated PBMCs of SLE patients (), indicating that UXT attenuated type I IFN signaling response in the PBMCs of SLE patients. Taken together, these data indicated that UXT might function as a suppressor for alleviating aberrant type I IFNs in PBMCs of SLE patients.
Figure 7. UXT alleviates aberrant type I IFNs in SLE patients. (A) The expression comparison of UXT in the leukocytes and PBMCs between SLE patients and healthy donors across four SLE cohorts. (B) The expression comparison of UXT in T cells, B cells, and monocytes between SLE patients and healthy donors. (C) The pairwise Pearson expression correlation between UXT and each of the 21 IFN signature genes across four SLE cohorts. The p-value was corrected into FDR. (D) The global expression correlation distribution between UXT and 21 ISGs (21 IFNG) across four SLE cohorts. The global expression correlation between UXT and all expressed protein-coding genes (All PCG) was used as background. (E, F, G, H, I, and J) PBMCs were isolated from the blood sample of SLE patients (n = 5). PBMCs were transfected with control vectors (Vec) or UXT expression plasmids (UXT) by electroporation. Then, UXT, IFNB, CXCL10, ISG15, ISG54, and ISG56 mRNA were measured by real-time PCR. Graphs show the mean ± SEM, and the data shown are representative of three independent experiments. *p < 0.05; **p < 0.01; ***p < 0.001 (Two-tailed t-test).
We further examined the role of UXT in a TMPD induced murine model of lupus, which is one of the most commonly utilized murine lupus model [Citation35]. Compared with control mice, uxt cKO mice exhibited a heightened TMPD-induced expression of ISGs, such as Ifit1, Ifit3, Rsad2, Isg15 and Gbp6 (Figure S5A), which was in line with the negative role of UXT in regulating the expression of ISGs. Lupus nephritis is one of the pathological characteristics of SLE, which is characterized by glomerular immune complex deposition and accumulation of urea nitrogen and creatinine [Citation36]. We observed uxt cKO mice exhibited significantly increased levels of creatinine and urea nitrogen relative to that of control mice after TMPD treatment (Figure S5B-C). In addition, uxt cKO mice also showed elevated glomerular IgG deposition compared with control mice (Figure S5D). Collectively, these data showed that UXT deficiency led to increased expression of ISGs and signs of exacerbated experimental lupus nephritis in TMPD induced murine lupus model.
Discussion
In this study, we uncovered that UXT was a vital negative regulator of STING1-mediated type I IFN signaling. Through promoting autophagic degradation of STING1, UXT was of importance in preventing the over activation of the CGAS-STING1 signaling mediated excessive IFNs (). Mechanistically, UXT specifically interacted with STING1 and enhanced STING1 degradation through selective autophagy after DNA mimics or cGAMP stimulation. UXT promoted the autophagic degradation of STING1 by facilitating the interaction of SQSTM1 and STING1. Pathologically, the expression of UXT is impaired in leukocytes and PBMCs of SLE patients, and the replenish of UXT suppressed the production of type I IFNs and ISGs in the PBMCs of SLE patients.
Figure 8. The working model of the negative regulation of CGAS-STING1 signaling pathway by UXT.
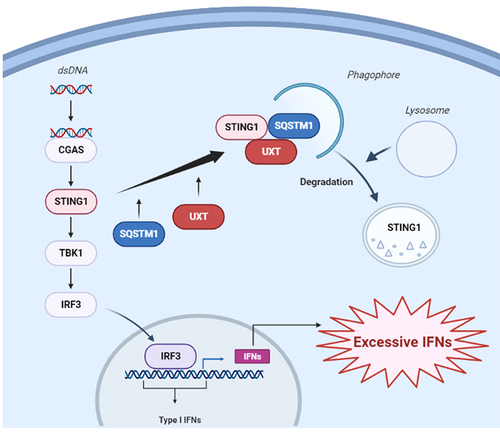
The connection between the CGAS-STING1 signaling and autophagy is intimate: the activation of the CGAS-STING1 signaling induces autophagy, as a cell-autonomous defense mechanism. In the meantime, the CGAS-STING1 signaling is also regulated by autophagy components [Citation37]. Not only canonical autophagy plays an essential role in the formation of STING1-mediated autophagic vesicle, but also the activation of STING1 can induce a non-canonical autophagy response requiring only selective autophagy machinery components [Citation16–18,Citation38]. The STING1-autophagy pathway was also reported to drive an autophagic cell death program to prevent tumor cell outgrowth [Citation39]. In addition, autophagy regulators also feedback on the regulation of STING1 activity by promoting STING1 lysosomal degradation to avoid the over activation of STING1 [Citation16,Citation38]. The cells lacking autophagy proteins or exhibiting impaired autophagy activity display increased production of type I interferon [Citation38]. Our finding provided a new insight into the mechanism regarding STING1 turnover in the process of autophagy: UXT promoted more efficient autophagic degradation of STING1 to prevent over-productive type I IFNs through facilitating the interaction of SQSTM1 and STING1. However, the detailed network of STING1-autophagy is still incomplete and required further exploration.
SLE is characterized by elevated levels of type I IFNs and ISGs, which has been implicated in pathogenesis and disease activity. Intriguingly, a subset of SLE patients has elevated levels of cGAMP in the blood samples and disease activity was higher in SLE patients with cGAMP compared to those without cGAMP. These observations demonstrated that the CGAS-STING1 pathway could be a critical contributor to the production of type I IFN and disease pathogenesis [Citation40]. In addition, serum collected from SLE patients was shown to induce type I interferon production via STING1, indicating the aberrant STING1 activity is an important pathogenic factor of SLE and providing insight into how the STING1 pathway may augment or accelerate disease symptoms [Citation41]. In this study, we found that UXT, a negative regulator of STING1, was significantly downregulated in the leukocytes and PBMCs of SLE patients through integrative analysis of several large-scale gene expression profiles of four SLE cohorts. Furthermore, a remarkably negative correlation was observed between UXT and type I IFN signature in SLE. Clinically, inhibiting the production of type I IFNs has been regarded as a promising strategy in the treatment of SLE [Citation34,Citation42]. Therefore, it should be noted that the overexpression of UXT significantly decreased the production of type I IFNs and ISGs in the PBMCs of SLE patients. Although SLE represents a heterogeneous disease, we found UXT was consistently impaired in all four independent SLE cohorts. Hopefully, UXT may represent a common potential target for treating aberrant type I interferon activity in SLE patients.
Materials and methods
Mice
C57BL/6 mice were purchased from the Model Animal Research Center of Nanjing University. The mice were maintained under specific pathogen-free conditions at the Center for New Drug Safety Evaluation and Research, China Pharmaceutical University. The uxt cKO mice were generated by mating between Lyz2-cre and Uxtflox/flox mice. The Lyz2-cre mice were gifted from Guangxun Meng (Chinese Academy of Sciences). Uxtflox mice were generated with CRISPR-Cas9-mediated homologous recombination of a 2289-bp double-stranded DNA donor containing two loxP sites flanking exon 3 [Citation20]. Age-matched Uxtfl/fl mice were used as a control. All genotypes were determined by PCR using T5 Direct PCR Kit (Tsingke, TSE012). All animal experiments were performed in accordance with the National Institutes of Health Guide for the Care and Use of Laboratory Animals. The protocol was approved by the Institutional Animal Care and Use Committee of China Pharmaceutical University and the Institutional Ethics Committee of China Pharmaceutical University (Approval Number 2021–03-009).
Cell culture
The HEK293 (CRL-1573), HEK293T (CRL-3216). and MEF (SCRC-1008) cell lines were obtained from the American Type Culture Collection (ATCC). HEK293, HEK293T and MEF cell lines were maintained in Dulbecco’s modified Eagle’s medium (Thermo Fisher Scientific, 11,210,006; DMEM) containing 10% fetal bovine serum (Thermo Fisher Scientific, 12,484,028; FBS) under a humidified atmosphere of 5% CO2 at 37°C. BMDMs were prepared as described previously [Citation43].
Isolation of peripheral blood mononuclear cells from SLE patients
Blood was drawn from SLE patients and collected for isolation of PBMCs using Ficoll-plaque (GE Healthcare Lifesciences, 17–1440-02). PBMCs were stored at −80°C. The study was conducted according to the principles of the Declaration of Helsinki and approved by the Institutional Review Board of the Medical ethic committee, The 2nd Affiliated Hospital of Nanjing Medical University, in accordance with its guidelines for the protection of human subjects. Specifically, the Institutional Review Board approved the collection of blood samples for this study; the acquisition of samples was conducted in accordance with the guidelines for the protection of human subjects. Written informed consent was obtained from each participant (Approval Number [2021]-KY-079-01).
Antibodies and reagents
The following antibodies were used: anti-UXT (Invitrogen, PA5-18,852; Usbiological, 515,686; Sigma-Aldrich, AV51213; Everest Biotech, EB08231), anti-HA (Santa Cruz Biotechnology, sc-7392; Invitrogen, PA1-985), anti-Flag (ABclonal, AE004; Sigma-Aldrich, F3165), anti-MYC (Santa Cruz Biotechnology, sc-40), anti-STING1 (Cell Signaling Technology, 9664S; R&D Systems, AF6516, MAB7169), anti-GAPDH (Santa Cruz Biotechnology, sc-32,233), anti-LC3B (Cell Signaling Technology, 3868S), anti-IRF3 (Santa Cruz Biotechnology, sc-9082; Cell Signaling Technology, D83B9), anti-p-IRF3 (Cell Signaling Technology, 4D4G), anti-SQSTM1 (Cell Signaling Technology, 23214S; Genetex, GTX100685; Santa Cruz Biotechnology, sc-48,402), anti-ACTB/β-actin (Cell Signaling Technology, 4967S), normal mouse IgG (Santa Cruz Biotechnology, sc-2025), normal rabbit IgG (Santa Cruz Biotechnology, sc-2027), normal goat IgG (Santa Cruz Biotechnology, sc-2028). HTDNA (D6898) was obtained from Sigma-Aldrich. cGAMP (tlrl-nacga23-1) was from Invivogen and was delivered into cultured cells by digitonin (Sigma-Aldrich, 11,024–24-1) permeabilization method as previously described [Citation44]. ISD was prepared by annealing equimolar amounts of sense and antisense DNA oligonucleotides at 95°C for 10 min before cooling to room temperature. Oligonucleotides used as follows: ISD (sense), 5’-TAC AGA TCT ACT AGT GAT CTA TGA CTG ATC TGT ACA TGA TCT ACA-3’; ISD (antisense), 5’-TGT AGA TCA TGT ACA GAT CAG TCA TAG ATC ACT AGT AGA TCT GTA-3’.
Real-time PCR
Cell was transfected and stimulated, then cell pellets were collected. Total cellular RNA was isolated using reagent (Invitrogen, 15,596,018; Accurate Biotechnology [Hunan] Co., Ltd, AG21023, SteadyPure Quick RNA Extraction Kit) according to the manufacturer’s instructions, then reverse transcription was performed using a reverse transcription kit (Vazyme, R223-01). The quantification of gene transcripts was performed by real-time PCR using SYBR Green PCR mix (Vazyme, Q331-02/03). All values were normalized to the level of Gapdh mRNA. The primers used were listed in Table S4.
Western blot and immunoprecipitation assay
Cell pellets were collected and resuspended in lysis buffer (50 mM Tris-HCl, pH 7.4, 150 mM NaCl, 1 mM EDTA, 0.5% NP40 [Sigma-Aldrich, NP40], 0.25% Na-deoxycholate [Sigma-Aldrich, D6750], 1 mM Na3VO4 [Sigma-Aldrich, 450243], 0.1% SDS [Sigma-Aldrich, L3771], 0.1 mM PMSF [Sigma-Aldrich, PMSF-RO], Roche complete protease inhibitor set [Roche, 04693116001]). The resuspended cell pellet was vortexed for 20s and then incubated on ice for 20 min, followed by centrifugation. Afterward, supernatants were collected for subsequent western blot analysis. For immunoprecipitation assay, the cell lysate was incubated with appropriate antibodies for 4 h or overnight at 4°C before adding protein A/G agarose beads (Smart Lifesciences, SA032005) for another 2 h. The beads were washed three times with the lysis buffer and eluted with SDS-loading buffer for 5 min.
Proximity ligation assay
PLA was performed as per manufacturer’s instructions (Sigma-Aldrich, DUO82040, DUO92002, DUO92004, DUO92008, DUO82049). The procedure was carried out as described previously [Citation45].
HSV-1 infection assay
Control and uxt cKO mice were injected intravenously with HSV-1, and their survival rates were monitored. The abundance of IFNB protein were detected by Veri-Kine Kit (PBL Assay Science, 42,400–1) according to the manufacturer’s instruction.
TMPD-induced mice model of SLE
The mice model of SLE was induced by i.p. injection of 0.5 ml TMPD (Sigma-Aldrich, P9622) in 10-wk-old control or uxt cKO mice for 14 weeks. 10-wk-old control or uxt cKO mice received 0.5 ml mineral oil (Beyotime Biotechnology, ST275) at the same time as control. The urine of mice was collected for creatinine and urea nitrogen analysis using a creatinine assay kit (Abcam, ab204537) and urea nitrogen detection kit (Solarbio, BC1535) according to the manufacturer’s instructions, respectively.
Plasmids, siRNA oligos, and cell transfection
UXT, STING1, CGAS, IRF3, TBK1, SQSTM1, NBR1, OPTN, and CALCOCO2 cDNAs were obtained using standard PCR techniques from thymus cDNA library and subsequently inserted into mammalian expression vectors as indicated. The IRF3 5D was a gift from Professor John Hiscott (McGill University, Montreal, Quebec, Canada) [Citation46]. The siRNA oligos were synthesized by GenePharma: the sequence of UXT siRNA as described previously [Citation20,Citation22]. Cells were transfected with siRNA oligos using Lipofectamine 3000 (Invitrogen, L3000015) and then incubated for 48 hours before further analysis. The plasmids were introduced into cells using Lipofectamine 3000, and then cells were cultured for 24 h before further analysis. The electroporation of PBMCs was performed using P3 Primary Cell 4D-NucleofectorTM X Kit L (Lonza, V4XP-3024) according to the manufacturer’s instructions.
Dual luciferase reporter assay
Cells were seeded in 12-well plates and transfected with reporter gene plasmids (100 ng) combined with siRNAs and other constructs as indicated. The total amount of DNA was kept constant by supplementing with empty vectors. pTK-Renilla reporter plasmid (2 ng; Promega, E2241) was added to normalize transfection efficiency. Luciferase activity was analyzed with the Dual Luciferase Reporter Assay Kit (Promega, E1910) [Citation47].
RNA-Seq experiments and analysis
After cGAMP stimulation, total RNA was extracted from control and Uxt-knockdown MEF cells, control and UXT-overexpression MEF cells, or control and uxt cKO BMDM cells using the Trizol reagent (Invitrogen, 15596018) and prepared into cDNA library according to the standard Illumina RNA-seq instruction. The generated cDNA library was sequenced in 2 × 150 bp paired-end layout using Illumina HiSeq2500. Library preparation and sequencing were performed by Novogene (Beijing). To calculate gene expression changes between control and Uxt-knockdown MEFs after cGAMP stimulation, the raw RNA-seq data were preprocessed using Trimmomatic to remove low-quality reads and potential adaptors contamination [Citation48]. The resulting reads in high-quality were further mapped to the mouse genome (mm10) using HISAT2 with default parameters [Citation49]. The mouse genome (mm10) was downloaded from Ensembl [Citation50]. The gene expression quantification was conducted with feature counts using uniquely mapped reads, based on ensemble mouse gene annotation [Citation51]. The log2-transformed gene expression fold-changes (LFC) and significantly differentially expressed (DE) genes were calculated using edgeR [Citation52] after TMM normalization (FDR < 0.05). The list of known ISGs of mouse was downloaded from [Citation53]. The DE ISGs were obtained by overlapping ISGs with DE genes. The same analysis was performed based on RNA-seq data between control and UXT-overexpression MEF cells, and between control and uxt cKO BMDM cells. All original RNA-seq data are deposited in GEO database with accession number: GSE175928.
Functional enrichment analyses
The analysis of gene ontology (GO) enrichment of significantly up- and down-regulated DE genes between control and Uxt-knockdown MEFs after cGAMP stimulation was performed using David Bioinformatics. The significantly enriched GO items of the biological process (BP) category were selected based on the intersection of the following two criteria: (1) Benjamini & Hochberg (BH) adjusted p-value <0.01; (2) FDR <0.01. All expressed genes in control and Uxt-knockdown MEFs were used as background. The same analysis was performed between control and UXT-overexpression MEF cells, and between control and uxt cKO BMDM cells.
Integrative analysis of gene expression profiles of SLE cohorts
To examine the expression of UXT in SLE patients comprehensively, we downloaded four large-scale gene expression profiles of leukocytes and PBMCs of 1,211 SLE patients and 139 healthy donors (HD), including three datasets measured based on RNA-seq: GSE112087 (31 SLE, 20 HD) [Citation32], GSE72509 (99 SLE, 18 HD) [Citation33], GSE49454 (157 SLE, 20 HD) [Citation31], and one dataset measured using microarray: GSE65391 (924 SLE, 72 HD) [Citation30]. For the above 3 RNA-seq datasets, we downloaded the raw sequencing data and performed gene expression quantification using the combination of Trimmomatic [Citation48], HISAT2 [Citation49], and feature counts [Citation51], and further normalized gene expression into CPM using the TMM method of edgeR [Citation52]. The sequences of the human genome (hg38) and gene annotation file were downloaded from ensembl [Citation50]. This uniform quantification procedure enabled largely unbiased gene expression quantification for the integrative analysis. We downloaded normalized gene expression of microarray data from GSE65391. The expression difference of UXT between SLE and HD was calculated using negative binomial test for 3 RNA-seq datasets, and using wilcoxon rank sum test for the microarray data. We estimated the expression of UXT in T cells, B cells, and monocytes of pooled SLE samples and pooled HD samples based on the data downloaded from NODE (OEP000216) [Citation34]. The type I IFN signature was measured using the well-established 21 ISGs (also referred to as IFNG-21 panel, IFI27, IFI6, IFITM3, ISG15, OAS3, OAS2, IFI44L, IFI44, RSAD2, LY6E, LAMP3, SIGLEC1, SPATS2L, USP18, IFIT1, RTP4, IFIT3, MX1, OAS1, EPSTI1, HERC5) [Citation54]. We calculated pairwise gene expression correlation between UXT and these 21 ISGs (Pearson correlation) and corrected the obtained p-value into FDR using p.adjust function of R.
Statistical analysis
Except for statistical tests applied to analyze RNA-seq data and downstream functional enrichment, the rest of the statistical analysis was performed using GraphPad Prism 6.0, Microsoft Excel computer programs. The results are expressed as mean ± SEM for experiments conducted at least in triplicates. Student’s t-test was used to assess the difference between two groups, and a value of p < 0.05 is considered to be statistically significant.
Supplemental Material
Download Zip (6.3 MB)Acknowledgments
We thank Dr. Yong Yang (The School of Basic Medical Sciences and Clinical Pharmacy, China Pharmaceutical University) and Dr. Xianjing Li (The Institute of Pharmaceutical Sciences, China Pharmaceutical University) for technical support of electroporation.
Disclosure statement
No potential conflict of interest was reported by the author(s).
Supplementary material
Supplemental data for this article can be accessed online at https://doi.org/10.1080/15548627.2022.2076192.
Additional information
Funding
Related Research Data
References
- Paludan SR, Bowie AG. Immune sensing of DNA. Immunity. 2013;38(5):870–880.
- Kwon J, Bakhoum SF. The cytosolic DNA-sensing cGAS-STING pathway in cancer. Cancer Discov. 2020;10(1):26–39.
- Hopfner KP, Hornung V. Molecular mechanisms and cellular functions of cGAS-STING signalling. Nat Rev Mol Cell Biol. 2020;21(9):501–521.
- Zhou R, Xie X, Li X, et al. The triggers of the cGAS-STING pathway and the connection with inflammatory and autoimmune diseases. Infect Genet Evol. 2020;77:104094.
- Motwani M, Pesiridis S, Fitzgerald KA. DNA sensing by the cGAS-STING pathway in health and disease. Nat Rev Genet. 2019;20(11):657–674.
- Yan N. Immune diseases associated with TREX1 and STING dysfunction. J Interferon Cytokine Res. 2017;37(5):198–206.
- Kumar V. A STING to inflammation and autoimmunity. J Leukoc Biol. 2019;106(1):171–185.
- Abe T, Shapira SD. Negative regulation of cytosolic sensing of DNA. Int Rev Cell Mol Biol. 2019;344:91–115.
- Wan D, Jiang W, Hao J. Research advances in how the cGAS-STING pathway controls the cellular inflammatory response. Front Immunol. 2020;11:615.
- Cheng Z, Dai T, He X, et al. The interactions between cGAS-STING pathway and pathogens. Signal Transduct Target Ther. 2020;5(1):91.
- Galluzzi L, Baehrecke EH, Ballabio A, et al. Molecular definitions of autophagy and related processes. EMBO J. 2017;36(13):1811–1836.
- Noda NN, Inagaki F. Mechanisms of autophagy. Annu Rev Biophys. 2015;44:101–122.
- Dikic I, Elazar Z. Mechanism and medical implications of mammalian autophagy. Nat Rev Mol Cell Biol. 2018;19(6):349–364.
- New J, Thomas SM. Autophagy-dependent secretion: mechanism, factors secreted, and disease implications. Autophagy. 2019;15(10):1682–1693.
- Mitzel DN, Lowry V, Shirali AC, et al. Age-enhanced endoplasmic reticulum stress contributes to increased Atg9A inhibition of STING-mediated IFN-β production during streptococcus pneumoniae infection. J Immunol. 2014;192(9):4273–4283.
- Saitoh T, Fujita N, Hayashi T, et al. Atg9a controls dsDNA-driven dynamic translocation of STING and the innate immune response. Proc Natl Acad Sci U S A. 2009;106(49):20842–20846.
- Prabakaran T, Bodda C, Krapp C, et al. Attenuation of c GAS - STING signaling is mediated by a p62/ SQSTM 1-dependent autophagy pathway activated by TBK1. EMBO J. 2018;37(8). doi:10.15252/embj.201797858.
- Liu D, Wu H, Wang C, et al. STING directly activates autophagy to tune the innate immune response. Cell Death Differ. 2019;26(9):1735–1749.
- Gui X, Yang H, Li T, et al. Autophagy induction via STING trafficking is a primordial function of the cGAS pathway. Nature. 2019;567(7747):262–266.
- Pan M, Yin Y, Wang X, et al. Mice deficient in UXT exhibit retinitis pigmentosa-like features via aberrant autophagy activation. Autophagy. 2021;17(8):1873–1888.
- Zhou Y, Ge R, Wang R, et al. UXT potentiates angiogenesis by attenuating notch signaling. Development. 2015;142(4):774–786.
- Sun S, Tang Y, Lou X, et al. UXT is a novel and essential cofactor in the NF-kappaB transcriptional enhanceosome. J Cell Biol. 2007;178(2):231–244.
- Ma Z, Jacobs SR, West JA, et al. Modulation of the cGAS-STING DNA sensing pathway by gammaherpesviruses. Proc Natl Acad Sci U S A. 2015;112(31):E4306–15.
- Balka KR, De Nardo D. Molecular and spatial mechanisms governing STING signalling. FEBS J. 2020;288(19):5504–5529.
- Ji CH, Kwon YT. Crosstalk and interplay between the ubiquitin-proteasome system and autophagy. Mol Cells. 2017;40(7):441–449.
- Sun-Wang JL, Ivanova S, Zorzano A. The dialogue between the ubiquitin-proteasome system and autophagy: implications in ageing. Ageing Res Rev. 2020;64:101203.
- Seranova E, Ward C, Chipara M, et al. In vitro screening platforms for identifying autophagy modulators in mammalian cells. Methods Mol Biol. 2019;1880:389–428.
- Gubas A, Dikic I. A guide to … the regulation of selective autophagy receptors. FEBS J. 2021;289:75–89.
- Baechler EC, Batliwalla FM, Karypis G, et al. Interferon-inducible gene expression signature in peripheral blood cells of patients with severe lupus. Proc Natl Acad Sci U S A. 2003;100(5):2610–2615.
- Banchereau R, Hong S, Cantarel B, et al. Personalized immunomonitoring uncovers molecular networks that stratify lupus patients. Cell. 2016;165(3):551–565.
- Chiche L, Jourde-Chiche N, Whalen E, et al. Modular transcriptional repertoire analyses of adults with systemic lupus erythematosus reveal distinct type I and type II interferon signatures. Arthritis Rheumatol. 2014;66(6):1583–1595.
- Figgett WA, Monaghan K, Ng M, et al. Machine learning applied to whole-blood RNA-sequencing data uncovers distinct subsets of patients with systemic lupus erythematosus. Clin Transl Immunol. 2019;8(12):e01093.
- Hung T, Pratt GA, Sundararaman B, et al. The Ro60 autoantigen binds endogenous retroelements and regulates inflammatory gene expression. Science. 2015;350(6259):455–459.
- Furie R, Khamashta M, Merrill JT, et al. Anifrolumab, an anti-interferon-α receptor monoclonal antibody, in moderate-to-severe systemic lupus erythematosus. Arthritis Rheumatol. 2017;69(2):376–386.
- Reeves WH, Lee PY, Weinstein JS, et al. Induction of autoimmunity by pristane and other naturally occurring hydrocarbons. Trends Immunol. 2009;30(9):455–464.
- Davidson A. What is damaging the kidney in lupus nephritis? Nat Rev Rheumatol. 2016;12(3):143–153.
- Decout A, Katz JD, Venkatraman S, et al. The cGAS-STING pathway as a therapeutic target in inflammatory diseases. Nat Rev Immunol. 2021;21:1–22.
- Konno H, Konno K, Barber GN. Cyclic dinucleotides trigger ULK1 (ATG1) phosphorylation of STING to prevent sustained innate immune signaling. Cell. 2013;155(3):688–698.
- Nassour J, Radford R, Correia A, et al. Autophagic cell death restricts chromosomal instability during replicative crisis. Nature. 2019;565(7741):659–663.
- An J, Durcan L, Karr RM, et al. Expression of cyclic GMP-AMP synthase in patients with systemic lupus erythematosus. Arthritis Rheumatol. 2017;69(4):800–807.
- Kato Y, Park J, Takamatsu H, et al. Apoptosis-derived membrane vesicles drive the cGAS-STING pathway and enhance type I IFN production in systemic lupus erythematosus. Ann Rheum Dis. 2018;77(10):1507–1515.
- Khamashta M, Merrill JT, Werth VP, et al. Sifalimumab, an anti-interferon-α monoclonal antibody, in moderate to severe systemic lupus erythematosus: a randomised, double-blind, placebo-controlled study. Ann Rheum Dis. 2016;75(11):1909–1916.
- Lou X, Sun S, Chen W, et al. Negative feedback regulation of NF-κB action by CITED2 in the nucleus. J Immunol. 2011;186(1):539–548.
- Girardin SE, Boneca IG, Carneiro LAM, et al. Nod1 detects a unique muropeptide from gram-negative bacterial peptidoglycan. Science. 2003;300(5625):1584–1587.
- Li C, Zhang L, Qian D, et al. RNF111-facilitated neddylation potentiates cGAS-mediated antiviral innate immune response. PLoS Pathog. 2021;17(3):e1009401.
- Grandvaux N, Servant MJ, TenOever B, et al. Transcriptional profiling of interferon regulatory factor 3 target genes: direct involvement in the regulation of interferon-stimulated genes. J Virol. 2002;76(11):5532–5539.
- Zhang L, Wei N, Cui Y, et al. The deubiquitinase CYLD is a specific checkpoint of the STING antiviral signaling pathway. PLoS Pathog. 2018;14(11):e1007435.
- Bolger AM, Lohse M, Usadel B. Trimmomatic: a flexible trimmer for illumina sequence data. Bioinformatics. 2014;30(15):2114–2120.
- Kim D, Paggi JM, Park C, et al. Graph-based genome alignment and genotyping with HISAT2 and HISAT-genotype. Nat Biotechnol. 2019;37(8):907–915.
- Zerbino DR, Achuthan P, Akanni W, et al. Ensembl 2018. Nucleic Acids Res. 2018;46(D1):D754–d761.
- Liao Y, Smyth GK, Shi W. featureCounts: an efficient general purpose program for assigning sequence reads to genomic features. Bioinformatics. 2014;30(7):923–930.
- Robinson MD, McCarthy DJ, Smyth GK. edgeR: a bioconductor package for differential expression analysis of digital gene expression data. Bioinformatics. 2010;26(1):139–140.
- Wu X, Dao Thi VL, Huang Y, et al. Intrinsic immunity shapes viral resistance of stem cells. Cell. 2018;172(3):423–438.e25.
- Liu CX, Li X, Nan F, et al. Structure and degradation of circular RNAs regulate PKR activation in innate immunity. Cell. 2019;177(4):865–880.e21.