
ABSTRACT
CLEC16A regulates mitochondrial health through mitophagy and is associated with over 20 human diseases. However, the key structural and functional regions of CLEC16A, and their relevance for human disease, remain unknown. Here, we report that a disease-associated CLEC16A variant lacks a C-terminal intrinsically disordered protein region (IDPR) that is critical for mitochondrial quality control. IDPRs comprise nearly half of the human proteome, yet their mechanistic roles in human disease are poorly understood. Using carbon detect NMR, we find that the CLEC16A C terminus lacks secondary structure, validating the presence of an IDPR. Loss of the CLEC16A C-terminal IDPR in vivo impairs mitophagy, mitochondrial function, and glucose-stimulated insulin secretion, ultimately causing glucose intolerance. Deletion of the CLEC16A C-terminal IDPR increases CLEC16A ubiquitination and degradation, thus impairing assembly of the mitophagy regulatory machinery. Importantly, CLEC16A stability is dependent on proline bias within the C-terminal IDPR, but not amino acid sequence order or charge. Together, we elucidate how an IDPR in CLEC16A regulates mitophagy and implicate pathogenic human gene variants that disrupt IDPRs as novel contributors to diabetes and other CLEC16A-associated diseases.
Abbreviations : CAS: carbon-detect amino-acid specific; IDPR: intrinsically disordered protein region; MEFs: mouse embryonic fibroblasts; NMR: nuclear magnetic resonance.
Introduction
CLEC16A (C-type lectin domain containing 16A) is a gene associated with nearly 20 human diseases, including type 1 diabetes, cardiovascular disease, and multiple sclerosis [Citation1–5]. CLEC16A regulates mitochondrial quality control by clearing damaged or aged mitochondria through a type of selective autophagy, termed mitophagy [Citation6,Citation7]. CLEC16A forms and stabilizes a tripartite mitophagy complex with the E3 ubiquitin ligase RNF41/Nrdp1 and the deubiquitinase USP8, which together regulate mitophagic flux by controlling the activity of the mitophagy effector PRKN/Parkin [Citation8,Citation9]. While CLEC16A is designated as a C-type lectin, it does not contain a C-type lectin domain and was later found to be an E3 ubiquitin ligase, suggesting its name is a misnomer [Citation8]. Genetic or pharmacologic disruption of CLEC16A impairs mitochondrial autophagy and mitochondrial function in multiple cell types, which reduces insulin secretion in pancreatic β-cells, ultimately causing hyperglycemia and diabetes [Citation6,Citation8–11]. Whereas CLEC16A has a well-defined role in regulating mitophagy, and has been characterized as an E3 ubiquitin ligase, validated structural and functional domains within CLEC16A have never been found. Thus, the critical structural and functional regions of CLEC16A, and their relevance to disease pathogenesis, are unknown.
In humans, CLEC16A encodes two consensus isoforms generated by alternative splicing, a 24-exon full-length transcript, and a shorter 21-exon transcript variant that encodes a protein with a truncated C terminus. A single nucleotide polymorphism that is associated with increased expression of the shorter, C-terminal truncated CLEC16A isoform in the thymus is known to increase risk for both diabetes and multiple sclerosis [Citation12,Citation13]. Additionally, several CLEC16A disease-associated single nucleotide polymorphisms promote increased expression of the C-terminal deficient isoform in a variety of cell types, acting as splicing quantitative trait loci [Citation14,Citation15]. These observations led us to hypothesize that the CLEC16A C terminus directly contributes to CLEC16A function and protection from disease.
The C terminus of CLEC16A does not share homology to known protein domains; rather, it is suggested to be an intrinsically disordered protein region (IDPR). IDPRs lack secondary structure and exist as an ensemble of flexible inter-converting conformations [Citation16,Citation17]. Although the roles of IDPRs have only recently begun to be explored, these domains support critical biological functions, including signal transduction, protein complex assembly, and protein stability [Citation16–20]. Disruption or dysregulation of IDPRs is associated with several human diseases, further suggesting their functional importance [Citation21–25]. However, the molecular mechanisms connecting loss of IDPRs to disease pathogenesis are poorly understood. Moreover, the genetic, functional, and physiological connections between disruption to IDPRs and diabetes pathogenesis are completely unknown.
Here, we investigate how the putative CLEC16A C-terminal IDPR contributes to CLEC16A structure, function, and glucose homeostasis. We validated that the C-terminal region lost in the human CLEC16A disease variant is an IDPR using rigorous in silico, biochemical, and NMR-based approaches. The CLEC16A C-terminal IDPR was crucial for glucose homeostasis by promoting glucose-stimulated insulin secretion, mitochondrial function, and mitophagy in β-cells. Loss of the CLEC16A C-terminal IDPR reduced CLEC16A stability due to increased ubiquitination and degradation, which impaired assembly of the CLEC16A-RNF41/Nrdp1-USP8 mitophagy regulatory complex. Finally, we determined that the CLEC16A C-terminal IDPR depends on its proline enrichment, but not primary amino acid sequence order or charge, to stabilize CLEC16A. Together, we define the molecular mechanisms by which a disrupted IDPR in a human CLEC16A disease variant destabilizes CLEC16A, impairs β-cell mitophagy, and contributes to diabetes.
RESULTS
The CLEC16A C terminus is an intrinsically disordered protein region
To understand the importance of the C-terminal region of CLEC16A that is lost in the disease variant, we first investigated the presence of conserved functional domains. Bioinformatic software was used to predict domains against the Pfam database of known functional protein domains [Citation26]. This analysis did not identify any conserved functional domains in the CLEC16A C terminus () [Citation26]. CLEC16A does contain an N-terminal “FPL” domain (). However, the 150 amino acid “FPL” domain has no known function and is only found in CLEC16A orthologs. Of note, despite its known enzymatic activity as a ubiquitin ligase, CLEC16A also lacks a consensus E3 ligase domain [Citation8]. Interestingly, however, the CLEC16A C terminus was predicted to be an intrinsically disordered protein region (IDPR; ).
Figure 1. A human CLEC16A disease variant lacks a C-terminal IDPR. (A) Domain prediction of the human CLEC16A disease variant and human full-length CLEC16A generated by Pfam. The human CLEC16A disease variant is aligned beneath, and the shaded region represents sequence differing from human full-length CLEC16A. “FPL” is a domain of unknown function enriched in the amino acids phenylalanine (F), proline (P), and leucine (L). (B) Mean disorder score from IUPred 2, Disprot VSL2B, and DISOPRED 3.1 of full-length CLEC16A and the human CLEC16A disease variant. Putative disordered regions were identified with a probability threshold of >0.6. (C) Residue composition bias of the mouse CLEC16A C terminus generated with Composition Profiler, comparing residue enrichment of the CLEC16A C terminus vs Swiss-PROT 51 database. Significantly enriched serine (blue) and proline (pink) residues are highlighted. * p < 0.05. (D) Mouse CLEC16A C terminus residues (AA 892–1050) are listed in FASTA format. Serine residues are highlighted in blue, and proline residues are in pink. (E) Representative western blot (WB) in HEK293T cells transfected with Flag-CLEC16A constructs (full-length CLEC16A, CLEC16A lacking the C terminus [CLEC16A ∆C, AA 1–892], or CLEC16A C terminus-only [AA 892–1050]). VCL (vinculin) serves as a loading control. Expected molecular mass (MM) noted along top. Visualized molecular mass denoted by ladder. n = 3/group. (F) 1H-15N HSQC spectra of recombinant CLEC16A C terminus (AA 892–1050). Spectra clusters near 1H 8ppm, consistent with being an IDPR. (G) Assessment of secondary structure propensity of residue types identified by NMR. Secondary structure is shown as the difference between 13Cα and 13Cβ secondary chemical shifts. Stretches of values > 2 ppm indicate α-helix, values < 2 ppm indicate β-sheet.
![Figure 1. A human CLEC16A disease variant lacks a C-terminal IDPR. (A) Domain prediction of the human CLEC16A disease variant and human full-length CLEC16A generated by Pfam. The human CLEC16A disease variant is aligned beneath, and the shaded region represents sequence differing from human full-length CLEC16A. “FPL” is a domain of unknown function enriched in the amino acids phenylalanine (F), proline (P), and leucine (L). (B) Mean disorder score from IUPred 2, Disprot VSL2B, and DISOPRED 3.1 of full-length CLEC16A and the human CLEC16A disease variant. Putative disordered regions were identified with a probability threshold of >0.6. (C) Residue composition bias of the mouse CLEC16A C terminus generated with Composition Profiler, comparing residue enrichment of the CLEC16A C terminus vs Swiss-PROT 51 database. Significantly enriched serine (blue) and proline (pink) residues are highlighted. * p < 0.05. (D) Mouse CLEC16A C terminus residues (AA 892–1050) are listed in FASTA format. Serine residues are highlighted in blue, and proline residues are in pink. (E) Representative western blot (WB) in HEK293T cells transfected with Flag-CLEC16A constructs (full-length CLEC16A, CLEC16A lacking the C terminus [CLEC16A ∆C, AA 1–892], or CLEC16A C terminus-only [AA 892–1050]). VCL (vinculin) serves as a loading control. Expected molecular mass (MM) noted along top. Visualized molecular mass denoted by ladder. n = 3/group. (F) 1H-15N HSQC spectra of recombinant CLEC16A C terminus (AA 892–1050). Spectra clusters near 1H 8ppm, consistent with being an IDPR. (G) Assessment of secondary structure propensity of residue types identified by NMR. Secondary structure is shown as the difference between 13Cα and 13Cβ secondary chemical shifts. Stretches of values > 2 ppm indicate α-helix, values < 2 ppm indicate β-sheet.](/cms/asset/bf6f03ed-56b2-4edb-b38f-82f37f54c1f2/kaup_a_2080383_f0001_oc.jpg)
To further evaluate the presence of a putative IDPR within the CLEC16A C terminus, we calculated the mean disorder score from three independent disorder-prediction algorithms IUPRED2, Disprot VSL2B, and DISOPRED 3.1 [Citation27–29]. This analysis identified two conserved predicted IDPRs within human and mouse CLEC16A, including the C-terminal region that is lost in the CLEC16A disease variant ( and S1). As a complementary approach, we compared the amino acid composition of the mouse CLEC16A C terminus to that of validated IDPRs. Proline and serine are well-known disorder-promoting amino acids and are significantly enriched in the disordered protein database Disprot relative to the expected distribution of amino acids found in nature, approximated by the SwissProt database (Figure S2) [Citation30–32]. The CLEC16A C terminus is significantly enriched in the disorder-promoting amino acids proline and serine relative to the SwissProt Database (). Thus, several independent approaches predict the CLEC16A C terminus to be an IDPR.
To validate the presence of an IDPR within the CLEC16A C terminus, we used both biochemical and biophysical techniques. IDPRs commonly exist in an extended conformation and are often enriched in charged residues, resulting in poor binding to sodium dodecyl sulfate (SDS) and slower migration on an SDS-polyacrylamide gel [Citation33,Citation34]. While Flag epitope-tagged full-length CLEC16A and a C-terminal deficient CLEC16A mutant (CLEC16A ∆C) migrated at their expected molecular mass, a CLEC16A construct encoding only the C terminus migrated more slowly, at nearly double its expected molecular mass (). We next investigated CLEC16A C-terminal structure using nuclear magnetic resonance (NMR). In an IDPR, backbone hydrogen atoms do not participate in hydrogen bonds that generate secondary structure, and instead are found in a flexible extended conformation. Thus, all backbone hydrogen atoms in an IDPR are in a similar chemical environment and are tightly clustered in the hydrogen dimension of an 1H-15N heteronuclear single quantum coherence/HSQC-NMR spectrum [Citation35]. The heteronuclear single quantum coherence-NMR spectrum of the CLEC16A C terminus was tightly clustered in the hydrogen dimension between 8–8.5 ppm, which strongly suggests that the CLEC16A C terminus is an IDPR ().
To complement our macroscopic view of the CLEC16A C terminus as an IDPR, we investigated structural features at the resolution of single amino acids using carbon-detect NMR. While we were unable to assign NMR resonance peaks to specific amino acids in the CLEC16A C terminus due to its repetitive sequence and complex spectrum, we instead were able to use carbon-detect amino-acid specific (CAS) experiments to assign amino acid types to NMR resonance peaks [Citation35]. Using CAS, we assigned amino acid types to 52 resonance peaks within the putative CLEC16A C-terminal IDPR, with identified residue types distributed throughout the C terminus (). The secondary structure character of assigned resonance peaks was measured as the difference between the offset of the chemical shift of 13C-α and 13C-β nuclei relative to that expected for each amino acid type in an IDPR (). Using this approach, stretches of values greater than or less than 2 ppm suggest α-helical or β-sheet character, respectively [Citation35,Citation36]. Within the CLEC16A C-terminal fragment, only 4 of the 52 identified residues had character consistent with secondary structure, indicating that this region is highly disordered (). Together, our in silico, biochemical, and biophysical studies strongly support the hypothesis that the C-terminal region lost in the CLEC16A disease variant is an IDPR.
The CLEC16A C-terminal IDPR is required for glucose homeostasis and β-cell function
After confirming that the C terminus of CLEC16A disrupted in the human disease variant is an IDPR, we questioned whether this region impacts the role of CLEC16A in glucose homeostasis and β-cell function. To study the function of the CLEC16A C terminus in vivo, we used a genetic mouse model lacking the CLEC16A C terminus. The Clec16a curly tail mutant (Clec16acurt) mouse carries a spontaneous four base-pair deletion within exon 22, leading to a frameshift mutation that is followed by alternatively translated residues and a premature stop codon () [Citation37–39]. The Clec16acurt mutant encodes a truncated protein lacking the C-terminal IDPR, which is highly similar to the CLEC16A disease variant ( and S1). The truncated C-terminal deficient CLEC16Acurt protein was detectable in mouse embryonic fibroblasts (MEFs) and pancreatic islets, albeit at lower levels than full length wild-type (WT) CLEC16A (). Additionally, antisera specifically recognizing the C terminus of CLEC16A were unable to detect the CLEC16Acurt mutant protein (). Clec16acurt/curt mice were born at a normal Mendelian ratio and had reduced body weight, motor impairments, and early lethality around 6 months of age, similar to previous reports (data not shown [Citation37–39]). Clec16acurt/+ heterozygous mice were indistinguishable from wild type littermates (data not shown).
Figure 2. The CLEC16A C terminus maintains glucose homeostasis and β-cell function. (A) Schematic of the CLEC16Acurt protein and human CLEC16A disease variant. Shaded region represents sequence differing from full-length mouse CLEC16A. (B) Schematic of Clec16a locus, highlighting the 4-bp deletion within exon 22 of Clec16acurt mice. The MnlI recognition sequence is underlined. (C) Representative image of MnlI restriction digest following PCR amplification of genomic DNA containing Clec16a exon 22 as visualized by agarose gel electrophoresis. The Clec16acurt mutation eliminates the MnlI digestion site. n = 4/group. (D) Representative image of CLEC16A protein levels determined by WB in Clec16a+/+ and Clec16acurt/curt MEFs utilizing CLEC16A antisera raised against an internal CLEC16A peptide. n = 3/group. (E) Representative image of CLEC16A protein levels in Clec16a+/+ and Clec16acurt/curt isolated islets utilizing CLEC16A antisera raised against an internal CLEC16A peptide. n = 3/group. (F) Representative image of CLEC16A protein levels determined by WB in Clec16a+/+ and Clec16acurt/curt MEFs utilizing CLEC16A antisera raised against a C-terminal CLEC16A peptide. ACTB serves as loading control. n = 3/group. (G) Blood glucose concentrations measured during an intraperitoneal glucose tolerance test (IPGTT) of 16-week-old Clec16a+/+ and Clec16acurt/curt littermates. n = 8 Clec16a+/+, n = 4 Clec16acurt/curt. (H) Area under curve from IPGTT in Figure 2G. (I) Blood glucose concentrations during insulin tolerance test of 9-week-old Clec16a+/+ and Clec16acurt/curt littermates. n = 3–4/group. (J) Serum insulin measured during in vivo glucose-stimulated insulin release in 11-week-old Clec16a+/+ and Clec16acurt/curt littermates. n = 4–5/group. (K) Fold glucose-stimulated insulin secretion following static incubations in 1.67 mM and 16.7 mM glucose in isolated Clec16a+/+ and Clec16acurt/curt islets from 11-week-old littermates. n = 6/group. *p < 0.05 **p < 0.01.
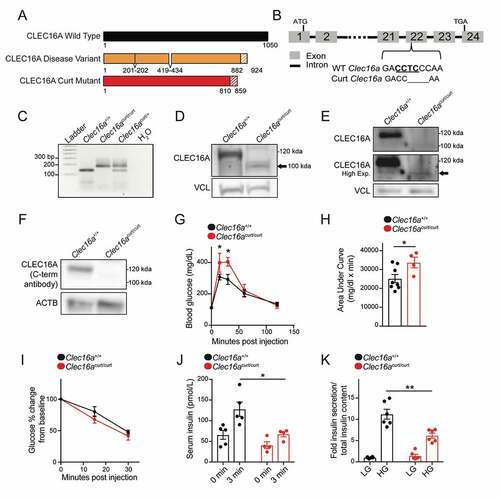
To investigate the impact of the CLEC16A C terminus on glucose homeostasis, we first performed an intraperitoneal glucose tolerance test. Clec16acurt/curt mice were glucose intolerant compared to littermate controls (). Impaired glucose tolerance can result from reduced sensitivity of peripheral tissues to insulin or reduced insulin secretion in response to glucose. Clec16acurt/curt mice had no reduction in insulin sensitivity during an insulin tolerance test (). However, Clec16acurt/curt mice secreted significantly less insulin in response to glucose stimulation both in vivo and in isolated islets (), which indicated that glucose intolerance was due to reduced β-cell insulin secretion. When compared to previous studies on β-cell or pancreas-specific Clec16a knockout mice, Clec16acurt/curt mice had a similar, yet more modest phenotype of impaired glucose homeostasis and insulin secretion [Citation6,Citation8], possibly due to the Clec16acurt mutation yielding a hypomorphic protein with reduced but not absent function. These results suggest that the CLEC16Acurt truncated protein was less functional than full-length WT CLEC16A, indicating that the CLEC16A C-terminal IDPR is critical for optimal β-cell function.
We next evaluated whether reduced insulin secretion in Clec16acurt/curt mice was due to reduced β-cell mass or insulin content. Clec16acurt/curt mice had no significant changes in β-cell mass or pancreatic insulin content proportional to body weight or pancreas weight, respectively, despite reduced body weight in Clec16acurt/curt mutants (Figure S3). Taken together, these studies indicate that the CLEC16A C-terminal IDPR regulates glucose homeostasis through control of β-cell insulin secretion.
The CLEC16A C terminus regulates β-cell mitophagy
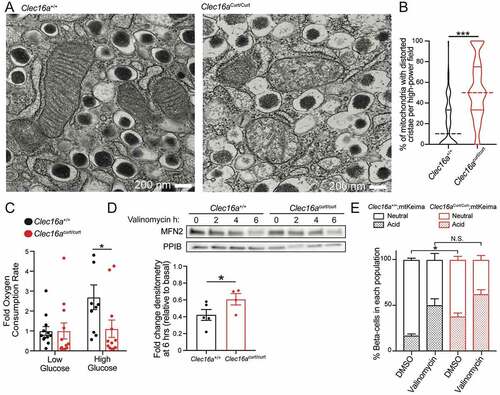
CLEC16A-mediated mitophagy maintains mitochondrial health and function in β cells, which is essential to fuel glucose-stimulated insulin secretion [Citation6,Citation40]. Thus, we next assessed how loss of the CLEC16A C-terminal IDPR impacted β-cell mitochondria, as impaired mitophagy can lead to an accumulation of dysfunctional and dysmorphic mitochondria that would otherwise have been selectively eliminated [Citation6]. Clec16acurt/curt β-cells displayed dysmorphic mitochondria, characterized by disorganized cristae, when compared to littermate controls as visualized by transmission electron microscopy (TEM; ). Consistent with these morphological defects, mitochondrial function was reduced in isolated Clec16acurt/curt islets, measured by glucose-stimulated oxygen consumption rates (). Clec16acurt/curt islets also had reduced FCCP-stimulated maximal oxygen consumption rates, while displaying no differences in glycolysis as measured by extracellular acidification rates, when compared to littermate controls (data not shown).
Figure 3. The CLEC16A C terminus maintains β-cell mitochondrial function, morphology, and turnover. (A) Representative transmission electron microscopy (TEM) images of β-cells in isolated islets from 11-week-old Clec16a+/+ and Clec16acurt/curt islets. Clec16acurt/curt islets have distorted mitochondria cristae. n = 4/group. (B) Quantification of β-cell mitochondrial structure from TEM images of Clec16a+/+ and Clec16acurt/curt β-cells related to Figure 3A. Dashed line in violin plot represents median and solid lines represent quartiles. n = 206–236 images scored/group. (C) Relative oxygen consumption rate (OCR) in isolated Clec16a+/+ and Clec16acurt/curt islets measured after exposure to low glucose (1.67 mM) and high glucose (16.7 mM). n = 12/group. (D) Representative MFN2 WB in isolated islets from Clec16a+/+ and Clec16acurt/curt mice following 250 nM valinomycin exposure for up to 6 h, quantified by densitometry (normalized to PPIB/cyclophilin B loading control, below). n = 4–5 mice/group. (E) Flow cytometric analysis of β-cells from dissociated islets of 12-week old Clec16a+/+;mtKeima and Clec16acurt/curt;mtKeima mice, indicating the relative distribution of β-cells with mitochondria in dominantly acidic or neutral compartments following exposure to 250 nM valinomycin or DMSO control for 3 h. n = 4/group. *p < 0.05 **p < 0.01 ***p < 0.001.
Reduced mitochondrial function may stem from the presence of dysfunctional mitochondria or from reduced mitochondrial mass. To assess mitochondrial mass, we measured levels of key mitochondrial membrane proteins and electron transport chain subunits as well as mitochondrial DNA levels. Clec16acurt/curt mice had no significant reductions in mitochondrial proteins or mitochondrial DNA content when compared to littermate controls (Figure S4A-C). We also measured expression of mitochondrial biogenesis markers Ppargc1a/Pgc1α and Tfam by qRT-PCR and found no significant differences in expression between groups (Figure S4D). Interestingly, expression of Nrf1, a mitochondrial biogenesis marker commonly induced following mitochondrial stress, was increased in Clec16acurt/curt islets [Citation41,Citation42]. Collectively, these results demonstrate that Clec16acurt/curt β-cells have reduced mitochondrial function that is not due to reduced mitochondrial mass.
To determine whether loss of the CLEC16A C-terminal IDPR impairs mitophagy, we used several complementary approaches in primary islets and in MEFs. We examined key steps of mitophagy following mitochondrial damage, including turnover of outer mitochondrial membrane proteins, such as MFN2 (mitofusin 2), and clearance of damaged mitochondria by targeting to the lysosome [Citation43]. We observed impaired MFN2 turnover in isolated Clec16acurt/curt islets following exposure to the mitochondrial ionophore valinomycin, which is suggestive of impaired mitophagy flux ( and S4E). Next, we intercrossed the mt-Keima mitophagy reporter model with Clec16acurt/curt mice. Mt-Keima mice express a fluorescently labeled pH-sensitive mitochondrial biosensor that shifts excitation spectra based on pH [Citation44]. Mt-Keima allows for detection of mitophagy as mitochondria are targeted to acidic autophagosomes/lysosomes for degradation. Flow cytometry of dissociated islets revealed that mt-Keima;Clec16acurt/curt β-cells had an increase in cells with mitochondria in acidic compartments (). This suggests that Clec16acurt/curt β-cells accumulate mitochondria in acidic autophagosomes or lysosomes that may be incompletely cleared, consistent with previous observations following CLEC16A deficiency in β-cells [Citation6]. Additionally, membrane-engulfed mitochondria were observed in Clec16acurt/curt β-cells by TEM, which were not found in littermate controls (Figure S4F).
To determine if increased mitochondria within acidic autophagosome/lysosome compartments in Clec16acurt/curt β-cells was due to impaired or enhanced mitophagy flux, we stimulated mitophagy using the mitochondrial ionophore valinomycin. Importantly, Clec16acurt/curt β-cells did not continue to have increased acidic mitochondria following valinomycin treatment, as there was no difference in acidic mitochondria when compared to valinomycin treated Clec16a+/+ β-cells (). These results suggest the baseline accumulation of acidic mitochondria in Clec16acurt/curt β-cells was due to impaired mitophagy flux.
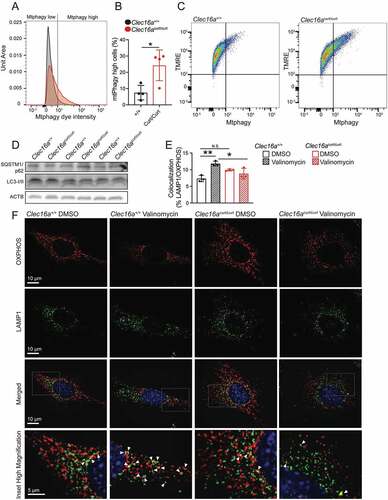
Similar to Clec16acurt/curt β-cells, Clec16acurt/curt MEFs also demonstrated impaired mitophagy. Mitochondria accumulated within acidic compartments in Clec16acurt/curt MEFs, as measured using a cell permeable mitophagy reporter dye (). Notably, Clec16acurt/curt MEFs did not display differences in bulk autophagy markers including LC3 and SQSTM1/p62, suggesting this defect is specific to mitophagy (). To examine mitochondrial targeting to the lysosome, we examined co-localization of mitochondria with lysosomes (marked by OXPHOS and LAMP1 antisera, respectively) by immunostaining. As expected, mitochondrial targeting to lysosomes increased following valinomycin exposure in Clec16a+/+ MEFs, indicating activated mitophagy (). However, Clec16acurt/curt MEFs did not show increased mitochondrial targeting to lysosomes following valinomycin treatment (). Clec16acurt/curt MEFs also had significantly less mitochondria-lysosome colocalization following valinomycin exposure when compared to Clec16a+/+ control MEFs, again consistent with impaired mitophagy (). Importantly, these results align with previously appreciated roles for CLEC16A in control of mitophagy [Citation6]. Taken altogether, these studies indicate the CLEC16A C-terminal IDPR maintains mitochondrial function and health through control of mitophagy.
Figure 4. The CLEC16A C terminus regulates mitophagy in MEFs. (A) Representative flow cytometry univariate histogram depicting Mtphagy dye intensity from primary MEFs derived from Clec16a+/+ and Clec16acurt/curt mice. (B) Quantification of Mtphagy-high MEFs from Clec16a+/+ and Clec16acurt/curt mice, generated using flow cytometry histograms as indicated in Figure S5A. n = 4/group. (C) Representative flow cytometry scatter plot from Clec16a+/+ and Clec16acurt/curt MEFs following staining with Mtphagy and TMRE dyes. (D) Western blot of autophagy markers SQSTM1/p62 and LC3 in Clec16a+/+ and Clec16acurt/curt MEFs. n = 3/group. (E) Quantification of LAMP1 and OXPHOS colocalization in Clec16a+/+ and Clec16acurt/curt MEFs as shown in 4 F. n = 3 independent experiments/group. (6,604–16,528 LAMP1-positive and 8,923–20,774 OXPHOS-positive structures from 11–12 images were quantified per experiment per condition). (F) Representative deconvolved immunofluorescence images of Clec16a+/+ and Clec16acurt/curt MEFs at 100X magnification following exposure to 1 µM valinomycin for 6 h, stained for markers of mitochondria (OXPHOS; red) and lysosomes (LAMP1; green) as well as DNA (DAPI; blue). White arrowheads in magnified inset images highlight colocalized OXPHOS- and LAMP1-positive structures. *p < 0.05 **p < 0.01.
The CLEC16A C-terminal IDPR is required for CLEC16A stability and assembly of the mitophagy regulatory machinery
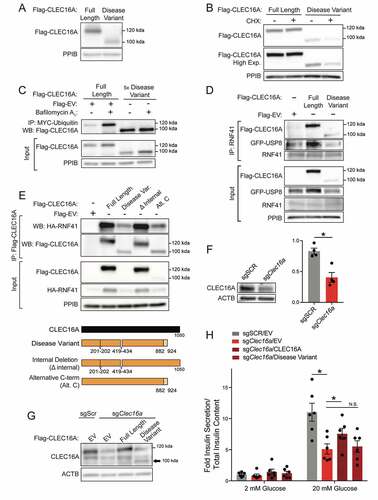
Given the critical role of the CLEC16A C-terminal IDPR in regulating β-cell mitophagy, we questioned how this region impacts molecular functions of CLEC16A. IDPRs often promote protein turnover and destabilize proteins due to their enhanced accessibility for degradative post-translational modifications [Citation18,Citation45,Citation46]. Unexpectedly, both Clec16acurt/curt MEFs and islets, which lack the CLEC16A C-terminal IDPR, had reduced levels of CLEC16A protein (). This led us to hypothesize that the C-terminal IDPR promotes CLEC16A stability, in contrast to the classic role of IDPRs in protein destabilization.
We investigated the role of the CLEC16A C terminus on protein stability using the previously described Flag-tagged CLEC16A ∆C construct which lacks the C-terminal IDPR (). CLEC16A ∆C had reduced protein levels relative to WT CLEC16A following transfection in HEK293T cells, despite no differences in mRNA expression (). To determine the contribution of the CLEC16A C terminus to the stability of the protein, we assessed CLEC16A protein turnover after inhibiting protein synthesis with cycloheximide. CLEC16A ∆C had accelerated turnover relative to wild-type CLEC16A (WT) following cycloheximide treatment, indicating that the C-terminal IDPR stabilizes CLEC16A (). Levels of WT CLEC16A and CLEC16A ∆C protein both increased when inhibiting the proteasome or lysosome with MG132 or bafilomycin A1, respectively, suggesting multiple pathways for CLEC16A clearance (Figure S5A).
Figure 5. The CLEC16A C-terminal IDPR is required for mitophagy complex formation by maintaining CLEC16A stability. (A) Schematic of C-terminal Flag epitope-tagged constructs encoding wild-type (WT) full-length CLEC16A or CLEC16A lacking the C-terminal IDPR (∆C). (B) Representative Flag WB of WT and ∆C CLEC16A following transfection in 293 T cells. Arrow indicates CLEC16A ∆C band. PPIB serves as loading control. n = 4/group. (C) Relative Clec16a mRNA levels (normalized to Ppia expression) following transfection of Flag-EV, WT CLEC16A, or ∆C CLEC16A plasmids into 293 T cells. n = 3/group. (D) Representative WB of Flag-CLEC16A levels (with densitometry of % change from basal levels) from 293 T cells transfected with WT or ∆C CLEC16A following treatment with cycloheximide (CHX; 300 µg/mL) for 0–6 h. Similar levels of Flag-CLEC16A protein between groups were achieved by transfection with 1 µg of WT CLEC16A (with 4 µg Flag-EV) or 5 µg CLEC16A ∆C. n = 3–4/group. (E) Representative WB of cell-based ubiquitination assay of overexpressed Flag-tagged CLEC16A WT or ∆C performed in HEK293T cells co-transfected with MYC-Ubiquitin. Cells were treated with DMSO or 10 μM MG132 for 12 h. Similar levels of Flag-CLEC16A protein between groups were achieved by transfection of 1x WT (1.5 µg Flag-WT CLEC16A + 6 µg Flag-EV) or 5x ∆C (7.5 µg Flag-∆C). n = 3/group. (F) Representative WB of in vitro ubiquitination assay of recombinant CLEC16A-6xHis-Flag WT or ∆C following incubation with ATP, HA-Ubiquitin, E1, in the presence or absence of UBE2D3 at 37°C for 1 h. n = 4/group. (G) Representative WBs of cell-based assessment of binding, stabilization, and ubiquitination of overexpressed HA-tagged RNF41 by Flag-tagged CLEC16A WT or ∆C (or empty vector control) performed in HEK293T cells co-transfected with MYC-Ubiquitin. Conditions included Flag-EV (empty vector; 7.5 µg), 1x Flag-CLEC16A WT (1.5 µg Flag-CLEC16A WT + 6 µg Flag-EV), and 1x or 5x Flag-CLEC16A ∆C (1.5 µg Flag-CLEC16A ∆C + 6 µg Flag-EV or 7.5 µg Flag-CLEC16A ∆C, respectively). n = 3/group. (H) Representative WB following anti-Flag IP in HEK293T cells transfected with HA-RNF41, GFP-USP8 and Flag-EV, Flag-CLEC16A WT, or Flag-CLEC16A ∆C vectors. Conditions included Flag-EV (empty vector; 7.5 µg), 1x Flag-CLEC16A WT (1.5 µg Flag-CLEC16A WT + 6 µg Flag-EV), and 1x or 5x Flag-CLEC16A ∆C (1.5 µg Flag-CLEC16A ∆C + 6 µg Flag-EV or 7.5 µg Flag-CLEC16A ∆C, respectively). n = 3/group. *p < 0.05.
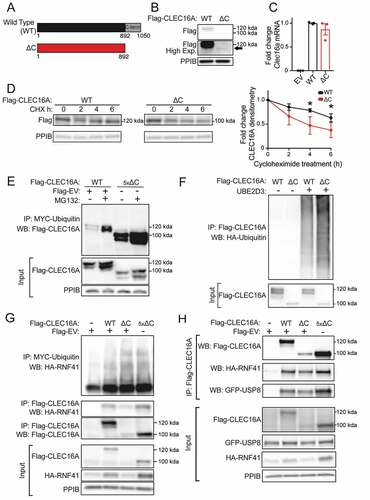
We next investigated the mechanism by which the CLEC16A C-terminal IDPR stabilizes CLEC16A. The stability of E3 ubiquitin ligases is commonly regulated by self-ubiquitination and subsequent degradation [Citation47]. Interestingly, terminal IDPRs in ubiquitin ligase complexes have been demonstrated to inhibit ubiquitin-chain assembly [Citation48]. We hypothesized that the CLEC16A C-terminal IDPR may moderate CLEC16A self-ubiquitination, thus protecting CLEC16A from degradation. Indeed, loss of the CLEC16A C terminus increased CLEC16A ubiquitination relative to WT CLEC16A when constructs were expressed at similar protein levels in HEK293T cells (). CLEC16A ∆C similarly had increased ubiquitination relative to WT CLEC16A following MG132 treatment (). To determine whether increased ubiquitination of CLEC16A ∆C was due to increased self-ubiquitination, we performed in vitro ubiquitination assays using recombinant CLEC16A. Indeed, loss of the CLEC16A C terminus increased CLEC16A self-ubiquitination relative to WT CLEC16A (). Together, these studies demonstrate that the CLEC16A C terminus protects CLEC16A from self-ubiquitination and degradation.
Based on the above findings, we questioned how loss of the CLEC16A C terminus and consequent CLEC16A destabilization would impact formation of the tripartite CLEC16A-RNF41-USP8 mitophagy complex [Citation8]. CLEC16A promotes formation of this complex by binding, ubiquitinating, and stabilizing the E3 ligase RNF41 [Citation8]. CLEC16A ∆C demonstrated reduced binding and stabilization of RNF41 relative to WT CLEC16A (). The reduced binding and stabilization of RNF41 was due to reduced levels of CLEC16A ∆C, as increasing CLEC16A ∆C protein levels back to that of WT CLEC16A restored these defects (). Unexpectedly, CLEC16A C-terminal loss did not impair RNF41 ubiquitination despite reduced CLEC16A levels (). Loss of the CLEC16A C terminus also impaired formation of the mitophagy complex, as observed by reduced binding to USP8 and RNF41, which was again rescued by increasing CLEC16A ∆C protein levels back to that of WT CLEC16A levels (). Loss of the CLEC16A C terminus also caused slight, but not significant, reductions in USP8 protein levels ( and S6). These studies indicate that the CLEC16A C terminus promotes mitophagy complex formation by stabilizing CLEC16A.
We next explored how the specific C-terminal deficiency in the human CLEC16A disease variant affected CLEC16A stability, ubiquitination, and mitophagy complex assembly. The CLEC16A disease variant had lower protein levels and was less stable than the full-length human CLEC16A isoform (). The CLEC16A disease variant was more heavily ubiquitinated when protein levels were similar to that of the full-length isoform (), which was further increased following bafilomycin A1 treatment (; Figure S5B). Of note, while the mouse CLEC16A ∆C construct accumulated following pharmacological inhibition of both the proteasome and lysosome, the human disease variant accumulated only upon lysosome inhibition (Figures S5A-B). The CLEC16A disease variant impaired formation of the mitophagy complex, demonstrated by reduced interaction between USP8-RNF41 () as well as reduced stabilization of, and interaction with, RNF41 (). These results are similar to those of the CLEC16A ∆C mutant (), which lead us to speculate that reduced stability of the CLEC16A disease variant is due to deficiency of the C-terminal IDPR.
Figure 6. The human CLEC16A disease isoform is unstable and impairs mitophagy complex formation and β-cell function. (A) Representative Flag WB of full length human CLEC16A and the CLEC16A disease variant following transfection in 293 T cells. n = 3/group. (B) Representative WB of Flag-CLEC16A levels from 293 T cells transfected with a plasmid encoding full-length human CLEC16A or the CLEC16A disease variant CLEC16A following treatment with cycloheximide (CHX; 300 µg/mL) for 16 h. n = 3/group. (C) Representative WB of cell-based ubiquitination assay of overexpressed Flag-tagged CLEC16A or the CLEC16A disease variant performed in HEK293T cells co-transfected with MYC-Ubiquitin. Cells were treated with DMSO or 150 nM BafA for 12 h. Similar levels of Flag-CLEC16A protein between groups were achieved by transfection of the following plasmids encoding: 1x full-length CLEC16A (1.5 µg Flag-CLEC16A + 6 µg Flag-EV) or 5x CLEC16A disease variant (7.5 µg Flag-CLEC16A disease variant). n = 3/group. (D) Representative WB following endogenous RNF41 IP in HEK293T cells transfected with GFP-USP8 and Flag-EV, Flag-CLEC16A, or Flag-CLEC16A disease variant vectors. n = 3/group. (E) Representative WBs of cell-based assessment of binding and stabilization of overexpressed HA-tagged RNF41 by Flag-tagged CLEC16A full length, CLEC16A disease variant, CLEC16A ∆ internal, or CLEC16A alternative C terminus (or empty vector control) performed in HEK293T cells co-transfected with MYC-Ubiquitin. n = 3/group. (F) Representative CLEC16A WB of CLEC16A protein levels in scramble control (sgScr) or CLEC16A-deficient (sgClec16a) Min6 cells generated by CRISPR-mediated gene editing (with densitometry). (G) Representative CLEC16A WB of Min6 control and CLEC16A-deficient cells from (F) following transfection with Flag-CLEC16A, Flag-CLEC16A disease variant, or empty vector control into CLEC16A-deficient Min6 cells. (H) Glucose-stimulated insulin secretion (GSIS) assay performed in transfected Min6 cells from (G) 72 h after transfection with CLEC16A (or empty vector control) constructs, following static incubation in 2 mM or 20 mM glucose. n = 5/group. *p < 0.05.
Beyond loss of the C terminus, the human CLEC16A disease variant also lacks two small internal regions (, lower panel). To clarify whether the disruption of internal or C-terminal regions drive the defects observed in the CLEC16A disease variant, we generated constructs bearing either the internal deletions (∆ internal) or the alternatively translated and truncated C terminus specific to the disease variant (alternative C terminus; , lower panel). While the CLEC16A ∆ internal construct appeared to be functionally indistinguishable from full-length CLEC16A, the human CLEC16A alternative C terminus construct had reduced protein levels and reduced ability to stabilize and bind RNF41 (). Overall, these results confirm that disrupting the C-terminal IDPR instigates the reduced stability and impaired mitophagy complex assembly found in the CLEC16A disease variant.
The human CLEC16A disease variant is functionally defective in β-cells
Next, we wanted to determine if the mechanistic impairments observed in the human CLEC16A human disease variant would lead to β-cell dysfunction. To address the impact of the human CLEC16A disease variant and its disrupted C-terminal IDPR on β-cell function, we generated a Min6 β-cell line partially deficient for CLEC16A by CRISPR-Cas9 gene editing (). We then expressed either the full-length CLEC16A human isoform or the CLEC16A disease variant in CLEC16A-deficient Min6 cells (). As expected, CLEC16A deficiency reduced glucose-stimulated insulin secretion/GSIS in Min6 cells (). Importantly, expression of the full length CLEC16A isoform, but not of the CLEC16A disease variant, improved glucose-stimulated insulin secretion in CLEC16A-deficient Min6 cells (). Thus, the human CLEC16A disease variant is functionally defective within β-cells, supporting a critical role for the CLEC16A C-terminal IDPR in β-cell function.
Function of the CLEC16A C-terminal IDPR depends on its proline bias
After defining mechanistic and functional roles of the CLEC16A C-terminal IDPR, we questioned what features of the C-terminal IDPR mediate its effect on CLEC16A stability. While IDPRs lack secondary structure, IDPR function can be either dependent or independent of amino acid sequence order and composition [Citation49,Citation50]. IDPR functions that are sequence dependent include dependence on short linear motifs, post-translational modifications, charge, the distribution of charged amino acids, and amino acid biases, including specific behaviors of proline residues [Citation50–55].
To first investigate whether CLEC16A C-terminal IDPR function depends on its amino acid sequence order, we generated two CLEC16A constructs with randomly shuffled C-terminal IDPR amino acids using the random shuffling tool, Shuffle Protein [Citation56]. We confirmed that these constructs did not eliminate predicted disorder within the C terminus (), nor did they introduce new protein domains, as determined using PROSITE and SMART domain analyses [Citation57,Citation58]. Levels of both CLEC16A C-terminal shuffled mutants were unchanged compared to WT CLEC16A (), indicating that CLEC16A stability is not dependent on the amino acid sequence order of its C-terminal IDPR.
Figure 7. Proline bias within the CLEC16A C-terminal IDPR is necessary for CLEC16A stability. (A) Disorder propensity score for CLEC16A mutants as determined by IUPred2. (B) Representative Flag WB (with quantification by densitometry of all studies below) of Flag-CLEC16A WT, Flag-CLEC16A ∆C, as well as C-terminal IDPR mutants following transfection in 293 T cells. n = 4/group. C-terminal IDPR mutants include P-to-S (AA892-1050 proline to serine mutant), Alt. charge (alternate charge mutant), and Charge seg. (charge segregation mutant). (C) Net charge per-residue for listed CLEC16A mutants, calculated as an average net-charge per residue over a 5-residue “blob”. Kappa (K) scores indicates the degree to which charged residues are intermixed and were generated by CIDER (52). *p < 0.05. (D) Representative Flag WB (with quantification by densitometry of all studies below) of Flag-CLEC16A WT, Flag-CLEC16A ∆C, as well as C-terminal pan-lysine to arginine (K-to-R) or pan-serine to alanine (S-to-A) mutants following transfection in HEK293T cells. n = 3/group.
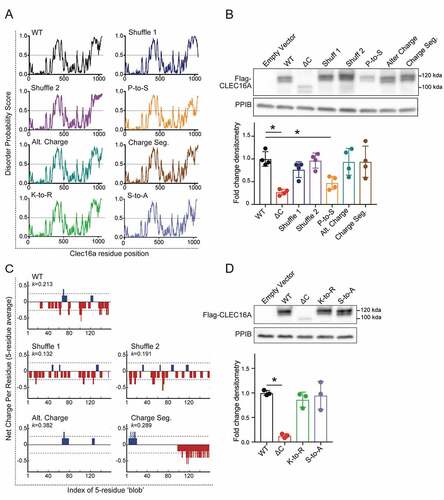
Next, we questioned whether the stabilizing function of the CLEC16A C-terminal IDPR depends on features of its amino acid composition. We generated several independent CLEC16A C-terminal mutants to assess whether disruption of certain IDPR features causes instability similarly to C-terminal truncation. We disrupted C-terminal proline bias with proline-to-serine mutagenesis, which conserves disorder but disrupts proline-specific interactions and behaviors (). We altered negative charge within the CLEC16A C terminus by aspartic acid to asparagine and glutamic acid to glutamine mutagenesis (). We disrupted the intermixed CLEC16A C-terminal charge distribution by manually segregating charged residues to alter the parameter kappa, which describes the intermixing of charges within a sequence () [Citation53]. We also generated constructs with C-terminal regions resistant to post-translational modifications, including ubiquitination or phosphorylation, by lysine-to-arginine (K-to-R) and serine-to-alanine (S-to-A) mutagenesis, respectively. While CLEC16A stability did not depend on C-terminal charge, charge distribution, or post-translational modifications, it was dependent on the strong proline bias (). Proline residues are enriched in IDPRs, with unique properties due to their cyclical and rigid structure that disrupts secondary structure [Citation32]. Thus, the ability of the CLEC16A C-terminal IDPR to stabilize CLEC16A depends on an enrichment of proline residues.
Discussion
Here, we demonstrate that the CLEC16A C terminus is an IDPR that is required for CLEC16A function, mitophagy, and glucose homeostasis. The CLEC16A C-terminal IDPR, which is disrupted in a human CLEC16A disease variant, is vital for mitophagy and insulin secretion by protecting CLEC16A from self-ubiquitination and degradation. The stabilizing role of the CLEC16A C-terminal IDPR relies on its proline bias, and not amino acid sequence order, charge, charge distribution, or post-translational modifications. Together, we use structural, mechanistic, and physiologic approaches to understand how an IDPR disrupted by a human disease variant regulates mitophagy and contributes to diabetes pathogenesis.
IDPRs have recently been implicated in many stages of autophagy/selective autophagy [Citation19,Citation25,Citation59,Citation60], yet the role of IDPRs in mitophagy is less clear [Citation59]. IDPRs have been shown to mediate key regulators of autophagy, including Atg1 and BECN1 [Citation19,Citation25,Citation60,Citation61]. Further, an internal IDPR controls ATG3 activity, which supports the conjugation of LC3 to the phagophore during its maturation as a selective autophagy adaptor [Citation33]. IDPRs are also predicted to overlap with LC3-interacting regions/LIRs, which are domains found in cargo receptors in selective autophagy pathways [Citation62]. Our study builds upon these previous observations and provides novel functional and mechanistic connections between IDPRs and the regulation of mitophagy through CLEC16A.
Beyond its role in assembly of a tripartite mitophagy regulatory complex, CLEC16A has been implicated in other processes, including endosomal biogenesis and maturation [Citation6,Citation63–66]. Recent studies have elucidated that endosomal RAB proteins are recruited to mitochondria during PRKN-mediated mitophagy [Citation67]. Additionally, the C. elegans CLEC16A homolog GOP-1 interacts with RAB2 to mediate phagolysosome formation, which could intersect CLEC16A functions in both endosomal maturation and mitophagy [Citation66,Citation67]. Future studies will be needed to determine if CLEC16A IDPRs also mediate connections between the endosomal RAB machinery and mitophagy pathway.
Our results provide new knowledge regarding the association between IDPRs and disease pathogenesis, which is poorly understood. While IDPRs comprise an estimated 44% of the human proteome, their biological roles have only recently begun to be explored [Citation17,Citation68]. IDPRs have proposed involvement with many human diseases, including cancer, cardiovascular disease, and neurodegeneration [Citation17,Citation21,Citation24,Citation69]. In some contexts, disease-causing mutations disrupt IDPRs, which suggest IDPRs have crucial biological functions that protect against disease [Citation17,Citation21,Citation24,Citation69]. Predicted IDPRs were enriched in a focused in silico analysis of 34 type 2 diabetes-related proteins, yet the genetic, mechanistic, and physiological connections between IDPRs and the >400 variants associated with type 2 diabetes are unknown [Citation22]. An IDPR was also biophysically validated in the β-cell transcription factor PDX1, but the functional contribution and genetic links of this IDPR to diabetes pathogenesis is unclear [Citation35]. To our knowledge, our study represents the first comprehensive structure-function characterization of an IDPR disrupted by a diabetes-associated human genetic variant.
We find that proline residues are required for CLEC16A C-terminal IDPR function, providing insight into how amino acid composition dictates IDPR function. Prolines are significantly enriched in IDPRs and tend to disrupt secondary structure due to their cyclical structure and lack of backbone amide hydrogen atoms, which prevents the formation of hydrogen bonds required for α-helices or β-sheets [Citation32]. Prolines are implicated in controlling IDPR conformation, yet their role remains controversial and is likely context specific [Citation31,Citation32,Citation70,Citation71]. In some contexts, prolines are observed to promote expansion of IDPRs, with a positive correlation between proline number and IDPR hydrodynamic radii [Citation70]. Conversely, prolines are implicated in promoting compaction, as others found that mutating prolines within a short IDPR induced expansion [Citation71]. One mechanism by which proline residues can compact IDPRs is by interactions with proximal aromatic residues [Citation31], yet the CLEC16A C terminus mostly lacks aromatic residues (). Future studies investigating how proline residues regulate the CLEC16A C-terminal IDPR conformation and behavior may clarify the role of proline bias in CLEC16A stability.
Our studies reveal a stabilizing role for the CLEC16A IDPR, which opposes the well-known destabilizing role for IDPRs in proteins [Citation46,Citation72,Citation73]. Due to their flexible conformations, IDPRs are frequent sites for degradative post-translational modifications, such as ubiquitination, yet we unexpectedly find that the CLEC16A C-terminal IDPR attenuates self-ubiquitination [Citation46,Citation72,Citation73]. Recent work on IDPRs and E3 ligases has shown that the N-terminal IDPR of RNF4 facilitates substrate ubiquitination in a manner dependent on IDPR compaction, which was controlled by charge segregation [Citation74]. However, the CLEC16A C-terminal IDPR is not required for ubiquitination of RNF41 (). Additionally, disruption of charged residues within the CLEC16A IDPR does not affect CLEC16A stability (), together suggesting a distinct mechanism of action. Thus, our study of the CLEC16A C-terminal IDPR defines a surprising novel role for IDPRs within E3 ligases. Functional exploration of other regions within CLEC16A, including a putative internal IDPR, will be of great interest in future work.
While our studies clarify that the C-terminal IDPR stabilizes CLEC16A by preventing its ubiquitination and degradation in a proline-dependent manner, future studies could deepen knowledge of this mechanism. For example, some IDPRs, such as that in the mitochondrial fission protein DNM1L/Drp1 (dynamin 1 like), function through steric interference to auto-inhibit enzymatic activity [Citation75]. Alternatively, IDPRs can also act as molecular shields that block access to proteins through electrostatic or steric mechanisms [Citation76]. Future biophysical studies may be able to complement our current understanding of how the CLEC16A C-terminal IDPR functions to protect CLEC16A from degradative autoubiquitination.
The CLEC16A disease-associated variant demonstrates reduced formation of the CLEC16A-RNF41-USP8 mitophagy complex, highlighting the critical role of the tripartite mitophagy complex. Despite the importance of this mitophagy complex, many questions regarding its assembly remain. Notably, the interaction sites between CLEC16A and RNF41 are not yet known. Our studies suggest the CLEC16A C terminal IDPR is not a specific binding site for RNF41 as C-terminal IDPR mutants were still able to bind to RNF41, yet we do not know what other regions of CLEC16A facilitate RNF41 binding. Moreover, it is unknown what domains of RNF41 interact with CLEC16A, or how mutations within RNF41 domains might impact its ability to bind CLEC16A, form the mitophagy-regulatory complex, or control mitophagy. Future studies are necessary to clarify the specific sites of CLEC16A-RNF41 interaction within the mitophagy complex.
We describe molecular mechanisms by which a disease-associated CLEC16A variant impacts cellular function, which may provide opportunities for therapeutic interventions. Loss of the CLEC16A C-terminal IDPR destabilizes CLEC16A and impairs assembly of the tripartite mitophagy complex, which is overcome by increasing levels of the IDPR-deficient mutant (). Thus, pharmacological approaches to target the C-terminal IDPR to stabilize CLEC16A could prove protective against disease. Indeed, there has been growing interest and development in therapeutics targeting IDPRs [Citation77]. Interestingly, IDPRs can also retain functionality when expressed independently as truncated fragments [Citation78–80]. Exploring whether peptide-based therapeutics mimicking the structure of the CLEC16A C-terminal IDPR could improve CLEC16A stability and function would be of great value, not only to patients with diabetes, but also with other CLEC16A-related diseases.
Materials and methods
Protein Expression and Purification
The pMCSG7-Clec16a 892–1050-TEV-6xHis bacterial expression plasmid was transformed into Z-competent Rosetta2 cells (a gift from the Center for Structural Biology, University of Michigan), cultured in 10 mL Luria broth (LB; 10 g/L tryptone [Fisher Scientific, BP1421-500], 10 g/L NaCl [Fisher Scientific, BP358-212], 5 g/L yeast extract [Fisher Scientific, BP9727-500]) overnight, before transferring to 1 L of LB and growing until optical density of 600 nm at 37°C. Bacteria were pelleted, washed, and resuspended in minimal medium, pH 7 (12 g/L K2HPO4 [Fisher Scientific, 7758–11-4], 9 g/L KH2PO4 [Fisher Scientific, 7778–77-0], 1 g/L 15NH4Cl [Cambridge Isotope Laboratories Inc., NLM-467], 2.5 g/L NaCl [Fisher Scientific, BP358-212], 25 mg/L thiamine HCl [Fisher Scientific, 67–03-8], 4 g/L 13C-glucose [Cambridge Isotope Laboratories Inc., CLM-1396], 0.5 g/L MgSO4 [Fisher Scientific, 7487–88-9], 0.1 g/L NaOH [Fisher Scientific, 1310–73-2]) supplemented with 1 mL of 100 mM CaCl2 [Fisher Scientific, 10,035–04-8], and 1 mL of Metal Solution (0.3 g/65 mL FeSO4 · 7H2O [Fisher Scientific, 7782–63-0], 0.2 g/65 mL ZnSO4 · 7H2O [Fisher Scientific, 7446–20-0], 0.4 g/65 mL CoCl4 · 6 H2O [Fisher Scientific, 7791–13-1], 0.3 g/65 mL [NH4]6Mo7O24 · 4 H2O [Fisher Scientific, 12,054–85-2], 0.3 g/65 mL CuSO4 [Fisher Scientific, 7758–99-8], 0.2 g/65 mL MnCl4 · 4H2O [Millipore Sigma, M3634], 0.1 g/65 mL H3BO3 [Fisher Scientific, 10,043–35-3]), and ampicillin (Millipore Sigma, 7177–48-2). Culture was induced overnight at 20°C with Isopropyl β-D-1-thiogalactopyranoside (IPTG; Agilent, 300,127). Bacteria were pelleted, subjected to freeze/thaw at −80°C, and sonicated in lysis buffer (1x PBS [Fisher, BP399-20], 1% CHAPS [Sigma Aldrich, C9426], 10 mM MgCl2 [Fisher Scientific, 7786–30-3], 2 µl benzonase [25 U/µl; Millipore, 71,206], and protease inhibitor [Thermo Scientific, PIA32965]). Supernatant was purified using a nickel gravity column (Qiagen, 30,250; Ni-NTA Agarose) followed by a high-salt wash (1xPBS [Fisher, BP399-20], 1 M NaCl [Fisher Scientific, BP358-212]), and eluted in 1xPBS and 300 mM imidazole (Bio-Rad, 1,610,441). Eluate was incubated with TEV protease (NEB, P8112S) overnight at 4°C in 1xPBS with 0.1% β-mercaptoethanol (Sigma Aldrich, M3148), and 6xHis tag was removed with a nickel column. Eluate was purified using Q anion exchange chromatography in the AKTAxpress (GE Healthcare), and fractions visualized on SDS-PAGE gel with Coomassie Brilliant Blue (Milipore Sigma, 6104–58-1). Fractions containing the CLEC16A amino acids (AA) 892–1050 peptide were further purified using fast protein liquid size exclusion chromatography on the AKTA Purifier 10. Fractions were visualized on an SDS-PAGE gel and were dialyzed into the final NMR buffer (50 mM sodium cacodylate [Millipore Sigma, 6131–99-3], 150 mM NaCl [Fisher Scientific, BP358-212], pH 6.5 in ddH2O), followed by concentration.
For in vitro ubiquitination assays, recombinant CLEC16A and CLEC16A ∆C were generated following expression in 293 T cells and purified with nickel-charged resin (Ni-NTA agarose) per the manufacturer’s protocols.
NMR
Isotopically labeled 13C/15N CLEC16A C-terminal peptide (AA 892–1050) was purified using the methods described above and transferred into a buffer composed of 50 mM sodium cacodylate pH 6.5, 150 mM NaCl (Fisher Scientific, BP358-212). Protein was supplemented with 10% D2O (Sigma-Aldrich, 151,882) and loaded in a Shigemi NMR Tube (Wilmad-LabGlass, SP Scienceware, BMS-005B). All NMR experiments were performed on an 18.8 T Bruker Ascend magnet equipped with Bruker NEO spectrometer operating at 1H frequencies of 800.25 MHz, and equipped with inverse TCI cryoprobe. All NMR spectra were collected at 298 K.
Due to the limited lifetime of the sample, standard C’ detected NMR methods (29) were not suitable for chemical shift assignments for the CLEC16A C-terminal peptide (AA 892–1050). Initially a standard (Hα-start) 15N-13C CON was collected using 1024(C’) x 128(N), spectral width of 11 × 36 ppm, and 16 scans. Some useful residue type information was obtained from the standard H(CC)CON from the Bruker pulse program library with matrix size of 1024(C’) x 128(N) x 48(C), spectral width of 8 × 36 x 80 ppm, and 16 scans with 25% non-uniform sampling, totaling an acquisition time of 19 h. With the caveat of limited chemical shift dispersion in amide 1H dimension, we collected BEST-HNCO, BEST-HN(CA)CO, with a matrix size of 698(HN) x 64(N) x 128(C’), spectral width of 14 × 35 x 14 ppm, 8 and 16 scans, and BEST-HNCACB and BEST-HN(CO)CACB, with a matrix size of 698(HN) x 64(N) x 128(Cα/β), spectral width of 14 × 35 x 80 ppm, with 32 and 16 scans, with 50% non-uniform sampling, totaling an acquisition of 30 h for all 4 experiments. The backbone assignments were made by daisy-chain walking through C’ chemical shift assignments and aided by data from Cα/β chemical shifts as well. The aliphatic Cα/β chemical shifts also provided information on amino acid type owing to different chemical environment and types of side chains. Aliphatic protons chemical shifts from the H(CC)CON was also used to identify residue type, where data from BEST-HNCO was linked using C’ and N resonances.
Overall, spectra complexity and sequence repetitiveness made complete residue connection and assignment using this approach impossible. Combining fragmented data from C’- and HN- detect experiments described above, we assigned peaks to 16 of 159 total residues.
In lieu of assigning individual residues, carbon-detect amino acid selective (CAS) NMR experiments were performed, which leveraged the different chemical configuration of aliphatic side chains to assign aliphatic chemical shift resonances [Citation35]. Confirmation of assignments were made using the mapping of observed C’/N signals to those obtained from (Hα-start) 15N-13C CON spectra. Carbon-detect amino-acid specific pulse sequences for serine, alanine, glycine, and threonine, were performed as described previously [Citation35]. Aliphatic Cα and Cβ values were labeled for each peak on the CAS NMR spectra. All data were processed in Topspin 4.0.9 software and converted to Sparky format for data analysis.
NMR-based secondary structure analyses
Secondary structure analyses of residue peaks with known amino acid type (identified using CAS-NMR) were performed by using secondary chemical shifts to evaluate the probability, for each residue, that the residue is in an α-helix or β-sheet [Citation52]. Data were generated by calculating the difference in the measured 13C-α and 13C-β chemical shift, from the expected chemical shift standards of that residue type in a random coil conformation, represented as dCα and dCβ. The difference between dCα and dCβ values (dCα- dCβ) was plotted, with values greater than 2 ppm or less than −2 ppm representing a residue likely in an α-helix or β-sheet, respectively.
Animals
All animal studies were reviewed and approved by the University of Michigan Institutional Animal Care and Use Committee. Models used included Clec16acurt/curt [Citation38,Citation39] and mt-Keima mice (a gift from Dr. Toren Finkel, University of Pittsburgh [Citation44]). Clec16acurt mice [Citation38,Citation39] were obtained from Jackson Labs and were maintained on a mixed 50% SWR/J and 50% CD1/ICR background. mt-Keima mice were maintained on a mixed SWR/J, CD1/ICR, and FVB/J background following intercrosses with Clec16acurt/curt mice to generate experimental groups for mitophagy analysis. Mice were housed with a 12-h light/12-h dark cycle, and free access to food and water unless fasted for testing.
Mice were genotyped for the Clec16aCurt allele with the following primers: Common forward primer: 5’-TGTCCCCATTACGCGTGCTAA-3’, and Clec16a+-specific reverse primer: 5’-TGTTGTCGGCTGGATTGGGA-3’, or Clec16aCurt-specific reverse primer: 5’- TGTTGTCGGCTGGATTGGTC-3’, which yield an 81 bp product. PCR was performed for 38 cycles (95°C for 45s, 58°C for 45s, 72°C for 1 min). Confirmation of the 4-bp deletion within exon 22 in Clec16aCurt mice was performed following MnlI restriction digest of a PCR-amplified product of genomic DNA (forward primer: 5’-CCCCAAGGGTCTTACTGTCA-3’ and reverse primer: 5’-CATAGAAACGGAAAGGCAGGTGCTG-3’). Clec16a+-specific bands migrated at 137 and 47 bp, while a Clec16aCurt mutant band migrated at 180 bp.
Cell culture, cell line generation, treatments, and transfections
Primary mouse embryonic fibroblasts (MEFs) were isolated from Clec16aCurt/Curt and Clec16a+/+ mice as described previously [Citation81], and cultured as previously detailed [Citation6,Citation82]. 293 T cells were cultured in DMEM (Gibco, 11,965) supplemented with 10% Fetal-Plex (Gemini Bio Products, 50–753-2987), 50 units/mL penicillin-streptomycin (Thermo Fisher Scientific, 15,140–122), 1 mM sodium pyruvate (Thermo Fisher Scientific, 11–360-070), and 142 μM β-mercaptoethanol (1 µl/100 mL medium). Min6 cells (a gift from Dr. Doris Stoffers, University of Pennsylvania) were cultured as previously described [Citation83]. Pooled Clec16a-deficient Min6 cells were generated using the LentiCRISPRV2 one-vector system as described [Citation84]. Clec16a sgRNA sequences included (5’- CGGACATGTTTGGACGCTCA-3’, targeting exon 1) and (5’-ACAAAATCGGAACCTGCTCG-3’ targeting exon2) and were cloned into LentiCRISPRV2 as described [Citation84]. LentiCRISPRV2 was transfected into 293 T cells along with the lentiviral packaging plasmids RRE, VSV-G, and REV (courtesy of Ling Qi, University of Michigan) using Lipofectamine 2000 (Invitrogen, 11,668–019). Viral-containing media were collected on days 3 and 4 post-transfection, filtered in a 0.45-µm filter, and stored at −80°C until use. Min6 cells were transduced by culturing with viral media (DMEM [Gibco, 11,965] supplemented with 10% volume fetal bovine serum [Gemini Bio Products, 900–108], 50 units/mL penicillin streptomycin [Thermo Fisher Scientific, 15,140–122], and 10 mM HEPES [Gibco, 15,630–080]), pH 7–7.4 mixed 1:1 with normal Min6 media (as previously described [Citation83]), supplemented with polybrene (5 µg/ml; Sigma, H9268). Fresh viral stocks were added daily for two days, followed by two rounds of selection using puromycin (2 µg/mL; Cayman Chemicals, 13,884) for 5 days. Min6 cells transduced with Clec16a sgRNA LentiCRISPR V2 (or non-targeting control sgRNA, courtesy of Ling Qi, University of Michigan) were screened via western blot. A pooled Clec16a-deficient Min6 cell population, and not an expansion of single cell Clec16a-deficient clones, was used to avoid bias from the variable insulin secretory profiles inherent to the generation of clonal β-cell lines.
The following compounds and concentrations were used as treatments for cells or isolated islets: dimethylsulfoxide (DMSO; Thermo Fisher Scientific, BP231-100), valinomycin (Millipore Sigma, 94,675), MG132 (EMD Milipore, 474,790), bafilomycin A1 (BafA; Cayman Chemical, 11,038), FCCP (Millipore Sigma, C2920), cycloheximide (EMD, 239–765).
293 T cells were transfected according to the manufacturer’s protocol using Lipofectamine 2000. Min6 cells were transfected using an Amaxa Nucleofector (Lonza) protocol G-016 according to the manufacturer’s protocol.
Islet isolation and incubations
Islets were isolated from 12- to 15-week-old mice and subjected to static incubation to assess glucose-stimulated insulin secretion as previously described [Citation83].
Antibodies
CLEC16A-specific rabbit antisera (Cocalico) were generated as previously described, using either an internal peptide (AA 347–472) or a C-terminal peptide (AA 892–1050) [Citation11]. All other antibodies are listed in .
Table 1. Antibodies.
Plasmids
Constructs for mammalian overexpression studies included, pFLAG-CMV-5a-Clec16a WT [Citation6], pcDNA3.1 3x-HA-Nrdp1/RNF41 [Citation6], MYC-ubiquitin [Citation7,Citation83], GFP-USP8 (Sino Biological; HG15979-ACG), and human CLEC16A C-terminal Flag epitope-tagged full-length or alternatively spliced disease isoform vectors (Genscript; OHu18264D and OHu02258D). Constructs containing CLEC16A ∆C (1–892 only) or CLEC16A AA 892–1050 (C-terminal fragment only) were generated by PCR amplification of specific fragments from pFLAG-CMV-5a-Clec16a WT construct, subcloning of PCR amplified fragments into pCR-Blunt II-TOPO (Zero blunt TOPO cloning kit; Invitrogen, 450,245) for sequence validation by sequencing, and ligation of fragments into pFLAG-CMV-5a. Plasmids used to generate recombinant protein for in vitro ubiquitination assays included pFLAG-CMV-5a-Clec16a WT-6xHis [Citation6] and pFLAG-CMV-5a-Clec16a ∆C-6xHis, generated by ligation of Clec16a ∆C (1–892 only) into pFLAG-CMV-5a-6xHis.
For the purpose of generating labeled recombinant CLEC16A C-terminal peptide fragment AA 892–1050 for NMR, the CLEC16A AA 892–1050 fragment was PCR amplified from pFLAG-CMV-5a-Clec16a WT with primers bearing ligation independent cloning sites (Fwd- 5’-TACTTCCAATCCAATGCTTCTCCATCCCTGTCATCACC-3’, Rev- 5’-TTATCCACTTCCAATGTTAGTGCTCTGTGGGTTCCG-3’. The product was then annealed with a linearized pMCSG7 bacterial plasmid (a gift from the Center for Structural Biology, University of Michigan) containing an N-terminal TEV-cleavable 6xHis tag and transformed into high efficiency DH5-α competent E. coli prior to confirmation by sequencing.
Plasmids bearing CLEC16A C-terminal IDPR mutation for mammalian overexpression studies were generated by gene synthesis into pBluescriptSK(+)BSK(+) (Biomatik, custom order) that were subsequently subcloned into pFLAG-CMV-5a, including pFLAG-CMV-5a-Clec16a_C-terminal_S-to-A (bearing serine to alanine mutagenesis of 31 serine residues in AA 892–1050), pFLAG-CMV-5a-Clec16a_C-terminal_Shuffle1, Shuffle 2, P-to-S, Alter Charge, and Charge Segregation (specific CLEC16A C-terminal mutant amino acid sequences are listed in Table S1). Randomly shuffled C-terminal mutants were generated to disrupt primary structure and any secondary structural features using the online Shuffle Protein tool, with PROSITE and SMART analyses used to ensure no domains were introduced during shuffling [Citation56–58]. The strong negative charge in the CLEC16A C terminus was disrupted by eliminating the negative charges with aspartic acid to asparagine and glutamic acid to glutamine mutagenesis, reducing the net charge per residue from −0.094 to 0.025, isoelectric point from 4.24 to 10.31, and retaining similarly structured amino acids. To disrupt the intermixed CLEC16A C terminus charge distribution, we manually segregated positively charged lysine and arginine residues toward the N terminus of this region, and negatively charged aspartic acid and glutamic acid toward the C terminus of this region, while leaving the remainder of the sequence intact. The impact was quantified with the parameter kappa, which describes charge intermixing [Citation53]. Kappa shifted from 0.213 in the WT C terminus to 0.294 in the charge-segregated construct. The pFLAG-CMV-5a-Clec16a_C-terminal_K-to-R plasmid was generated by site directed mutagenesis converting lysines 959 and 962 to arginines via QuikChange II Site Directed Mutagenesis kit, per the manufacturer’s instructions (Agilent, 200,524). All plasmids were verified by sequencing.
To generate the CLEC16A mutant bearing only the alternative C terminus of the CLEC16A disease isoform, the C-terminal fragment of the CLEC16A disease isoform (Genscript, OHu02258D) was liberated by BamHI restriction digest, gel purified, and ligated in place of the C terminus of the full-length CLEC16A isoform construct (Genscript, OHu18264D). To generate the CLEC16A mutant bearing only the internal deletion of the CLEC16A disease isoform, the C-terminal fragment of the CLEC16A full-length isoform (OHu18264D), was liberated by BamHI restriction digest, gel purified, and ligated in place of the C terminus of the full length CLEC16A isoform construct (OHu02258D) leaving the internal deletion within the C-terminal disease isoform intact. Correct orientation of inserts was first assessed using HindIII/XhoI digest and then verified by sequencing.
Western blotting, ubiquitination assays, immunoprecipitation
Western blots and ubiquitination assays were performed as previously described [Citation6,Citation8]. For immunoprecipitation, cells were lysed in a protein lysis buffer consisting of 150 mM NaCl (Fisher Scientific, BP358-212), 1% IGEPAL CA-630 (Sigma Aldrich, 9002–93-1), and 50 mM Tris, pH 8.0, supplemented with protease and phosphatase inhibitors (Millipore, 539,143 and 524,625), followed by shearing by passage through a 21-gauge needle while on ice. Lysates were clarified by centrifugation, then pre-cleared with protein G agarose beads (Thermo Fisher Scientific, 20,399). Protein lysates were incubated with either anti MYC/c-MYC agarose beads (Sigma, A7470), anti MYC/c-MYC magnetic beads (Santa Cruz Biotechnology, 500,772), or Flag M2 Affinity Gel (Sigma Aldrich, A2220) overnight at 4°C. Beads were washed 3 times in lysis buffer, and conjugates were eluted in 2x Laemmli buffer (Sigma Aldrich, S3401) supplemented with 5 mM DTT (Fisher Scientific, BP172-25) at 70°C for 10 min prior to SDS-PAGE (Bio-Rad, 456–1094). Immunoprecipitation for endogenous RNF41/Nrdp1 was performed as described [Citation8].
Flow cytometry
Flow cytometry of mt-Keima mouse islets was performed as previously described [Citation85]. In brief, isolated islets were cultured for one day, treated with valinomycin or DMSO, and dissociated into single cells using trypsin-EDTA (0.25%; Gibco, 25,200–056). Cells were stained with DAPI (Sigma Aldrich, D9542) and FluoZin-3 AM (Thermo Fisher Scientific, F24195) to detect zinc-enriched β-cells), and resuspended in phenol red-free media (Gibco, 11,835–030) supplemented with 1% BSA (Equitech, BAH66). Flow cytometric data were analyzed by FlowJo (BD Biosciences). At least, 5,000 FluoZin-3-positive cells were analyzed from each islet preparation.
Mitophagy rates in MEFs was assessed using Mtphagy Dye (Dojindo, mt02) as previously described [Citation85]. MEFs were incubated with media supplemented with 100 nM Mtphagy dye for 7.5 h prior to flow cytometry analysis. Cells were stained with DAPI, then analyzed on the LSR Fortessa flow cytometer. Mtphagy signal was measured with excitation at 488 nm and emission at 710 nm. TMRE (Anaspec, AS-88061) was excited with a 561-nm laser and emission was measured with a 574-nm filter to measure mitochondrial membrane potential. At least 19,000 live cells per sample were analyzed.
β-cell mass, glucose, and insulin measurements
β-cell mass was calculated as previously described [Citation83]. Intraperitoneal glucose tolerance test/IPGTT, insulin tolerance test/ITT, and serum insulin measurements were obtained as described previously [Citation86,Citation87]. Pancreatic hormone content was analyzed via ELISA (Mercodia, 10–1281-01) following acid ethanol extraction as previously described [Citation87]. Static glucose-stimulated insulin secretion in Min6 cells was performed as previously described, and insulin was measured by ELISA (Mouse Ultrasensitive Insulin ELISA; ALPCO, 80-INSUMSU-E10) [Citation88].
Respirometry
Oxygen consumption rates were measured in isolated islets using the XF96 Flux Analyzer (Seahorse Bioscience) according to the manufacturer’s protocol. Briefly, 20 dispersed islets were seeded per well of a Seahorse flux plate that was pre-treated with Cell-Tak (Corning, CB40240), and islets were allowed to adhere overnight. Cells were then incubated for 1 h at 37°C in atmospheric CO2 in pH 7.4 unbuffered RPMI1640 (Gibco, 11,875–119) with 1.67 mM glucose (Thermo Fisher Scientific, D16-1). Islets were first stimulated with high glucose (16.7 mM) and then FCCP (5 µM; Millipore Sigma, C2920) for oxygen consumption and extracellular acidification analyses. Oxygen consumption rates were normalized to total protein content, which was measured by MicroBCA (Pierce, 23,235).
RNA and DNA isolation, gene expression, and mtDNA analyses
RNA isolation and reverse transcription was performed as previously described [Citation6,Citation89]. DNA was isolated using the DNeasy kit (Qiagen, QIA69504) per the manufacturer’s protocol. Gene expression by quantitative RT-PCR and relative mtDNA:nuclear DNA ratios were measured as previously described [Citation6,Citation89].
Transmission electron microscopy
Isolated islets were washed 2x in PBS and fixed overnight in 2.5% glutaraldehyde (Sigma, G5882) in water at 4°C and pelleted in 2% agarose (VWR International, MPN605). Agarose plugs were washed in 0.1 M cacodylate buffer (pH 7.2; CB; Electron Microscopy Sciences, 11,653), stained for 1 h on ice with 1.5% K4Fe(CN)6 (Sigma, 455,989) + 2% OsO4 (Sigma, 201,030) in 0.1 M CB, washed in 0.1 M Na2+ acetate (Millipore Sigma, 127–09-3), pH 5.2, and en bloc stained in 2% uranyl acetate (Electron Microscopy Sciences, 22,400) in 0.1 M Na2+ acetate, pH 5.2 for 1 h. The plug was embedded in a BEEM Capsule (Ted Pella Inc, 130-B) and polymerized for 24 h at 70°C. Sections were cut with a diamond knife, and post-stained with 4% uranyl acetate and Reynolds’ lead citrate (Electron Microscopy Sciences, 22,410–01). Images were captured on a JEOL JEM-1400 transmission electron microscope. Images were blinded and the percentage of mitochondria with distorted cristae per high-power field was scored as previously described [Citation6].
Immunostaining and colocalization analysis
Mitochondria localization studies were performed on immunostained MEFs grown in chamber slides, prepared as previously described [Citation11]. Z-stack images were taken with a an IX81 microscope (Olympus) with an ORCA Flash4 CMOS digital camera (Hamamatsu), and deconvolved using the nearest-neighbor algorithm (CellSens; Olympus). Object-based colocalization analysis was performed using JaCOP [Citation90].
Statistical analysis
Data are represented as mean values, with error bars denoting ± SEM. For all studies, statistical significance was determined using unpaired two-tailed student’s t-tests for single comparisons or two-way ANOVA (Prism GraphPad) for multiple comparisons testing. A post-hoc Sidak’s test was performed following ANOVA for samples reaching statistical significance. A 5% significance level was used for all statistical tests.
Supplemental Material
Download Zip (2.6 MB)Acknowledgments
M.A.G. was supported by the NIH (F31-DK-122761, T32-GM-007315, T32-GM-008322). S.A.S was supported by the JDRF (CDA-2016-189, SRA-2018-539, COE-2019-861), the NIH (R01 DK108921, U01 DK127747), the Department of Veterans Affairs (I01 BX004444), the Brehm family, the Anthony family, and a Brehm T1D Pilot and Feasibility Grant from the Michigan Diabetes Research Center (P30-DK020572). G.L.P. was supported by the American Diabetes Association (19-PDF-063). S.S. was supported by the JDRF (CDA-2016-189) and NIH (R01 DK108921). The JDRF Career Development Award to S.A.S. is partly supported by the Danish Diabetes Academy and the Novo Nordisk Foundation. D.J.K. was supported by the NIH (GM131919). X.L. was supported by a medical student training partnership by the Central South University Xiangya School of Medicine and the University of Michigan. We acknowledge P. Blakely and J. Harrison in the Michigan Medicine Microscopy Core for advice and assistance with sample preparation and EM imaging. The generation of recombinant protein for biophysical studies reported in this publication was supported by the University of Michigan Center for Structural Biology (CSB). The CSB is grateful for support from the U-M Life Sciences Institute, the U-M Rogel Cancer Center, the U-M Medical School Endowment for Basic Sciences, and grants from the NIH. We thank the University of Michigan BioNMR Core for assistance performing, analyzing, and interpreting NMR studies. The University of Michigan BioNMR Core is supported by the U-M College of Literature, Sciences and Arts, Life Sciences Institute, College of Pharmacy and the Medical School along with the U-M Biosciences Initiative. We thank Drs. H. Popelka, E. Walker, P. Arvan, D. Fingar, K. Gaulton, R. Prasad, and members of the Soleimanpour laboratory for helpful advice.
Disclosure statement
The authors have declared that no conflict of interest exists.
Supplementary material
Supplemental data for this article can be accessed online at https://doi.org/10.1080/15548627.2022.2080383
Additional information
Funding
References
- Hakonarson H, Grant SF, Bradfield JP, et al. A genome-wide association study identifies KIAA0350 as a type 1 diabetes gene. Nature. 2007;448(7153):591–594.
- Gingerich MA, Sidarala V, Soleimanpour SA. Clarifying the function of genes at the chromosome 16p13 locus in type 1 diabetes: CLEC16A and DEXI. Genes Immun. 2020;21:79–82.
- Fujimaki T, Kato K, Yokoi K, et al. Association of genetic variants in SEMA3F, CLEC16A, LAMA3, and PCSK2 with myocardial infarction in Japanese individuals. Atherosclerosis. 2010;210:468–473.
- Hafler DA, Compston A, Sawcer S, et al. Risk alleles for multiple sclerosis identified by a genomewide study. N Engl J Med. 2007;357:851–862.
- Yoshida T, Kato K, Yokoi K, et al. Association of genetic variants with myocardial infarction in individuals with or without hypertension or diabetes mellitus. Int J Mol Med. 2009;24:701–709.
- Soleimanpour SA, Gupta A, Bakay M, et al. The diabetes susceptibility gene Clec16a regulates mitophagy. Cell. 2014;157:1577–1590.
- Pearson GL, Gingerich MA, Walker EM, et al. A selective look at autophagy in pancreatic β-Cells. Diabetes. 2021;70:1229–1241.
- Pearson G, Chai B, Vozheiko T, et al. Clec16a, Nrdp1, and USP8 form a ubiquitin-dependent tripartite complex that regulates beta-cell mitophagy. Diabetes. 2018;67:265–277.
- Pearson G, Soleimanpour SA. A ubiquitin-dependent mitophagy complex maintains mitochondrial function and insulin secretion in beta cells. Autophagy. 2018;14:1160–1161.
- Soleimanpour SA, Ferrari AM, Raum JC, et al. Diabetes susceptibility genes pdx1 and clec16a function in a pathway regulating mitophagy in β-Cells. Diabetes. 2015;64(10):3475–3484. 1 0.2 337/db15-0376
- Sidarala V, Pearson GL, Parekh VS, et al. Mitophagy protects β cells from inflammatory damage in diabetes. JCI Insight. 2020;5. DOI:10.1172/jci.insight.141138.
- Bradfield JP, Qu HQ, Wang K, et al. A genome-wide meta-analysis of six type 1 diabetes cohorts identifies multiple associated loci. PLoS Genet. 2011;7:e1002293.
- Mero IL, Ban M, Lorentzen AR, et al. Exploring the CLEC16A gene reveals a MS-associated variant with correlation to the relative expression of CLEC16A isoforms in thymus. Genes Immun. 2011;12:191–198.
- Tian J, Wang Z, Mei S, et al. CancerSplicingQTL: a database for genome-wide identification of splicing QTLs in human cancer. Nucleic Acids Res. 2019;47:D909–d16.
- Buniello A, MacArthur JAL, Cerezo M, et al. The NHGRI-EBI GWAS catalog of published genome-wide association studies, targeted arrays and summary statistics 2019. Nucleic Acids Res. 2019;47:D1005–d12.
- Liu Z, Huang Y. Advantages of proteins being disordered. Protein Sci. 2014;23:539–550.
- Babu MM. The contribution of intrinsically disordered regions to protein function, cellular complexity, and human disease. Biochem Soc Trans. 2016;44:1185–1200.
- Fishbain S, Inobe T, Israeli E, et al. Sequence composition of disordered regions fine-tunes protein half-life. Nat Struct Mol Biol. 2015;22:214–221.
- Chew LH, Lu S, Liu X, et al. Molecular interactions of the Saccharomyces cerevisiae Atg1 complex provide insights into assembly and regulatory mechanisms. Autophagy. 2015;11:891–905.
- Wang B, Merillat SA, Vincent M, et al. Loss of the ubiquitin-conjugating enzyme UBE2W results in susceptibility to early postnatal lethality and defects in skin, immune, and male reproductive systems. J Biol Chem. 2016;291:3030–3042.
- Cheng Y, LeGall T, Oldfield CJ, et al. Abundance of intrinsic disorder in protein associated with cardiovascular disease. Biochemistry. 2006;45:10448–10460.
- Du Z, Uversky VN. A comprehensive survey of the roles of highly disordered proteins in type 2 diabetes. Int J Mol Sci. 2017;18:10.
- Kulkarni P, Uversky VN. Intrinsically disordered proteins in chronic diseases. Biomolecules. 2019;9:147.
- Hegyi H, Buday L, Tompa P. Intrinsic structural disorder confers cellular viability on oncogenic fusion proteins. PLoS Comput Biol. 2009;5:e1000552.
- Mei Y, Glover K, Su M, et al. Conformational flexibility of BECN1: essential to its key role in autophagy and beyond. Protein Sci. 2016;25:1767–1785.
- Mistry J, Chuguransky S, Williams L, et al. Pfam: the protein families database in 2021. Nucleic Acids Res. 2021;49:D412–d9.
- Erdős G, Dosztányi Z. analyzing protein disorder with IUPred2A. Curr Protoc Bioinformatics. 2020;70:e99.
- Hatos A, Hajdu-Soltész B, Monzon AM, et al. DisProt: intrinsic protein disorder annotation in 2020. Nucleic Acids Res. 2020;48:D269–d76.
- Jones DT, Cozzetto D. DISOPRED3: precise disordered region predictions with annotated protein-binding activity. Vol. 31. England): Bioinformatics (Oxford; 2015. p. 857–863.
- Uversky VN. The intrinsic disorder alphabet. III. dual personality of serine. Intrinsically Disord Proteins. 2015;3:e1027032.
- Mateos B, Conrad-Billroth C, Schiavina M, et al. The ambivalent role of proline residues in an intrinsically disordered protein: from disorder promoters to compaction facilitators. J Mol Biol. 2020;432:3093–3111.
- Theillet FX, Kalmar L, Tompa P, et al. The alphabet of intrinsic disorder: i. act like a pro: on the abundance and roles of proline residues in intrinsically disordered proteins. Intrinsically Disord Proteins. 2013;1:e24360.
- Popelka H, Uversky VN, Klionsky DJ. Identification of Atg3 as an intrinsically disordered polypeptide yields insights into the molecular dynamics of autophagy-related proteins in yeast. Autophagy. 2014;10:1093–1104.
- Tompa P. Intrinsically unstructured proteins. Trends Biochem Sci. 2002;27:527–533.
- Sahu D, Bastidas M, Showalter SA. Generating NMR chemical shift assignments of intrinsically disordered proteins using carbon-detected NMR methods. Anal Biochem. 2014;449:17–25.
- Marsh JA, Singh VK, Jia Z, et al. Sensitivity of secondary structure propensities to sequence differences between alpha- and gamma-synuclein: implications for fibrillation. Protein Sci. 2006;15:2795–2804.
- Redmann V, Lamb CA, Hwang S, et al. Clec16a is critical for autolysosome function and purkinje cell survival. Sci Rep. 2016;6:23326.
- Harris BS, Fairfield HE, Reinholdt LG, et al. The first Clec16a mutant mouse exhibits defects in digits and tail MGI direct data submission. MGI. 2013;J:190968.
- Harris B, Ward-Bailey P, Bergstrom D, et al. Curvy tail: a new skeletal mutation that maps to chromosome 16 MGI direct data submission. MGI. 2011;J:172931.
- Kaufman BA, Li C, Soleimanpour SA. Mitochondrial regulation of beta-cell function: maintaining the momentum for insulin release. Mol Aspects Med. 2015;42:91–104.
- Suliman HB, Carraway MS, Tatro LG, et al. A new activating role for CO in cardiac mitochondrial biogenesis. J Cell Sci. 2007;120:299–308.
- Piantadosi CA, Carraway MS, Babiker A, et al. Heme oxygenase-1 regulates cardiac mitochondrial biogenesis via Nrf2-mediated transcriptional control of nuclear respiratory factor-1. Circ Res. 2008;103:1232–1240.
- Jin SM, Youle RJ. PINK1- and parkin-mediated mitophagy at a glance. J Cell Sci. 2012;125:795–799.
- Sun N, Malide D, Liu J, et al. A fluorescence-based imaging method to measure in vitro and in vivo mitophagy using mt-Keima. Nat Protoc. 2017;12:1576–1587.
- Darling AL, Uversky VN. Intrinsic disorder and posttranslational modifications: the darker side of the biological dark matter. Front Genet. 2018;9:158.
- van der Lee R, Lang B, Kruse K, et al. Intrinsically disordered segments affect protein half-life in the cell and during evolution. Cell Rep. 2014;8:1832–1844.
- de Bie P, Ciechanover A. Ubiquitination of E3 ligases: self-regulation of the ubiquitin system via proteolytic and non-proteolytic mechanisms. Cell Death Differ. 2011;18:1393–1402.
- Schumacher FR, Wilson G, Day CL. The N-terminal extension of UBE2E ubiquitin-conjugating enzymes limits chain assembly. J Mol Biol. 2013;425:4099–4111.
- Keul ND, Oruganty K, Schaper Bergman ET, et al. The entropic force generated by intrinsically disordered segments tunes protein function. Nature. 2018;563:584–588.
- Das RK, Ruff KM, Pappu RV. Relating sequence encoded information to form and function of intrinsically disordered proteins. Curr Opin Struct Biol. 2015;32:102–112.
- Davey NE, Van Roey K, Weatheritt RJ, et al. Attributes of short linear motifs. Mol Biosyst. 2012;8:268–281.
- Bah A, Forman-Kay JD. Modulation of intrinsically disordered protein function by post-translational modifications. J Biol Chem. 2016;291:6696–6705.
- Das RK, Pappu RV. Conformations of intrinsically disordered proteins are influenced by linear sequence distributions of oppositely charged residues. Proceedings of the National Academy of Sciences of the United States of America. 2013;110:13392–13397.
- Firman T, Ghosh K. Sequence charge decoration dictates coil-globule transition in intrinsically disordered proteins. J Chem Phys. 2018;148:123305.
- Martin EW, Holehouse AS, Grace CR, et al. Sequence determinants of the conformational properties of an intrinsically disordered protein prior to and upon multisite phosphorylation. J Am Chem Soc. 2016;138:15323–15335.
- Stothard P. The sequence manipulation suite: javaScript programs for analyzing and formatting protein and DNA sequences. Biotechniques. 2000;28:1102, 4.
- Sigrist CJ, Cerutti L, Hulo N, et al. PROSITE: a documented database using patterns and profiles as motif descriptors. Brief Bioinform. 2002;3:265–274.
- Letunic I, Khedkar S, Bork P. SMART: recent updates, new developments and status in 2020. Nucleic Acids Res. 2021;49:D458–d60.
- Popelka H. Dancing while self-eating: protein intrinsic disorder in autophagy. Prog Mol Biol Transl Sci. 2020;174:263–305.
- Mei Y, Su M, Soni G, et al. Intrinsically disordered regions in autophagy proteins. Proteins. 2014;82:565–578.
- Yamamoto H, Fujioka Y, Suzuki SW, et al. The intrinsically disordered protein atg13 mediates supramolecular assembly of autophagy initiation complexes. Dev Cell. 2016;38:86–99.
- Popelka H, Klionsky DJ. Analysis of the native conformation of the LIR/AIM motif in the Atg8/LC3/GABARAP-binding proteins. Autophagy. 2015;11:2153–2159.
- van Luijn Mm, Kreft KL, Jongsma ML, et al. Multiple sclerosis-associated CLEC16A controls HLA class II expression via late endosome biogenesis. Brain. 2015;138:1531–1547.
- Kim S, Naylor SA, DiAntonio A. Drosophila golgi membrane protein ema promotes autophagosomal growth and function. Proceedings of the National Academy of Sciences of the United States of America. 2012;109:E1072–81.
- Kim S, Wairkar YP, Daniels RW, et al. The novel endosomal membrane protein ema interacts with the class C Vps-HOPS complex to promote endosomal maturation. J Cell Biol. 2010;188:717–734.
- Yin J, Huang Y, Guo P, et al. GOP-1 promotes apoptotic cell degradation by activating the small GTPase Rab2 in C. elegans. J Cell Biol. 2017;216:1775–1794.
- Yamano K, Wang C, Sarraf SA, et al. Endosomal Rab cycles regulate parkin-mediated mitophagy. eLife. 2018;7. DOI:10.7554/eLife.31326.
- Oates ME, Romero P, Ishida T, et al. D(2)P(2): database of disordered protein predictions. Nucleic Acids Res. 2013;41:D508–16.
- Iakoucheva LM, Brown CJ, Lawson JD, et al. Intrinsic disorder in cell-signaling and cancer-associated proteins. J Mol Biol. 2002;323:573–584.
- Marsh JA, Forman-Kay JD. Sequence determinants of compaction in intrinsically disordered proteins. Biophys J. 2010;98:2383–2390.
- Glaves R, Baer M, Schreiner E, et al. Conformational dynamics of minimal elastin-like polypeptides: the role of proline revealed by molecular dynamics and nuclear magnetic resonance. Chemphyschem. 2008;9:2759–2765.
- Dunker AK, Brown CJ, Lawson JD, et al. Intrinsic disorder and protein function. Biochemistry. 2002;41:6573–6582.
- Pang CN, Hayen A, Wilkins MR. Surface accessibility of protein post-translational modifications. J Proteome Res. 2007;6:1833–1845.
- Murphy P, Xu Y, Rouse SL, et al. Functional 3D architecture in an intrinsically disordered E3 ligase domain facilitates ubiquitin transfer. Nat Commun. 2020;11:3807.
- Lu B, Kennedy B, Clinton RW, et al. Steric interference from intrinsically disordered regions controls dynamin-related protein 1 self-assembly during mitochondrial fission. Sci Rep. 2018;8:10879.
- Chakrabortee S, Tripathi R, Watson M, et al. Intrinsically disordered proteins as molecular shields. Mol Biosyst. 2012;8:210–219.
- Wichapong K, Silvestre-Roig C, Braster Q, et al. Structure-based peptide design targeting intrinsically disordered proteins: novel histone H4 and H2A peptidic inhibitors. Comput Struct Biotechnol J. 2021;19:934–948.
- Sabari BR, Dall’Agnese A, Boija A, et al. Coactivator condensation at super-enhancers links phase separation and gene control. Science (New York, NY). 2018;361. DOI:10.1126/science.aar3958.
- Kim MY, Na I, Kim JS, et al. Rational discovery of antimetastatic agents targeting the intrinsically disordered region of MBD2. Sci Adv. 2019;5:eaav9810.
- Ambadipudi S, Zweckstetter M. Targeting intrinsically disordered proteins in rational drug discovery. Expert Opin Drug Discov. 2016;11:65–77.
- Jozefczuk J, Drews K, Adjaye J. Preparation of mouse embryonic fibroblast cells suitable for culturing human embryonic and induced pluripotent stem cells. J vis exp. 2012. DOI:10.3791/3854
- Seluanov A, Vaidya A, Gorbunova V. Establishing primary adult fibroblast cultures from rodents. J Vis Exp. 2010. DOI:10.3791/2033
- Claiborn KC, Sachdeva MM, Cannon CE, et al. Pcif1 modulates Pdx1 protein stability and pancreatic β cell function and survival in mice. J Clin Invest. 2010;120:3713–3721.
- Sanjana NE, Shalem O, Zhang F. Improved vectors and genome-wide libraries for CRISPR screening. Nat Methods. 2014;11:783–784.
- Sidarala V, Zhu J, Levi-D‘Ancona E, et al. Mitofusin 1 and 2 regulation of mitochondrial DNA content is a critical determinant of glucose homeostasis. Nature Communications. 2022:13(1):2340.
- Sachdeva MM, Claiborn KC, Khoo C, et al. Pdx1 (MODY4) regulates pancreatic beta cell susceptibility to ER stress. Proceedings of the National Academy of Sciences of the United States of America. 2009;106:19090–19095.
- Soleimanpour SA, Crutchlow MF, Ferrari AM, et al. Calcineurin signaling regulates human islet {beta}-cell survival. J Biol Chem. 2010;285:40050–40059.
- Khoo C, Yang J, Rajpal G, et al. Endoplasmic reticulum oxidoreductin-1-like β (ERO1lβ) regulates susceptibility to endoplasmic reticulum stress and is induced by insulin flux in β-cells. Endocrinology. 2011;152:2599–2608.
- Kolesar JE, Wang CY, Taguchi YV, et al. Two-dimensional intact mitochondrial DNA agarose electrophoresis reveals the structural complexity of the mammalian mitochondrial genome. Nucleic Acids Res. 2013;41:e58.
- Bolte S, Cordelières FP. A guided tour into subcellular colocalization analysis in light microscopy. J Microsc. 2006;224:213–232.