
ABSTRACT
Severe acute respiratory syndrome coronavirus 2 (SARS-CoV-2) infection is closely related to various cellular aspects associated with autophagy. However, how SARS-CoV-2 mediates the subversion of the macroautophagy/autophagy pathway remains largely unclear. In this study, we demonstrate that overexpression of the SARS-CoV-2 ORF7a protein activates LC3-II and leads to the accumulation of autophagosomes in multiple cell lines, while knockdown of the viral ORF7a gene via shRNAs targeting ORF7a sgRNA during SARS-CoV-2 infection decreased autophagy levels. Mechanistically, the ORF7a protein initiates autophagy via the AKT-MTOR-ULK1‐mediated pathway, but ORF7a limits the progression of autophagic flux by activating CASP3 (caspase 3) to cleave the SNAP29 protein at aspartic acid residue 30 (D30), ultimately impairing complete autophagy. Importantly, SARS-CoV-2 infection-induced accumulated autophagosomes promote progeny virus production, whereby ORF7a downregulates SNAP29, ultimately resulting in failure of autophagosome fusion with lysosomes to promote viral replication. Taken together, our study reveals a mechanism by which SARS-CoV-2 utilizes the autophagic machinery to facilitate its own propagation via ORF7a.Abbreviations: 3-MA: 3-methyladenine; ACE2: angiotensin converting enzyme 2; ACTB/β-actin: actin beta; ATG7: autophagy related 7; Baf A1: bafilomycin A1; BECN1: beclin 1; CASP3: caspase 3; COVID-19: coronavirus disease 2019; GFP: green fluorescent protein; hpi: hour post-infection; hpt: hour post-transfection; MAP1LC3/LC3: microtubule associated protein 1 light chain 3; MERS: Middle East respiratory syndrome; MTOR: mechanistic target of rapamycin kinase; ORF: open reading frame; PARP: poly(ADP-ribose) polymerase; SARS-CoV-2: severe acute respiratory syndrome coronavirus 2; shRNAs: short hairpin RNAs; siRNA: small interfering RNA; SNAP29: synaptosome associated protein 29; SQSTM1/p62: sequestosome 1; STX17: syntaxin 17; TCID50: tissue culture infectious dose; TEM: transmission electron microscopy; TUBB, tubulin, beta; ULK1: unc-51 like autophagy activating kinase 1.
Introduction
Severe acute respiratory syndrome coronavirus-2 (SARS-CoV-2) is the causative pathogen of the deadly ongoing epidemic of coronavirus disease 2019 (COVID-19) and has rapidly expanded worldwide since its discovery, posing a severe threat to global public health and economies [Citation1,Citation2]. Following its identification at the very end of 2019, it emerged as one of the most compelling, economical disasters in the wake of earlier outbreaks of respiratory infections SARS and Middle East respiratory syndrome (MERS) [Citation3]. In particular, while there is a growing understanding of SARS-CoV-2 in terms of virology and epidemiology, no effective anti-SARS-CoV-2 therapeutic drug available for COVID-19 treatment has yet been discovered [Citation4]. As the pandemic unfolds, further investigation into the high infectivity and pathogenicity of this virus is needed.
SARS-CoV-2, which belongs to the β-coronavirus genus of the Coronaviridae family, is a nonsegmented positive sense single-stranded RNA (ssRNA) virus. The SARS-CoV-2 genome is nearly 30 kb in length and contains 14 potential open reading frames (ORFs), making it one of the largest known RNA virus genomes [Citation5]. Since SARS-CoV-2 belongs to the same family as SARS-CoV and MERS-CoV, they share several similarities. The 5′-terminal two-thirds of the genome includes two overlapping ORFs (orf1ab and orf1a), which encode 16 nonstructural proteins (NSPs). The 3′-terminus of the SARS-CoV-2 genome contains spike (S), membrane (M), envelope (E) and nucleocapsid (N) structural proteins and a number of genus-specific accessory proteins (ORF3a, ORF3b, ORF6, ORF7a, ORF7b, ORF8, ORF9b, and ORF10). In addition, the nonstructural proteins making up the replicase are involved in viral genome replication and subgenomic mRNA synthesis, while the structural proteins form the virion, and the accessory proteins modulate the host response to facilitate infection and pathogenesis [Citation6,Citation7]. Investigating the molecular mechanisms of the virus and its host interactions, such as autophagy, is key to understanding COVID-19 pathogenesis and transmission as well as developing diagnostic tools and countermeasures against these coronaviruses.
Macroautophagy, hereafter referred to as autophagy, is an evolutionarily conserved biological self-cleaning and renewal process that is important for maintaining cellular homeostasis. This process begins with the formation of a crescent membrane structures known as a phagophore/PG in the cytosol. The membranes of the phagophore subsequently expand to form an enclosed double-membrane vesicle known as an autophagosome/AP. Autophagosomes mature by fusing with a lysosome to form an autolysosome/AL, in which the cargos of autophagosomes are digested by lysosomal enzymes for recycling [Citation8]. Moreover, autophagic flux ranging from autophagosome formation to degradation is a dynamic process, so autophagosome accumulation could be due to increased autophagosome production and/or decreased degradation.
Increasing evidence indicates that autophagy can play dual roles in virus infection with either pro- or antiviral functions depending on the virus and the stage of the viral replication cycle [Citation8–11]. Specifically, autophagy is an intrinsic host defense mechanism that inhibits viral replication or eliminates viruses and their individual components by delivering them to the lysosomal compartment for degradation [Citation12,Citation13]. Moreover, some viruses hijack the components of the autophagic machinery in favor of their own replication, especially RNA viruses, such as classical swine fever virus/CSFV [Citation14,Citation15], porcine reproductive and respiratory syndrome virus/PRRSV [Citation16], rotavirus/RV [Citation17], poliovirus and mouse hepatitis virus/MHV [Citation18,Citation19]. In recent years, many reports have shown that upon cell infection, β-coronaviruses inhibit autophagy flux and cause the accumulation of autophagosomes for their replication and spread [Citation20–24]. Furthermore, recent studies have shown that SARS-CoV-2 ORF3a can block homotypic fusion and protein sorting (HOPS) complex-mediated assembly of the soluble N-ethylmaleimide-sensitive factor attachment protein receptor (SNARE) complex to inhibit the fusion of autophagosomes and amphisomes with lysosomes [Citation25–27]. Nevertheless, the underlying mechanisms of how other SARS-CoV-2 proteins inhibit autophagy flow remain poorly understood.
In this study, we provide evidence that autophagosome accumulation was triggered by SARS-CoV-2 ORF7a in multiple cells. More importantly, ORF7a impaired autophagosome-lysosome fusion by cleaving SNAP29 via CASP3 at amino acid (aa) D30, which plays a critical role in SARS-CoV-2 replication. A better comprehension of the interactions between SARS-CoV-2 and host autophagic responses will provide new insights into viral pathogenesis and antiviral drug development.
Results
SARS-CoV-2 infection triggers the accumulation of autophagosomes
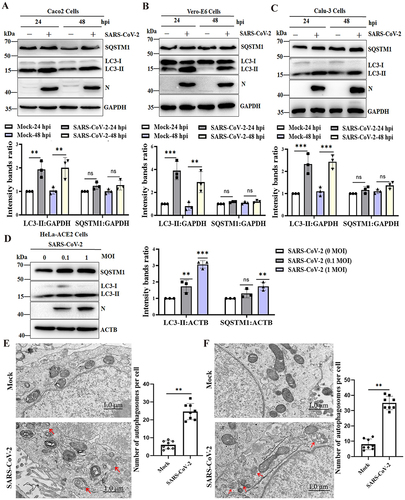
A previous study showed that SARS-CoV-2 infection induces autophagy in HeLa cells expressing human ACE2 (angiotensin converting enzyme 2) [Citation25]. To determine whether SARS-CoV-2 infection also triggered the autophagic response in permissive cells, Caco2, Vero-E6 and Calu-3 cells were infected with SARS-CoV-2 for 24 h post-infection (hpi) and 48 hpi, and the conversion of MAP1LC3/LC3 (microtubule associated protein 1 light chain 3)-I to LC3-II and the change in SQSTM1/p62 expression, which are considered important indicators of autophagy initiation and autophagic flux, were determined. The results of mock-infected and SARS-CoV-2-infected cells confirmed that the protein levels of LC3-II were dramatically increased at 24 hpi and 48 hpi but that the expression of SQSTM1 was not decreased after SARS-CoV-2 infection in susceptible Caco2, Vero-E6 and Calu-3 cells (). As expected, the expression of LC3-II and SQSTM1 in HeLa-ACE2 cells was dose-dependently increased compared to that in mock-infected cells (), indicating that autophagic turnover was blocked during SARS-CoV-2 infection in multiple cell lines. Furthermore, transmission electron microscopy (TEM) was used to perform ultrastructural analysis of Caco2 and Vero-E6 cells infected with SARS-CoV-2, and more double-membrane vesicles assumed to be autophagosomes notably appeared in SARS-CoV-2-infected cells, while autophagosomes were hardly seen in the mock-infected cells (). Together, these results showed that SARS-CoV-2 infection triggered the accumulation of autophagosomes.
Figure 1. SARS-CoV-2 infection induces the accumulation of autophagosomes. Caco2 cells (A), Vero-E6 cells (B) and Calu-3 cells (C) were infected with SARS-CoV-2 at an MOI of 0.01, and cell lysates were collected at 24 and 48 hpi. The viral N protein was used as an indication of viral infection. GAPDH was used as a loading control. (D) HeLa-ACE2 cells were infected with SARS-CoV-2 at MOIs of 0, 0.1 and 1 for 24 h. The viral N protein was used as an indication of viral infection. ACTB was used as a loading control. The relative protein expression levels were quantified by densitometry analysis of at least three independent replicates. Error bars represent standard deviations of the means (n = 3). Ns, p > 0.05; **, p < 0.01; ***, p < 0.001. Autophagy confirmation by TEM in Caco2 cells (E) and Vero-E6 cells (F) was either mock infected or infected with SARS-CoV-2 (MOI, 0.01). After 24 h, the cells were collected, prepared into ultrathin sections and imaged under TEM. TEM showed the presence of double membrane vacuoles identified as autophagosomes in SARS-CoV-2-infected cells (arrowheads). Scale bars: 1.0 μm. The bar graph showed quantitative analysis of the number of autophagosomes observed by TEM in infected cells compared to noninfected cells. Autophagic vacuoles were counted from eight randomly selected fields. Values were expressed as the mean ± SD. **, p < 0.01.
SARS-CoV-2 infection-induced accumulation of autophagosomes enhances viral replication
To evaluate whether SARS-CoV-2 infection-induced autophagy can influence viral replication, permissive cells were pretreated with 3-methyladenine (3-MA), thus establishing an autophagy inhibitory phenotype, and then infected with SARS-CoV-2 at a multiplicity of infection (MOI) of 0.01. Caco2, Vero-E6 cells and HeLa-ACE2 cells were treated with different concentrations of 3-MA (2.5 mM, 5 mM and 10 mM) for 24 h, and then cell viability was investigated. As shown in Fig. S1A, 5 mM 3-MA did not significantly affect cell viability. A significant decrease in the amount of viral N protein was observed in 3-MA-treated Caco2 cells. As expected, an additional decrease in LC3-II levels in 3-MA-treated virus-infected Caco2 cells compared to nontreated virus-infected cells was observed (), confirming further autophagy inhibition. Furthermore, supernatants from each group of cultured cells were harvested at 24 h, the genomic copies of the SARS-CoV-2 N gene, which is representative of extracellular viral yields, were measured by RT-qPCR, and the 50% tissue culture infectious dose (TCID50) was determined. As shown in , the mRNA levels of the SARS-CoV-2 N gene in the 3-MA-pretreated group were significantly lower than those in the DMSO-pretreated group at 24 h. SARS-CoV-2 titers in the cells pretreated with DMSO were 105.5 TCID50/ml, whereas the SARS-CoV-2 titers in 3-MA-pretreated cells were 104.6 TCID50/ml (). Similar results were observed in 3-MA-treated Vero-E6 cells () and HeLa-ACE2 cells ().
Figure 2. Inhibition of autophagosome formation suppresses viral yields. (A) Caco2 cells were pretreated with DMSO or 3-MA (5 mM) for 6 h and then either mock infected or infected with SARS-CoV-2 (MOI = 0.01) for 24 h. Cell lysates were evaluated by western blotting using specific antibodies for LC3 and intracellular virion production. (B) Quantification of extracellular viral RNA from SARS-CoV-2-infected Caco2 cells treated with 3-MA by real-time quantitative PCR. (C) Supernatants of SARS-CoV-2 (MOI = 0.01)-infected Caco2 cells were harvested at 24 hpi, and extracellular virus titers were determined by the TCID50 assay. Vero-E6 cells were pretreated with 3-MA (5 mM) and infected with SARS-CoV-2 as in (A). Cells were harvested and analyzed by western blotting (D), and supernatants of virus-infected cells were used to determine extracellular viral RNA (E) and extracellular virus titers (F). HeLa-ACE2 cells were pretreated with 3-MA (5 mM) and infected with SARS-CoV-2 as in (A). The cells were harvested and analyzed by western blotting (G), and the supernatants of virus-infected cells were analyzed for extracellular viral RNA (H) and extracellular virus titers (I). (J) HeLa-ACE2 cells were transfected with siNC (100 nM) or siRNA targeting the ATG7 gene (siATG7, 100 nM) and then infected with SARS-CoV-2 (MOI = 0.01) or mock infected. The cells were harvested and subjected to western blot analysis. (K) Quantification of viral RNA of extracellular virion production by real-time quantitative PCR. (L) Viral titers of extracellular virion production in ATG7 gene-knockdown cells by TCID50. The quantification results were expressed as viral RNA copy numbers per μL of RNA from a sample of SARS-CoV-2-infected cells. TCID50 was calculated using Reed-Munch mathematical analysis. Data were presented as the mean ± SD from three replicates. *, p < 0.05; **, p < 0.01; ***, p < 0.001.
To further confirm that the inhibition of autophagy suppressed SARS-CoV-2 replication, HeLa-ACE2 cells were transfected with small interfering RNA (siRNA) fragments specifically targeting ATG7 (autophagy related 7) to reduce the endogenous levels of the ATG7 autophagy protein. As shown in , the protein levels of endogenous ATG7 and LC3-II in cells treated with the siRNA duplexes were significantly lower than those in cells treated with nontargeting control siRNA (siNC). Moreover, the ratios of the viral N protein to GAPDH in ATG7-knockdown cell lysates decreased significantly compared with those in control cell lysates. Simultaneously, we found that siRNA-mediated autophagic protein knockdown in SARS-CoV-2-infected cells led to decreased N gene copy numbers in comparison to siNC (). In addition, the SARS-CoV-2 titers in ATG7-knockdown cell culture supernatant were lower than those in the supernatant of siNC-treated cells (). Collectively, these results demonstrate that the inhibition of autophagy could inhibit SARS-CoV-2 intracellular and extracellular viral loads, suggesting that autophagy is required for efficient viral replication.
ORF7a protein of SARS-CoV-2 can induce the accumulation of autophagosomes in multiple cell lines
Although overexpression of ORF7a in HEK293T cells could induce SQSTM1 and LC3-II accumulation [Citation28], the autophagy induced by ORF7a in other cell lines and its mechanism remain obscure. Next, the functional conservation of ORF7a-modulated autophagy was analyzed in ORF7a-transfected multiple cells. Intriguingly, consistent with the immunoblotting data from SARS-CoV-2-infected cells, the results showed that the ratio of endogenous LC3-II:ACTB in HA- and GFP-tagged ORF7a-transfected cells was significantly increased, but no decrease in SQSTM1 expression was observed compared with that in empty vector-transfected HeLa cells ( and Fig. S1B and 1C). Furthermore, ORF7a-expressing HeLa cells at 24 h post-transfection (hpt) or 48 hpt had a modest effect on the transcriptional regulation of SQSTM1 mRNA (Fig. S1D), suggesting that the increased SQSTM1 levels were most likely responsible for increased SQSTM1 protein levels. Similarly, blocked autophagy flow was observed in ORF7a-overexpressing Caco2 () and Vero-E6 cells (), indicating that ORF7a could induce the accumulation of autophagosomes in multiple cell lines.
Figure 3. ORF7a expression is sufficient to inhibit autophagic flux. HeLa cells (A), Caco2 cells (B) and Vero-E6 cells (C) were transfected with empty vector or ORF7a-HA. At 24 h or 48 h after transfection, cell lysates were subjected to western blotting analysis. The expression of ORF7a was verified by western blotting using anti-HA antibodies. ACTB served as the protein-loading control. The relative protein expression levels were quantified by densitometry analysis of at least three independent replicates. Error bars represented standard deviations of the means (n = 3). *, p < 0.05; **, p < 0.01; ***, p < 0.001. (D) HeLa cells were cotransfected with GFP-LC3 and ORF7a-HA or empty vector for 24 h, and then the cells were fixed and immunostained with DAPI (blue) to stain nuclear DNA. Autophagosomes (green) were observed under a confocal microscope. Scale bar: 10 μm. Quantification of LC3 puncta/cell in HeLa cells was performed from randomly selected cells. Values are expressed as the mean ± SD. **, p < 0.01. (E) HeLa cells were transfected with GFP-mCherry-LC3 and ORF7a-HA or empty vector for 24 h. Then, the cells were fixed, and the fluorescence signals of GFP and mCherry were assessed by confocal immunofluorescence microscopy. Scale bars: 10 μm. Quantification of yellow puncta/cell in HeLa cells was performed from randomly selected cells. Values are expressed as the mean ± SD. **, p < 0.01. (F) HeLa-ACE2 cells were transfected with empty vector or ORF7a-HA for 24 h and then either mock infected or infected with SARS-CoV-2 (MOI = 0.01) for 24 h and 48 h. Cell lysates were subjected to western blotting analysis. The expression of ORF7a was verified by western blotting using anti-HA antibodies. ACTB served as the protein-loading control. The relative protein expression levels were quantified by densitometry analysis of at least three independent replicates. Error bars represent standard deviations of the means (n = 3). **, p < 0.01; ***, p < 0.001. (G) Vero-E6 cells and HeLa-ACE2 cells were transfected with shNC or shRNA-ORF7a for 24 h and then infected with SARS-CoV-2 (MOI = 0.01). Cell lysates were subjected to autophagy analysis by western blot. The silencing effects of ORF7a were verified by western blotting using anti-ORF7a antibodies. The relative protein expression levels were quantified by densitometry analysis of at least three independent replicates. Error bars represent standard deviations of the means (n = 3). Ns, p > 0.05; **, p < 0.01; ***, p < 0.001.
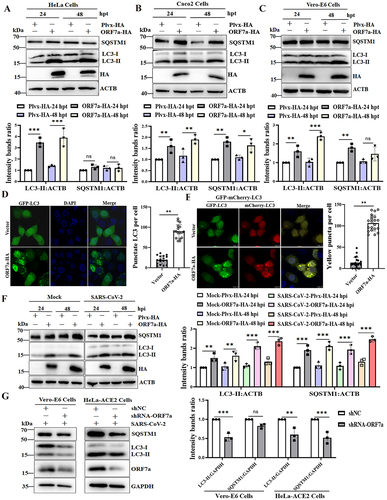
Green fluorescent protein (GFP)-LC3 fluorescence microscopy is a well-accepted method of monitoring autophagosome formation, as measured by a change in the GFP-LC3 fluorescence pattern from a diffuse to punctate distribution [Citation29]. Thus, the GFP-LC3 punctate structure that primarily represents autophagosomes was further analyzed in ORF7a-transfected cells. As shown in , obvious punctate GFP-LC3 accumulation was observed in ORF7a-transfected cells, confirming that ORF7a indeed induces the formation of autophagosomes. To more precisely assess ORF7a protein-inhibited autophagic flux, we used GFP-mCherry-LC3, a tandem reporter system. In this system, the GFP of a tandem autophagosome reporter is sensitive and attenuated in an acidic lysosomal environment, whereas mCherry is not [Citation30]. When we cotransfected cells with plasmids encoding GFP-mCherry-LC3 and ORF7a, many yellow dots, representing GFP- and mCherry-positive (yellow) autophagosomes, were observed in cells coexpressing GFP-mCherry-LC3 and ORF7a (). In addition, the fusion of autophagosomes and lysosomes was detected by an immunofluorescence assay of colocalization between GFP-LC3 (autophagosome marker) and LAMP1 (lysosomal marker). Accordingly, the colocalization of autophagosomes and lysosomes was blocked in ORF7a-overexpressing cells (Fig. S1E), indicating that ORF7a impairs the fusion of autophagosomes with lysosomes. Furthermore, autophagic flux upon ORF7a expression in the presence and absence of the lysosomal inhibitor bafilomycin A1 (Baf A1) was analyzed. Consistently, the expression of ORF7a did not lead to a dramatic elevation in LC3-II and SQSTM1 levels in HeLa cells treated with Baf A1 (Fig. S1F). Moreover, the increased conversion of LC3-I to LC3-II and SQSTM1 expression were observed in ORF7a-transfected HeLa-ACE2 cells upon SARS-CoV-2 infection (). Most importantly, the contribution of individual viral ORF7a protein to autophagy was determined by short hairpin RNAs (shRNAs) targeting ORF7a sgRNA during SARS-CoV-2 infection. As expected, designed shRNAs for the viral ORF7a gene effectively inhibited SARS-CoV-2 ORF7a expression in Vero-E6 cells and HeLa-ACE2 cells during SARS-CoV-2 infection and decreased autophagy levels () without affecting the expression of other genes and full-length genomic mRNA (Fig. S2A and 2B). A significant reduction in the yield of progeny virus was observed (Fig. S2C and 2D), suggesting that ORF7a contributes to SARS-CoV-2-induced incomplete autophagy. Collectively, our results reveal that SARS-CoV-2 ORF7a is sufficient to trigger the autophagic accumulation response.
The ORF7a protein and SARS-CoV-2 infection initiate autophagy via the AKT-MTOR-ULK1‐mediated pathway
Many studies have shown that the AKT-MTOR (mechanistic target of rapamycin kinase)-ULK1 (unc-51 like autophagy activating kinase 1) modulated by MTOR is a key signaling pathway for autophagy initiation [Citation31,Citation32]. Here, we determined whether ORF7a efficiently initiates autophagy through the AKT-MTOR-ULK1 pathway. As shown in , ORF7a overexpression led to the suppression of AKT phosphorylation at Ser473, which subsequently resulted in the time-dependent reduction in MTOR phosphorylation at Ser2448 from 24 to 48 hpt, although the levels of total AKT and MTOR were comparable in ORF7a- and control vector-transfected HeLa cells. More specifically, phosphorylation at Ser757 is reported to prevent the formation of its complex with ATG13, RB1CC1/FIP200, and ATG101 [Citation33]. ORF7a overexpression largely diminished ULK1 kinase activity, as indicated by the decreased phosphorylation of ULK1 at Ser757, demonstrating that AKT-MTOR-ULK1 signaling regulated by ORF7a might induce the initial stages of autophagy. To further validate whether AKT, MTOR and its downstream target ULK1 were involved in ORF7a-induced autophagy, the effects of the AKT inhibitor (LY294002) and MTOR inhibitor (rapamycin) were evaluated by assessing their effects on LC3-II levels. As shown in , the inhibition of activated AKT (p-AKT) resulted in an increase in the amount of LC3-II compared to that in the DMSO-treated group. Moreover, the inhibition of MTOR (rapamycin) decreased ULK1 phosphorylation and significantly promoted LC3-II accumulation, in which LY294002 and rapamycin did not affect cell viability (Fig. S3A and 3B), indicating that MTOR and ULK1, as downstream elements of AKT signaling, were involved in the process of ORF7a-induced autophagy.
Figure 4. The ORF7a protein and SARS-CoV-2 infection induce the initial stages of autophagy via suppression of the AKT-MTOR-ULK1-mediated pathway. (A) HeLa cells were transfected with ORF7a-HA or empty vector as indicated for 24 and 48 h, respectively. Total protein was subjected to western blotting analysis using antibodies recognizing p-AKT, total AKT, p-MTOR, total MTOR, p-ULK1, total ULK1, and ACTB as a loading control. (B) HeLa cells were transfected with ORF7a-HA or empty vector for 12 h and then cultured in medium with the indicated DMSO, LY294002 (10 μM) or rapamycin (2 μM) for 24 h. Western blotting analysis was performed as described in (A). (C) Caco2 cells were infected with SARS-CoV-2 at an MOI of 0.01 or mock infected, and the cell lysates were collected for western blotting analysis as in (A). The band intensities of phosphorylated AKT, MTOR and ULK1 were determined and normalized to those of total AKT, MTOR and ULK1 as well as ACTB or GAPDH. The intensity binding ratio for the control was given a value of 1, and the relative protein expression levels were quantified by densitometry analysis of at least three independent replicates. Error bars represent standard deviations of the means (n = 3). Ns, p > 0.05; *, p < 0.05; **, p < 0.01; ***, p < 0.001.
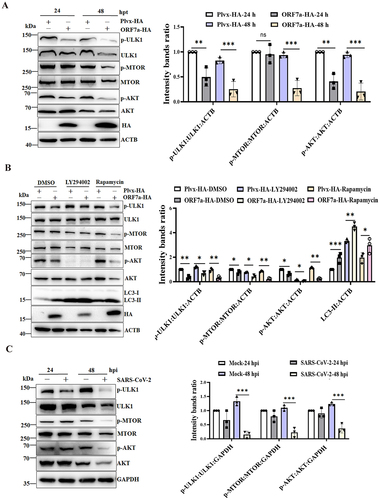
Furthermore, we also investigated whether SARS-CoV-2 infection induces autophagy by regulating the AKT-MTOR-ULK1 pathway. The western blot results indicated that the phosphorylation levels of AKT, MTOR and ULK1 were significantly decreased in SARS-CoV-2-infected cells over time (), demonstrating that AKT-MTOR-ULK1 signaling in response to viral infection might be linked to inducing the initial stages of autophagy. Taken together, these results suggest that the ORF7a protein induces the initial stages of autophagy by suppressing the AKT-MTOR-ULK1-mediated pathway.
SARS-CoV-2 ORF7a impairs autophagosome-lysosome fusion by decreasing SNAP29 in a CASP3 activity-dependent manner
Several studies have reported that the interaction between STX17 (syntaxin 17), SNAP29 (synaptosome associated protein 29) and the late endosome/lysosome SNARE protein facilitates autophagosome fusion with the late endosome/lysosome [Citation34]. To reveal the specificity of ORF7a in the regulation of autophagic flux, the levels of STX17 and SNAP29 expression in ORF7a transient transfection experiments were first determined. The results showed that overexpression of ORF7a significantly decreased the level of endogenous SNAP29 expression, while it did not affect the level of endogenous STX17 (). Moreover, this has also been shown to occur in SARS-CoV-2-infected cells in comparison with mock-infected cells (). Next, the ORF7a gene was knocked down during SARS-CoV-2 infection to further verify that ORF7a affected the stability of the SNAP29 protein. As shown in Fig. S3C, silencing ORF7a expression restored SNAP29 expression in the presence of SARS-CoV-2 infection, indicating that ORF7a expression reduced SNAP29 protein stability.
Figure 5. SARS-CoV-2 ORF7a impairs autophagosome-lysosome fusion by lowering SNAP29 expression via the CASP3-mediated pathway. (A) HeLa cells were transfected with ORF7a-HA or empty vector plasmids. At 24 and 48 hpt, the cells were lysed and analyzed by immunoblotting. (B) HeLa-ACE2 cells were either mock infected or infected with SARS-CoV-2 at an MOI of 0.01. At 24 hpi and 48 hpi, the cells were lysed for western blotting analysis. The viral ORF7a protein was used as an indication of viral infection. (C) HeLa cells were transfected with the ORF7a-HA or empty vector plasmids for 12 h, and then the cells were treated with Baf A1 (0.5 μM), MG132 (5 μM) or Z-VAD-FMK (10 μM) for 24 h. DMSO was used as a negative control. Western blot analysis was conducted to detect endogenous SNAP29 expression. (D) HeLa cells were cotransfected with the ORF7a-HA and SNAP29-3× FLAG plasmids for 12 h, and then the cells were treated with Baf A1 (0.5 μM), MG132 (5 μM) or Z-VAD-FMK (10 μM) for 24 h. DMSO was used as a negative control. Western blot analysis was conducted to detect SNAP29 expression with anti-FLAG antibody. (E) HeLa cells were transfected with the ORF7a-HA or empty vector plasmids for 12 h, and then the cells were treated with Z-VAD-FMK (10 μM), Ac-FLTD-CMK (10 μM), Z-DEVD-FMK (10 μM), Z-IETD-FAM (10 μM) and Z-LEHD-FAM (10 μM) for 24 h. Western blot analysis was conducted to detect endogenous SNAP29 expression. The relative protein expression levels normalized to ACTB were quantified by densitometry analysis of at least three independent replicates. Error bars represent standard deviations of the means (n = 3). Ns, p > 0.05; **, p < 0.01; ***, p < 0.001.
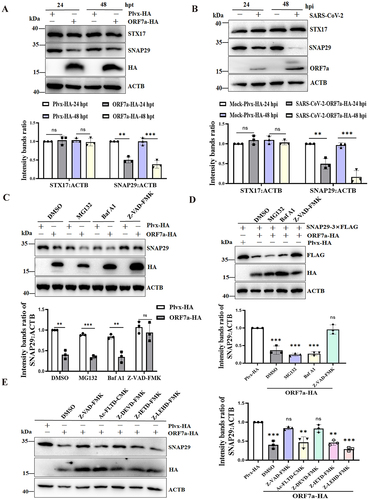
To further investigate the mechanisms responsible for the effect of ORF7a on the stability of SNAP29, ORF7a-overexpressing cells were treated with various inhibitors of protein degradation pathways, including a general caspase inhibitor (Z-VAD-FMK), a proteasome inhibitor (MG132), and a lysosome/endosome inhibitor (bafilomycin A1, Baf A1). According to the cell viability tests, the protein degradation inhibitors used in this study did not have toxic effects on HeLa cells (Fig. S3D). Notably, downregulation of the endogenous expression of SNAP29 by ORF7a was significantly restored when the cells were treated with caspase inhibitors (). Accordingly, caspase inhibitors contributed to the restored expression of exogenous SNAP29 (), indicating that SARS-CoV-2 ORF7a downregulates SNAP29 expression via a caspase activity-dependent pathway. Additionally, we further investigated which specific caspase activation was required for the decreased expression of SNAP29. We used caspase inhibitors that are representative of the different groups of caspases: Ac-FLTD-CMK for group I caspases (CASP1-like), Z-DEVD-FMK for group II caspases (CASP3-like), or Z-IETD-FMK (CASP8) and Z-LEHD-FMK (CASP9) for group III caspases in ORF7a-expressing cells. To exclude toxicity of the applied compounds, a cell viability test was performed (Fig. S3E). Cell extracts were analyzed by western blotting using endogenous anti-SNAP29. As shown in , SNAP29 expression was partially rescued in the presence of CASP3 inhibitors compared with that of the pan caspase inhibitor (, Lane 5), but other inhibitory activities of caspase inhibitors except pan caspase inhibitor had a moderate effect on the restored SNAP29 expression. Collectively, these data suggest that downregulation of SNAP29 expression impairs autophagosome-lysosome fusion by SARS-CoV-2 ORF7a via the CASP3-mediated pathway.
SARS-CoV-2 ORF7a activates CASP3 to cleave SNAP29 at aspartic acid residue 30 (D30)
To further analyze the mechanisms behind decreased SNAP29 expression via CASP3 activity utilized by the ORF7a protein, activation of CASP3 was monitored in ORF7a-expressing cells by western blot through detection of the p34 precursor cleavage fragments of p17 and p19. The results showed that CASP3 was activated in ORF7a-expressing cells (), although CASP3 is difficult to detect due to its rapid degradation once activated in HeLa cells [Citation35]. To exclude the possibility that ectopic protein expression alone does not cause artifact or nonspecific activation of CASP3, pEGFP-N1 and ORF7a-GFP were transfected into HeLa cells, and activation of CASP3 was determined. As expected, ORF7a-GFP alone could activate CASP3, while the pEGFP-N1 empty vector expressing GFP did not (Fig. S4A). Furthermore, ORF7a activated CASP3 to cleave SNAP29 in a dose- dependent manner (Fig. S4B). Moreover, an increase in activated CASP3 was also observed in SARS-CoV-2-infected ORF7a-expressing HeLa-ACE2 cells in comparison with that in SARS-CoV-2-infected control cells (), whereas activated CASP3 was decreased when the ORF7a gene was knocked down via shRNA targeting ORF7a sgRNA during SARS-CoV-2 infection (), suggesting that CASP3 activation can occur in the presence of ORF7a protein individually. Next, we used small interfering RNA (siRNA)-mediated knockdown of the CASP3 gene. Indeed, the results demonstrated that knockdown of CASP3 resulting in the stabilization of full-length SNAP29 protein was higher than that in wild-type cells upon overexpression of ORF7a (). Additionally, to further confirm that CASP3, activated by ORF7a, was responsible for the cleavage of SNAP29, ectopic coexpression of CASP3 and ORF7a in HeLa cells was performed to detect the cleavage of SNAP29. As shown in , ORF7a resulted in the activation of ectopically expressed CASP3 and induced a strong increase in caspase activity on the reduced SNAP29 compared with that of ORF7a-expressing cells individually, suggesting that CASP3 activity activated by SARS-CoV-2 ORF7a is responsible for SNAP29 reduction.
Figure 6. SARS-CoV-2 ORF7a activates CASP3 and cleaves SNAP29 at aspartic acid residue 30 (D30). (A) HeLa cells were transfected with ORF7a-HA or empty vector plasmids. At 24 and 48 hpt, the cells were lysed and analyzed by immunoblotting. (B) HeLa-ACE2 cells were infected with SARS-CoV-2 (MOI = 0.01) for 24 and 48 h, and then cell lysates were subjected to western blotting analysis. ACTB served as the protein-loading control. (C) HeLa-ACE2 cells were transfected with shNC or shRNA-ORF7a for 24 h and were infected with 0.01 MOI SARS-CoV-2 for an additional 48 h, and then cell lysates were subjected to western blot analysis. (D) HeLa cells were transfected with siNC (100 nM) or siRNA for CASP3 (siCASP3) (100 nM) for 48 h and were transfected with plasmid encoding ORF7a-HA for an additional 24 h, and then cell lysates were subjected to western blot analysis. The relative protein expression levels normalized to ACTB were quantified by densitometry analysis of at least three independent replicates. Error bars represent standard deviations of the means (n = 3). Ns, p > 0.05; **, p < 0.01. (E) HeLa cells were transfected with ORF7a-HA or cotransfected with ORF7a-HA and CASP3-FLAG recombinant plasmids. At 48 hpt, the cells were lysed and analyzed by immunoblotting. (F) Sequence analysis of SNAP29 indicated three putative sites (DARD30LPDG, DLPD33GPDA, and DGPD36APAD) with high probability scores (>0.9) for CASP3 cleavage. (G) Identification of the specific cleavage site of SNAP29. HeLa cells were transfected with the wild type or the substituted (D30E, D33E or D36E) mutant of SNAP29-3× FLAG together with ORF7a-HA or vector; simultaneously, cells were cotransfected with HA-ACTB as a control to compare the transfection efficiency of ORF7a-HA. Immunoblotting analysis of the wild type and the D30E, D33E or D36E mutant of ectopic SNAP29 proteins was performed with the FLAG antibody. The relative protein expression levels normalized to TUBB were quantified by densitometry analysis of at least three independent replicates. Error bars represent standard deviations of the means (n = 3). Ns, p > 0.05; **, p < 0.01; ***, p < 0.001.
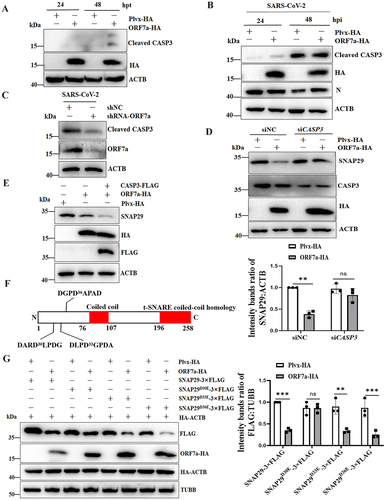
To assess whether SNAP29 might in fact have sites susceptible to cleavage by CASP3, we used the online program Cascleave [Citation36] to analyze the SNAP29 amino acid sequence for potential CASP3 cleavage sites. The candidate sites within the N-terminal domain of SNAP29 that had high probability scores (>0.9) for caspase cleavage were revealed (). Furthermore, to determine the exact cleavage site of SNAP29, substitution mutants of SNAP29 expression plasmids in which the aspartic acid residues (D) to glutamine residues (E) mutations at the identified cleavage sites were generated, and then the cleavage of SNAP29 by ORF7a-ctivated CASP3 was analyzed. After incubation with recombinant SNAP29, decreased SNAP29 expression was no longer observed with the SNAP29 protein containing the substitution at position 30 (D30E), whereas the other mutations did not influence the decreased expression of SNAP29 by ORF7a (). Taken together, these data suggest that ORF7a activates CASP3 to cleave SNAP29 at aspartic acid residue 30 (D30).
SNAP29 can trigger degradative autophagy to inhibit viral replication
Since the SNAP29 protein is involved in autophagosome fusion, the expression of SNAP29 would be related to ORF7a-induced autophagic flow. Indeed, the knockdown of SNAP29 expression further contributed to ORF7a-blocked autophagic flux, as evidenced by increased LC3-II and SQSTM1 levels (), while overexpression of SNAP29 alone was able to induce a decrease in LC3-II and SQSTM1 levels through lysosomes, indicative of increased autophagic flux (). In addition, the autophagic flux of cells expressing caspase-resistant SNAP29D30E was investigated. Our results showed that compared with the wild-type plasmid, the caspase-resistant SNAP29D30E mutant plasmid could reduce LC3-II and SQSTM1 expression to enhance autophagic flux (). Furthermore, the role of ORF7a-induced caspase in autophagic flux was investigated in ORF7a-expressing cells treated with a caspase inhibitor (Z-VAD-FMK). As revealed in , inhibition of caspase alleviated blockage of autophagic flux by ORF7a when compared with the control group, suggesting that caspase-mediated SNAP29 cleavage blocked autophagic flux.
Figure 7. SNAP29 facilitates ORF7a-induced autophagic flow to inhibit viral replication. (A) HeLa cells were transfected with siNC (100 nM) or siSNAP29 (100 nM) for 24 h. Cells were then transfected with ORF7a-HA, and after 24 h, cells were harvested, lysed and analyzed by immunoblotting with anti-SQSTM1, anti-LC3, anti-SNAP29, anti-HA and anti-ACTB antibodies. (B) HeLa cells were transfected with the same amounts of ORF7a-HA together with SNAP29-3×FLAG plasmid or vector plasmid. After 24 h, the cell lysates were analyzed by immunoblotting with anti-SQSTM1, anti-LC3, anti-FLAG, anti-HA and anti-ACTB antibodies. (C) HeLa cells were transfected with the same amounts of ORF7a-HA together with wild-type and bearing SNAP29D30E mutation plasmids. After 24 h, the cell lysates were analyzed by immunoblotting with anti-SQSTM1, anti-LC3, anti-FLAG, anti-HA and anti-ACTB antibodies. (D) HeLa cells were transfected with ORF7a-HA or empty vector plasmids. At 24 hpt, the cells were treated with DMSO or Z-VAD-FMK (10 μM). Then, the cells were harvested for western blot analysis. The relative protein expression levels of LC3 and SQSTM1 normalized to ACTB in (A), (B), (C) and (D) were quantified by densitometry analysis of at least three independent replicates. Error bars represent standard deviations of the means (n = 3). Ns, p > 0.05; *, p < 0.05; **, p < 0.01; ***, p < 0.001. (E) HeLa-ACE2 cells were transfected with empty vector or SNAP29-3× FLAG plasmids. After 24 h of transfection, the cells were infected with SARS-CoV-2 (MOI = 0.01) for 24 h. Then, the cells were harvested and analyzed by immunoblotting. (F) The cell supernatant was harvested, and the extracellular viral copy numbers of SARS-CoV-2 were measured by RT-qPCR. (G) The extracellular viral titers were measured by TCID50. The data represent the mean±SD of 3 independent experiments. *, p < 0.05; **, p < 0.01. (H) HeLa-ACE2 cells were transfected with the same amounts of ORF7a-HA together with wild-type and SNAP29D30E mutation plasmids. After 24 h of transfection, the cells were infected with SARS-CoV-2 (MOI = 0.01) for 24 h. Then, the cell supernatant was harvested, and the extracellular viral copy numbers of SARS-CoV-2 were measured by RT-qPCR. (I) The extracellular viral titers were measured by TCID50. The data represent the mean±SD of 3 independent experiments. *, p < 0.05; **, p < 0.01.
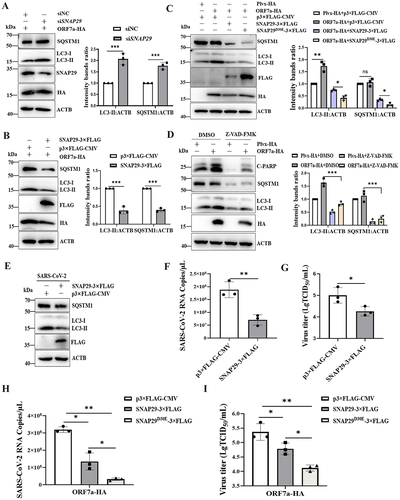
Apart from their function in autophagosome fusion of complete autophagy, SNAP29 was also implicated in the replication of SARS-CoV-2. As expected, overexpression of SNAP29 resulted in a reduction in ORF7a levels (), suggesting a likely engagement of the autophagy pathway in SARS-CoV-2 infection. Next, we decided to determine whether inhibition of autophagic flux by reduced SNAP29 promotes viral replication. We examined the variation in viral load in SNAP29-overexpressing cells during SARS-CoV-2 infection. As shown in , overexpression of SNAP29 promoted autophagy as LC3-II and SQSTM1 were degraded. Similarly, overexpression of SNAP29 alone resulted in a significant decrease in extracellular viral yields, as demonstrated by a 3-fold decrease in the SARS-CoV-2 extracellular N gene level (). As shown in , overexpression of SNAP29 resulted in a significant decrease in extracellular virus titers, indicating that SNAP29 facilitating autophagy flow might affect the virus life cycle. Furthermore, the effect of SNAP29 as well as the caspase-resistant SNAP29D30E mutation on viral replication on ORF7a blocking autophagy flow during SARS-CoV-2 infection was evaluated. The results showed that overexpression of SNAP29 facilitating ORF7a-induced autophagy flow resulted in a significant decrease in the copy number of extracellular N genes () and virus titer (), suggesting that SNAP29 facilitating ORF7a-induced autophagy might influence the virus life cycle. Notably, our results also showed that the D30E mutation of SNAP29 impaired viral replication efficacy compared with the wild-type SNAP29 both by reducing virus copies of extracellular N genes () and virus titer (). Altogether, these results showed that caspase activity and/or SNAP29 have an important function in regulating SARS-CoV-2- or ORF7a-induced autophagy flow and that degradation of autophagosomes by overexpression of SNAP29 inhibits viral yield.
Discussion
There is accumulating evidence that coronavirus infection subverts and highjacks the flux of host autophagy at different steps to escape elimination. For instance, the nonstructural protein NSP6 generates autophagosomes from ER-derived omegasomes and limits autophagosome expansion (infectious bronchitis virus/IBV, mouse hepatitis virus/MHV, SARS-CoV, and MERS-CoV [Citation37,Citation38]). Similarly, MERS-CoV infection or the overexpression of membrane-associated papain-like protease 2 (PLP2-TM) of SARS-CoV [Citation39] and/or MERS-CoV [Citation19] induces autophagy but stops autophagosome formation. Likewise, the SARS-CoV ORF9b and transmissible gastroenteritis virus/TGEV nucleocapsid N proteins localize to mitochondria and induce mitophagy to protect the virus from the MAVS-mediated antiviral immunity response [Citation40,Citation41]. Recent studies have shown that SARS-CoV-2 ORF3a sequesters VPS39 on late endosomes to prevent the assembly of the SNARE complex, mediating the fusion of autophagosomes and amphisomes with lysosomes [Citation25,Citation27]. Although ORF7a of SARS-CoV-2 could induce autophagy in HEK293 cells [Citation28], the exact mechanism of ORF7a in SARS-CoV-2-induced autophagy has yet to be determined. In this study, we discovered a novel mechanism by which ORF7a of SARS-CoV-2 initiates autophagy and limits autophagic flux, thus enhancing viral replication, which could help to establish SARS-CoV-2 viral pathogenicity by regulating the autophagic pathway.
ORF7a is a SARS-CoV-2 genome-encoded accessory protein that is common to all SARS-CoV-type coronaviruses. It has been reported that SARS-CoV ORF7a interacting with SARS-CoV M and E proteins may function in the assembly stage during SARS-CoV replication [Citation42]. The SARS-CoV ORF7a protein inhibits BST2 (bone marrow stromal cell antigen 2) glycosylation, leading to a loss of the antiviral function of BST-2 [Citation43]. Recently, it was shown that the SARS-CoV-2 ORF7a protein has a conserved immunoglobulin (Ig)-like fold containing an integrin binding site, which provides a mechanistic hypothesis for the interaction of SARS-CoV-2 with the human immune system [Citation44]. Furthermore, ubiquitination of SARS-CoV-2 ORF7a promotes antagonism of the interferon response [Citation45]. Here, our results showed that overexpression of the SARS-CoV-2 accessory protein ORF7a alone or SARS-CoV-2 infection suppressed the AKT-MTOR-ULK1-mediated pathway and was sufficient to induce LC3 accumulation in a dose-dependent manner (Fig. S4B), but it did not affect the transcriptional expression and degradation of SQSTM1, indicating that ORF7a itself can efficiently limit autophagic flow, which phenocopies SARS-CoV-2 infection. In addition, we analyzed the variations in ORF7a sequences of different SARS-CoV-2 strains that are prevalent in different countries representing major lineages (Table S1 and Fig. S5A). The function of ORF7a variations in autophagy showed that all variations in ORF7a enhanced autophagy (Fig. S5B), suggesting that ORF7a-induced autophagy is highly conserved.
More importantly, we discovered that the SARS-CoV-2 ORF7a protein hijacks autophagic flux by targeting the vesicular trafficking adaptor protein SNAP29, limiting the assembly of the STX17-SNAP29-VAMP8 complex and thereby inhibiting the degradation of autophagy. It has been well documented that the fusion of autophagosomes and amphisomes with late endosomes/lysosomes is mediated by the interaction between the STX17-SNAP29-VAMP8 SNARE complexes, and inhibition of complex assembly appears to be a widely manipulated mechanism by viruses to accumulate autophagosomes and amphisomes for their own benefit. For instance, proteinase 3C of coxsackievirus B3/CVB3 and enterovirus D68/EVD68 mediates the cleavage of SNAP29 [Citation29,Citation46], while the human parainfluenza virus type 3/HPIV3 P protein binds to SNAP29 to prevent the STX17-SNAP29 interaction [Citation47]. However, the cleavage of SNAP29 mediated by the caspase activity pathway has not been reported. Here, activation of CASP3 to cleave SNAP29 was observed when SARS-CoV-2 ORF7a was overexpressed, while knockdown of the ORF7a gene during SARS-CoV-2 infection decreased CASP3 activation and restored SNAP29 expression. Notably, a caspase inhibitor alleviated the blockage of autophagic flux induced by ORF7a. Our data in this study provide compelling evidence that ORF7a downregulates the expression of SNAP29 via CASP3-mediated cleavage to block autophagic flux. In addition, it has been reported that CASP3 recognizes the consensus D-x-x-D motif and cleaves the C terminus to D334 of HNRNPK (heterogeneous nuclear ribonucleoprotein K) and BECN1 at amino acid residues 124 and 149 [Citation48,Citation49]. Here, although SARS-CoV-2 infection could activate CASP3, it did not affect the expression of BECN1 (Fig. S6A-D). We provide several lines of evidence to demonstrate that the ARD30↓LPD sequence of SNAP29, representing the typical cleavage site, was recognized by the ORF7a- activated CASP3 protein. Unfortunately, because the presently available antibodies for SNAP29 are all N-terminal-directed, we could not visualize the cleaved C-terminal fragments of endogenous SNAP29 by immunoblot analysis. However, a potential cleavage product mutant can serve as a functional analysis of CASP3-mediated cleavage of SNAP29. To the best of our knowledge, this is the novel mechanism of viral regulation of SNAP29 expression. In addition, caspases are classified as either inflammatory or apoptotic [Citation50]. Previous work on SARS-CoV confirmed that ORF7a induces caspase-dependent apoptosis, as evidenced by the cleavage of PARP (poly(ADP-ribose) polymerase) a well-characterized apoptotic marker [Citation51]. Here, cleavage of PARP was also observed during SARS-CoV-2 infection (Fig. S6A-D), and ORF7a increased apoptotic markers in a dose-dependent manner (Fig. S4B), indicating that activation of CASP3 by SARS-CoV-2 infection or ORF7a might contribute to cell apoptosis. Therefore, the intricate interplay between autophagy and apoptosis will be further studied.
Regarding the relationship between SARS-CoV-2 and autophagy, our data show that SARS-CoV-2 infection suppressed the AKT-MTOR-ULK1-mediated pathway and was sufficient to trigger the accumulation of autophagosomes, which is consistent with recent studies demonstrating that SARS-CoV-2 induces autophagosome formation, accompanied by consistent autophagic events, including inhibition of the AKT-MTOR pathway [Citation52]. However, it is incompatible with the previous report that SARS-CoV-2 modulates cellular metabolism and limits autophagy [Citation53]. The differential response of autophagy regulation might be explained by different mechanisms, including the growth kinetics curve of viruses in different cell lines are various, and there may be a delicate balance between the inhibition and promotion of autophagy for the downstream signaling pathways of autophagic responses in different cells with different SARS-CoV-2 replication levels. The ORF7a expression amount, expression time and protein localization vary from virus infection or disease duration of natural infection cases to protein overexpression, and even the expression amount and induced cellular response in ectopically transfected ORF7a plasmid cells exhibit differences. When cells are inoculated with multiple MOIs of SARS-CoV-2, the profile expression of viral genes, the interaction between viral proteins and host as well as the profile expression of host genes might be different. Meanwhile, the functions of these genes or their regulated signal transduction pathway/the underlying mechanism may vary. For instance, recent studies have reported that the nonstructural protein SARS-CoV-2 NSP6 inhibits prophagophore formation termed the hybrid phagophore assembly site/HyPAS [Citation54]; NSP1-dependent host protein translational shutoff might prevent the synthesis of autophagy-regulating proteins, including the key regulator BECN1, leading to reduced ATG14 oligomerization and limited fusion of autophagosomes with lysosomes [Citation53]. Consistent with our findings, the SARS-CoV-2 ORF3a protein blocked the maturation of autophagosomes into autolysosomes [Citation26,Citation27]. Therefore, further studies are required to determine whether multiple proteins of SARS-CoV-2 have a balanced mechanism to promote the accumulation of autophagosomes, which is conducive to viral replication.
Alternatively, the functional significance of ORF7a likely comprises the autophagic pathway to benefit viral replication, mainly reflected in the following aspects. First, the ORF7a protein disrupts autophagic flux to prevent protein degradation. Additionally, SNAP29 has been implicated in the replication of multiple viruses [Citation47,Citation55]. Our study showed that SNAP29, functioning in autophagosome fusion with lysosomes, was proposed to be responsible for ORF7a-induced complete autophagy and inhibited the production of extracellular viruses, suggesting that SNAP29 might be required for the autophagic degradation of SARS-CoV-2 virions. Thus, it is expected that inhibition of complete autophagy will also block autophagy-induced viral clearance.
In this study, we described a dual action of ORF7a, including autophagy induction and a reduction in the fusion of autophagosomes with lysosomes. Furthermore, a dual role of ORF7a fitting in the viral context may be exploited by the virus, probably to generate double membrane autophagosome vesicles, where it establishes its replicative niche for their own benefit replication, but arrests autophagosomes from lysosome fusion to avoid succumbing to lysosomal degradation. Although we utilized the shRNA targeting the sgRNA of ORF7a to delineate the contribution of individual viral ORF7a proteins to viral infection and achieved a similar effect as the ORF7a deletion mutant virus, it certainly does not replace data obtained using ORF7a knockout viruses.
In conclusion, our findings propose a combinatorial model in which ORF7a possesses the ability to initiate autophagy via the AKT-MTOR-ULK1-mediated pathway. Simultaneously, ORF7a blocks the progression of autophagic flux by targeting SNAP29 expression via activated CASP3, resulting in failure to fuse with lysosomes, whereby SARS-CoV-2-bearing autophagosomes traffic to the cell periphery and fuse with the plasma membrane to release intracellular vesicles (Fig. S7). Therefore, ORF7a regulates the autophagic response and critically determines the production of SARS-CoV-2 virions, which might be a crucial target pathway for controlling SARS-CoV-2 infection.
Materials and methods
Cell lines and viruses
We used the following cell lines in this study: Caco2 cells (human colon cancer cells) (ATCC, HTB-37), HeLa (ATCC, CCL-2), Calu-3 (human lung adenocarcinoma cell lines; ATCC, FS-0205) and Vero-E6 cells (African green monkey kidney cells; ATCC, CRL-1586) were preserved in our laboratory. HeLa cells with stable expression of human ACE2 (HeLa-ACE2) cells were prepared by our laboratory as previously described [Citation56]. All cells were grown in Dulbecco’s modified Eagle’s medium (DMEM; VivaCell, C3110-0500) supplemented with 10% heat-inactivated fetal bovine serum (FBS; TransGen Biotech, FS301-02), 100 μg/mL penicillin-streptomycin solution (Procell, PB180120) in a humidified 5%CO2 incubator at 37°C.
The SARS-CoV-2/human/CHN/Beijing-01/2020 (GenBank: MT291831) used in this study was passaged in Vero-E6 cells. All experiments with SARS-CoV-2 were conducted in the ABSL-3 biological safety laboratory at the Changchun Veterinary Research Institute.
Antibodies and chemicals
Rabbit monoclonal anti-MTOR antibody (clone 7C10; 2983), rabbit monoclonal anti-phospho-MTOR (Ser2448) antibody (clone D9C2; 5536), rabbit monoclonal anti-ULK1 antibody (clone D8H5; 8054), rabbit monoclonal anti-phospho-ULK1 (Ser757, clone D7O6U; 14202), rabbit anti-AKT antibody (9272), rabbit monoclonal anti-phospho-AKT (Ser473) antibody (clone D9E; 4060), rabbit monoclonal anti-DYKDDDDK/FLAG Tag antibody (binds to same epitope as Sigma’s anti-FLAG®M2 antibody, clone D6W5B; 14793), rabbit monoclonal anti-HA-Tag antibody (clone C29F4; 3724), rabbit anti-LC3 antibody (2775), CASP3 antibody (9662) were purchased from Cell Signaling Technology. Rabbit anti-SQSTM1 antibody (CY5546), rabbit anti-LAMP1 antibody (CY6598), rabbit anti-TUBB/β-tubulin antibody (AB0057), rabbit anti-cleaved PARP antibody (CY5035) and rabbit anti-GAPDH antibody (AB0036) were purchased from Abways Biotechnology Co.,Ltd. ACTB/β-actin rabbit monoclonal antibody (AC038) and mouse anti GFP-Tag monoclonal antibody (AE012) were purchased from Abclonal Biotechnology, Inc. Rabbit anti-STX17 polyclonal antibody (ab116113) was obtained from Abcam. Rabbit anti-SNAP29 polyclonal antibody (12704-1-AP) was purchased from Proteintech. Mouse anti-SARS-CoV-2 nucleocapsid monoclonal antibody (clone 6H3; GTX632269), and mouse anti-SARS-CoV-2 ORF7a monoclonal antibody (clone 3C9; GTX632602) were purchased from GeneTex. AffiniPure goat anti-mouse IgG (115–035-003), and AffiniPure goat anti-rabbit IgG (111–005-003) were purchased from Jackson Immunoresearch. Dimethyl sulfoxide (DMSO; D8371) and 3-methyladenine (3-MA; IM0190) were purchased from Solarbio Life Sciences. Rapamycin (HY-10219), LY294002 (HY-10108), bafilomycin A1 (Baf A1, HY-100558), MG132 (HY-13259), Z-VAD-FMK (pan caspase inhibitor, HY-16658B), Z-DEVD-FMK (CASP3 inhibitor, HY-12466), Z-IETD-FMK (CASP8 inhibitor, HY-101297), and Ac-FLTD-CMK (HY-111675) were purchased from Med Chem Express. Z-LEHD-FMK (CASP9 inhibitor, ab142026) was purchased from Abcam. Halt™protease inhibitor cocktail, EDTA-Free (100×, 78441) was purchased from Thermo Fisher Scientific. RIPA lysis buffer (WB3100) was purchased from New Cell & Molecular Biotech.
Plasmid and siRNAs
ORF7a was cloned into the HA-tagged Plvx-TRES-puro vector (Plvx-HA; Clontech, 632164) as previously described [Citation57]. The SNAP29 gene amplified from HeLa genomic cDNA using the specific primers (listed in ) was cloned into the vector p3× FLAG-CMV (Sigma-Aldrich, E7783). Site-directed mutagenesis of SNAP29D30E, SNAP29D33E, and SNAP29D36E was generated by PCR mutagenesis using specific primers (listed in ) and cloned into the vector p3× FLAG-CMV. All constructed plasmids were verified by DNA sequencing. Small interfering RNA (siRNA) oligonucleotide sequences targeting ATG7 (5’-GGGUUAUUACUACAAUGGUG-3’), SNAP29 (5’-GCUGGUCAAUUACUUCAAAUC-3’), CASP3 (5’-GGAACCAAAGAUCAUACAUGG-3’) and negative control (5’-UUCUCCGAACGUGUCACGUUU-3’) were synthesized by Qingke Biotechnology, Inc. For the autophagosome and autophagy flow assays, the plasmids pEGFP-LC3 (P0199) and GFP-mCherry-LC3 (P10010) were purchased from MiaoLingPlasmid.
Table 1. List of primers used in this study.
Design and construction of vector-based short hairpin RNA (shRNA) for ORF7a
To knockdown ORF7a during SARS-CoV-2 infection, inserts of short hairpin RNAs (shRNAs) to match the sequences of SARS-CoV-2 ORF7a were designed as reported previously [Citation58]. Briefly, for each of the shRNA inserts, the sequence corresponding to the highly conserved consensus sequence (CS) flanked by five to seven nucleotides (nt) before and 6–10 nt after the CS was chosen to specifically target ORF7a. The insert sequences for the shRNAs used in this study were shown in . Subsequently, pYr-Lvsh-based shRNA for ORF7a was constructed.
Transmission electron microscopy (TEM)
TEM is a valid and important method for monitoring autophagy induction through morphology. In this assay, Caco2 cells were incubated with SARS-CoV-2 (0.01 MOI) for 24 h. Next, the cell samples were washed three times with ice-cold PBS (Procell, PB180327), harvested in the bottom of clean 1.5-ml Eppendorf tubes and centrifuged at 1,000 × g for 10 min. The cell pellets were fixed with 2.5% glutaraldehyde (Sigma-Aldrich, G6257) in PBS overnight at 4°C. The samples were rinsed and postfixed in 1% osmium tetroxide (OsO4; Electron Microscopy Sciences, 19150) for 2 h. After being washed, the cells were dehydrated with sequential washes in a graded series of ethanol (Sinopharm Chemical Reagent, 10009218) and then embedded in Epon 812 resin (Electron Microscopy Sciences, 14120). Next, ultrathin sections were prepared and stained with uranyl acetate and lead citrate as previously described [Citation59]. Finally, autophagosome-like vesicles were observed under a transmission electron microscope (JEOL-1200EX; JEOL, Tokyo, Japan) and recorded using an electron microscope (MORADAG2; EMSIS GmbH, Münster, Germany).
Confocal fluorescence microscopy
Confocal fluorescence microscopy was utilized to detect the expression of punctate LC3 in ORF7a-expressing cells. In brief, HeLa cells were seeded in a 24-well format on glass cover slides (CellVis, 051410). The ORF7a-expressing plasmid and other corresponding plasmids were transfected with Attractene transfection reagent (Qiagen, 310007). At 24 hpt, the cells were fixed with 4% paraformaldehyde (Beyotime, P0099) in PBS for 10 min at room temperature and permeabilized with 0.5% Triton X-100 (Elabscience, E-IR-R122) in PBS for 10 min at room temperature. After blocking with 5% BSA (Sigma-Aldrich, A3912) for 60 min at room temperature, coverslips were mounted on microscope slides with DAPI (BOSTER, AR1176) in 50% glycerol. Images were acquired with a confocal microscope (Leica DMIRBE inverted microscope; Leica, Solms, Germany) equipped with a TCS SP8 confocal scanner and a 63×/1.40 numerical aperture (NA) objective lens (Leica Microsystems).
Immunofluorescence analysis of autophagosome-lysosome fusion
The fusion of autophagosomes and lysosomes was detected by immunofluorescence assay of colocalization between GFP-LC3 and LAMP1. The GFP-LC3 and ORF7a-HA cotransfected cells were fixed in 4% paraformaldehyde (Beyotime, P0099). After that, the cells were blocked with 5% BSA (Sigma-Aldrich, A3912) and incubated with anti-LAMP1 primary antibody (Abways, CY6598) followed by a fluorescent secondary antibody (Jackson, 711–605-152). Finally, the cells were stained with DAPI (BOSTER, AR1176) and observed using a confocal laser scanning microscope (Leica Microsystems, Germany).
CCK-8 assay for cell viability
Cell viability was measured using cell counting kit-8 (CCK-8) assay (New Cell & Molecular Biotech, C6005) in accordance with the manufacturer’s instructions. Briefly, the cells were plated in 96-well microtiter plates (Jet Bio-Filtration, TCP011096) and treated with different concentrations of applied compounds for the indicated times at 37°C in a humidified chamber. Subsequently, the cells were incubated for 3 h after adding 10 μL cell counting kit-8 solution. Next, the absorbance at 450 nm was measured using a microplate reader (PerkinElmer, Waltham, MA, USA). The effect of the applied compounds on cell survival was assessed as percent cell viability.
Drug treatments
HeLa cells were transfected with ORF7a-HA and control vector for 24 h, and HeLa cells expressing ORF7a were pretreated with LY294002 (10 μM), rapamycin (2 μM), MG132 (5 μM), Baf A1 (0.5 μM), Z-VAD-FMK (10 μM), Z-DEVD-FMK (10 μM), Z-IETD-FMK (10 μM), Ac-FLTD-CMK (10 μM) or Z-LEHD-FMK (10 μM) for an indicated time, then cells were collected for western blotting with the indicated antibody.
SARS-CoV-2 infection, RT-qPCR analysis and titration
One day before virus infection, Vero-E6, Caco2, Calu-3 or HeLa-ACE2 cells were cultured in 6-well plates and infected with SARS-CoV-2 at an MOI of 0.01. After infection for 1 h, the cells were washed 3 times with PBS and then incubated in DMEM plus 2% FBS for 24 h or 48 h at 37°C in 5% CO2 incubators. Cell pellets were harvested and subjected to western blotting analysis using specific viral protein antibodies. Cell supernatants were collected for virus titration to determine SARS-CoV-2 replication levels, and TCID50 analysis was performed on Vero-E6 cells by the Reed-Muench endpoint method. Moreover, a portion of cellular RNA from culture supernatants was isolated and subsequently subjected to TaqMan® probe-based RT-qPCR to detect and quantify virus replication as previously reported [Citation60].
Quantitative real-time PCR
Quantitative real-time PCR for the SQSTM1 gene was performed as described previously [Citation57]. Briefly, total RNA was extracted from ORF7-HA or Plvx-HA vector transfected cells using a cell total RNA isolation kit (Foregene, RE-03111), and cDNA was synthesized using a scriptreverse transcription kit (Accurate, AG11706). Quantitative real-time PCR (qPCR) for SQSTM1 was carried out with AceQ qPCR SYBR Green Master Mix (Vazyme, Q111-02) on a Real-Time System (Roche, Switzerland) according to the manufacturer’s instructions. All primers used for the SQSTM1 gene and ACTB as an internal reference were listed in Table S2. The relative mean mRNA fold changes relative to control were calculated using the 2−ΔΔCt method.
Immunoblotting assays
For immunoblotting assays, cells were collected and washed 3 times with cold PBS and then lysed on ice for 30 min in RIPA lysis buffer (New Cell & Molecular Biotech, WB3100) supplemented with protease inhibitor cocktail (Thermo Fisher Scientific, 78441). After centrifugation for 15 min at 4°C at 16,500 × g, the supernatants were eluted with 5× SDS sample buffer (Beyotime, P0015), subjected to SDS-PAGE (Epizyme Biotech, PG113), and then transferred onto PVDF membranes (Millipore, IPVH00010). After blocking with 5% skimmed dried milk (BioFroxx, 1172) in TBST (Epizyme Biotech, PS103), the membranes were incubated overnight with the desired primary antibodies at 4°C. The membranes were then probed with HRP-conjugated secondary antibody (Jackson Immunoresearch, 115–035-003 or 111–005-003) for 1 h at room temperature, and the immunoreactive signals were visualized using enhanced chemiluminescence (ECL) detection (Shandong Sparkjade Biotechnology, ED0015-C).
Analysis of ORF7a variation sequences in different SARS-CoV-2 lineages
We analyzed the ORF7a sequences of different SARS-CoV-2 strains that are prevalent in different countries representing major lineages (Table S1). Editing and alignment of nucleotide and amino acid sequences were performed using DNAStar and MEGA 7.0 software. Sequence variations within nucleotide positions were shown in Fig. S5A.
Quantification and statistical analysis
The density of immunoblot bands was quantified using ImageJ software (NIH Image). For immunostaining, the cells or images were randomly selected for analysis. Graph plots and P values were generated using GraphPad Prism 8 software. Statistical comparisons were performed by one-way ANOVA for single-factor experiments and by two-way ANOVA for two factors experiments, and the data are expressed as the mean±standard deviation (SD) from at least three independent experiments. Ns: no significant difference, p > 0.05; *, p < 0.05; **, p < 0.01; ***, p < 0.001.
Supplemental Material
Download Zip (9.4 MB)Acknowledgments
We are grateful to Chengfeng Qin and Xiaofeng Li for kindly providing the SARS-CoV-2 strain. We thank Liang Zhang from the Life Science Experimental Center of Shandong Normal University for facility use and help with microscopy and electron microscopy. We thank Prof. Changle Ma at Shandong Normal University for valuable advice on this study. The study was partially supported by grants from the National Natural Science Fund of China (31872490, 31972665, 32072834), Shandong Provincial Natural Science Foundation, China (ZR2019MC018, ZR2021MC050), Special fund support for Taishan Scholar Project (H.H, tspd20181207).
Disclosure statement
No potential conflict of interest was reported by the author(s).
Supplementary material
Supplemental data for this article can be accessed online at https://doi.org/10.1080/15548627.2022.2084686.
Additional information
Funding
Related Research Data
References
- Xu Z, Shi L, Wang Y, et al. Pathological findings of COVID-19 associated with acute respiratory distress syndrome. Lancet Respir Med. 2020;8(4):420–422.
- Zhu N, Zhang D, Wang W, et al. A Novel Coronavirus from Patients with Pneumonia in China, 2019. N Engl J Med. 2020;382(8):727–733.
- Asselah T, Durantel D, Pasmant E, et al. COVID-19: discovery, diagnostics and drug development. J Hepatol. 2021;74(1):168–184.
- Mattioli IA, Hassan A, Oliveira ON, et al. On the challenges for the diagnosis of SARS-CoV-2 based on a review of current methodologies. ACS Sens. 2020;5(12):3655–3677.
- Zhang YZ, Holmes EC. Holmes EC A genomic perspective on the origin and emergence of SARS-CoV-2. Cell. 2020;181(2):223–227.
- Uddin M, Mustafa F, Rizvi TA, et al. SARS-CoV-2/COVID-19: viral genomics, epidemiology, vaccines, and therapeutic interventions. Viruses. 2020;12(5):526.
- Michel CJ, Mayer C, Poch O, et al. Characterization of accessory genes in coronavirus genomes. Virol J. 2020;17(1):131.
- Levine B, Kroemer G. Autophagy in the pathogenesis of disease. Cell. 2008;132(1):27–42.
- Abdoli A, Alirezaei M, Mehrbod P, et al. Autophagy: the multi-purpose bridge in viral infections and host cells. Rev Med Virol. 2018;28(4):e1973.
- Kushwaha NK, Hafrén A, Hofius D. Autophagy-virus interplay in plants: from antiviral recognition to proviral manipulation. Mol Plant Pathol. 2019;20(9):1211–1216.
- Paul P, Münz C. Autophagy and mammalian viruses: roles in immune response, viral replication, and beyond. Adv Virus Res. 2016;95:149–195.
- Kobayashi S, Orba Y, Yamaguchi H, et al. Autophagy inhibits viral genome replication and gene expression stages in West Nile virus infection. Virus Res. 2014;191:83–91.
- Zhang Y, Xu Z, Cao Y. Host-virus interaction: How host cells defend against influenza A virus infection. Viruses. 2020;12(4):376.
- Pei J, Zhao M, Ye Z, et al. Autophagy enhances the replication of classical swine fever virus in vitro. Autophagy. 2014;10(1):93–110.
- Zhu E, Chen W, Qin Y, et al. Classical swine fever virus infection induces endoplasmic reticulum stress-mediated autophagy to sustain viral replication in vivo and in vitro. Front Microbiol. 2019;10:2545.
- Sun MX, Huang L, Wang R, et al. Porcine reproductive and respiratory syndrome virus induces autophagy to promote virus replication. Autophagy. 2012;8(10):1434–1447.
- Crawford SE, Hyser JM, Utama B, et al. Autophagy hijacked through viroporin-activated calcium/calmodulin-dependent kinase kinase-β signaling is required for rotavirus replication. Proc Natl Acad Sci U S A. 2012;109(50):E3405–3413.
- Abernathy E, Mateo R, Majzoub K, et al. Differential and convergent utilization of autophagy components by positive-strand RNA viruses. PLoS Biol. 2019;17(1):e2006926.
- Shi J, Luo H. Interplay between the cellular autophagy machinery and positive-stranded RNA viruses. Acta Biochim Biophys Sin (Shanghai). 2012;44(5):375–384.
- Bello-Perez M, Sola I, Novoa B, et al. Canonical and noncanonical autophagy as potential targets for COVID-19. Cells. 2020;9(7):1619.
- Fung TS, Liu DX. Human coronavirus: host-pathogen interaction. Annu Rev Microbiol. 2019;73(1):529–557.
- Maier HJ, Britton P. Involvement of autophagy in coronavirus replication. Viruses. 2012;4(12):3440–3451.
- Miller K, McGrath ME, Hu Z, et al. Coronavirus interactions with the cellular autophagy machinery. Autophagy. 2020;16(12):2131–2139.
- Shojaei S, Suresh M, Klionsky DJ, et al. Autophagy and SARS-CoV-2 infection: apossible smart targeting of the autophagy pathway. Virulence. 2020;11(1):805–810.
- Miao G, Zhao H, Li Y, et al. ORF3a of the COVID-19 virus SARS-CoV-2 blocks HOPS complex-mediated assembly of the SNARE complex required for autolysosome formation. Dev Cell. 2020;56(4):427–442.
- Qu Y, Wang X, Zhu Y, et al. ORF3a-mediated incomplete autophagy facilitates severe acute respiratory syndrome coronavirus-2 replication. Front Cell Dev Biol. 2021;9:716208.
- Zhang Y, Sun H, Pei R, et al. The SARS-CoV-2 protein ORF3a inhibits fusion of autophagosomes with lysosomes. Cell Discov. 2021;7(1):31.
- Hayn M, Hirschenberger M, Koepke L, et al. Systematic functional analysis of SARS-CoV-2 proteins uncovers viral innate immune antagonists and remaining vulnerabilities. Cell Rep. 2021;35(7):109126.
- Corona AK, Saulsbery HM, Corona Velazquez AF, et al. Enteroviruses remodel autophagic trafficking through regulation of Host SNARE proteins to promote virus replication and cell exit. Cell Rep. 2018;22(12):3304–3314.
- Pankiv S, Clausen TH, Lamark T, et al. p62/SQSTM1 binds directly to Atg8/LC3 to facilitate degradation of ubiquitinated protein aggregates by autophagy. J Biol Chem. 2007;282(33):24131–24145.
- Lin H, Li B, Liu M, et al. Nonstructural protein 6 of porcine epidemic diarrhea virus induces autophagy to promote viral replication via the PI3K/Akt/mTOR axis. Vet Microbiol. 2020;244:108684.
- Liang Q, Luo Z, Zeng J, et al. Zika Virus NS4A and NS4B proteins deregulate akt-mtor signaling in human fetal neural stem cells to inhibit neurogenesis and induce autophagy. Cell Stem Cell. 2016;19(5):663–671.
- Kim J, Kundu M, Viollet B, et al. AMPK and mTOR regulate autophagy through direct phosphorylation of Ulk1. Nat Cell Biol. 2011;13(2):132–141.
- Tian X, Teng J, Chen J. New insights regarding SNARE proteins in autophagosome-lysosome fusion. Autophagy. 2021;17(10):2680–2688.
- Tawa P, Hell K, Giroux A, et al. Catalytic activity of caspase-3 is required for its degradation: stabilization of the active complex by synthetic inhibitors. Cell Death Differ. 2004;11(4):439–447.
- Song J, Tan H, Shen H, et al. Cascleave: towards more accurate prediction of caspase substrate cleavage sites. Bioinformatics. 2010;26(6):752–760.
- Cottam EM, Maier HJ, Manifava M, et al. Coronavirus nsp6 proteins generate autophagosomes from the endoplasmic reticulum via an omegasome intermediate. Autophagy. 2011;7(11):1335–1347.
- Cottam EM, Whelband MC, Wileman T. Coronavirus NSP6 restricts autophagosome expansion. Autophagy. 2014;10(8):1426–1441.
- Chen X, Wang K, Xing Y, et al. Coronavirus membrane-associated papain-like proteases induce autophagy through interacting with Beclin1 to negatively regulate antiviral innate immunity. Protein Cell. 2014;5(12):912–927.
- Shi CS, Qi HY, Boularan C, et al. SARS-coronavirus open reading frame-9b suppresses innate immunity by targeting mitochondria and the MAVS/TRAF3/TRAF6 signalosome. J Immunol. 2014;193(6):3080–3089.
- Zhang L, Qin Y, Chen M. Viral strategies for triggering and manipulating mitophagy. Autophagy. 2018;14(10):1665–1673.
- Liu DX, Fung TS, Chong KK, et al. Accessory proteins of SARS-CoV and other coronaviruses. Antiviral Res. 2014;109:97–109.
- Taylor JK, Coleman CM, Postel S, et al. Severe acute respiratory syndrome coronavirus ORF7a inhibits bone marrow stromal antigen 2 virion tethering through a novel mechanism of glycosylation interference. J Virol. 2015;89(23):11820–11833.
- Nizamudeen ZA, Xu ER, Karthik V, et al. Structural assessment of SARS-CoV2 accessory protein ORF7a predicts LFA-1 and Mac-1 binding potential. Biosci Rep. 2021;41(1):BSR20203837.
- Cao Z, Xia H, Rajsbaum R, et al. Ubiquitination of SARS-CoV-2 ORF7a promotes antagonism of interferon response. Cell Mol Immunol. 2021;18(3):746–748.
- Mohamud Y, Shi J, Qu J, et al. Enteroviral infection inhibits autophagic flux via disruption of the snare complex to enhance viral replication. Cell Rep. 2018;22(12):3292–3303.
- Ding B, Zhang G, Yang X, et al. Phosphoprotein of human parainfluenza virus type 3 blocks autophagosome-lysosome fusion to increase virus production. Cell Host Microbe. 2014;15(5):564–577.
- Naarmann-de Vries IS, Urlaub H, Ostareck DH, et al. Caspase-3 cleaves hnRNP K in erythroid differentiation. Cell Death Dis. 2013;4(3):e548.
- Zhu Y, Zhao L, Liu L, et al. Beclin 1 cleavage by caspase-3 inactivates autophagy and promotes apoptosis. Protein Cell. 2010;1(5):468–477.
- Van Opdenbosch N, Lamkanfi M. Caspases in Cell Death, Inflammation, and Disease. Immunity. 2019;50(6):1352–1364.
- Tan YJ, Fielding BC, Goh PY, et al. Overexpression of 7a, a protein specifically encoded by the severe acute respiratory syndrome coronavirus, induces apoptosis via a caspase-dependent pathway. J Virol. 2004;78(24):14043–14047.
- Shang C, Zhuang X, Zhang H, et al. Inhibition of autophagy suppresses SARS-CoV-2 replication and ameliorates pneumonia in hACE2 transgenic mice and xenografted human lung tissues. J Virol. 2021;95(24):e0153721.
- Gassen NC, Papies J, Bajaj T, et al. SARS-CoV-2-mediated dysregulation of metabolism and autophagy uncovers host-targeting antivirals. Nat Commun. 2021;12(1):3818.
- Kumar S, Javed R, Mudd M, et al. Mammalian hybrid pre-autophagosomal structure HyPAS generates autophagosomes. Cell. 2021;184(24):5950–5969.e5922.
- Lin Y, Wu C, Wang X, et al. Synaptosomal-associated protein 29 is required for the autophagic degradation of hepatitis B virus. Faseb J. 2019;33(5):6023–6034.
- Li X, Hou P, Ma W, et al. SARS-CoV-2 ORF10 suppresses the antiviral innate immune response by degrading MAVS through mitophagy. Cell Mol Immunol. 2022;19(1):67–78.
- Jiang H, Hou P, He H, et al. Cell apoptosis regulated by interaction between viral gene alpha 3 and host heterogeneous nuclear ribonucleoprotein K facilitates bovine ephemeral fever virus replication. Vet Microbiol. 2020;240:108510.
- Akerström S, Mirazimi A, Tan YJ. Inhibition of SARS-CoV replication cycle by small interference RNAs silencing specific SARS proteins, 7a/7b, 3a/3b and S. Antiviral Res. 2007;73(3):219–227.
- Dunlop MH, Ernst AM, Schroeder LK, et al. Land-locked mammalian Golgi reveals cargo transport between stable cisternae. Nat Commun. 2017;8(1):432.
- Guo ZD, Wang ZY, Zhang SF, et al. Aerosol and surface distribution of severe acute respiratory syndrome coronavirus 2 in Hospital Wards, Wuhan, China. Emerg Infect Dis. 2020;26(7):1583–1591.