
ABSTRACT
Primary ovarian insufficiency (POI), also known as premature ovarian failure, is an ovarian defect in humans characterized by the premature depletion of ovarian follicles before the age of 40. However, the mechanisms underlying POI remain largely unknown. Here, we show that knockout of Epg5 (ectopic P-granules autophagy protein 5 homolog (C. elegans)) results in subfertility in female mice, which exhibit a POI-like phenotype. Single-cell RNA sequencing analysis revealed that the knockout of Epg5 affected the differentiation of granulosa cells (GCs). Further investigation demonstrated that knockout of Epg5 blocks macroautophagic/autophagic flux, resulting in the accumulation of WT1 (WT1 transcription factor), an essential transcription factor for GCs, suggesting WT1 needs to be selectively degraded by the autophagy pathway. We found that the insufficient degradation of WT1 in the antral follicular stage contributes to reduced expression of steroidogenesis-related genes, thereby disrupting GC differentiation. Collectively, our studies show that EPG5 promotes WT1 degradation in GCs, indicating that the dysregulation of Epg5 in GCs can trigger POI pathogenesis.
Abbreviations: 3-MA, 3-methyladenine; CHX, cycloheximide; CQ, chloroquine; EPG5, ectopic P-granules autophagy protein 5 homolog (C. elegans); GC, granulosa cell; MAP1LC3/LC3, microtubule-associated protein 1 light chain 3; MII, metaphase II; POI, primary ovarian insufficiency; PB1, polar body 1; SQSTM1/p62, sequestosome 1; WT1, WT1 transcription factor
Introduction
Premature ovarian insufficiency (POI) refers to a continuum of decreasing ovarian function disorders, and occurs in 1% of women under 40 years of age [Citation1,Citation2]. POI is a highly heterogeneous disorder, with isolated or syndromic forms caused by genetics or other unknown factors [Citation3]. However, the molecular pathophysiology of POI remains unexplained in the majority of cases.
Mutations of meiotic and DNA repair genes are responsible for syndromic and nonsyndromic POI in oocytes. There are reports of associations between POI and mutations in STAG3, SMC1B, REC8, SYCE1, MCM8, MCM9, DMC1, HFM1, and XRCC4 [Citation4–11]. Recent studies have also uncovered genes involved in the establishment of the primordial follicles pool and the maturation of primary follicles [Citation12–14]. Granulosa cells (GCs), which are follicular somatic cells that provide essential nutrients and growth factors, they are also known to secrete the steroids needed for the progression of folliculogenesis. GC dysfunction can initiate follicle atresia and apoptosis and can eventually lead to POI [Citation15,Citation16].
Autophagy is the major biological process for the degradation and recycling cytosolic components and damaged organelles, and it is evolutionarily conserved from yeast to mammals [Citation17,Citation18]. The lysosomal degradation pathway of macroautophagy/autophagy performs essential functions in cellular physiology. In this pathway, the autophagosome fuses with the lysosome, forming an autolysosome, which then degrades the enclosed materials [Citation19]. Autophagy proceeds through several tightly regulated steps, starting from the formation of phagophores to autophagosomes, whose fusion with lysosomes results in the final structures for degradation, thereby providing raw materials for the survival of cells under stress conditions [Citation20].
EPG5 (ectopic P-granules autophagy protein 5 homolog (C. elegans)) was initially identified in the nematode Caenorhabditis elegans; EPG5 is a RAB7A effector that mediates the specificity of fusion occurring between autophagosomes and late endosomes or lysosomes [Citation21,Citation22]. In the immune system, EPG5 functions as a carrier between separate vesicular compartments to control the intracellular trafficking of nucleic acids, thus linking autophagy to innate and adaptive immunity [Citation23]. Deubiquitination of EPG5 by USP8 (ubiquitin specific peptidase 8) regulates autophagic flux in mouse embryonic stem cells to maintain their stemness [Citation24]. Previous studies of mammalian reproduction have demonstrated that autophagy is essential for both spermatogenesis and folliculogenesis [Citation25–29]; however, the conventional knockout of most autophagy-related genes results in rapid post-natal mortality (at least in mice) [Citation30–34], thus, several aspects of autophagy’s functional roles in male and female infertility remain unclear.
In the present study, we show that epg5 knockout blocks autophagic flux and leads to a POI-like phenotype in female mice. We also found that the protein level of a transcription factor (WT1) was dramatically increased in epg5 knockout mice, which, in turn, decreased steroidogenic gene expression in antral follicle GCs. Thus, our study reveals an essential role for EPG5 in regulating follicle development by facilitating WT1 degradation, suggesting that mutations in EPG5 in humans may be associated with POI.
Results
Epg5 knockout results in subfertility due to premature ovarian failure in mouse
Unlike many other autophagy related genes, the knockout of the recently discovered autophagy-related gene Epg5 does not cause infant death in mice [Citation35,Citation36], thus enabling investigations of its role in fertility. We initially examined Epg5 expression in various mouse tissues, and found it prominently expressed in the ovaries (Figure S1A). At the protein level, EPG5 was highly expressed in GCs which was confirmed by western blot (Figure S1B). Immunohistochemical staining of ovaries revealed a strong EPG5 signal in GCs of primordial, primary, secondary, and antral follicles (Figure S1C). These results suggest that EPG5 might be involved in some functions of GCs.
To further investigate EPG5ʹs potential functions in reproduction, we examined epg5 knockout mice. The knockout efficiency was first confirmed by immunoblotting using ovary samples (). Examination of ovary morphology in 8-week-old epg5 knockout mice showed obviously reduced ovary size compared to control mice (). Additionally, we found that the ovary weight:body weight ratio was also significantly decreased in the epg5 knockout mice (). To investigate the effect of epg5 knockout on female fertility, a breeding assay was then carried out wherein the control or epg5 knockout female mice were mated with males of proven fertility for 6 months. epg5 knockout females had reduced fertility compared to the control females (). The epg5 knockouts had fewer pups per litter than the WT controls; the average litter size of the epg5 knockouts was 2.1 ± 0.59 compared to 7.6 ± 1.41 in WT (). Finally, our observation of transverse sections of 16-week-old mouse ovaries using hematoxylin and eosin (H&E) staining found that there was aberrant follicle developments in epg5 knockout ovaries compared to the controls ().
Figure 1. Epg5 knockout female mice are subfertile. (a) Immunoblotting of ovary samples for the EPG5 protein and ACTB (internal control). (b) Images of ovaries from control and epg5 knockout mice at 8 weeks. Scale bars: 2 mm. (c) The ovary-to-body weight ratio of the control and epg5 knockout mice. (d) Subfertility of female epg5 knockout mice. Both control (n = 5) and epg5 knockout (n = 5) females were mated with WT male mice; continuous breeding showed the cumulative number of progeny per female mouse. The asterisks indicate statistically significant differences. (e) the average litter size of control (n = 5) and epg5 knockout (n = 5) females. (f) Representative histology of ovaries sections from 16-week-old epg5 knockout females stained with hematoxylin and eosin. (g) Numbers of follicles at different stages in ovary sections from 16-week-old control and epg5 knockout mice (n = 4 for each group). Follicles were counted; black arrowheads in F point to follicles at different stages. PmF, primordial follicle; PF, primary follicle; SF, secondary follicle; AF, antral follicle. CL: Corpus luteum. Scale bars: 100 µm. Data are expressed as the mean ± S.E.M. *P < 0.05, **P < 0.01. ***P < 0.001.
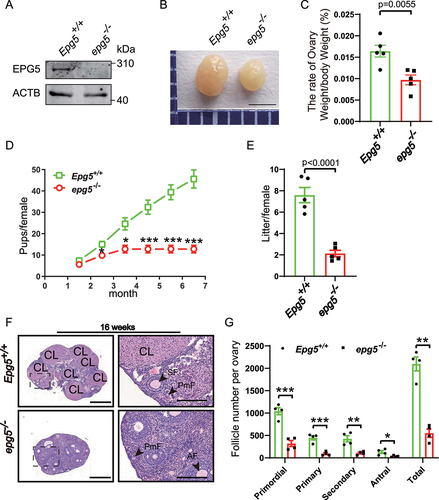
To study how the loss of Epg5 impedes fertility, we compared the morphology of ovaries at different ages. We found no apparent morphological differences between epg5 knockout and 3-week-old control ovaries: the ovaries of both genotypes had similar numbers of various staged follicles, including small oocytes surrounded by flattened pregranulosa cells (Figure S2A, B, arrows), as well as activated follicles containing enlarged oocytes (Figure S2A, arrowheads). However, there was an obvious difference when we examined 6-week-old mice, the numbers of primordial, primary, and antral follicles were dramatically reduced in the epg5 knockout ovaries (Figure S2C, D). These results collectively demonstrate that loss of Epg5 results in dysfunctional ovarian follicle development and subfertility in females.
Epg5 knockout has no influence on the developmental competence of mouse oocytes
In mammals, the reproductive capacity of females is maintained based on regulated development of both oocytes and follicles [Citation37]. Given that we have detected age related subfertility and ovary morphology abnormality in epg5 knockout mice, we explored whether dysfunction in oocytes might help explain our observations. The number of ovulated MII oocytes in epg5 knockout mice were decreased compared to the control mice (); however, there was no difference in the extent of polar body-1 (PB1) extrusion between the epg5 knockout and the control groups ().
Figure 2. Oocytes from epg5 knockout mice are able to complete meiotic maturation. (a) The average number of ovulated eggs were evaluated in control and epg5 knockout mice (n = 7 for each group). (b) Quantitative analysis of first polar body (Pb1) extrusion rate in epg5 knockout and control (n = 234) oocytes. (c) Representative images of oocytes from WT and epg5 deficiency mice after 14 h culture. scale bars: 100 μm. Immature GV oocytes isolated from 3-week-old control and epg5 knockout mice were cultured in vitro to check the maturational progression. (d) Quantitative analysis of mii oocytes of control and epg5 knockout mice after 14 h culture. (e) Confocal microscopy results showing spindle assembly collected from cultured MII oocytes of control and epg5 knockout mice. (f) Quantitative analysis of abnormal MII with a deformed spindle and misaligned chromosomes. Scale bar: 20 μm. Data are expressed as mean ± S.E.M. n.s., nonsignificant.
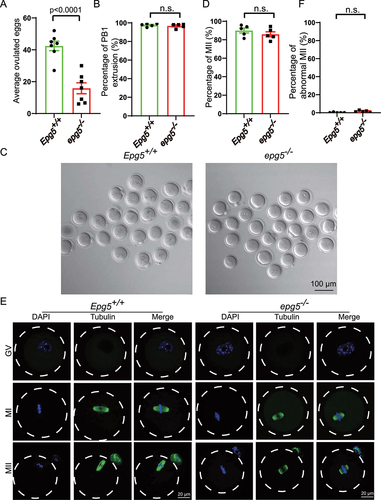
To evaluate the developmental potential of EPG5-null oocytes, germinal vesicle (GV) oocytes isolated from 3-week-old epg5 knockout and the control mice were cultured in vitro. Similar to the in vivo maturation results, the MII rate in epg5 knockout oocytes did not differ from the control oocytes (). Immunofluorescence and confocal microscopy also showed that the epg5 knockout oocytes could extrude PB1 successfully (), and there were no changes in the ratio of abnormal MII between epg5 knockout and the control oocytes (). To further investigate the developmental potential of oocytes of the epg5 knockout mice, IVF was performed as previously described [Citation38]. We found that there was no significant difference in the rate of formation of two-cell embryos and blastocysts between the epg5 knockout and the control mice (Figure S3A, B, C). These results indicate that the subfertility of epg5 knockout females results from defective follicular development and ovulation rather than from altered oocytes development.
Epg5 knockout result in GCs aging and cell death
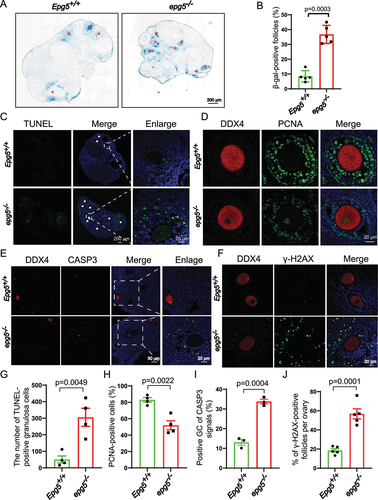
GCs provide necessary nutrients and steroids to oocytes, playing essential roles in ovarian follicle development [Citation39]. We assessed whether dysregulated GC function may underlie the POI-like phenotype of the epg5 knockout mice. Senescence-associated GLB1/β-galactosidase (SA GLB1/β-gal) assays revealed significantly increased SA GLB1/β-gal activity in epg5 knockout GCs compared with controls (). We also examined the proliferation rates and cell death in GCs of developing follicles based on PCNA (proliferating cell nuclear antigen) and terminal deoxynucleotidyl transferase dUTP nick end labeling (TUNEL) staining assays, respectively. The 6-week-old epg5 knockout ovaries had significantly more TUNEL-positive cells than the controls (), and the epg5 knockout GCs had significantly decreased proliferation (). Meanwhile, the immunostaining signal for the cell death marker cleaved CASP3 (caspase 3) was quite strong in the GCs of secondary and antral follicles (). Further, given that GCs are known to exhibit nuclear changes at the later stages of cell death – including DNA fragmentation [Citation40] – we wondered if loss of EPG5 may cause DNA damage in GCs. The levels of γ-H2AX were significantly elevated in epg5 knockout GCs, indicating accumulated DNA double-strand breaks (). These results show that loss of EPG5 reduces the proliferation of GCs and induces GC death, suggesting that dysregulated GC function (i.e., steroidogenesis) may drive the defective follicular development observed in epg5 knockout ovaries.
Figure 3. Epg5 knockout results in GCs aging and cell death. (a) Histoenzymatic detection of GLB1/β-gal. The blue indigo precipitates (resulting from X-Gal lysis by GLB1/β-gal) are evident in the GCs of 12-week-old epg5 knockout mice. The red asterisks indicate follicles positive for GLB1/β-gal signals. Scale bar: 200 µm. (b) Quantification of GLB1/β-gal-positive GCs in ovary sections (n = 5 for each of the indicated groups). (C) TUNEL assay to evaluated GC apoptosis in 12-week-old epg5 knockout and control ovaries. The white asterisks indicate follicles positive for TUNEL. Scale bars: 200 µm, 20 µm. (g) Quantitative analysis of TUNEL-positive cells of ovary sections in C (n = 4 for each group). (d) PCNA immunofluorescence assays and (h) the quantification of PCNA positive granulosa cells in epg5 knockout and control ovaries are shown (n = 4 for each group). Scale bars, 20 µm. (e) CASP3 Immunofluorescence analysis of epg5 knockout and control ovaries sections. Scale bars: 50 µm, 20 µm. (i) Quantitative analysis of CASP3-positive cells of ovary sections in E (n = 3 for each group). (f) γ-H2AX immunofluorescence assays and J the quantification of γ-H2AX positive GCs in epg5 knockout and control ovaries are shown (n = 5 for each group). Scale bars: 20 µm. Data are expressed as the mean ± S.E.M.
Autophagic flux is blocked in epg5 knockout GCs
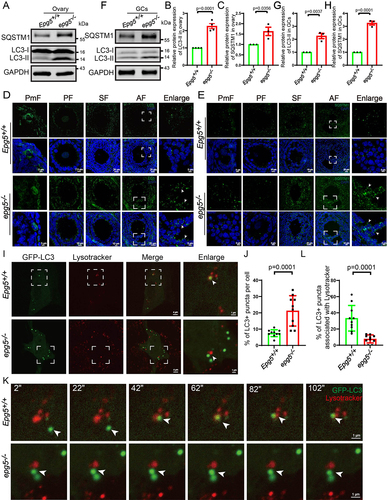
EPG5 is recruited to autophagosomes through direct interaction with RAB7 and binding to the VAMP7 (vesicle-associated membrane protein 7)-VAMP8 complex on late endosomes/lysosomes [Citation41]. We next examined whether Epg5 is essential for basal autophagy activity in mouse ovaries. Consistent with epg5 knockout in mouse brain and muscle cells [Citation35], immunoblotting of 6-week-old ovaries showed a significant increase in the levels of the autophagy markers MAP1LC3/LC3 (microtubule-associated protein 1 light chain 3)-II and SQSTM1/p62 (sequestosome 1) in epg5 knockout ovaries compared to controls, suggesting that autophagic flux was blocked (). In support of the immunoblotting results, immunostaining with anti-LC3B antibody showed that the number of LC3-positive GCs was markedly increased in all follicular stages of the 6-week-old epg5 knockout ovaries (). We also detected obvious accumulation of a SQSTM1 puncta signal in epg5 knockout GCs at antral follicles that was not evident in the controls (). We further investigated whether the impaired autophagic flux in epg5 knockout ovaries contributes to the increased number of LC3 puncta in epg5 knockout GCs. Immunoblotting of isolated GCs from 6-week-old ovaries revealed significantly higher LC3 and SQSTM1 levels in epg5 knockout GCs compared to controls (). To further examine the effect of epg5 knockout on autophagic flux, we monitored the autophagic flux in epg5 knockout GCs by time-lapse microscopy. We found that the autophagosomes, which were visible as LC3 puncta, fused with the lysosome in the control GCs (, Video S1), whereas LC3 puncta dramatically accumulated in epg5 knockout GCs, albeit in close proximity to the lysosome ( Video S2). These results confirm that autophagic flux is blocked in epg5 knockout GCs.
Figure 4. Accumulation of the autophagy maker LC3-II and SQSTM1 aggregates in epg5 knockout mice ovaries. (a) Immunoblotting for the LC3, SQSTM1 protein, and GAPDH (internal control) levels in ovaries. (b-c) Summary of quantification data from LC3 and SQSTM1 activity assays (relative to control). All experiments were repeated at least three times. (d) LC3 aggregates were accumulated dramatically in epg5 knockout GCs compared to the control groups. The white arrow shows LC3 puncta in antral follicular GCs. Scale bars: 5 µm, 7.5 µm, 10 µm, 25 µm. (e) SQSTM1 puncta aggregation was observed in the epg5 knockout GCs compared to the control groups. The white arrow shows SQSTM1 puncta in antral follicular GCs. Scale bars: 5 µm, 10 µm, 25 µm. (f) Immunoblotting for the LC3, SQSTM1 protein, and GAPDH (internal control) levels in GCs. (g-h) Summary of quantification data from LC3 and SQSTM1 activity assays (relative to control) in GCs. (i) GFP-LC3 puncta colocalize with Lysotracker puncta in control but not epg5 knockout GCs. Scale bars: 4 µm, 1 µm. (j) Quantification of the number of GFP-LC3 punctate structures in control and epg5 knockout GCs (n = 10 for each group). (k) In control cells, an LC3 punctum (arrows) originally associates with Lysotracker puncta structures, while in epg5 knockout GCs, an LC3 punctum did not fusion with Lysotracker punctum. Scale bars: 1 µm. (l) The percentage of LC3-stained puncta colocalizing with Lysotracker punctate structures in control and epg5 knockout GCs (n = 10 for each group). All experiments were repeated at least three times. PmF, primordial follicle; PF, primary follicle; SF, secondary follicle; AF, antral follicle. Data are expressed as the mean ± S.E.M.
Single-cell RNA sequencing analysis reveals the abnormal differentiation of epg5 knockout GCs
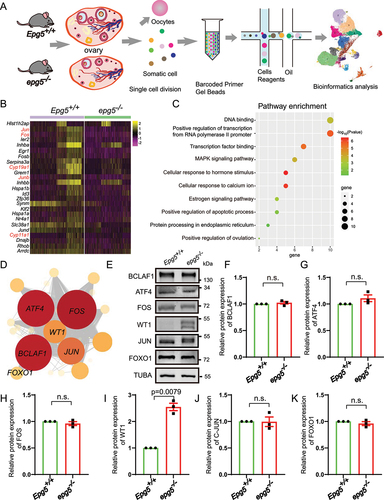
To investigate the regulatory mechanism of Epg5 during folliculogenesis, Single-Cell RNA Sequencing (scRNA-seq) analysis was performed on dissociated cells from whole ovaries of 6-week-old epg5 knockout and control mice (). We obtained 6328 and 4950 single-cell transcriptomes among the somatic cells of ovaries in control and epg5 knockout mice after quality control, respectively (Figure S4A). Unsupervised clustering analysis of the 10× genomics data with Uniform Manifold Approximation and Projection (UMAP) revealed seven main cell types (Figure S4B), and we calculated the top 30 ranking differentially expressed genes (DEGs) from each cell type, filtered for genes with average loge fold change > 0.5, sorted by their adjusted p-values (Wilcoxon rank sum test) (Table S1). To visualize, we plotted one representative DEG per cluster (Figure S4C).
Figure 5. Single-cell RNA-seq analysis uncovers altered functions in epg5 knockout GCs. (a) Schematic representation of ovarian tissue preparation for the single-cell transcriptome analysis. (b) Heatmap showing the expression levels of DEGs in GCs. (c) GO enrichment showing the terms associated with downregulated genes (with adjusted P value lower than 0.01) from epg5 knockout GCs. (d) Regulatory network visualizing potential key transcriptional regulators in DEGs in GCs. The node size indicates the number of target genes associated with corresponding transcription factor. The edge size indicates the weight of the connection. (e) Immunoblotting for the BCLAF1, ATF4, FOS, WT1, JUN and FOXO1 protein, and TUBA (internal control) levels in ovaries. (f-k) Summary of quantification data from E. All experiments were repeated at least three times. Data are expressed as the mean ± S.E.M. n.s., nonsignificant.
Next, we clustered the data based on the 50 most variably expressed genes per cluster and were able to distinguish five major cell types: GC (four clusters), theca and stromal cells (six clusters), smooth muscle cells (one cluster), endothelial cells (one cluster), immune cells (three clusters), and luteal cells (one cluster) (Figure S4D). To confirm the identity of these cell types in the UMAP, we colored the single cells according to the expression levels of expected marker genes: Amh, Hsd3b1, Fshr, Wt1 for GC; Pdgfrb, Lum for stromal cell; Tagln and Rgs5 for smooth muscle cells; Pecam1 and Cdh5 for endothelial cells; Cd68 and Ptprc for immune cells; and Epdr1 and Avpl1 for luteal cell (Figure S4E).
Given our earlier results (Figure S1B, C and ), GCs were selected for further analysis to further elucidate the effect of EPG5 loss on cellular responses in the ovary. The relative proportion of GCs weighed by the percentage of total cells in both genotypes showed that the ratio of GCs in ovaries dropped from 44.68% in the control to 33.07% in the epg5 knockouts (Figure S4F, G). There were 25 differentially expressed genes (1 upregulated and 24 downregulated genes) in the GCs of epg5 knockout mice (Table S2), including Cyp11a1 and Cyp19a1, which encode sex hormone biosynthetic enzymes [Citation42] (). Gene Ontology (GO) analysis indicated that the downregulated genes were enriched for functional annotations related to “positive regulation of transcription”, “transcription factor binding cellular”, “response to hormone stimulus”, “estrogen signaling pathway”, “positive regulation of apoptotic process”, and “protein processing in endoplasmic reticulum” (). To identify the master regulator(s) within GC, we constructed transcriptional regulatory networks with transcriptional regulators and their target genes by implementing single-cell regulatory network inference and clustering (SCENIC) analysis [Citation43]. The DEGs in GC cluster were input for SCENIC to set up the regulatory network. We identified 20 significant regulons containing 868 genes ( and Table S3). Noteworthy, key regulons in regulatory networks indicated high expression of regulons including Bclaf1, Atf4, Fos, Wt1, Jun and Foxo1 regulons, all of which were well-defined regulators in the maintenance of GCs differentiation and follicular atresia process [Citation40,Citation44–46]. While the western blot results showed that the protein levels of BCLAF1, ATF4, FOS, JUN/c-JUN, and FOXO1 were not changed compare with the control group (). Among the enriched regulons, the protein levels of WT1 were dramatically increased in epg5 knockout ovaries (). Altogether, scRNA-seq analysis revealed that knockout of Epg5 substantially disturbs the expression of GC differentiation genes.
Epg5 regulates GCs differentiation by degrading WT1
It is known that WT1 functions as a transcriptional repressor for multiple steroidogenic genes to inhibit the differentiation of GCs during folliculogenesis [Citation46]. To investigate how autophagy deficiency affects GC differentiation, we further examined WT1 protein levels by immunofluorescence, and found that there was an obvious accumulation of WT1 in 6-week-old epg5 knockout GCs compared to that of the control groups (, S5B). Moreover, immunoblotting showed that the amount of WT1 dramatically increased in GCs of the epg5 knockout (). We speculated that the strong WT1 accumulation we observed in epg5 knockout GCs likely results from disrupted degradation of the WT1 protein.
Figure 6. The degradation of WT1 in GCs dependents on autophagy. (a) WT1 immunofluorescence of isolated 6-week-old epg5 knockout and control GCs. Scale bars: 20 µm. (b) Immunoblotting for the WT1 protein, and GAPDH (internal control) levels in 6-week-old GCs. (c) Quantification of WT1 protein relative to control in 6-week-old GCs. (d) Immunoblotting for the WT1 protein, and GAPDH (internal control) levels in 2-week-old ovaries. (e) Immunoblotting for the WT1 protein, and GAPDH (internal control) levels in 3-week-old eCG/PMSG-treated ovaries. (f) Quantification of WT1 protein relative to control in D (n = 3 for each group). (g) Quantification of WT1 protein relative to control in F (n = 3 for each group). (h) Treatment with the autophagy/lysosome inhibitor 3-MA resulted in the accumulation of WT1. CHX chase assay of WT1 in HEK293T cells in the absence or presence of 3-MA. (I) Quantification of the relative WT1 levels in panel G. (J) WT1 interacts with SQSTM1. pCMV-tag2b-FLAG-Wt1 and pMXs-puro-GFP-SQSTM1, pMXs-IP-GFP-NBR1(38,283), pEGFP-TOLLIP, or pEGFP-LC3 were co-transfected into HEK293T cells. 24 h after transfection, cells were collected for IP with an anti-GFP antibody and then analyzed via blotting with an antibody against GFP. (k) Immunofluorescence staining of WT1 (green) and SQSTM1 (red) of epg5 knockout and WT ovaries sections. The white arrow shows WT1 (green) and SQSTM1 (red) puncta respectively in antral follicular GCs. The yellow arrow shows the co-localization of WT1 (green) and SQSTM1 (red) puncta in antral follicular GCs. PmF, primordial follicle; PF, primary follicle; SF, secondary follicle; AF, antral follicle. Scale bars: 5 µm, 10 µm, 20 µm. Data are expressed as the mean ± S.E.M. *P < 0.05.
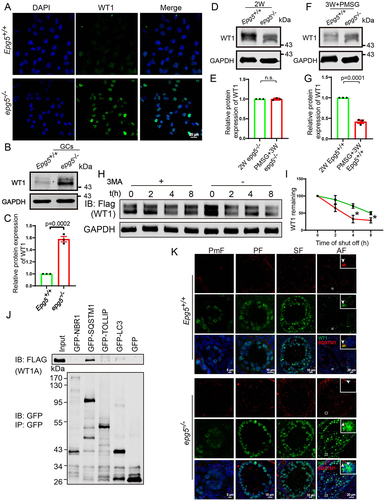
For context, most follicles in the ovaries of 2-week-old mice are primary or secondary, in which WT1 protein levels are high [Citation47]. The WT1 levels subsequently starts a gradual reduction from primary toward antral and then preovulatory follicles [Citation46,Citation48]. We constructed a follicular synchronization model to detect changes in the WT1 level after epg5 knockout. Preovulatory follicles were presented in the ovaries of equine chorionic gonadotropin (eCG)/pregnant mare serum gonadotropin (PMSG)-treated 3-week-old female mice. Accumulation of the WT1 protein was observed in eCG/PMSG-treated 3-week-old epg5 knockout ovaries, which was obviously distinct from the sharp decline in the WT1 level observed in the WT ovaries (). Moreover, we observed no degradation of WT1 in the antral follicles of the epg5 knockout mice (Figure S5A). These results indicate that primary and secondary follicles of the epg5 knockout mice have normal WT1 accumulation, but that impaired WT1 degradation leads to aberrantly high WT1 accumulation in antral and then preovulatory follicles.
Recalling our result showing blocked autophagic flux in epg5 knockout GCs, and considering this finding of disrupted WT1 protein degradation in antral and preovulatory follicles, we conducted a series of in vitro experiments with HEK293T cells. The autophagy/lysosome inhibitor 3-methyladenine (3-MA) [Citation29] was added to the media of HEK293T cells transfected with a plasmid for Wt1 expression. During the cycloheximide (CHX) chase experiment, WT1 degradation was strongly delayed after 3-MA treatment (). Further, coimmunoprecipitation experiments in HEK293T cells showed that WT1 can physically interact with SQSTM1 but not NBR1, LC3 and TOLLIP (toll interacting protein) [Citation49] (). We also found that in the control mice, WT1 and SQSTM1 colocalized with each other in relatively large puncta in the cytoplasm of antral follicle GC cells (, upper panel). Whereas in epg5 knockout GCs, SQSTM1 did not colocalized with WT1 (, lower panel), suggesting a defect in WT1 degradation in GCs of the epg5 knockout. Collectively, these results suggest that WT1 is degraded via the autophagy-lysosome pathway.
Expression of steroidogenic genes in epg5 knockout GCs can be partially rescued by Wt1 knockdown
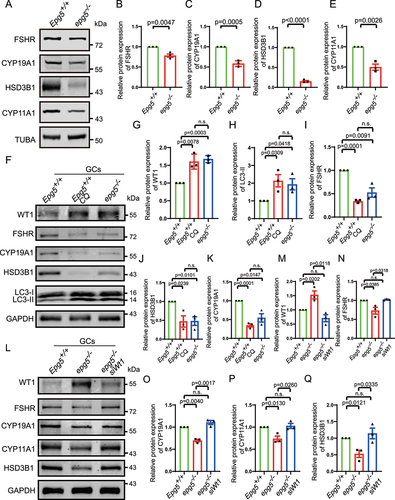
Loss of WT1 function has been shown to cause transformation of pregranulosa cells to steroidogenic cells [Citation50], so we examined the levels of known steroidogenic proteins in epg5 knockout GCs. Gao et al. (2014) demonstrated that the expression of genes including FSHR (follicle stimulating hormone receptor), HSD3B1/3β-hydroxysteroid dehydrogenase (hydroxy-delta-5-steroid dehydrogenase, 3 beta-and steroid delta-isomerase 1), Cyp11a1, and Cyp19a1 was inhibited by Wt1 in GCs. Furthermore, Chen et al. (2017) demonstrated that WT1 represses Sf1 expression by directly binding to the Sf1 promoter region and showed that inactivation of Wt1 causes upregulation of Sf1, which in turn activates a steroidogenic program. Our immunoblots showed decreased FSHR, HSD3B1, CYP11A1, and CYP19A1 levels in the eCG/PMSG-treated 3-week-old epg5 knockout ovaries compared to the eCG/PMSG-treated 3-week-old control ovaries (). To explore the effect of autophagy on GC differentiation, GCs from 5- to 6-week-old mice were isolated and cultured from epg5 knockout and control females. Chloroquine (CQ) was used to inhibit autophagy in GCs [Citation51]. Immunoblotting of CQ-treated GCs revealed a significant increase in the levels of LC3-II and WT1, similar to that of the epg5 knockout GCs (). In addition, we observed an obvious decrease in the levels of GC differentiation associated proteins in both epg5 knockout and CQ-treated GCs (). These results suggest that blocking autophagy significantly affects GC differentiation. To test whether the downregulation of steroidogenic genes in epg5 knockout GCs is due to accumulated WT1, we used siRNA to downregulate the expression of WT1 in epg5 knockout GCs (). As predicted, the knockdown of WT1 partially rescued the expression of GC differentiation associated genes (), suggesting that WT1 is a major autophagy target in GC differentiation. Taken together, these results support that the blocking of autophagy in epg5 knockout GC results in the abnormal accumulation of WT1, leading to aberrantly low levels of GC differentiation associated proteins.
Figure 7. Wt1 knockdown partially rescue the expression of steroidogenic genes in epg5 knockout GCs.
Discussion
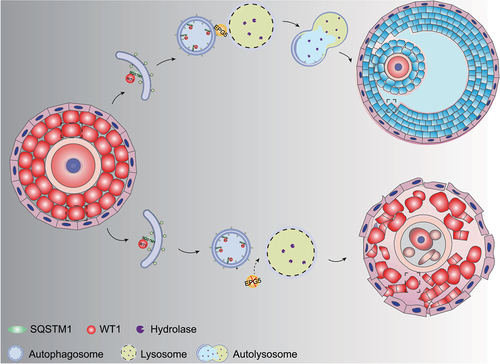
The development of ovarian follicles is a dynamic process comprising PGCs development, follicle formation, follicular activation and follicle development and maturation [Citation52,Citation53]. The GCs in antral follicles express gonadotropin receptors. Before ovulation, granulosa cells begin to express steroidogenic enzymes that are necessary for progesterone and estradiol synthesis [Citation54]. In this study, we show that EPG5 is required for normal female follicle development, as EPG5-knockout female mice are subfertile, owing to age-related decreases in follicle number. We show that epg5 knockout interferes with autophagy in GCs, resulting in accumulation of WT1, which represses the transcription of Cyp11a1, Hsd3b1, Cyp19a1, and Fshr, leading to defective differentiation of GCs (). Our study thus illustrates a mechanism for WT1 degradation in GCs through autophagy-lysosome pathway during folliculogenesis.
Figure 8. A model for EPG5ʹs function in regulating WT1 degradation during granulosa cell differentiation. In the presence of EPG5, autophagosomes can fuse specifically with late endosomes/lysosomes, after which autophagy facilitates WT1 degradation, ultimately leading to successful differentiation of GCs in the antral follicle stage.
Autophagy is an intracellular catabolic process that delivers cell components, including proteins, lipids, and whole organelles, to lysosomes for degradation and recycling [Citation55,Citation56]. Increasing evidence illustrates that autophagy is involved in a broad range of cellular events within the reproductive process [Citation25,Citation27–29,Citation57]. In the ovary, autophagy protects oocytes from excessive loss in neonatal ovaries [Citation58]. Germ cell–specific knockout of atg7 in mice led to POI, resulting in significantly reduced numbers of follicles in the adult mutant animals [Citation25]. In Becn1± ovaries, disrupting autophagy led to a 56% reduction in the number of germ cells in the murine primordial follicle pools at postnatal day 1 [Citation58]. During folliculogenesis, only 1% of all follicles develop up to the maturation stage and eventually the fertilization stage; the remainder undergo atresia at different developmental stages. It has been shown that autophagy also participates in follicle atresia by regulating the death of GCs [Citation59–61]. Although EPG5 is highly expressed in GCs (Figure S1B, C), we cannot exclude unforeseen systemic (ie. secondary) effects from its loss in other tissues. In the future, generation of conditional knockout mice with either Cyp19a1-Cre [Citation62,Citation63] or Amh-Cre [Citation64] to specifically eliminate Epg5 in GCs, could be used to address this issue. The proper proliferation and differentiation of the surrounding GCs is essential for oocyte development and maturation [Citation65]. Autophagy has a functional link to both follicular atresia and follicular development; however, in vivo genetic-based validation studies in GCs have rarely been reported. A previous study used Cyp19a1-Cre to knockout the Becn1 gene in mouse precursor follicular GCs, which ultimately terminally differentiated into the lipid-rich steroidogenic luteal cells, lacked sufficient progesterone synthesis, yet showed no obvious follicle development abnormalities [Citation66]. In our study, an increased LC3-II:LC3-I ratio and accumulated SQSTM1 indicated insufficient autophagy activation and disrupted autophagic flux in both whole ovaries and GCs.
WT1 is a transcription factor expressed in ovarian GCs and testicular sertoli cells. The function of WT1 was initially elucidated in studies of sex determination [Citation67,Citation68]. WT1 is required for steroidogenesis in Leydig cells, and deletion of the Wt1 gene resulted in defects of testosterone biosynthesis and downregulation of steroidogenic gene expression [Citation69]. WT1 has a role in POI through missense mutations [Citation68]. Deletion of Wt1 in GCs led to subfertility in female mice due to the aberrant development of follicles caused by the premature differentiation of GCs [Citation46]. In vitro studies demonstrated that the expression of follicle FSHR, HSD3B1, and CYP19A1 was inhibited by WT1 in GCs. We further demonstrated that the autophagic defect in the epg5 knockout might result from blocking the degradation of WT1, resulting in the decreased expression of genes associated with GC differentiation (eg. Cyp19a1, Cyp11a1, Fshr, and Hsd3b1). In summary, we have demonstrated that Epg5 is required for female reproduction, and have implicated that GCs differentiation might be affected by disrupted WT1 degradation. Although autophagy has been shown to play a role in maintaining nuclear components [Citation70], future experiments should delve more deeply into how the nuclear protein WT1 engages in a physical interaction with SQSTM1 in the cytoplasm. We validated that EPG5 promotes WT1 degradation in both a mouse model and cells. Recently, Prof. Zhao has shown deficient autophagy is highly associated with POI by using cultured human and mouse granulosa cells, which is a close validation of the reliability of our study [Citation71]. Our investigation reveals how autophagy affects WT1 degradation, which regulates follicular development and could represent a driver of POI pathogensis in some human patients.
Materials and methods
Mice
Epg5± mice were obtained from the Institute of Biophysics, Chinese Academy of Sciences, Beijing, China [Citation35]. Epg5± mice were maintained with C57/BL6 genomic background, and were backcrossed to ICR background mice which were obtained from the specific pathogen-free (SPF) mice center for 10 generations. Animal experimental procedures in our study were approved by the Animal Research Committee of the Institute of Zoology, Chinese Academy of Sciences. Mice were first anesthetized with CO2, then sacrificed by cervical dislocation, and all efforts were made to minimize suffering.
Single-cell suspension preparation
The ovaries were isolated and immediately immersed in M2 medium (Sigma, M7167). Then, the fat and other adherent tissues were removed under a dissection microscope to obtain a “clean” ovary. Every sample was shredded into small pieces with tweezer and then was incubated with 2 mL of trypsin (Solarbio, 8049–47-6), 1 ml of collagenase VI (Thermo, 17,104,019) and 100 µL of DNase (Macklin, 9003–98-9) for 20 min at 37°C with shaking on thermomixer (200 g). Subsequently, 500 µL M2 medium containing 10% bovine serum albumin (BSA; Solarbio, A8010) was used to stop digestion, and then the next steps were conducted as previously described [Citation72].
RNA-sequencing and analysis
Cell capturing, cDNA amplification and library preparation were carried by Chromium Single Cell 3’ GEM, Library & Gel Bead Kit v3 (10 × Genomics, 1,000,075) according to the manufacturer’s instructions. Single-cell suspensions were loaded onto a Chromium Single-Cell Controller Instrument (10 × Genomics) to generate single-cell gel beads in emulsions (GEMs). Every library was sequenced on a HiSeq X Ten platform (IIIumina Novaseq 6000), and 150 bp paired-end reads were generated. Libraries were constructed using TruSeq Stranded mRNA LT Sample Prep Kit (Illumina, RS-122-2101). Differentially expressed genes (DEGs) analysis was conducted to explore gene expression patterns using DESeq2 based on the reads counts file. Gene ontology (GO) enrichment analysis of DEGs were performed by using the clusterProfiler R package [Citation73]. Transcriptome analysis and sequencing were completed by OE Biotech Co., Ltd. (Shanghai, China).
Superovulation and fertility testing
For superovulation, female mice were injected i.p. with 10 IU of eCG/PMSG (Ningbo Second Hormone Company, 110,254,564) and 44–48 h later with 10 IU hCG (Ningbo Second Hormone Company, 110,251,281). After an additional 16 h, oocyte/cumulus masses were surgically removed from oviducts and the numbers of MII oocytes were collected from oviducts.
To determine female mouse fertility, five 7- to 8-week-old epg5 knockout and the control females were mated with proven fertility control males for 6 months. The number of offspring from each pregnant female was recorded after birth.
In vitro fertilization in mice
Female mice 5- to 9-weeks-old were injected with 10 IU of eCG/PMSG, and 44–48 h later with 10 IU hCG. The cumulus oophorus cells (COCs) from donors were collected 13 to 14 h after hCG injection. Before this, sperm from cauda epididymis were released, and incubated in HTF (human tubal fluid) for capacitation for an additional hour. The COCs were then transferred to a 200 μL drop of HTF fertilization media containing sperm for at least 3 h. Next, the fertilized oocytes were examined and removed to 80 μL HTF, then incubated overnight at 37°C in 5% CO2. Two-cell embryos were counted and incubated in KSOM medium (Millipore, MR-121-D). Embryo development was examined every 12 h and the developmental rates of the embryos were calculated.
Tissue collection and histological analysis
Ovaries were washed with PBS (Solarbio, P1020) twice and fixed in 4% paraformaldehyde (PFA; pH 7.5) overnight at 4°C, dehydrated by using an ascending series of graded ethanol solutions, and then embedded in paraffin and serially sectioned at 5-μm. The slices were then held at 37°C overnight. Following deparaffinization with xylene and graded ethanol solutions, and then stained with hematoxylin and eosin (H&E).
Quantification of ovarian follicles
Ovaries were dehydrated, embedded in paraffin, and 5-μm serial sections were stained with H&E using standard protocol as described previously [Citation25]. The slides were scanned using a Leica Aperio VESA8 microscope. Primordial follicles were counted in every fifth section and multiplied by five to calculate the number of all primordial follicles in each ovary. Growing follicles were counted by scanning all sections and only the follicles with clear oocyte nuclei were counted to exclude the effect of residual structures after oocyte ablation in the ovaries. The total number of follicles for each ovary was determined by counting the follicles containing oocytes with a visible nucleus. Briefly, primordial follicles were defined as an oocyte surrounded by a single layer of squamous GCs. Primary follicles possessed an oocyte surrounded by a single layer of cuboidal GC layer. Secondary follicles consisted of an oocyte surrounded by two or more layers of cuboidal GCs with no visible antrum. Antral follicles contained four or more layers of GCs with a clearly defined single antral space.
Primary GCs isolation, culture, transfection and knockdown
Female mice at 5 weeks to 6 weeks of age were used for isolation of primary GCs. The ovaries were rapidly isolated and washed with PBS three times. The large antral follicles were punctured using an insulin injector needle in M2 medium to extrude GCs which were then filtered through a 40-μm filter and collected by centrifugation. The GCs were cultured in DMEM/F12 medium (Gibco, 11,330,032) complemented with 5% FBS and 1% penicillin-streptomycin and incubated at 37°C and 5% CO2. Oocytes that were unable to attach to the dish were removed during the medium change after 12 h. GCs were confirmed by immunofluorescence staining with the GC marker FOXL2 (Figure S6A), and GC purity was confirmed at 94.43% ± 1.915. To inhibit autophagy in vitro, GCs were incubated in DMEM/F12 medium containing 50 μM CQ (Sigma C6628) for 48 h. GCs were transfected with the relevant plasmid DNA using Lipofectamine 3000 (Invitrogen, L300015) according to the manufacturer’s instructions. For knockdown experiments, siRNA for silencing the expression of Wt1, as well as negative control siRNA, were purchased from Thermo Fisher Scientific (4,392,420). They were transfected into GCs with Lipofectamine 3000 without P3000. Cells were harvested 48 h after transfection for preparation of lysates.
Live-cell imaging
GCs were plated on glass-bottom dishes (NEST, 801,001) and transfected with the indicated plasmids. After 24 h of transfection, GCs were stained with 50 nM Lysotracker Red (Beyotime, C1046) for 10 min and imaged at 37°C and 5% CO2 using a 100 X objective (CFI Plan Apochromat Lambda, NA 1.45, Nikon) with oil on an inverted fluorescence microscope (Andor Dragfly 200, Nikon). Images were captured every 2 s for 15 min and analyzed with Imaris software (Oxford Instruments NanoScience).
Immunofluorescence
The ovaries were immediately embedded in optimum cutting temperature compound (OCT, Tissue-Tek), and cut into 5-µm sections using a microtome-cryostat (Leica, EG1150H). Frozen ovaries sections were washed with PBS twice and then fixed with 4% PFA for 20 min and washed in PBS for 5 min, three times (pH 7.4), every time for 5 min. Following blocking with 5% BSA for 30 min, samples were incubated with primary antibody in 1% BSA and 0.3% Triton X-100 (Elabscience, E-IR-R122) at 4°C overnight. The samples were washed with PBS three times, and then incubated with secondary antibody diluted with PBS for 1 h at 37°C. Next, the slides were washed with PBS containing 0.1% Triton X-100 3 times, and nuclei were stained with 4′,6-diamidino-2-phenylindole (DAPI) for 5 min. Images were taken using SP8 microscope (Leica) or LSM800 confocal microscope system (Zeiss).
Immunohistochemistry
Deparaffinized ovaries sections were boiled on high for 5 min and low for 15 min in sodium citrate buffer for antigen retrieval. And then 3% H2O2 was added to the sections to eliminate internal peroxidase activity for 10 min and washed in PBS for 5 min, three times (pH 7.4), every time for 5 min. Following blocking with 5% BSA for 30 min, samples were incubated with primary antibody in 1% BSA and 0.3% Triton X-100 at 4°C overnight. Negative controls were prepared without the primary antibody. The sections were washed with PBS containing 0.1% Triton X-100 three times, followed by staining with the HRP-conjugated secondary antibody (Zhong Shan Jin Qiao, ZB-2306) for 1.5 h at 37°C. The sections’ color was developed with 3, 3’-diaminobenzidine (DAB; Zhong Shan Jin Qiao, ZLI-9017), and the nuclei were stained with hematoxylin. Finally, the sections were dehydrated and mounted with Permount (Solarbio, G8590).
Western blot analysis
Ovaries and GCs were lysed with cold RIPA buffer (50 mM Tris–HCl, pH 7.5, 150 mM NaCl, 1% Nonidet P-40 (Thermo Fisher Scientific, 85,124), 0.1% SDS (Solarbio, S8010), 1% sodium deoxycholate (Sigma-Aldrich, 30,970–100 G), 5 mM EDTA) supplemented with 1 mM phenylmethylsulphonyl fluoride (PMSF; Amresco, 0754) and protease inhibitor cocktail (PIC; Roche, 04693116001). Proteins obtained from lysates were separated by SDS-PAGE and transferred to polyvinylidene difluoride (PVDF) membranes (Sigma-Aldrich, P2938-1ROL). Immunoblots were performed following a standard procedure by using ODYSSEY Sa Infrared Imaging System (LI-COR Biosciences, Lincoln, NE).
Antibodies
Goat anti-rabbit FITC (ZF-0311), goat anti-mouse FITC (ZF-0312), and goat anti-mouse TRITC (ZF-0313)-conjugated secondary antibodies were purchased from Zhong Shan Jin Qiao (Beijing, China). Rabbit EPG5 polyclonal antibody was generated by Mengcheng Luo of Wuhan University. Antibodies in this study: WT1 (ab89901), PCNA (ab29), DDX4 (ab27591), FOXL2 (ab5096), MKI67/Ki67(ab15580), FOS/c-FOS (ab222699), JUN/c-JUN (ab40766), and FOXO1 (ab179450) were all purchased from Abcam (Cambridge, UK). Rabbit anti-γ-H2AX (05–636) were purchased from Milipore. Rabbit anti-CASP3 polyclonal antibody (9662S), rabbit anti-LC3 (4599S) and rabbit anti-SQSTM1 (5114) were purchased from Cell signaling Technology. Rabbit anti-HSD3B1 (SC-30820) polyclonal antibody, rabbit anti-CYP11A1 (13,363-1-AP), rabbit anti-BCLAF1 (67,860-1-Ig), and rabbit anti-ATF4 (28,657-1-AP) was purchased from Santa Cruz Biotechnology and Proteintech. Mouse anti-GAPDH antibody (AC002), mouse anti-TUBA (AC012), rabbit anti-ACTB (AC026) was purchased from ABclonal (Wuhan, China).
Immunoprecipitation (IP)
Transfected HEK293T cells were lysed in hypersaline lysis buffer (50 mM Tris-HCl, pH 8.0, 150 mM NaCl, 0.5% Nonidet P-40, 5 mM EDTA) supplemented with protease inhibitors (Roche, 04693132001) for 30 min on ice and centrifuged at 13,523 g for 15 min and then the supernatant was precleared by incubation with protein A–Sepharose (GE Healthcare, 17–1279-03) at 4°C for 2 h. Thereafter, the precipitants were washed two times with IP buffer (50 mM Tris-HCl, pH 8.0, 150 mM NaCl, 0.5% Nonidet P-40, 5 mM EDTA), followed by heating of the precipitated material in SDS-PAGE sample buffer and immunoblotting analysis.
TUNEL assays
TUNEL assays were analyzed with the In Situ Cell Death Detection Kit (Roche Diagnostics, 11,684,795,910) according to the manufacturer’s instructions. Briefly, sections of ovaries were deparaffinized and boiled on high for 5 min and low for 15 min in sodium citrate buffer for antigen retrieval. After treated with H2O2 for 10 min at room temperature and sodium citrate for 2 min on ice, the slides were rinsed twice with PBS, the TUNEL reaction mixture as indicated by the instructions was applied to sections for 60 min at 37°C in the dark, followed by immunofluorescence staining as detailed above.
Statistical analysis
All experiments were repeated at least three times. Results were expressed as the mean ± S.E.M. Statistical analyses were conducted GraphPad Prism 9 software (GraphPad Software, La Jolla, CA, United States). For normal groups the statistical significance of the differences between the various groups was measured by Student’s t-test with an unpaired, two-tailed distribution. And for abnormal groups, data were analyzed using R (http://www.r-project.org). The statistical significances were defined as: *, p < 0.05; **, p < 0.01; ***, p < 0.001; ****, p < 0.0001, n.s., nonsignificant.
Ethics approval
Our studies did not include human participants, human data or human tissue. Detailed protocol for the animal studies in the “Mice” section of “Materials and Methods” part. Animal experimental procedures in our study were all approved by the Institutional Animal Care and Use Committee (IACUC) of Institute of Zoology, Chinese Academy of Sciences.
Supplemental Material
Download Zip (422.4 MB)Acknowledgments
We thank Hong Zhang of Institute of Biophysics, Chinese Academy of Sciences for sharing the Epg5± mice.
Disclosure statement
No potential conflict of interest was reported by the author(s).
Supplementary material
Supplemental data for this article can be accessed online at https://doi.org/10.1080/15548627.2022.2094671
Additional information
Funding
Related Research Data
References
- Coulam CB, Adamson SC, Annegers JF, et al. Incidence of premature ovarian failure. Obstet Gynecol. 1986;67(4):604–606.
- De Vos M, Devroey P, Fauser BCJM, et al. Primary ovarian insufficiency. Lancet. 2010;376(9744):911–921.
- Huhtaniemi I, Hovatta O, La Marca A, et al. Advances in the molecular pathophysiology, genetics, and treatment of primary ovarian insufficiency. Trends Endocrinol Metab. 2018;29(6):400–419.
- Caburet S, Arboleda VA, Llano E, et al. Mutant cohesin in premature ovarian failure. N Engl J Med. 2014;370(10):943–949.
- Bouilly J, Beau I, Barraud S, et al. Identification of multiple gene mutations accounts for a new genetic architecture of primary ovarian insufficiency. J Clin Endocrinol Metab. 2016;101(12):4541–4550.
- de Vries L, Behar DM, Smirin-Yosef P, et al. Exome sequencing reveals SYCE1 mutation associated with autosomal recessive primary ovarian insufficiency. J Clin Endocrinol Metab. 2014;99(10):E2129–32.
- AlAsiri S, Basit S, Wood-Trageser MA, et al. Exome sequencing reveals MCM8 mutation underlies ovarian failure and chromosomal instability. J Clin Invest. 2015;125(1):258–262.
- Wood-Trageser MA, Gurbuz F, Yatsenko SA, et al. MCM9 mutations are associated with ovarian failure, short stature, and chromosomal instability. Am J Hum Genet. 2014;95(6):754–762.
- Mandon-Pepin B, Touraine P, Kuttenn F, et al. Genetic investigation of four meiotic genes in women with premature ovarian failure. Eur J Endocrinol. 2008;158(1):107–115.
- Wang J, Zhang W, Jiang H, et al. Mutations in HFM1 in recessive primary ovarian insufficiency. N Engl J Med. 2014;370(10):972–974.
- de Bruin C, Mericq V, Andrew SF, et al. An XRCC4 splice mutation associated with severe short stature, gonadal failure, and early-onset metabolic syndrome. J Clin Endocrinol Metab. 2015;100(5):E789–98.
- Bayram Y, Gulsuner S, Guran T, et al. Homozygous loss-of-function mutations in SOHLH1 in patients with nonsyndromic hypergonadotropic hypogonadism. J Clin Endocrinol Metab. 2015;100(5):E808–14.
- Weinberg-Shukron A, Renbaum P, Kalifa R, et al. A mutation in the nucleoporin-107 gene causes XX gonadal dysgenesis. J Clin Invest. 2015;125(11):4295–4304.
- Ferrari I, Bouilly J, Beau I, et al. Impaired protein stability and nuclear localization of NOBOX variants associated with premature ovarian insufficiency. Hum Mol Genet. 2016;25(23):5223–5233.
- Sun Z, Zhang H, Wang X, et al. TMCO1 is essential for ovarian follicle development by regulating ER Ca(2+) store of granulosa cells. Cell Death Differ. 2018;25(9):1686–1701.
- Yeung CK, Wang G, Yao Y, et al. BRE modulates granulosa cell death to affect ovarian follicle development and atresia in the mouse. Cell Death Dis. 2017;8(3):e2697.
- Klionsky DJ, Emr SD. Autophagy as a regulated pathway of cellular degradation. Science. 2000;290(5497):1717–1721.
- Mizushima N, Komatsu M. Autophagy: renovation of cells and tissues. Cell. 2011;147(4):728–741.
- Levine B, Kroemer G. Biological functions of autophagy genes: a disease perspective. Cell. 2019;176(1–2):11–42.
- Mizushima N, Levine B, Longo DL. Autophagy in human diseases. N Engl J Med. 2020;383(16):1564–1576.
- Tian Y, Li Z, Hu W, et al. C. elegans screen identifies autophagy genes specific to multicellular organisms. Cell. 2010;141(6):1042–1055.
- Tian Y, Ren H, Zhao Y, et al. Four metazoan autophagy genes regulate cargo recognition, autophagosome formation and autolysosomal degradation. Autophagy. 2010;6(7):984–985.
- Piano Mortari E, Folgiero V, Marcellini V, et al. The Vici syndrome protein EPG5 regulates intracellular nucleic acid trafficking linking autophagy to innate and adaptive immunity. Autophagy. 2018;14(1):22–37.
- Gu H, Shi X, Liu C, et al. USP8 maintains embryonic stem cell stemness via deubiquitination of EPG5. Nat Commun. 2019;10(1):1465.
- Song ZH, Yu HY, Wang P, et al. Germ cell-specific Atg7 knockout results in primary ovarian insufficiency in female mice. Cell Death Dis. 2015;6(1):e1589.
- Liu C, Wang H, Shang Y, et al. Autophagy is required for ectoplasmic specialization assembly in sertoli cells. Autophagy. 2016;12(5):814–832.
- Shang Y, Wang H, Jia P, et al. Autophagy regulates spermatid differentiation via degradation of PDLIM1. Autophagy. 2016;12(9):1575–1592.
- Liu C, Song Z, Wang L, et al. Sirt1 regulates acrosome biogenesis by modulating autophagic flux during spermiogenesis in mice. Development. 2017;144(3):441–451.
- Wang H, Wan H, Li X, et al. Atg7 is required for acrosome biogenesis during spermatogenesis in mice. Cell Res. 2014;24(7):852–869.
- Komatsu M, Waguri S, Ueno T, et al. Impairment of starvation-induced and constitutive autophagy in Atg7-deficient mice. J Cell Biol. 2005;169(3):425–434.
- Kuma A, Hatano M, Matsui M, et al. The role of autophagy during the early neonatal starvation period. Nature. 2004;432(7020):1032–1036.
- Sou Y, Waguri S, Iwata J, et al. The Atg8 conjugation system is indispensable for proper development of autophagic isolation membranes in mice. Mol Biol Cell. 2008;19(11):4762–4775.
- Saitoh T, Fujita N, Jang MH, et al. Loss of the autophagy protein Atg16L1 enhances endotoxin-induced IL-1 beta production. Nature. 2008;456(7219):264–U68.
- Saitoh T, Fujita N, Hayashi T, et al. Atg9a controls dsDNA-driven dynamic translocation of STING and the innate immune response. Proc Natl Acad Sci U S A. 2009;106(49):20842–20846.
- Zhao H, Zhao YG, Wang X, et al. Mice deficient in Epg5 exhibit selective neuronal vulnerability to degeneration. J Cell Biol. 2013;200(6):731–741.
- Qu X, Zou Z, Sun Q, et al. Autophagy gene-dependent clearance of apoptotic cells during embryonic development. Cell. 2007;128(5):931–946.
- Hasson O, Stone L. Male infertility, female fertility and extrapair copulations. Biol Rev Camb Philos Soc. 2009;84(2):225–244.
- Guan M, Bogani D, Marschall S, et al. In vitro fertilization in mice using the MBCD-GSH protocol. Curr Protoc Mouse Biol. 2014;4(2):67–83.
- Dumesic DA, Meldrum DR, Katz-Jaffe MG, et al. Oocyte environment: follicular fluid and cumulus cells are critical for oocyte health. Fertil Steril. 2015;103(2):303–316.
- Zhang M, Zhang Q, Hu Y, et al. miR-181a increases FoxO1 acetylation and promotes granulosa cell apoptosis via SIRT1 downregulation. Cell Death Dis. 2017;8(10):e3088.
- Wang Z, Miao G, Xue X, et al. The vici syndrome protein EPG5 is a Rab7 Effector that determines the fusion specificity of autophagosomes with late endosomes/lysosomes. Mol Cell. 2016;63(5):781–795.
- Méar L, Herr M, Fauconnier A, et al. Polymorphisms and endometriosis: a systematic review and meta-analyses. Hum Reprod Update. 2020;26(1):73–102.
- Aibar S, González-Blas CB, Moerman T, et al. SCENIC: single-cell regulatory network inference and clustering. Nat Methods. 2017;14(11):1083–1086.
- Yang F, Liu Q, Chen Y, et al. Integrative proteomic and phosphoproteomic analyses of granulosa cells during follicular atresia in porcine. Front Cell Dev Biol. 2020;8:624985.
- Choi Y, Jeon H, Akin JW, et al. The FOS/AP-1 regulates metabolic changes and cholesterol synthesis in human periovulatory granulosa cells. Endocrinology. 2021;17(3):162.
- Gao F, Zhang J, Wang X, et al. Wt1 functions in ovarian follicle development by regulating granulosa cell differentiation. Hum Mol Genet. 2014;23(2):333–341.
- Chen M, Dong F, Chen M, et al. PRMT5 regulates ovarian follicle development by facilitating Wt1 translation. Elife. 2021;10. DOI:10.7554/eLife.68930.
- Chen M, Zhang L, Cui X, et al. Wt1 directs the lineage specification of sertoli and granulosa cells by repressing Sf1 expression. Development. 2017;144(1):44–53.
- Lu K, Psakhye I, Jentsch S, et al. A new class of ubiquitin-Atg8 receptors involved in selective autophagy and polyQ protein clearance. Autophagy. 2014;10(12):2381–2382.
- Cen CH, Chen M, Zhou JJ, et al. Inactivation of Wt1 causes pre-granulosa cell to steroidogenic cell transformation and defect of ovary development. Biol Reprod. 2020;103(1):60–69.
- Mauthe M, Orhon I, Rocchi C, et al. Chloroquine inhibits autophagic flux by decreasing autophagosome-lysosome fusion. Autophagy. 2018;14(8):1435–1455.
- McGee EA, Hsueh AJ. Initial and cyclic recruitment of ovarian follicles. Endocr Rev. 2000;21(2):200–214.
- Jiao X, Ke H, Qin Y, et al. Molecular genetics of premature ovarian insufficiency. Trends Endocrinol Metab. 2018;29(11):795–807.
- Irving-Rodgers HF, Harland ML, Rodgers RJ, et al. A novel basal lamina matrix of the stratified epithelium of the ovarian follicle. Matrix Biol. 2004;23(4):207–217.
- Mizushima N, Levine B. Autophagy in mammalian development and differentiation. Nat Cell Biol. 2010;12(9):823–830.
- Shibutani ST, Saitoh T, Nowag H, et al. Autophagy and autophagy-related proteins in the immune system. Nat Immunol. 2015;16(10):1014–1024.
- Choi JY, Jo MW, Lee EY, et al. The role of autophagy in follicular development and atresia in rat granulosa cells. Fertil Steril. 2010;93(8):2532–2537.
- Gawriluk TR, Hale AN, Flaws JA, et al. Autophagy is a cell survival program for female germ cells in the murine ovary. Reproduction. 2011;141(6):759–765.
- He Y, Deng H, Jiang Z, et al. Effects of melatonin on follicular atresia and granulosa cell apoptosis in the porcine. Mol Reprod Dev. 2016;83(8):692–700.
- Zhao F, Zhao W, Ren S, et al. Roles of SIRT1 in granulosa cell apoptosis during the process of follicular atresia in porcine ovary. Anim Reprod Sci. 2014;151(1–2):34–41.
- Matsuda F, Inoue N, Manabe N, et al. Follicular growth and atresia in mammalian ovaries: regulation by survival and death of granulosa cells. J Reprod Dev. 2012;58(1):44–50.
- Stocco C. Aromatase expression in the ovary: hormonal and molecular regulation. Steroids. 2008;73(5):473–487.
- Doody KJ, Lorence MC, Mason JI, et al. Expression of messenger ribonucleic acid species encoding steroidogenic enzymes in human follicles and corpora lutea throughout the menstrual cycle. J Clin Endocrinol Metab. 1990;70(4):1041–1045.
- Lécureuil C, Fontaine I, Crepieux P, et al. Sertoli and granulosa cell-specific Cre recombinase activity in transgenic mice. Genesis New York, NY: 2000. 2002;33(3):114–118.
- Monniaux D. Driving folliculogenesis by the oocyte-somatic cell dialog: lessons from genetic models. Theriogenology. 2016;86(1):41–53.
- Gawriluk TR, Ko C, Hong X, et al. Beclin-1 deficiency in the murine ovary results in the reduction of progesterone production to promote preterm labor. Proc Natl Acad Sci U S A. 2014;111(40):E4194–203.
- Huff V, Miwa H, Haber DA, et al. Evidence for WT1 as a Wilms tumor (WT) gene: intragenic germinal deletion in bilateral WT. Am J Hum Genet. 1991;48(5):997–1003.
- Armstrong JF, Pritchard-Jones K, Bickmore WA, et al. The expression of the Wilms’ tumour gene, WT1, in the developing mammalian embryo. Mech Dev. 1993;40(1–2):85–97.
- Chen M, Wang X, Wang Y, et al. Wt1 is involved in leydig cell steroid hormone biosynthesis by regulating paracrine factor expression in mice. Biol Reprod. 2014;90(4):71.
- Luo M, Zhao X, Song Y, et al. Nuclear autophagy: an evolutionarily conserved mechanism of nuclear degradation in the cytoplasm. Autophagy. 2016;12(11):1973–1983.
- Shao T, Ke H, Liu R, et al. Autophagy regulates differentiation of ovarian granulosa cells through degradation of WT1. Autophagy. 2022;1–15. 10.1080/15548627.2021.2005415
- Chen Z, Zhou L, Liu L, et al. Single-cell RNA sequencing highlights the role of inflammatory cancer-associated fibroblasts in bladder urothelial carcinoma. Nat Commun. 2020;11(1):5077.
- Yu G, Wang LG, Han Y, et al. clusterProfiler: an R package for comparing biological themes among gene clusters. OMICS. 2012;16(5):284–287.