
ABSTRACT
Synapses represent an important target of Alzheimer disease (AD), and alterations of their excitability are among the earliest changes associated with AD development. Synaptic activation has been shown to be protective in models of AD, and deep brain stimulation (DBS), a surgical strategy that modulates neuronal activity to treat neurological and psychiatric disorders, produced positive effects in AD patients. However, the molecular mechanisms underlying the protective role(s) of brain stimulation are still elusive. We have previously demonstrated that induction of synaptic activity exerts protection in mouse models of AD and frontotemporal dementia (FTD) by enhancing the macroautophagy/autophagy flux and lysosomal degradation of pathological MAPT/Tau. We now provide evidence that TFEB (transcription factor EB), a master regulator of lysosomal biogenesis and autophagy, is a key mediator of this cellular response. In cultured primary neurons from FTD-transgenic mice, synaptic stimulation inhibits MTORC1 signaling, thus promoting nuclear translocation of TFEB, which, in turn, induces clearance of MAPT/Tau oligomers. Conversely, synaptic activation fails to promote clearance of toxic MAPT/Tau in neurons expressing constitutively active RRAG GTPases, which sequester TFEB in the cytosol, or upon TFEB depletion. Activation of TFEB is also confirmed in vivo in DBS-stimulated AD mice. We also demonstrate that DBS reduces pathological MAPT/Tau and promotes neuroprotection in Parkinson disease patients with tauopathy. Altogether our findings indicate that stimulation of synaptic activity promotes TFEB-mediated clearance of pathological MAPT/Tau. This mechanism, underlying the protective effect of DBS, provides encouraging support for the use of synaptic stimulation as a therapeutic treatment against tauopathies.Abbreviations: 3xTg-AD: triple transgenic AD mice; AD: Alzheimer disease; CSA: cyclosporine A; DBS: deep brain stimulation; DIV: days in vitro; EC: entorhinal cortex; FTD: frontotemporal dementia; gLTP: glycine-induced long-term potentiation; GPi: internal segment of the globus pallidus; PD: Parkinson disease; STN: subthalamic nucleus; TFEB: transcription factor EB
Introduction
Alzheimer disease (AD) is the most wide-spread form of dementia characterized by progressive memory loss and accumulation of beta-amyloid peptide and hyperphosphorylated and aggregated forms of the MAPT/Tau protein, particularly at the synaptic level [Citation1,Citation2,Citation3]. Synapses are a crucial target in AD pathology, and their loss correlates with cognitive disabilities observed in patients [Citation4–6]. Indeed, synaptic alteration is one of the primary events associated with AD pathogenesis, together with a decrease in brain metabolism [Citation7–9]. Recent studies combining magnetoencephalography with PET scanning demonstrated that reduced synapse density and decreased neuronal activity is associated with a high load of MAPT/Tau in AD patients [Citation10], suggesting that reestablishment of synaptic/neuronal activity may promote clearance of pathological MAPT/Tau. In fact, stimulation of synaptic activity was shown to be protective in models of AD [Citation11,Citation12], while deep brain stimulation (DBS) provides beneficial outcomes in AD patients (see reviews Citation13,Citation14). Such positive effects suggest that brain stimulation might promote cellular mechanisms correcting neuronal and synaptic dysfunctions. We have previously demonstrated that synaptic activity exerts protection in mouse models of AD and frontotemporal dementia (FTD) by enhancing autophagy and lysosomal activity with consequent degradation of pathological MAPT/Tau, thus protecting synapses [Citation15,Citation16]. However, how this is achieved on a molecular level is not clear. Now, we provide evidence that the protective function of autophagy occurs via activation of TFEB (transcription factor EB), a master regulator of lysosomal biogenesis and autophagy (see reviews Citation17,Citation18). MTORC1-dependent phosphorylation of TFEB at Ser142 and Ser211 results in TFEB cytosolic retention, and hence inhibition [Citation19,Citation20]. Conversely, nutrient starvation or lysosomal stress, by inhibiting MTORC1, promotes TFEB dephosphorylation and nuclear translocation, which results in activation of its target genes, thus supporting cellular catabolism [Citation21]. In the field of neurodegenerative diseases, the regulation of TFEB is of increasing interest. Recent studies involving TFEB activation/overexpression have demonstrated protective effects in models of FTD, AD, and motoneuron degeneration [Citation22–24]. Our data demonstrate for the first time that synaptic stimulation promotes nuclear translocation of TFEB and hence induction of its target genes, which results in enhancement of the autophagy pathway and clearance of toxic MAPT/Tau thereafter. Synaptic activation increased transcription levels of genes downstream of TFEB regulation, in particular restoring levels of the lysosomal V-ATPase proton pump subunit ATP6V0D1 both in vitro and in vivo. To assess the relevance of our findings to humans, we analyzed brain sections of patients who underwent DBS surgery as a therapy for Parkinson disease (PD). The presence of MAPT/Tau accumulation has been demonstrated in PD patients, and a genome-wide association study provided evidence for a link between MAPT/Tau pathology and sporadic PD [Citation25]. Of note, reduced levels of soluble MAPT/Tau and a reduced 3 R-MAPT/Tau to 4 R-MAPT/Tau ratio were measured in brains of PD patients compared to controls, suggesting mechanisms of pathological MAPT/Tau development similar to AD [Citation26]. We found that DBS in the subthalamic nucleus (STN) of PD patients reduced levels of pathological MAPT/Tau and protected neurons in the afferent internal segment of the globus pallidus (GPi); in addition, we also observed increased levels of TFEB-targets SQSTM1/p62 and MCOLN1 (mucolipin 1) in DBS-treated patients, suggesting TFEB activation and enhanced autophagy flux.
Thus, restoration of autophagy and lysosomal clearance by TFEB might underlie the positive effects of DBS and synaptic activity in general against tauopathies.
Results
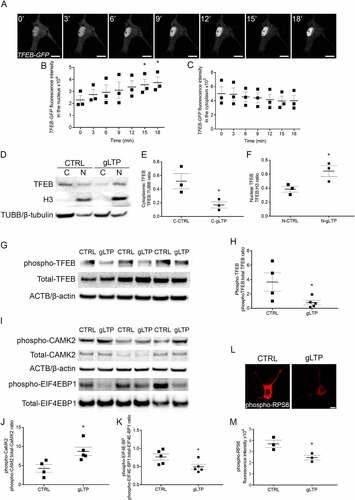
We previously demonstrated that neuronal activation increases autophagy flux and enhances lysosomal degradation of pathological MAPT/Tau [Citation15]; thus, we decided to investigate whether TFEB was implicated. TFEB plays a pivotal role in regulating lysosomal biogenesis and autophagy and is involved in activity-driven MAPT/Tau degradation [Citation21,Citation23]. We first explored the possibility that synaptic stimulation might have a direct effect on TFEB activation by promoting its nuclear translocation. Primary neuronal cultures were prepared from PS19 transgenic mice overexpressing a human MAPT/Tau gene harboring the mutation P301S, which is associated with a familial form of FTD [Citation27]. We previously demonstrated that PS19 neurons cultured for 14 days in vitro (DIV) develop a pathological phenotype comprising increased levels of phospho- and oligomeric MAPT/Tau and reduced levels of pre- and post-synaptic proteins compared to WT neurons [Citation15]. Neurons were transfected with GFP-tagged human TFEB (TFEB-GFP) and synaptic stimulation was initiated with a well-established glycine-induced long-term potentiation (gLTP) protocol, which we and other groups have used extensively in the past [Citation12,Citation15,Citation28]. Live-cell imaging demonstrated that TFEB-GFP progressively trafficked from the cytoplasm into the nucleus during the first 18 minutes (min) of gLTP stimulation (); TFEB-GFP intensity in the nuclei of Tg neurons significantly increased by 55 ± 21% and 63 ± 20% at 15 and 18 min, respectively, in comparison to the intensity at 0 min (). Accordingly, we also observed a progressive trend of reduction of TFEB-GFP fluorescence in the cytoplasm during gLTP stimulation (). To assess whether endogenous TFEB translocates to the nucleus upon stimulation, we prepared cytoplasm-enriched and nuclei-enriched fractions from cultured neurons. Compared to control, in stimulated neurons (gLTP), the amount of TFEB in the cytoplasm-enriched fraction (C, TUBB/β-tubulin-positive) is reduced by 67 ± 8% (, quantification in E). In striking contrast, the nuclei-enriched fraction (N, histone H3-positive) of gLTP neurons contained 67 ± 17% more TFEB compared to control (, quantification in F), indicating that nuclear translocation of endogenous TFEB is significantly enhanced by synaptic stimulation. TFEB is a member of the MiT/TFE family of transcription factors, which also includes TFE3, a ubiquitous protein which regulates the same target genes as TFEB and it is similarly regulated by MTORC1 [Citation29]. Interestingly, we found that TFE3 nuclear translocation was also increased upon synaptic stimulation (+50 ± 9%) compared to control (Figure S1A, quantification in B), thus suggesting that the same mechanism underlined activation of both transcription factors in this condition. To further confirm that TFEB activation was enhanced by gLTP stimulation, we quantified levels of phospho-TFEB phosphorylated at residue Ser142. Western blot analyses showed a 78 ± 9% decrease of phospho-TFEB in gLTP-stimulated compared to CTRL Tg neurons (, quantification in H). We also confirmed our previous data demonstrating that gLTP reduced levels of MAPT/Tau oligomers [Citation15]; dot-blot analyses showed a 40 ± 10% reduction of MAPT/Tau oligomers in gLTP-stimulated compared to CTRL Tg neurons (Figure S1C, quantification in D). As a qualitative marker of synaptic activation, we monitored the levels of phospho-CAMK2/CaMKII, as it is known to self-phosphorylate at Thr286 upon LTP [Citation30]; its augmented levels (, upper panel, quantification in J) indicated that synaptic activation had been enhanced by the treatment. Since MTORC1 represents the major regulator of MiT/TFE factors’ cellular localization, we then evaluated whether TFEB nuclear translocation upon stimulation correlated with reduced MTORC1 signaling. To this end, we monitored phosphorylation levels of the MTORC1 substrates EIF4EBP1 and RPS6 [Citation31]; in particular, the levels of phospho-EIF4EBP1 (Ser65) were measured by western blot (), while those of phospho-RPS6 (Ser240/244) by immunofluorescence (). Levels of phospho-EIF4EBP1 and phospho-RPS6 were found decreased by 36 ± 17% and 33 ± 6%, respectively, in gLTP stimulated neurons, when compared to CTRL Tg neurons (quantifications in ). To test whether gLTP enhanced the dephosphorylation of TFEB in a comparable manner to MTOR inhibition, we performed gLTP induction the presence or absence of torin 1, a selective MTOR inhibitor [Citation32]. As expected, torin 1 treatment per se resulted in decreased (−78 ± 6%) levels of phospho-TFEB (Ser142), similarly to gLTP stimulation (−74 ± 10%). Interestingly, when combined, gLTP stimulation and torin 1 reduced phospho-TFEB slightly more efficiently (−89 ± 4%; Figure S1E, quantification in F). Overall, these data indicate that synaptic activation inhibits MTORC1 signaling, leading to TFEB nuclear translocation.
Figure 1. Synaptic activity induces TFEB trafficking to the nucleus in primary cultured neurons. (A) Tg cultured neurons were transfected with TFEB-GFP and stimulated by gLTP. The sequence of images, acquired every 3 min, showed the progressive entrance of TFEB-GFP into the nucleus, resulting in its increased fluorescence (scale bars: 10 μm). (B) Quantitative analysis showing significantly increased TFEB-GFP fluorescence levels within the nucleus after stimulation, by 55 ± 21% and 63 ± 20% at 15 and 18 min respectively, compared to time 0 min (n = 3; repeated measures ANOVA p = 0.0018, followed by Dunnett’s multiple comparison test, 0 min vs 15 min *p < 0.05, 0 min vs 18 min *p < 0.05). (C) Quantification of cytoplasmatic levels of TFEB-GFP fluorescence showing a decreasing trend after stimulation compared to time 0 min (n = 3; repeated measures ANOVA p = 0.06, followed by Dunnett’s multiple comparison test, p > 0.05). (D-F) Quantification of endogenous TFEB showing 67 ± 8% reduction in the cytoplasm and 67 ± 17% increase in the nucleus of stimulated (gLTP) compared to control (CTRL) neurons (n = 3; two-tailed unpaired t-test, *p < 0.05). (G) Western blot analyses demonstrated reduction of phospho-TFEB (Ser142) in gLTP compared to CTRL Tg neurons. Phospho-TFEB was normalized with total TFEB. (H) Quantitative analysis showed that levels of phospho-TFEB are reduced by 78 ± 9% in gLTP compared to CTRL Tg neurons (n = 4–5; two-tailed unpaired t-test, *p < 0.05). (I) Western blot analyses demonstrated reduction of phospho-EIF4EBP1 and increased phospho-CAMK2 in gLTP compared to CTRL Tg neurons. Phospho-EIF4EBP1 and phospho-CAMK2 were normalized with total EIF4EBP1 and total CAMK2, respectively. (J) Increased levels of phospho-CAMK2 (104 ± 25%) indicate the activation of neurons by gLTP (n = 4–5; two-tailed unpaired t-test, *p < 0.05). (K) Quantitative analysis showed that levels of phospho-EIF4EBP1 are reduced of 36 ± 17% in gLTP compared to CTRL Tg neurons (n = 5; two-tailed unpaired t-test, *p < 0.05). (L, M) gLTP significantly reduced levels of phospho-RPS6 of 33 ± 6% compared to control in Tg neurons, as quantified by confocal immunofluorescence (n = 3; two-tailed unpaired t-test, * p < 0.05; scale bar: 10 μm).
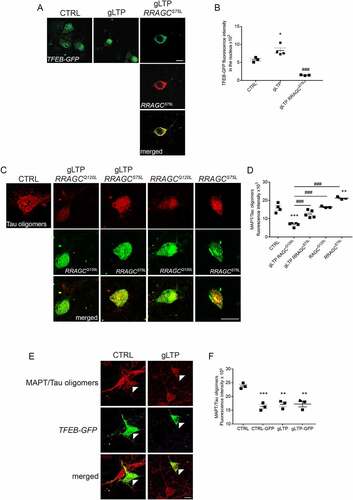
To determine whether TFEB trafficking to the nucleus upon synaptic stimulation is required for clearance of pathological MAPT/Tau, we prevented TFEB nuclear entry by ectopically activating MTORC1 signaling. We co-transfected Tg neurons with TFEB-GFP together with a constitutively active form of RRAGC, RRAGCS75L, which recruits TFEB at the lysosome thus promoting its phosphorylation and cytosolic sequestration [Citation33]. As expected, we found that expression of constitutively active RRAGCS75L completely blocked TFEB nuclear translocation upon gLTP, by sequestering TFEB in the cytoplasm (; quantification in B). Importantly, under these conditions, the reduction of MAPT/Tau oligomers induced by gLTP was prevented, which was not the case for expression of a constitutively inactive RRAGC, RRAGCQ120L, (; quantified in D), which is unable to bind TFEB [Citation33,Citation34]. Of note, transfection with RRAGCS75L alone induced an increase of MAPT/Tau oligomers (+27 ± 2%) compared to CTRL (; quantified in D), and the overexpression of TFEB-GFP alone resulted in a decrease (−31 ± 3%) of MAPT/Tau oligomers in unstimulated (CTRL-GFP), when compared to control Tg neurons (CTRL; , left panels, quantification in F). Finally, gLTP stimulation induced MAPT/Tau clearance in both positive (−28 ± 5%) and negative (−28 ± 4%) neurons, when compared to CTRL (, right panels, quantification in F). The similar levels of MAPT/Tau clearance measured in gLTP-GFP and gLTP-untransfected neurons is probably due to the fact that TFEB-GFP overexpression already cleared MAPT/Tau oligomers to a degree that gLTP cannot further reduce, or that immunofluorescence cannot discriminate. Taken together, these data demonstrate that TFEB nuclear translocation correlates with clearance of pathological MAPT/Tau upon synaptic stimulation.
Figure 2. TFEB trafficking to the nucleus is required for activity-dependent reduction of pathological MAPT/Tau in Tg neurons. (A) gLTP induced a significant 44 ± 13% increase of TFEB-GFP in the nucleus of transfected Tg neurons (central panel, green) compared to CTRL (left panel, green). Tg neurons were co-transfected with TFEB-GFP together with a constitutively active mutant RRAGCS75L (right panels, red and merged). Upon gLTP, entrance of TFEB into the nucleus of RRAGCS75L positive neurons was abolished (right panel, green), as quantified in (B) (n = 3–4; one-way ANOVA test, p = 0.0002, followed by Tukey’s multiple comparison post-hoc test: CTRL vs gLTP *p < 0.05, gLTP vs gLTP+RRAGCS75L ###p < 0.001). (C, D). gLTP induced a 59 ± 6% reduction of MAPT/Tau oligomers in RRAGCQ120L compared to CTRL Tg neurons. Prevention of TFEB entrance in the nucleus by transfection with RRAGCS75L abolished activity-dependent clearance of MAPT/Tau oligomers as quantified by confocal immunofluorescence in D (n = 3–5; one-way ANOVA, p = 0.0008 followed by Tukey’s multiple comparison test: CTRL vs gLTP RRAGCQ120L ***p < 0.0001, CTRL vs RRAGCS75L **p < 0.01, gLTP+RRAGCQ120L vs gLTP+RRAGCS75L ###p < 0.001, gLTP+RRAGCQ120L vs RRAGCQ120L ###p < 0.001, gLTP+RRAGCQ120L vs RRAGCS75L ###p < 0.001). (E, F) Transfection with TFEB-GFP reduces levels of MAPT/Tau oligomers (−31 ± 3%) in Tg neurons (CTRL-GFP, left panels, white arrowheads) compared to CTRL. gLTP stimulation reduces MAPT/Tau oligomers (−28 ± 5%) both in Tg neurons transfected with TFEB-GFP (gLTP-GFP, right panels, white arrowhead) and untransfected Tg neurons (−28 ± 4%, gLTP; n = 3; one-way ANOVA, p = 0.0007 followed by Tukey’s multiple comparison test: CTRL vs CTRL-GFP ***p < 0.001, CTRL vs gLTP **p < 0.01, CTRL vs gLTP-GFP **p < 0.01). Scale bars: 10 μm.
Consistent with a possible role for TFEB nuclear localization in enhancing lysosomal clearance of MAPT/Tau, we found that transcription of several target genes was increased upon synaptic stimulation in cultured neurons. Remarkably, in gLTP-treated neurons we found significant increases in the mRNA expression of Mcoln1 (mucolipin 1), which encodes a lysosomal Ca2+ channel (+81 ± 27%), of genes encoding lysosomal v-ATPase subunits ATP6V0D1, ATP6V1H and ATP6V1D (+81 ± 31%, +62 ± 17% and +107 ± 39%, respectively), and of Sqstm1/p62 (+65 ± 24%), when compared to control (CTRL; ). We then assessed the protein levels of MCOLN1, ATP6V0D1, ATP6V1H, and ATP6V1D upon synaptic activation. Western blot analyses revealed an increase in MCOLN1 and ATP6V0D1 (+48 ± 10% and +116 ± 35%, respectively) in gLTP-stimulated compared to control Tg neurons (, quantification in G; , quantification in I). In contrast, no changes were observed in the protein levels of ATP6V1H (Figure S1G, quantification in H) and of ATP6V1D (Figure S1I, quantification in J). Overall, these data show that TFEB translocation to the nucleus upon stimulation is associated with transcription of some of its known target genes as well as with increased levels of some of the respective proteins.
Figure 3. Synaptic activation triggers TFEB downstream gene expression. (A-E) Quantitative RT-PCR revealed an increase of 81 ± 27% of Mcoln1 (n = 4), 81 ± 31% of ATP6V0D1 (n = 3–4), 62 ± 17% of ATP6V1H (n = 4–5), 107 ± 39% of ATP6V1D (n = 4), and 65 ± 24% of Sqstm1 (n = 6) transcripts in gLTP-stimulated compared to CTRL neurons (two-tailed unpaired t-test, *p < 0.05). (F, G) Western blot analyses demonstrated that synaptic activity augmented of 48 ± 10% levels of MCOLN1 in gLTP-stimulated compared to CTRL Tg neurons (n = 3–4; two-tailed unpaired t-test, *p < 0.05). (H, I) Western blot analyses demonstrated that synaptic activity augmented of 116 ± 35% levels of ATP6V0D1 in gLTP-stimulated compared to CTRL Tg neurons (n = 4–5; two-tailed unpaired t-test, *p < 0.05). (J-L) Western blots analyses demonstrated a 44 ± 1% and a 41 ± 4% reduction of TFEB protein in TFEB-siRNA-transfected and gLTP+TFEB-siRNA-transfected neurons, respectively, compared to CTRL (upper panel; n = 3; one-way ANOVA test, p = 0.0048, followed by Tukey’s multiple comparison post-hoc test: CTRL vs gLTP+TFEB-siRNA *p < 0.05, CTRL vs TFEB-siRNA *p < 0.05, gLTP vs gLTP+TFEB-siRNA #p < 0.05, gLTP vs TFEB-siRNA #p < 0.05). gLTP increased significantly levels of ATP6V0D1 (43 ± 17%) in Tg neurons as compared to CTRL; ATP6V0D1 protein levels were significantly reduced by TFEB silencing (−70 ± 6%) as compared to control, even in the presence of gLTP (−66 ± 3%; n = 3; one-way ANOVA test, p < 0.0001, followed by Tukey’s multiple comparison post-hoc test: CTRL vs gLTP *p < 0.05, CTRL vs gLTP+TFEB-siRNA **p < 0.01, CTRL vs TFEB-siRNA **p < 0.01, gLTP vs gLTP+TFEB-siRNA ###p < 0.001, gLTP vs TFEB-siRNA ###p < 0.001). (M, N) Transfection of Tg neurons with TFEB-siRNA prevented gLTP-induced decrease of MAPT/Tau oligomers (third panel), which was maintained in untransfected neurons (second panel, −60 ± 7%). (n = 3, one-way ANOVA, p = 0.0164, Tukey’s multiple comparison test: CTRL vs gLTP *p < 0.05; gLTP vs gLTP+TFEB-siRNA # p < 0.05; gLTP vs TFEB-siRNA #p < 0.05; scale bar: 10 µm).
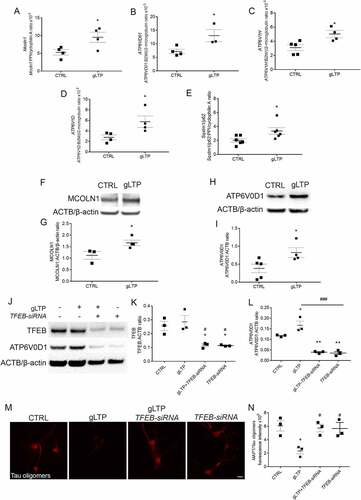
To determine whether TFEB was required for MAPT/Tau clearance upon stimulation, we reduced its endogenous levels by RNA interference in Tg neurons. In depleted neurons, TFEB levels were reduced by 44 ± 1% compared to controls and gLTP did not prevent such reduction (−41 ± 4%, , upper panel, quantification in K). Notably, gLTP affected neither overall TFEB protein levels (, upper panel, quantification in K), nor transcription (Figure S1K). To assess whether the increase of TFEB target genes was dependent on TFEB, we monitored the level of ATP6V0D1 in TFEB-depleted neurons. We found that ATP6V0D1 protein levels were significantly reduced by 70 ± 6% as compared to control, even in the presence of gLTP (−66 ± 3%; , middle panel, quantification in L). Remarkably, in TFEB-depleted neurons, we also observed that the clearance of MAPT/Tau oligomers induced by gLTP (−60 ± 7%) was prevented (, quantification in N). Overall, these data demonstrate that TFEB is required for the clearance of toxic MAPT/Tau upon synaptic stimulation.
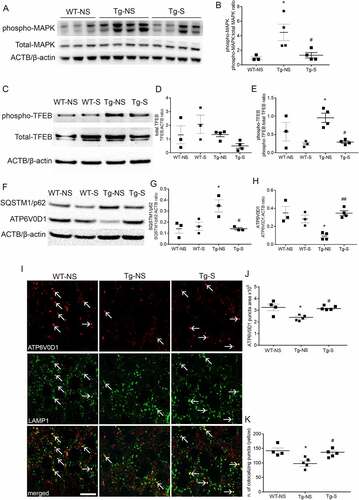
To validate the data obtained in cultured neurons in an in vivo system, we used triple transgenic AD mice (3xTg-AD) implanted with electrodes in the entorhinal cortex (EC) to induce chronic DBS. DBS of EC has been demonstrated to increase activity in the hippocampus [Citation35] and has been associated with reduction of pathological MAPT/Tau and beta-amyloid in 3xTg-AD mouse model [Citation15,Citation16]. We used one group of wild-type mice that underwent surgery but was not stimulated (sham, WT-NS), one group of wild-type mice that underwent surgery but was stimulated (WT-S), one group of 3xTg-AD mice that underwent surgery but was not stimulated (sham, Tg-NS) for use as a 3xTg-AD control, and one group of 3xTg-AD mice that underwent DBS stimulation (Tg-S). We decided to confirm that inhibition of MTOR occurred in vivo upon DBS. Thus, we measured the phosphorylation levels of p44/42 mitogen-activated protein kinase (phospho-MAPK), an upstream regulator of MTOR, and found that they were increased by 369 ± 120% in 3xTg-AD compared to WT-NS mice (, quantification in B). DBS treatment restored levels of phospho-MAPK back to wild-type in 3xTg-AD mice, indicating a consequent dampening MTOR activity (, quantification in B). We observed that the overall levels of endogenous TFEB were not significantly changed in the hippocampi of 3xTg-AD compared to WT mice (, middle panel, quantification in D). However, we detected a decrease in TFEB phosphorylation at Ser 142 of 69 ± 3% and 75 ± 4% in Tg-S and WT-S, respectively, compared to Tg-NS samples (comparison with WT-NS did not reach statistical significance due to high variability in TFEB levels) indicating that TFEB is activated upon DBS (, upper panel, quantification in E). We previously demonstrated that DBS enhanced autophagy flux in 3xTg-AD mouse brains, and that levels of SQSTM1/p62 were increased in Tg neurons and reduced by gLTP [Citation15]. We now confirm that levels of SQSTM1 were increased by 150 ± 39% in Tg-NS mice compared to WT-NS, and that DBS restored WT levels of SQSTM1 in Tg-S mice (, upper panel, quantification in G). Then, we analyzed the protein levels of MCOLN1 and of the V-ATPase subunits investigated in cultured neurons. We did not observe differences for MCOLN1, ATP6V1H and ATP6V1D in Tg-NS mice, when compared to Tg-S mice (Figure S2A, C, and E, quantifications in B, D, and F, respectively). On the contrary, levels of ATP6V0D1 showed a 54 ± 6% decrease in Tg-NS compared to WT-NS (, middle panel, quantification in H). Chronic DBS treatment restored ATP6V0D1 levels in Tg-S mice back to that of WT controls (, middle panel, quantification in H). Immunofluorescence experiments in mouse brain sections confirmed the western blot findings: ATP6V0D1 puncta were 26 ± 4% smaller in Tg-NS than WT-NS (, upper panels in red, quantification in J). In addition, we also observed a 31 ± 7% reduction in colocalization of ATP6V0D1 puncta with lysosomes, labeled with an antibody against the lysosomal component LAMP1 (lysosomal associated membrane protein 1), in Tg-NS compared to WT-NS (, lower panels, quantification in K). The reduced colocalization was not a consequence of reduced LAMP1 expression. Indeed, in Tg-NS LAMP1 levels were 46 ± 3% higher than in Tg-S mice (Figure S2G, quantification in H); in addition, always in Tg-NS mice, LAMP1 levels, as assessed by Western blot (Figure S2I, quantification in J) or confocal immunofluorescence (Figure S2K, quantification in L), were increased by 49 ± 9% and 11 ± 3%, respectively, compared to WT-NS. Remarkably, in Tg-S mice DBS restored ATP6V0D1 puncta size (, upper panels in red, quantification in J), as well as its colocalization with LAMP1 (, lower panels, quantification in K). In addition, DBS reestablished LAMP1 levels in Tg-S mice back to those observed in WT-NS mice (Figure S2I and K, quantifications in J and L, respectively). Together, these data indicate that DBS-mediated activation of TFEB in Tg mice rescues lysosomal protein levels back to those of WT mice. In particular, the increased lysosomal localization of ATP6V0D1 may suggest that synaptic stimulation also enhances lysosomal activity in Tg mice.
Figure 4. Synaptic activation restores levels of ATP6V0D1 and its lysosomal localization. (A, B) Western blot analyses showed higher (369 ± 120%) levels of phospho-MAPK in Tg-NS compared to WT-NS hippocampi; DBS restored levels of phospho-MAPK in Tg-S mice back to WT-NS levels (n = 3,4; one-way ANOVA test, p = 0.022, followed by Tukey’s multiple comparison post-hoc test: WT-NS vs Tg-NS *p < 0.05; Tg-NS vs Tg-S #p < 0.05). (C-E) Levels of phospho-TFEB (upper panel) were reduced by 69 ± 3% and 75 ± 4% in Tg-S and WT-S, respectively, compared to Tg-NS 3xTg mouse hippocampi (E), while levels of total TFEB (D) remained unchanged (n = 3–4; one-way ANOVA p = 0.0093, Tukey’s multiple comparison test: WT-S vs Tg-NS #p < 0.05, Tg-NS vs Tg-S #p < 0.05). (F, G) Levels of SQSTM1/p62 were increased by 150 ± 39% in Tg-NS compared to WT-NS mouse hippocampi, while in Tg-S levels of SQSTM1/p62 were restored back to WT-NS (n = 3; one-way ANOVA p = 0.0154, Tukey’s multiple comparison test: WT-NS vs Tg-NS *p < 0.05, Tg-NS vs Tg-S #p < 0.05). (F, H) Levels of ATP6V0D1 were decreased of 54 ± 6% in Tg-NS compared to WT-NS mouse hippocampi, while in Tg-S levels of ATP6V0D1 were restored back to WT-NS (n = 3–4; one-way ANOVA p = 0.002, Tukey’s multiple comparison test: WT-NS vs Tg-NS *p < 0.05; Tg-NS vs Tg-S ##p < 0.01). (I-K) Confocal immunofluorescence showed that Tg-NS hippocampal neurons had a 26 ± 4% decrease in size puncta areas of ATP6V0D1 (upper panels) compared to WT; DBS was able to restore ATP6V0D1 puncta areas in Tg-S back to WT-NS mice (n = 4–5; one-way ANOVA test p = 0.0184 followed by Tukey’s multiple comparison test WT-NS vs Tg-NS *p < 0.05, Tg-NS vs Tg-S #p < 0.05). Quantification of ATP6V0D1 and LAMP1 colocalization (lower panels, white arrows) revealed a 31 ± 7% decrease of colocalizing puncta in Tg-NS compared to WT-NS. DBS restored the number of ATP6V0D1 and LAMP1 colocalizing puncta in Tg-S hippocampal neurons back to WT-NS (n = 4–5; one-way ANOVA p = 0.0096 followed by Tukey’s multiple comparison test: WT-NS vs Tg-NS *p < 0.05, Tg-S vs Tg-NS #p < 0.05; scale bar: 10 μm).
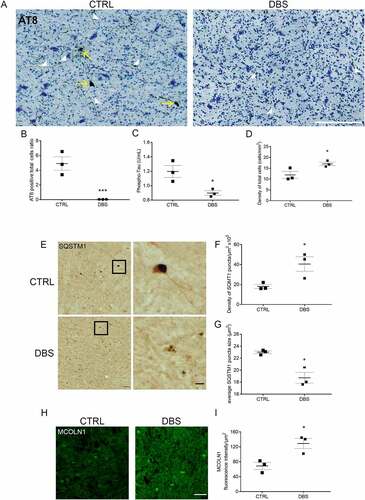
To investigate the effect of DBS on MAPT/Tau pathology in the human brain, we used coronal sections from PD patients who underwent DBS surgery to control tremor, bradykinesia, and other symptoms. Accumulation of pathological MAPT/Tau has become more frequently observed in PD, in association with toxicity and cell death [Citation36–38]. To detect presence of a MAPT/Tau pathology of comparable importance in PD DBS-implanted (DBS) and PD non-implanted (CTRL) patients, we immunostained the cortex, a brain area present in all sections and not subjected to DBS, with an AT8 antibody that recognized MAPT/Tau phosphorylation at Ser202 and Thr205. Remarkably, we have found the presence of AT8-positive neurons in all analyzed cortices without a noticeable difference between CTRL and DBS groups (unpaired t-test, p = 0.9399; Figure S3A, quantification in B), indicating that PD patients had a comparable concurrent tauopathy. Then, we investigated levels of pathological MAPT/Tau in the stimulated brain areas. DBS patients were implanted with electrodes in the STN, which mainly project into the GPi. Subsequently, we stained sections with Nissl to easily identify the precise location of the GPi, where we quantified MAPT/Tau accumulation (Figure S3C, yellow-dotted areas). Higher magnification images revealed AT8-positive accumulations in the soma and neurites of most neurons in CTRL GPi areas (, left panel). Remarkably, DBS GPi specimens did not show AT8-positive somas, and a trend for decreased AT8-positive neurites was detectable in DBS samples compared to CTRL (, right panel; quantifications in B and in Figure S3D). An additional pathological MAPT/Tau phosphorylation at residue Thr231 was investigated in GPi lysates by specific ELISA quantification. The results demonstrated a significant 25 ± 3% (0,3 ± 0,03 U/mL) decrease of phospho-MAPT/Tau in lysates of DBS-implanted patients compared to CTRL (). Importantly, a 43 ± 7% higher number of neurons (+5,12 ± 0,8/mm2) was measured in DBS compared to control GPi (, quantification in D). To explore the effects of DBS on TFEB downstream effectors in humans, we quantified levels of SQSTM1/p62 and MCOLN1 in GPi neurons. Remarkably, the number of SQSTM1 puncta was increased (126 ± 42%), in line with the augmented neuronal viability, while the size of SQSTM1 puncta was significantly decreased by 16 ± 4% in DBS compared to CTRL tissues (, quantification in F, G), indicating the activation of the autophagic-lysosomal pathway. To confirm that the observed differences of SQSTM1 were specific to the GPi, where the stimulation occurred, we also measured SQSTM1 levels in the cortex and found no differences (Figure 3SE, quantifications in F and G), confirming that changes of SQSTM1 levels in PD patients were associated with DBS. We also observed an increase of MCOLN1 (87 ± 20%) in DBS compared to CTRL, in line with TFEB activation upon neuronal stimulation (, quantification in I). Finally, to explore whether DBS induced translocation of TFEB to the nucleus in human brain samples, we quantified TFEB intensity in the nuclei of GPi neurons. Interestingly, we observed a trend, however not significant, toward increased nuclear localization of TFEB in DBS when compared to CTRL samples (Figure S3H, quantification in I).
Figure 5. DBS reduces levels of phospho-MAPT/Tau and increases neuronal viability in PD patients. (A) Immunostaining of phospho-MAPT/Tau with AT8 antibody was performed in the GPi of PD patients who underwent STN stimulation (DBS, right panel; scale bar: 200 μm) or unstimulated controls (CTRL, left panel). Phospho-MAPT/Tau immunostaining is evident in somas (yellow arrows) and neurites (white arrow heads). (B) Quantification of AT8 immunostaining demonstrated about 100% decrease of phospho-MAPT/Tau positive somas in DBS patients compared to CTRL (n = 3; two-tailed unpaired t-test, ***p < 0.001). (C) Significant decrease, 0,3 ± 0,03 U/mL (-25 ± 3%), of phospho-MAPT/Tau Thr231 quantified by ELISA test in DBS-treated PD patients compared to CTRL (n = 3; two-tailed unpaired t-test, *p < 0.05). (D) A 5,12 ± 0,8/mm2 (+43 ± 7%) increased number of neurons was measured in DBS compared to CTRL GPi (n = 3; two-tailed unpaired t-test, *p < 0.05). (E) Immunostaining of SQSTM1/p62 in GPi of PD controls (CTRL, upper panels) and DBS (lower panels; scale bars: 100 μm; higher magnification: 25 μm). Higher magnification panels (right) show a 126 ± 42% increased number of SQSTM1 puncta (quantification in F; n = 3; two-tailed unpaired t-test, *p < 0.05), and a 16 ± 4% decreased size of puncta area (μm2) in DBS-stimulated neurons compared to control (quantification in G; n = 3; two-tailed unpaired t-test, *p < 0.05). (H, I) Immunofluorescence showing increased levels of MCOLN1 (+87 ± 20%) in the GPi of DBS-treated PD patients compared to CTRL (n = 3; two-tailed unpaired t-test, *p < 0.05; scale bar: 100 μm).
All together, these experiments provide evidence that synaptic stimulation ameliorates pathological MAPT/Tau accumulation and could enhance TFEB nuclear residence in DBS-implanted patients.
Discussion
In our study, we find for the first time that synaptic activity promotes the previously observed degradation of pathological MAPT/Tau [Citation15] via TFEB, a master regulator of autophagy and lysosomal biogenesis, by promoting its nuclear translocation and hence transcriptional activity. Pathological buildup of proteins in neurons is a common feature of several degenerative diseases, including AD, FTD and PD, and it is associated with alterations in autophagy and lysosomal degradation activity [Citation39]. In AD, endo-lysosomal dysfunction is concomitant with an accumulation of Aβ and MAPT/Tau [Citation40–42]. Specifically, autophagosome perturbation is observed with higher levels of oligomeric MAPT/Tau [Citation43], one of the most toxic forms [Citation44,Citation45], which are associated with pre-symptomatic AD and synapse pathology [Citation3,Citation46,Citation47]. Consistent with the possibility of a functional relationship between pathological MAPT/Tau and autophagic clearance, induction of autophagy has been shown to be protective in models of AD and tauopathies [Citation48–50]; however, in this scenario autophagy induction might lead to even higher autophagosome accumulation [Citation39]. Indeed, it was demonstrated that in the hippocampus of AD patients, induction of autophagy still occurs, while lysosomal activity is progressively reduced, thus causing a block to autophagy [Citation51]. Therefore, an AD treatment strategy aimed at enhancing both the autophagy flux and lysosomal biogenesis could in principle be more promising than simply inducing autophagy. Since TFEB coordinately regulates both processes, manipulation of its activation could achieve such a goal [Citation19,Citation52]. Our data are consistent with existing evidence indicating that TFEB promotes autophagic and lysosomal clearance of hyperphosphorylated and misfolded MAPT/Tau in an FTD mouse model [Citation23] and, more recently, of Aβ in a mouse model of beta-amyloidosis [Citation53]. Protective effects of TFEB, such as accelerated clearance of pathological aggregates, were also demonstrated in models of neurodegenerative diseases in which TFEB is activated by treatment with trehalose [Citation24,Citation54]; in addition, it was recently shown that TFEB mediates protective effects against MAPT/Tau pathology by promoting lysosomal exocytosis and clearance of cellular MAPT/Tau [Citation55].
A clear sign that synaptic stimulation promotes not only autophagy but also lysosomal degradation via TFEB is the increase that we report of transcripts for both the early autophagy regulator Sqstm1/p62, and the lysosomal v-ATPase subunits ATP6V1H, ATP6V1D and ATP6V0D1 in stimulated Tg cultured neurons. These data are confirmed by increased subunit ATP6V0D1 protein expression both in vitro, and in DBS-stimulated 3xTg-AD mice. Importantly, we find that not only ATP6V0D1 is increased, but also more localized to lysosomes than in unstimulated 3xTg-AD mice. This result might underscore a TFEB-mediated restoration of lysosomal functionality together with our previous evidence showing normalization of lysosomal cathepsin-D maturation [Citation15]. In support of our interpretation, it was demonstrated that misrouting of v-ATPase V0 subunit (V0a1) is responsible for loss of lysosomal acidification in neurons of a mouse model of a lysosomal storage disease [Citation56]. Furthermore, in neurons of AD patients, lysosomes have been shown to possess an increased size and levels of lysosomal proteins, including LAMP1 and cathepsin-D, a finding consistent with altered degrading activity/accumulation of substrates [Citation57,Citation58]. Our data suggest that normalization of lysosomal dimensions and LAMP1 levels could occur in patients subjected to DBS, in line with our previous data [Citation15], and that it is likely to occur via TFEB activation.
We find that acute synaptic stimulation does not change TFEB transcript (Figure S1K) and protein () levels in cultured neurons, and that chronic DBS does not change total TFEB levels in 3xTg-AD mice (). Thus, stimulation is likely to make use of the existing pool of TFEB to regulate lysosomal homeostasis controlled by MTOR. Indeed, we observe that TFEB nuclear translocation is associated with an inhibition of MTORC1, with reduced levels of phospho-EIF4EBP1 and phospho-RPS6 in stimulated neurons. Considering that DBS is likely to chronically stimulate TFEB nuclear translocation, we propose that DBS might retune the MTOR-TFEB homeostatic circuits to continuously provide neurons with new and efficient autophagosomes and lysosomes, to actively counteract age- and MAPT/Tau-induced clearance dysfunctions.
There is little knowledge on the detailed mechanism by which synaptic activity inhibits MTOR and induces TFEB. In previous studies it has been shown that NMDA receptor activation resulted in dephosphorylation of the MAPK (p44/42 mitogen-activated protein kinase) which resulted in inhibition of MTOR activity [Citation59]. In line with these studies, we have found that levels of phospho-MAPK are increased in 3xTg-AD mice compared to control. DBS treatment reduced levels of phospho-MAPK in 3xTg-AD mice, indicating a consequent dampening MTOR activity and TFEB activation (, quantification in B). We also considered that TFEB might have been dephosphorylated by PPP3/calcineurin [Citation60] via the Ca2+ influx through the NMDA receptor during gLTP. Blockade of PPP3/calcineurin in cultured neurons by treatment with cyclosporine A (CsA) did not prevent TFEB dephosphorylation during gLTP (Figure S4A, quantification in B, a trend very close to statistical significance, p = 0.052), indicating that the main source of TFEB dephosphorylation might be MTOR inhibition. Of note, activation of PPP3/calcineurin at synapses has been demonstrated to induce NMDA receptor endocytosis via dephosphorylation at Tyr1472 [Citation61]; this event would be in contrast with the NMDA-induced excitatory post-synaptic current induced by the gLTP protocol [Citation62].
DBS is a therapeutic strategy successfully used to treat several neurological and psychiatric diseases. DBS of the fornix was demonstrated to be a safe procedure in AD patients, providing promising results including increased cerebral glucose metabolism and better outcomes in cognition, memory, and quality of life [Citation13,Citation63,Citation64]. As of now, there are no tissues from fornix DBS-operated AD patients available for histological studies (Dr. Lozano, personal communication); however, STN-DBS treatment has long been approved for PD patients and DBS-treated brain samples can be found. Intriguingly, there is increasing evidence of the presence of MAPT/Tau pathology in PD [Citation36,Citation37,Citation65], which has been associated with altered axonal transport, synapse dysfunction, and neuronal toxicity [Citation38,Citation66]. Concerning the subjects included in our study, we have found that both samples from PD control patients as well as PD-DBS patients had an associated tauopathy. Indeed, we detected the presence of pathological MAPT/Tau accumulation in the cortex of all PD patients analyzed, irrespective of DBS treatment (Figure S3A, quantification in B). MAPT/Tau pathology was not clinically suspected nor was it thought to contribute to the clinical picture, and there were no medical records reporting concurrent AD in the analyzed patients; therefore, the observed MAPT/Tau pathology had to be considered part of PD itself. In this study, the investigation of these PD patients could validate findings of our in vitro and in vivo models and provide us with important information on the beneficial effects of chronic synaptic stimulation against MAPT/Tau pathology. As an initial assessment, we analyzed tissues of DBS-stimulated PD patients and, for the first time to our knowledge, we confirmed that pathological MAPT/Tau reduction observed in our in vitro and in vivo models also occurred in humans. Importantly, we also observed neuroprotection, which was reported as well in AD and PD experimental models [Citation67,Citation68]. Of note, we also observed a trend for increased nuclear localization of TFEB. It is highly probable that the non-significance of the last outcome is due to the limited number of subjects included in our study, and their variability due to the different stages of the disease and years with DBS. However, this outcome is important since it was reported that in PD TFEB translocation into the nucleus was reduced by alpha-synuclein, which was retaining TFEB in the cytoplasm [Citation69]. Thus, stimulation might contribute to restore correct nuclear TFEB levels. In support of TFEB activation upon DBS, we found that levels of MCOLN1 and the number of SQSTM1 puncta were increased in DBS compared to CTRL tissues, in accordance with increased expression of Mcoln1 and Sqstm1/p62 upon stimulation and increased neuronal viability. However, the same SQSTM1 puncta were reduced in size, consistent with a possible improvement in the autophagic flux, previously reported by our group [Citation15]. The increase of MCOLN1 is also of particular interest, as it was recently reported that TFEB-mediated clearance of toxic MAPT/Tau by lysosomal exocytosis occurs via MCOLN1 [Citation55]. In agreement with our observations, it was previously demonstrated that in some DBS-treated AD patients, the hippocampal volume was maintained, preventing further neurodegeneration and, most importantly, in some other DBS-AD cases the hippocampal volume was even increased one year after surgery [Citation70]. The cellular mechanism that might explain this last observation could be activation of neurogenesis within the hippocampus, which was measured in DBS stimulated AD mice [Citation16].
Interestingly, STN-DBS was demonstrated to promote activation of neurons in GPi of PD patients [Citation71]. In addition, studies on parkinsonian monkeys provided evidence for antidromic activation of GPi neurons during STN-DBS [Citation72]. On the other hand, STN-DBS was also shown to decrease firing rates of neurons near to the stimulation site [Citation73,Citation74], and to reduce altered firing patterns occurring in STN and GPi by activation of inhibitory afferents [Citation75]. Therefore, it has been suggested that DBS might act by dissociating inputs and outputs in the stimulated area, thus correcting abnormal signals generated in pathological conditions [Citation76].
Overall, the data presented here demonstrate that neuronal stimulation activates TFEB to promote autophagic-lysosomal biogenesis, with a positive effect for clearance of pathological MAPT/Tau and neuronal survival. We believe that normalization of synaptic activity in Alzheimer disease or other tauopathies would produce beneficial effects and neuroprotection, and that TFEB could be a crucial molecular target that could be modulated to achieve these positive outcomes. Our study provides a clear rationale for the use of synaptic stimulation, by DBS or similar strategies and/or pharmacologic activation of TFEB, for future treatment of AD and tauopathies in general.
Materials and methods
Mouse models
Triple transgenic model of AD, 3xTg-AD [Citation77], and background strain wild-type male mice (C57BL/6/129SVJ; The Jackson Laboratory) were bred and maintained at the Toronto Western Research Institute.
Heterozygous male PS19 transgenic mice [Citation27] were obtained from Jackson Laboratory (008169), and bred with female B6C3F1/N wild-type mice to produce wild-type and Tg cultured neurons (Charles RIVER Laboratories, St-Germain-sur-l’Arbresle, France). Mice and cultured neurons were genotyped following the protocol provided by Jackson Laboratory: https://www.jax.org/Protocol?stockNumber=008169&protocolID=34005
All animal procedures were conducted in strict compliance with the guidelines of the Canadian Council on Animal Care, the recommendations of the EU Directive 2010/63/EU for animal experiments, and were approved by the Toronto Western Research Institute Animal Care Committee (Canada) and the Ministry of National Education and Research (France).
Surgical procedure for electrode implantation and DBS protocol
Eighteen 3xTg-AD and ten wild-type male mice were anesthetized with isoflurane during the whole electrode implantation process. Mice were bilaterally implanted with concentric bipolar tungsten electrodes into the entorhinal cortex; details of surgery and stimulation protocols can be found in [Citation16]. Non-stimulated (NS) mice received electrode implants without stimulation (sham groups). At 7 months of age mice were anesthetized and perfused with saline solution, followed by either: perfusion with 4% paraformaldehyde solution (immunofluorescence analyses), or brain removal and liquid nitrogen freezing (biochemical analyses).
Antibodies
From Thermo Fisher Scientific: phospho-MAPT/Tau (AT8, Ser202, and Thr205; MN1020; IHC), MCOLN1/TRPML1 (OSR00050W; IF), anti-mouse (31,430; WB) and anti-rabbit (31,460; WB) HRP-conjugated; from Molecular Probes, Life Technologies: Alexa Fluor 488 (A11029; IF), 568 (A11011; IF), and 647 (AP194SA6, and A21447; IF); from BioLegend: HA (901,513; IF), CAMK2/CaM Kinase II (688,602; WB); from Millipore: LAMP1 (MABC39; IF and WB), phospho-CAMK2/CaM Kinase II (Thr286; 05–533; WB), T22 (MAPT/Tau oligomers, ABN454-I; IF, DB), phospho-TFEB (Ser142, ABE1971-I; WB, IF); from Cell Signaling Technology: phospho-RPS6 (Ser240/244; 5364; IF), phospho-EIF4EBP1 (Ser65; 9451; WB), EIF4EBP1 (9644; WB), histone H3 (4499; WB), phospho-TFEB (Ser211; 37,681; WB), phospho-MAPK (Thr202/Tyr204; 9101; WB), MAPK (9102; WB); from Bethyl Laboratories: TFEB (A303-673A; WB, IF); from Alomone Labs: MCOLN1/TRPML1 (ACC-081; WB); from Abcam: GFP (ab13970; IF); from Sigma-Aldrich: TFE3 (HPA023881; IF), ACTB/β-actin (A5316; WB), TUBB/β-tubulin (T8660; WB) HA (11,867,423,001; IF); from Novus Biologicals: ATP6V0D1 (NBP1-88,893; IF, WB), ATP6V1H (NBP1-85,668; WB), ATP6V1D (catalog number NBP1-88,895; WB), SQSTM1/p62 (H00008878-M01; WB); from PROGEN Biotechnik GmbH: SQSTM1/p62 (GP62-C; IHC); from Vector Laboratories Inc: biotinylated anti-mouse (BA-2000; IHC) and biotinylated anti-Guinea pig (BA-7000; IHC); from ImmunoJackson Research: Alexa Fluor 488 (711–545-152; IF).
Primary neuronal cultures and treatments
Primary neurons were prepared as previously described [Citation15]. Neurons were plated on poly-D-lysine coated glass coverslips (Electron Microscopy Sciences, 72,196–12) fitting 24-well plates for immunofluorescence (Falcon, 353,047); Petri dishes (100 mm) for western blot (Falcon, 353,003); and glass bottomed dishes (35 mm) for live imaging (Ibidi, 81,158). Neurons were maintained in Neurobasal medium (Thermo Fisher Scientific, 21,103–049) containing penicillin/streptomycin (Thermo Fisher Scientific, 15,140–122), B27 supplement (Thermo Fisher Scientific, 17,504–044) and glutamine (Thermo Fisher Scientific, 25,030–081) and used at 14 days in vitro (DIV).
Synaptic stimulation consisted of a glycine-induced activation of synaptic (but not extra-synaptic) NMDA receptors mimicking long-term potentiation, named in the text “gLTP”. Briefly, neurons were pre-treated for 1 h with tetrodotoxin (1 µM; Tocris, 1069) to reduce endogenous synaptic activity. For PPP3/calcineurin inhibition, neurons were also pre-treated for 30 min with cyclosporine A (20 µM; Millipore, 239,835), while for MTOR inhibition, neurons were also pre-treated for 2 h with torin1 (250 nM; Tocris, 4247). After pre-treatment, neurons were washed to remove the tetrodotoxin and stimulated for 15 min with 200 µM glycine (g, Sigma-Aldrich, G7126) in a specific buffer (LTP), as described [Citation28,Citation62], and chased without glycine for 1 h. In experiments inhibiting PPP3/calcineurin or MTOR, cyclosporine A or torin1 were kept during the 15 min stimulation and the following 1 h chase. In experiments assessing TFEB translocation to the nucleus, the time of chase without glycine was 25 min. Finally, neurons were collected for western blot or fixed with methanol for immunofluorescence.
Plasmids and transfection
The plasmid encoding full-length TFEB-GFP has previously been described [Citation20]. Plasmids pRK5-HA GST RRAGCS75L and pRK5-HA GST RRAGCQ120L were a kind gift from D. Sabatini (Addgene, 19,305 and 19,306). Murine TFEB-siRNA was provided by Dharmacon (L-050607-02-0020). Transfection of cultured neurons was performed at 12 DIV using Lipofectamine 3000 kit (Thermo Fisher Scientific, L3000-001) according to the manufacturer’s instructions. Transfected neurons were then treated and imaged at 14 DIV.
Primers, RNA extraction and quantitative RT-PCR
MCLN1-FGCGCCTATGACACCATCAA
MCLN1-RTATCCTGGCACTGCTCGAT
ATP6V0D1-FGCATCTCAGAGCAGGACCTTGA
ATP6V0D1-RGGATAGGACACATGGCATCAGC
ATP6V1H-FGTTGCTGCTCACGATGTTGGAG
ATP6V1H -RTGTAGCGAACCTGCTGGTCTTC
ATP6V1D-FAGGAGCACAGACTGGTCGAAAC
ATP6V1D-RCTCAGCCAATGAGAAGGCAGCT
SQSTM1-FGAAGCTGCCCTATACCCACA
SQSTM1-RTGGGAGAGGGACTCAATCAG
TCFEB-FGCAGAAGAAAGACAATCACAACC
TCFEB-RGCCTTGGGGATCAGCATT
β2-microglobulin-FACCGGCCTGTATGCTATCCAGAAA
β2-microglobulin-RTTGGATTTCAATGTGAGGCGGGTG
CyclophA-FGGCAAATGCTGGACCAAACACAA
CyclophA-RGTAAAATGCCCGCAAGTCAAAAG
RNA was obtained from cultured neurons using the AllPrep RNA/Protein Kit (Qiagen, 80,404) according to the manufacturer’s instructions. cDNA was synthesized using QuantiTect Reverse Transcription kit (Qiagen, 205,311). Real-time quantitative RT-PCR on cDNAs was carried out using the Power SYBR Green Master Mix (Applied Biosystems, 4,367,659) and the qRT-PCR machine Applied Biosystems 7300 Real Time PCR System with the following protocol: 95°C, 5 min; (95°C, 10s; 60°C, 10s; 72°C, 15s) x 40. Melting curve analyses were performed to verify the amplification specificity. B2M/β2-microglobulin or PPIA/cyclophilin A were used as internal controls to normalize the variability in expression levels. All primers were provided by Invitrogen Custom Primers. Relative quantification of gene expression was performed according to the 2(-ΔΔCT) method.
Fractionation nuclei-cytoplasm
Nucleus/cytoplasmic cell fractionation was performed as described in [Citation78].
Briefly, the first step consisted of the preparation of the Triton X-100 lysis buffer containing: 50 mM Tris-HCl (Sigma-Aldrich, PHG0002), pH 7.5, 0.5% Triton X-100 (Sigma-Aldrich, X100-100ML), 137.5 mM NaCl (Sigma-Aldrich, S5886), 10% glycerol (Sigma-Aldrich, G5516), 5 mM EDTA (Sigma-Aldrich, ED-100 G), protease and phosphatase inhibitors (Santa Cruz Biotechnology, sc-24,948).
Neurons were washed twice and then collected in ice-cold PBS (biowest, MS00ZY1002) and centrifuged at 1400 x g for 5 min at 4°C. Pellets were resuspended in 250 µl of Triton X-100 lysis buffer and were left under mild agitation at 4°C for 15 min. Tubes were centrifuged for 15 min at 15.700 x g at 4°C. Supernatants (cytoplasmic portion) were transferred to new microcentrifuge tubes.
The nuclear pellets were washed 3 times with 250 µl of lysis buffer, were resuspended with 50 µl of lysis buffer supplemented with 0.5% SDS, and were sonicated three times. Finally, samples were centrifuged for 15 min at 15,700 x g at 4°C; the supernatants (nuclear fraction) were transferred to new microcentrifuge tubes. Finally, protein quantifications were made, followed by western blot analyses.
Live-cell imaging
Neurons were grown on poly-D-lysine-coated 35-mm glass-bottomed dishes for live imaging (Ibidi, 81158). Neurons were transfected with the plasmid encoding human full-length TFEB-GFP for 48 h, and then imaged in 37°C LTP buffer at steady state or during activation with glycine using a 5% CO2 chamber and a confocal microscope Leica SP8 with a 60x water-immersion objective. For each transfected-neuron imaged, frames were automatically and sequentially acquired, starting with a first acquisition at time 0 min, and then every 3 min for a total time of 18 min (7 frames total). Three dishes from each culture were analyzed and two to three neurons per dish were imaged. During quantification, different thresholds were used to quantify fluorescence in the cytoplasm or in the nucleus, because the signal from nuclear TFEB-GFP was overall higher than that from the cytoplasm.
Immunofluorescence quantification
After treatments, neurons were washed in ice-cold PBS and fixed in −20°C-cold methanol for 5 min. Fixed neurons and mouse brain sections were immunostained and imaged as previously described [Citation15]. Hoechst 33,342 reagent (Life Technologies, H3570) was used to stain nuclei and thus to determine the area within to measure TFE3 fluorescence intensity, as shown in Figure S1A, B. Primary neurons were cultured on coverslips in 24-well plates. For each coverslip two to five frames, each of them containing one to four neurons, were taken. For brain sections, five Tg-S mice, five Tg-NS mice, and four WT-NS mice were analyzed; two sections per mouse were used (duplicate) and four to six frames per section were taken. Frames were selected depending on the morphology of neurons and tissues, avoiding damaged neurons or damaged areas on the section. The experimenter was blinded to the group allocation.
Icy software (Quantitative Image Analysis Unit at Institut Pasteur, http://www.bioimageanalysis.org/) was used for quantitative analysis of fluorescence. The intensity threshold was set to remove background fluorescence. To quantify immunofluorescence, mean fluorescence intensity per field was measured. Number of puncta and puncta area were automatically measured using the plugin “spot detector” on images with pre-set thresholds; quantified puncta were objects of ~3 pixels in size and above.
Quantification of colocalization was determined using specific plugins (free and downloadable) developed for the Icy software: images corresponding to each channel of acquisition (ch00, and ch01) were opened in Icy. The plugin “Wavelet Spot Detector Block” was used to threshold each image, to detect bright spots and to transmit the information to the plugin “Connected Components”, which extracted all pixels different to the given background value. Finally, the plugin “Colocalization studio” collected inputs from “Connected Components” for ch00 and ch01 and determined colocalization of pixels from ch00 and ch01 within a maximum radius of 5 pixels (in our acquired images 1pixel = 100 nm). The experimenter was blinded to the group allocation.
Western blotting
Western blots analyses were performed as previously described [Citation15]. Neurons were lysed in RIPA buffer containing protease and phosphatase inhibitors (Santa Cruz Biotechnology, sc-24,948). Protein concentration was measured for each lysate by Pierce BCA protein assay kit (Thermo Scientific, 23225). Fifteen micrograms of proteins were loaded for each cultured neuron lysate; 30 µg of proteins were loaded for each mouse hippocampus lysate (four Tg-S mice, four Tg-NS mice, and three WT-NS and three WT-S). Blots were revealed with a Bio-Rad Gel and Blot Imaging System ChemiDoc XRS+, which was set to reveal saturated pixels. Images with saturated pixels were not used for quantification. Scion Image software (NIH) was used to quantify bands. As indicated in the quantification graphs, each band was normalized to ACTB/β-actin levels, except for phosphorylated proteins, which were normalized to their respective total protein levels, and nuclear and cytoplasmatic fractions of TFEB that were normalized to histone H3 and TUBB/β-tubulin levels, respectively. The experimenter was blinded to the group allocation.
ELISA
Quantification of human MAPT/Tau phosphorylated at residue Thr231 in PD-GPi samples was assessed with the Invitrogen ELISA Kit Human Tau [pT231] (Thermo Fisher Scientific, KHB8051), following the manufacturer’s instructions. The experimenter was blinded to the group allocation.
Dot blot
Lysed Tg cultured neurons (2 µL) were blotted onto dry nitrocellulose membrane (Thermo Scientific, 88013) and allowed to dry for 15 min. The membrane was rinsed with PBS 0.05% Tween 20 (Sigma-Aldrich, P1379) and then blocked in 5% milk for 1 h. The membrane was then incubated in primary antibody overnight in cold room under mild agitation. The membrane was then washed three times with PBS 0.05% Tween 20 and then incubated with secondary antibody for 1 h at room temperature. The membrane was finally washed three times with PBS 0.05% Tween 20 and then revealed as for western blots.
PD cases
Free-floating 40-µm thickness brain sections of the basal ganglia, including the GPi, of six PD patients (three having received DBS and three without DBS treatment; see below for details on patients) were obtained from Rush University, Chicago, IL. Sections were conserved in storage solution at −20°C.
Table 1. Demographics and severity of the PD control and PD DBS groups. UPDRS: Unified Parkinson’s Disease Rating Scale; H&Y: Hoehn and Yahr Scale.
Immunohistochemistry for human brain sections
An immunohistochemistry analysis was carried out in large sections that included basal ganglia (GPi, external Globus Pallidus – GPe, and Putamen) and adjacent cortex among other regions to determine AT8 and SQSTM/p62 expression in the GPi. Due to the very limited amount of section available, only one section containing the GPi per case was used for each antibody. For that purpose, formalin-fixed 40-µm sections were rinsed with 0.1 M phosphate buffer (PB, sodium phosphate monobasic [Sigma-Aldrich, S0751], sodium phosphate dibasic [Sigma-Aldrich, S9763]), before performing antigen retrieval with sodium citrate buffer (10 mM; pH 6.0) at 80°C during 30 min (letting the solution rest for another 30 min). Then, sections were incubated with 3% H2O2 for 30 min and subsequently, blocked with 4% bovine serum albumin (BSA; Sigma- Aldrich, A-7906) in 0.1 M TBS (50 mM Tris-Cl, pH 7.6, 150 mM NaCl) with 0.02% Triton X-100 during 1 h. Sections were then incubated with the specific primary antibody AT8 or SQSTM1 overnight at 4°C. Incubation with the corresponding secondary biotinylated antibody horse-anti mouse or goat-anti Guinea pig (Vector Laboratories, BA-2001, BA-7000-1.5), respectively was then carried out for 1 h, followed by Avidin Biotin Peroxidase Complex (ABC complex; Vector Laboratories, PK-6100) incubation during 30 min. Finally, AT8 and SQSTM1 immunostaining was revealed by 3,3´diaminobenzidine (DAB; Vector Laboratories, SK-4100). In the case of AT8, after DAB, cells were labeled with Nissl staining. For both antibodies, sections were mounted in gelatin-coated 75x51-mm large slices, and mounted with DPX (Sigma-Aldrich, 44581) after air-dry dehydration.
Immunofluorescence for human brain sections
An immunofluorescence analysis was performed on 40 µm floating sections to determine the intensity of MCOLN1 and the presence of TFEB in the nucleus of neurons in the GPi. Briefly, tissue sections were firstly washed in 0.1 M PB, followed by antigen retrieval with sodium citrate buffer (Sigma-Aldrich, W302600, 10 mM; pH 6) incubated at 80°C for 30 min (letting the solution rest for another 30 min). Sections were blocked with 4% BSA in TBS with 0.02% Triton X, followed by primary antibody incubation with rabbit anti-MCOLN1/TRPML1 (Thermo Fisher Scientific, OSR00050W) or rabbit anti-TFEB (Bethyl Laboratories, A303-673A) overnight at 4°C. Secondary antibody Alexa Fluor 488 donkey-anti rabbit (ImmunoJackson Research, 711–545-152) was used to visualize the labeling. Then, autofluorescence eliminator reagent was applied following manufacturer’s instructions (Millipore, 2160). Finally, nuclei were labeled with DAPI (Sigma-Aldrich, S7113).
Image acquisition and processing for human brain sections
Images were acquired with a Zeiss LSM800 confocal microscope and Zen 2.6 software. Brightfield AT8, Nissl and SQSTM1 images were taken with tile scanning option that provided large images of the whole section (Figure S3). Visualization of the whole section allowed for the precise localization of the GPi. Fluorescence MCOLN1, TFEB and DAPI images were taken from previously dissected GPi, taking for each section 3–4 same size random fields within the GPi. Image processing was performed with Image J/Fiji software. For analysis of the complete GPi area, we collected as many same-size images (1725 µm x1725 µm) as possible in order to scan the maximum amount of GPi surface available. Two to seven images out of one section were analyzed per case per antibody. Brightfield AT8/Nissl images were processed following the method previously described [Citation79]. Briefly, Nissl and AT8 staining channels were split in two individual images by using hematoxylin-eosin and DAB deconvolution option. Regions of Interest (ROIs were drawn all over the GPi of the Nissl image in order to count the total number of cells). Next, the same ROIs were mapped into the AT8 image to determine the number of AT8-immunopositive (AT8+) cells. Subsequently, the ratio (or percentage) of AT8+ over the total number of cells was calculated. Additionally, the area of each ROI was measured in order to establish the density of both total cells and AT8+ cells. AT8+ neurites per mm2 were quantified in DAB deconvoluted images, dividing the sum of all positive neurites by the analyzed area. Brightfield SQSTM1 puncta density and mean area were quantified as follows. ROI images were converted to 8-bit image, thresholded for background removal, and number of particles were quantified. The mean of the number of puncta of each ROI divided by the area of the ROI represented the density of SQSTM1 particles per area and the mean area of the puncta was calculated by dividing the sum of the areas of each puncta by the number of puncta. Fluorescence DAPI and TFEB channels were split in two individual fluorescence images to create nuclear ROIs out of the DAPI image. These ROIs were mapped into the TFEB image where the TFEB intensity was quantified for each ROI. MCOLN1 intensity was quantified from individual fields. Image acquisition and processing were done by a single observer and in a blind manner, to reduce any experimental and/or bias error at maximum level.
Statistical analysis
Sample numerosity (n) for mouse experiment is as follows: in experiments including mouse brain slices, n of 1 represents each set of slices belonging to one mouse brain. For lysates, n of 1 is a hippocampal preparation from a single mouse. For primary neurons, a set of cultures prepared from one mouse embryo is considered as n of 1. As such, multiple coverslips prepared from a single mouse embryo were considered replicates of a n of 1. To reach n = 3 to 6, corresponding preparations of cultured neurons were realized. Individual values and mean ± standard error of mean (SEM) are shown in graphs. The Shapiro-Wilk test was applied to all data set before statistical analyses indicating a normal distribution. As indicated in figure legends, statistical comparisons and p value determination were performed using two-tailed unpaired t-tests, repeated measures ANOVA or one-way ANOVA with significance placed at p < 0.05. When appropriate, Dunnett’s or Tukey’s multiple comparison post-hoc tests were conducted to determine significance of differences among groups. We did not perform an a priori power analysis since our sample sizes were similar to those reported in previously published papers [Citation15,Citation80]. Statistical analyses were performed using GraphPad Prism 7.0 (GraphPad Software, San Diego, CA, USA).
Supplemental Material
Download Zip (75.5 MB)Acknowledgments
Authors would like to thank for their important help: Dr. Cindy Degerny; Dr Magali Dumont, Dr. Patrik Brundin; Dr. David Sabatini; Dr. Juan Carlos Chara; Ms. Julia Orban; Ms. Emmanuelle Berthaux; Ms. Beatrice Moreau; Ms. Marie-Claude Martel, Ms. Phoebe Kim Ashley-Norman; Dr. Thomas Falguières; Dr. Yaping Chu; Mr. Scott Muller; Mr. Francesco Lavezzari, the Analytical and High-Resolution Microscopy in Biomedicine Service for technical and human support provided by the SGIker facility (UPV/EHU/ ERDF, EU). The authors acknowledge the Institut Professeur Baulieu for financial support to DT, AB and YA, the Basque Government (IT1203-19; ELKARTEK KK-2020/00034), University of the Basque Country (UPV/EHU), CIBERNED, MICINN (PID2019-109724RB-I00) to ECZ, FZ, LZD and CM, AIRC (IG 2017 n.20661) and Italian Ministery of University and Research (grant PRIN2020CLZ5XWTV) to TV.
Disclosure statement
Authors declare that the research was conducted in the absence of any potential conflict of interest.
Supplementary material
Supplemental data for this article can be accessed online at https://doi.org/10.1080/15548627.2022.2095791
Correction Statement
This article has been corrected with minor changes. These changes do not impact the academic content of the article.
Additional information
Funding
Related Research Data
References
- Bayer TA, Wirths O. Intracellular accumulation of amyloid-beta - a predictor for synaptic dysfunction and neuron loss in Alzheimer's disease. Front Aging Neurosci. 2010;2:1–10.
- Gouras GK, Tampellini D, Takahashi RH, et al. Intraneuronal beta-amyloid accumulation and synapse pathology in Alzheimer’s disease. Acta Neuropathol. 2010;119:523–541.
- Tai HC, Serrano-Pozo A, Hashimoto T, et al. The synaptic accumulation of hyperphosphorylated tau oligomers in Alzheimer disease is associated with dysfunction of the ubiquitin-proteasome system. Am J Pathol. 2012;181:1426–1435.
- Coleman PD, Yao PJ. Synaptic slaughter in Alzheimer’s disease. Neurobiol Aging. 2003;24:1023–1027.
- DeKosky ST, Scheff SW. Synapse loss in frontal cortex biopsies in Alzheimer’s disease: correlation with cognitive severity. Ann Neurol. 1990;27:457–464.
- Terry RD, Masliah E, Salmon DP, et al. Physical basis of cognitive alterations in Alzheimer’s disease: synapse loss is the major correlate of cognitive impairment. Ann Neurol. 1991;30:572–580.
- Reiman EM, Chen K, Alexander GE, et al. Functional brain abnormalities in young adults at genetic risk for late-onset Alzheimer’s dementia. Proc Natl Acad Sci U S A. 2004;101:284–289.
- Sperling RA, Laviolette PS, O’Keefe K, et al. Amyloid deposition is associated with impaired default network function in older persons without dementia. Neuron. 2009;63:178–188.
- O’Brien JL, O’Keefe KM, LaViolette PS, et al. Longitudinal fMRI in elderly reveals loss of hippocampal activation with clinical decline. Neurology. 2010;74:1969–1976.
- Coomans EM, Schoonhoven DN, Tuncel H, et al. In vivo tau pathology is associated with synaptic loss and altered synaptic function. Alzheimers Res Ther. 2021;13:35.
- Ramirez AE, Pacheco CR, Aguayo LG, et al. Rapamycin protects against Abeta-induced synaptotoxicity by increasing presynaptic activity in hippocampal neurons. Biochim Biophys Acta. 2014;1842:1495–1501.
- Tampellini D, Rahman N, Gallo EF, et al. Synaptic activity reduces intraneuronal Abeta, promotes APP transport to synapses, and protects against Abeta-related synaptic alterations. J Neurosci. 2009;29:9704–9713.
- Lam J, Lee J, Liu CY, et al. Deep brain stimulation for alzheimer’s disease: tackling circuit dysfunction. Neuromodulation. 2021;24:171–186.
- Tampellini D. Synaptic activity and Alzheimer’s disease: a critical update. Front Neurosci. 2015;9:423.
- Akwa Y, Gondard E, Mann A, et al. Synaptic activity protects against AD and FTD-like pathology via autophagic-lysosomal degradation. Mol Psychiatry. 2018;23:1530–1540.
- Mann A, Gondard E, Tampellini D, et al. Chronic deep brain stimulation in an Alzheimer’s disease mouse model enhances memory and reduces pathological hallmarks. Brain Stimul. 2018;11:435–444.
- Klionsky DJ, Abdel-Aziz AK, Abdelfatah S, etal. Guidelines for the use and interpretation of assays for monitoring autophagy. Autophagy. 2021;17(1):1–382.
- Napolitano G, Ballabio A. TFEB at a glance. J Cell Sci. 2016;129(13):2475–2481.
- Settembre C, Di Malta C, Polito VA, et al. TFEB links autophagy to lysosomal biogenesis. Science. 2011;332:1429–1433.
- Settembre C, Zoncu R, Medina DL, et al. A lysosome-to-nucleus signalling mechanism senses and regulates the lysosome via mTOR and TFEB. EMBO J. 2012;31:1095–1108.
- Sardiello M, Palmieri M, Di Ronza A, et al. A gene network regulating lysosomal biogenesis and function. Science. 2009;325:473–477.
- Becot A, Pardossi-Piquard R, Bourgeois A, et al. The transcription factor EB reduces the intraneuronal accumulation of the beta-secretase-derived app fragment C99 in cellular and mouse Alzheimer’s Disease models. Cells. 2020;9:1204.
- Polito VA, Li H, Martini-Stoica H, et al. Selective clearance of aberrant tau proteins and rescue of neurotoxicity by transcription factor EB. EMBO Mol Med. 2014;6:1142–1160.
- Rusmini P, Cortese K, Crippa V, et al. Trehalose induces autophagy via lysosomal-mediated TFEB activation in models of motoneuron degeneration. Autophagy. 2019;15:631–651.
- Nalls MA, Pankratz N, Lill CM, et al. Large-scale meta-analysis of genome-wide association data identifies six new risk loci for Parkinson’s disease. Nat Genet. 2014;46:989–993.
- Lei P, Ayton S, Finkelstein DI, et al. Tau deficiency induces parkinsonism with dementia by impairing APP-mediated iron export. Nat Med. 2012;18:291–295.
- Yoshiyama Y, Higuchi M, Zhang B, et al. Synapse loss and microglial activation precede tangles in a P301S tauopathy mouse model. Neuron. 2007;53:337–351.
- Ehlers MD. Activity level controls postsynaptic composition and signaling via the ubiquitin-proteasome system. Nat Neurosci. 2003;6:231–242.
- Martina JA, Diab HI, Lishu L, et al. The nutrient-responsive transcription factor TFE3 promotes autophagy, lysosomal biogenesis, and clearance of cellular debris. Sci Signal. 2014;7:ra9.
- Lisman J, Yasuda R, Raghavachari S. Mechanisms of CaMKII action in long-term potentiation. Nat Rev Neurosci. 2012;13:169–182.
- Rabanal-Ruiz Y, Otten EG, Korolchuk VI, et al. mTORC1 as the main gateway to autophagy. Essays Biochem. 2017;61:565–584.
- Guertin DA, Sabatini DM. The pharmacology of mTOR inhibition. Sci Signal. 2009;2:24. pe.
- Sancak Y, Peterson TR, Shaul YD, et al. The Rag GTPases bind raptor and mediate amino acid signaling to mTORC1. Science. 2008;320:1496–1501.
- Napolitano G, Di Malta C, Esposito A, et al. A substrate-specific mTORC1 pathway underlies Birt-Hogg-Dube syndrome. Nature. 2020;585:597–602.
- Stone SS, Teixeira CM, Devito LM, et al. Stimulation of entorhinal cortex promotes adult neurogenesis and facilitates spatial memory. J Neurosci. 2011;31:13469–13484.
- Jellinger KA. Interaction between alpha-synuclein and tau in Parkinson’s disease comment on Wills et al.: elevated tauopathy and alpha-synuclein pathology in postmortem Parkinson’s disease brains with and without dementia. Exp Neurol. 2011; 227: 13-8 2010;225:210–218
- Moussaud S, Jones DR, Moussaud-Lamodiere EL, et al. Alpha-synuclein and tau: teammates in neurodegeneration? Mol Neurodegener. 2014;9:43.
- Zhang X, Gao F, Wang D, et al. Tau Pathology in Parkinson’s Disease. Front Neurol. 2018;9:809.
- Djajadikerta A, Keshri S, Pavel M, et al. Autophagy induction as a therapeutic strategy for neurodegenerative diseases. J Mol Biol. 2019;432:2799–2821.
- Cataldo AM, Petanceska S, Terio NB, et al. Abeta localization in abnormal endosomes: association with earliest Abeta elevations in AD and down syndrome. Neurobiol Aging. 2004;25:1263–1272.
- Ihara Y, Morishima-Kawashima M, Nixon R. The ubiquitin-proteasome system and the autophagic-lysosomal system in Alzheimer disease. Cold Spring Harb Perspect Med. 2012;2:2–27.
- Maxfield FR. Role of endosomes and lysosomes in human disease. Cold Spring Harb Perspect Biol. 2014;6:a016931.
- Hamano T, Gendron TF, Causevic E, et al. Autophagic-lysosomal perturbation enhances tau aggregation in transfectants with induced wild-type tau expression. Eur J Neurosci. 2008;27:1119–1130.
- Brunden KR, Trojanowski JQ, Lee VM. Evidence that non-fibrillar tau causes pathology linked to neurodegeneration and behavioral impairments. J Alzheimers Dis. 2008;14:393–399.
- Marx J. Alzheimer’s disease. A new take on tau. Science. 2007;316:1416–1417.
- Maeda S, Sahara N, Saito Y, et al. Increased levels of granular tau oligomers: an early sign of brain aging and Alzheimer’s disease. Neurosci Res. 2006;54:197–201.
- Spires-Jones TL, Hyman BT. The intersection of amyloid beta and tau at synapses in Alzheimer’s disease. Neuron. 2014;82:756–771.
- Schaeffer V, Goedert M. Stimulation of autophagy is neuroprotective in a mouse model of human tauopathy. Autophagy. 2012;8:1686–1687.
- Caccamo A, Ferreira E, Branca C, et al. p62 improves AD-like pathology by increasing autophagy. Mol Psychiatry. 2016;22:865–873.
- Ejlerskov P, Ashkenazi A, Rubinsztein DC. Genetic enhancement of macroautophagy in vertebrate models of neurodegenerative diseases. Neurobiol Dis. 2019;122:3–8.
- Bordi M, Berg MJ, Mohan PS, et al. Autophagy flux in CA1 neurons of Alzheimer hippocampus: increased induction overburdens failing lysosomes to propel neuritic dystrophy. Autophagy. 2016;12:2467–2483.
- Menzies FM, Fleming A, Caricasole A, et al. Autophagy and Neurodegeneration: pathogenic Mechanisms and Therapeutic Opportunities. Neuron. 2017;93:1015–1034.
- Zheng X, Lin W, Jiang Y, et al. Electroacupuncture ameliorates beta-amyloid pathology and cognitive impairment in Alzheimer disease via a novel mechanism involving activation of TFEB (transcription factor EB). Autophagy. 2021;17(11):1–15.
- Sarkar S, Davies JE, Huang Z, et al. Trehalose, a novel mTOR-independent autophagy enhancer, accelerates the clearance of mutant huntingtin and alpha-synuclein. J Biol Chem. 2007;282:5641–5652.
- Xu Y, Du S, Marsh JA, et al. TFEB regulates lysosomal exocytosis of tau and its loss of function exacerbates tau pathology and spreading. Mol Psychiatry. 2021;26:5925–5939.
- Bagh MB, Peng S, Chandra G, et al. Misrouting of v-ATPase subunit V0a1 dysregulates lysosomal acidification in a neurodegenerative lysosomal storage disease model. Nat Commun. 2017;8:14612.
- Hassiotis S, Manavis J, Blumbergs PC, et al. Lysosomal LAMP1 immunoreactivity exists in both diffuse and neuritic amyloid plaques in the human hippocampus. Eur J Neurosci. 2018;47:1043–1053.
- Piras A, Collin L, Gruninger F, et al. Autophagic and lysosomal defects in human tauopathies: analysis of post-mortem brain from patients with familial Alzheimer disease, corticobasal degeneration and progressive supranuclear palsy. Acta Neuropathol Commun. 2016;4:22.
- Burket JA, Benson AD, Tang AH, et al. NMDA receptor activation regulates sociability by its effect on mTOR signaling activity. Prog Neuropsychopharmacol Biol Psychiatry. 2015;60:60–65.
- Medina DL, Di Paola S, Peluso I, et al. Lysosomal calcium signalling regulates autophagy through calcineurin and TFEB. Nat Cell Biol. 2015;17:288–299.
- Snyder EM, Nong Y, Almeida CG, et al. Regulation of NMDA receptor trafficking by amyloid-beta. Nat Neurosci. 2005;8:1051–1058.
- Lu W, Man H, Ju W, et al. Activation of synaptic NMDA receptors induces membrane insertion of new AMPA receptors and LTP in cultured hippocampal neurons. Neuron. 2001;29:243–254.
- McKinnon C, Gros P, Lee DJ, et al. Deep brain stimulation: potential for neuroprotection. Ann Clin Transl Neurol. 2018;6:174–185.
- Jakobs M, Lee DJ, Lozano AM. Modifying the progression of Alzheimer’s and Parkinson’s disease with deep brain stimulation. Neuropharmacology. 2020;171:107860.
- Wills J, Jones J, Haggerty T, et al. Elevated tauopathy and alpha-synuclein pathology in postmortem Parkinson’s disease brains with and without dementia. Exp Neurol. 2010;225:210–218.
- Muntane G, Dalfo E, Martinez A, et al. Phosphorylation of tau and alpha-synuclein in synaptic-enriched fractions of the frontal cortex in Alzheimer’s disease, and in Parkinson’s disease and related alpha-synucleinopathies. Neuroscience. 2008;152:913–923.
- Musacchio T, Rebenstorff M, Fluri F, et al. Subthalamic nucleus deep brain stimulation is neuroprotective in the A53T alpha-synuclein Parkinson’s disease rat model. Ann Neurol. 2017;81:825–836.
- Leplus A, Lauritzen I, Melon C, et al. Chronic fornix deep brain stimulation in a transgenic Alzheimer’s rat model reduces amyloid burden, inflammation, and neuronal loss. Brain Struct Funct. 2019;224:363–372.
- Decressac M, Mattsson B, Weikop P, et al. TFEB-mediated autophagy rescues midbrain dopamine neurons from alpha-synuclein toxicity. Proc Natl Acad Sci U S A. 2013;110:E1817–26.
- Sankar T, Chakravarty MM, Bescos A, et al. Deep brain stimulation influences brain structure in Alzheimer’s Disease. Brain Stimul. 2015;8:645–654.
- Reese R, Leblois A, Steigerwald F, et al. Subthalamic deep brain stimulation increases pallidal firing rate and regularity. Exp Neurol. 2011;229:517–521.
- Moran A, Stein E, Tischler H, et al. Dynamic stereotypic responses of basal ganglia neurons to subthalamic nucleus high-frequency stimulation in the parkinsonian primate. Front Syst Neurosci. 2011;5:21.
- Filali M, Hutchison WD, Palter VN, et al. Stimulation-induced inhibition of neuronal firing in human subthalamic nucleus. Exp Brain Res. 2004;156:274–281.
- Welter ML, Houeto JL, Bonnet AM, et al. Effects of high-frequency stimulation on subthalamic neuronal activity in parkinsonian patients. Arch Neurol. 2004;61:89–96.
- Dostrovsky JO, Lozano AM. Mechanisms of deep brain stimulation. Mov Disord. 2002;17(3):S63–8.
- Chiken S, Nambu A. Mechanism of deep brain stimulation: inhibition, excitation, or disruption? Neuroscientist. 2016;22:313–322.
- Oddo S, Caccamo A, Shepherd JD, et al. Triple-transgenic model of Alzheimer’s disease with plaques and tangles: intracellular Abeta and synaptic dysfunction. Neuron. 2003;39:409–421.
- Settembre C, Medina DL. TFEB and the CLEAR network. Methods Cell Biol. 2015;126:45–62.
- Crowe AR, Yue W. Semi-quantitative determination of protein expression using Immunohistochemistry staining and analysis: an integrated protocol. Biol Protoc. 2019;9:1–11.
- Tampellini D, Capetillo-Zarate E, Dumont M, et al. Effects of synaptic modulation on {beta}-amyloid, synaptophysin, and memory performance in Alzheimer’s Disease transgenic mice. J Neurosci. 2010;30:14299–14304.