
ABSTRACT
Endoplasmic reticulum stress is an emerging significant player in the molecular pathology of connective tissue disorders. In response to endoplasmic reticulum stress, cells can upregulate macroautophagy/autophagy, a fundamental cellular homeostatic process used by cells to degrade and recycle proteins or remove damaged organelles. In these scenarios, autophagy activation can support cell survival. Here we demonstrated by in vitro and in vivo approaches that megakaryocytes derived from col6a1−⁄− (collagen, type VI, alpha 1) null mice display increased intracellular retention of COL6 polypeptides, endoplasmic reticulum stress and apoptosis. The unfolded protein response is activated in col6a1−⁄− megakaryocytes, as evidenced by the upregulation of molecular chaperones, by the increased splicing of Xbp1 mRNA and by the higher level of the pro-apoptotic regulator DDIT3/CHOP. Despite the endoplasmic reticulum stress, basal autophagy is impaired in col6a1−⁄− megakaryocytes, which show lower BECN1 levels and reduced autophagosome maturation. Starvation and rapamycin treatment rescue the autophagic flux in col6a1−⁄− megakaryocytes, leading to a decrease in intracellular COL6 polypeptide retention, endoplasmic reticulum stress and apoptosis. Furthermore, megakaryocytes cultured from peripheral blood hematopoietic progenitors of patients affected by Bethlem myopathy and Ullrich congenital muscular dystrophy, two COL6-related disorders, displayed increased apoptosis, endoplasmic reticulum stress and impaired autophagy. These data demonstrate that genetic disorders of collagens, endoplasmic reticulum stress and autophagy regulation in megakaryocytes may be interrelated.
Abbreviations: 7-AAD: 7-amino-actinomycin D; ATF: activating transcriptional factor; BAX: BCL2 associated X protein; BCL2: B cell leukemia/lymphoma 2; BCL2L1/Bcl-xL: BCL2-like 1; BM: bone marrow; COL6: collagen, type VI; col6a1−⁄−: mice that are null for Col6a1; DDIT3/CHOP/GADD153: DNA-damage inducible transcript 3; EGFP: enhanced green fluorescent protein; ER: endoplasmic reticulum; reticulophagy: endoplasmic reticulum-selective autophagy; HSPA5/Bip: heat shock protein 5; HSP90B1/GRP94: heat shock protein 90, beta (Grp94), member 1; LAMP2: lysosomal associated membrane protein 2; MAP1LC3B/LC3B: microtubule-associated protein 1 light chain 3 beta; Mk: megakaryocytes; MTOR: mechanistic target of rapamycin kinase; NIMV: noninvasive mechanical ventilation; PI3K: phosphoinositide 3-kinase; PPP1R15A/GADD34: protein phosphatase 1, regulatory subunit 15A; RT-qPCR: reverse transcription-quantitative real-time PCR; ROS: reactive oxygen species; SERPINH1/HSP47: serine (or cysteine) peptidase inhibitor, clade H, member 1; sh-RNA: short hairpin RNA; SOCE: store operated calcium entry; UCMD: Ullrich congenital muscular dystrophy; UPR: unfolded protein response; WIPI2: WD repeat domain, phosphoinositide-interacting 2; WT: wild type; XBP1: X-box binding protein 1.
Introduction
The endoplasmic reticulum (ER) is a large dynamic organelle which exerts different functions for the cell including protein synthesis and folding, calcium storage and lipid metabolism. Alterations in these functions can lead to unfolded or misfolded proteins to accumulate in the ER activating the ER stress response. To restore homeostasis and normal ER function, cells can activate the unfolded protein response (UPR), a well-defined process aimed at increasing the ER protein folding capacity [Citation1,Citation2]. This is accomplished by the activation of specific transcription factors involved in the upregulation of genes coding for chaperones and proteins functioning in protein secretion, lipid biosynthesis or cell death programs. Although moderate UPR activation might assist in cell homeostasis restoration and cell survival, prolonged UPR signaling is associated with cell death, mainly through DDIT3/CHOP (DNA-damage inducible transcript 3), a transcription factor involved in apoptotic signals [Citation3,Citation4]. To counteract the detrimental effects of excessive UPR signaling, cells can rely on autophagy [Citation4,Citation5].
Autophagy is a fundamental catabolic process deputed to the degradation of aggregated proteins, damaged organelles or pathogens by engulfing them in phagophores that mature into double-membrane vesicles (autophagosomes) which then fuse with lysosomes [Citation6]. The proper activation of autophagy, particularly in conditions of cell stress, is essential to maintain cell survival. However, a fine balance between autophagy repression and activation is indispensable for cell homeostasis, as pointed out by its alteration in different disease conditions [Citation7].
Collagens are the most abundant proteins in mammals, representing a superfamily of proteins sharing a common triple helical basic structure which is synthesized and assembled in the ER [Citation8,Citation9]. As a consequence of inefficient folding, physiologically a high fraction of newly synthesized collagen is degraded intracellularly prior to secretion [Citation10,Citation11]. This phenomenon is significantly amplified in case of genetic mutations of collagens or of the specific chaperone SERPINH1/HSP47 (serine (or cysteine) peptidase inhibitor, clade H, member 1) [Citation9,Citation11]. COL6/collagen VI (collagen, type VI) is a unique member of the collagen superfamily, with a distinctive supramolecular assembly and diverse biochemical and cytoprotective functions [Citation12]. COL6 is encoded by six genes (COL6A1-COL6A6 in humans) and is formed by the assembly of three different polypeptide α-chains, thus giving rise to COL6A1/α1(VI)-COL6A2/α2(VI)-COL6A3/α3(VI) triple-helical monomers, in which COL6A3/α3(VI) can be substituted by either COL6A4/α4(VI), COL6A5/α5(VI) or COL6A6/α6(VI) [Citation12]. Targeted inactivation of the Col6a1 gene in mice (col6a1−⁄−) results in the prevention of assembly and secretion of the entire COL6 [Citation13]. The col6a1−⁄− mouse model has helped to unveil many of the in vivo roles of COL6 and to elucidate important pathological mechanisms involved in COL6-related disorders. Mutations of COL6 in humans lead to a broad spectrum of diseases mainly involving the muscular and nervous systems [Citation14]. These disorders include Bethlem myopathy, Ullrich congenital muscular dystrophy (UCMD), congenital myosclerosis, and early-onset isolated dystonia. Structural and functional alterations of the mitochondria and sarcoplasmic reticulum have been identified in myofibers of col6a1−⁄− mice and of patients affected by COL6-related disorders [Citation15]. Defects in the regulation of the autophagic pathway characterize these cells, which cannot degrade the damaged organelles, leading to spontaneous apoptosis [Citation16]. An increased activation of the MTOR pathway, a key negative regulator of the initiation of autophagy, has been observed in col6a1−⁄− myofibers, and treatment with the MTOR inhibitor rapamycin, a well-known autophagy inducer, ameliorated myofiber defects [Citation16]. These pathological alterations have been also found in other cells and tissues [Citation12,Citation17,Citation18]. We recently demonstrated that both human and mouse megakaryocytes (Mks), the platelet progenitors, express, assemble and secrete the three major COL6 chains [Citation19]. Platelets derived from col6a1−⁄− mice and patients affected by COL6-related disorders display a hyperactivation tendency due an increase in the expression and function of the store operated calcium entry (SOCE), a ubiquitous mechanism guiding calcium influx upon ER calcium store depletion. We have shown that platelets inherit this alteration from Mks, and bone marrow (BM) transplantation experiments indicated the cell-autonomous nature of this defect [Citation19].
In this study, we show that genetic alterations of COL6 have a major impact on intracellular processes, causing ER stress, abnormal regulation of autophagy and apoptosis in Mks and platelets derived from the col6a1−⁄− mouse model and from Bethlem myopathy and UCMD patients. These data indicate that the Mk/platelet compartment should be considered when determining the best management of patients affected by COL6-related disorders.
Results
Endoplasmic reticulum stress in col6a1−⁄− Mks
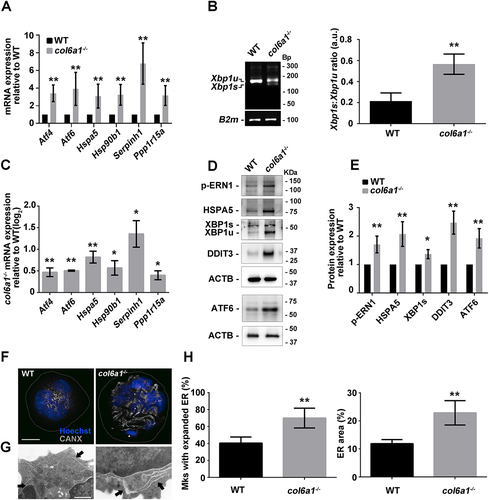
We studied whether alterations in COL6 synthesis affect ER protein synthesis homeostasis. RT-qPCR analysis of the UPR pathway in Mks cultured in vitro or directly sorted from BM samples revealed that col6a1−⁄− cells display an upregulation of the mRNAs coding for ATF4 (activating transcription factor 4) and ATF6, PPP1R15A/GADD34 (protein phosphatase 1, regulatory subunit 15A), HSPA5/Bip (heat shock protein 5), HSP90B1/GRP94 (heat shock protein 90, beta (Grp94), member 1), and the collagen-specific chaperone SERPINH1/HSP47 (serine (or cysteine) peptidase inhibitor, clade H, member 1), and an increase in the splicing of the transcript coding XBP1 (X-box binding protein 1) when compared to wild type (WT) cells (). These data were confirmed by western blot analysis of UPR key regulators. In addition, col6a1−⁄− Mks were characterized by a marked increase in the protein levels of DDIT3/CHOP (), a transcription factor, directly linked to PPP1R15A activation, which contributes to cell death signal activation in unresolved chronic ER stress [Citation4]. UPR induction causes alterations in the structure of the ER to increase the protein folding capacity [Citation20]. Cultured col6a1−⁄− Mks displayed a dilated ER, a typical hallmark of ER stress, as revealed by confocal and transmission electron microscopy (). The same morphological aberrations were confirmed by directly staining Mks obtained from col6a1−⁄− BM biopsies (Fig. S1).
Figure 1. Endoplasmic reticulum stress in col6a1−⁄− Mks. (A) RT-qPCR quantification of the mRNA levels for different UPR markers of in vitro differentiated WT and col6a1−⁄− Mks. Values for WT Mks were arbitrarily set to 1. Data are expressed as mean ± SD (n = 7). (B) PCR analysis of Xbp1 mRNA splicing in WT and col6a1−⁄− Mks. Quantification of the spliced (Xbp1s) vs. unspliced (Xbp1u) transcript forms is shown in the right panel. B2m (beta-2 microglobulin) transcript was used as a loading control. Data are expressed as mean ± SD (n = 3). (C) RT-qPCR quantification of the UPR signature in BM-sorted WT and col6a1−⁄− Mks. Levels of the different transcripts are shown as relative to WT Mks. Data are expressed as mean ± SD (n = 3). (D and E) Western blotting for key transcription factors and molecular chaperones of the UPR in WT and col6a1−⁄− Mks. ACTB/β-actin was used as a loading control. Densitometric quantifications, normalized on ACTB, are shown in panel E. Values for WT Mks were arbitrarily set to 1. Data are expressed as mean ± SD (n = 4). (F) Representative images of confocal microscopy for the ER marker CANX (gray) in WT and col6a1−⁄− Mks. Nuclei were counterstained with Hoechst (blue). Scale bar: 20 μm. (G) Transmission electron micrograph showing enlarged ER in col6a1−⁄− Mks but not in WT (black arrows). Scale bar: 500 nm. (H) Percentage of Mks with expanded ER (left panel) and percentage of ER area coverage (right panel), as quantified from confocal microscopy images. A minimum of 40 Mks per sample was analyzed. Data are expressed as mean SD (n = 4). *, P < 0.05; **, P < 0.01; a.u., arbitrary units.
COL6 intracellular accumulation in col6a1−⁄− Mks
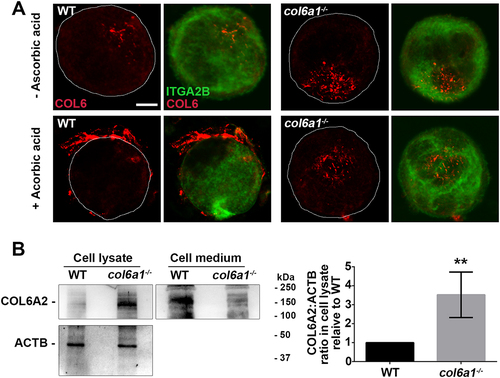
Compared to WT, col6a1−⁄− Mks, cultured in the presence of ascorbic acid, were not able to secrete COL6, which was not detectable in the culture medium or in close proximity to the cell membrane. In addition, we analyzed the presence of COL6 inside Mks by confocal microscopy with a polyclonal antibody directed against COL6 and by western blot with a monoclonal antibody directed against the α2 chain of COL6. These experiments showed a markedly increased intracellular retention of COL6 chains in col6a1−⁄− with respect to WT Mks ().
Figure 2. Intracellular COL6 accumulation in col6a1−⁄− Mks. (A) Confocal microscopy immunofluorescence of WT and col6a1−⁄− Mks stained with a polyclonal antibody for COL6 (AS72, red) and with a monoclonal antibody for ITGA2B/CD41 (green). Where indicated, Mks were grown for 48 h in the presence of 50 μg/mL ascorbic acid. Scale bar: 10 μm. (B) Western blotting for the COL6A2/α2(VI) chain in cell lysates and cell culture media of WT and col6a1−⁄− Mks cultured for 48 h in the presence of 50 μg/mL ascorbic acid. ACTB/β-actin was used as a loading control. The right panel shows densitometric quantification, normalized on ACTB. Values for WT Mks were arbitrarily set to 1. Data are expressed as mean ± Standard Deviation (SD) (n = 4). **, P < 0.01. a.u., arbitrary units.
Defective basal autophagy activation in col6a1−⁄− Mks
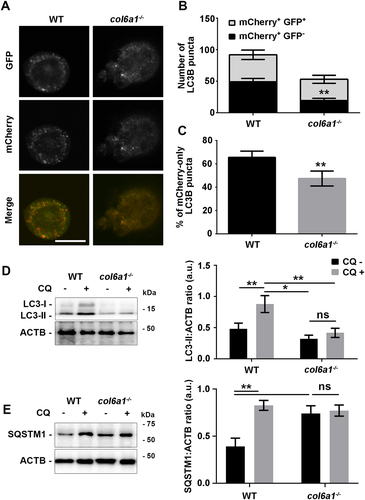
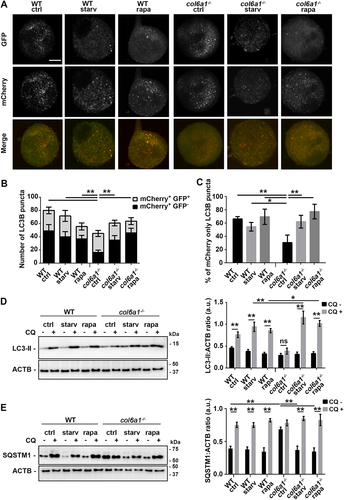
To gain insights into the autophagy activation status, Mks were transfected with a mCherry-EGFP-LC3B reporter plasmid. This construct allows distinguishing between autophagosomes (mCherry+ EGFP+) and late autophagic structures resulting from the fusion of the autophagosomes with lysosomes, namely autolysosomes, in which EGFP disruption occurs due to the lysosome-dependent acidification of the vesicle lumen (mCherry+ EGFP–). Col6a1−⁄− Mks displayed reduced autophagy initiation, as shown by total number of LC3B puncta, the number of WIPI2 puncta and BECN1 (beclin 1, autophagy related) protein levels () and Fig. S2, A-C). In addition, col6a1−⁄− Mks displayed reduced autophagosome maturation, as demonstrated by the lower number of mCherry+ EGFP – LC3B puncta and by the lower percentage of mCherry+-only puncta, indicative of an attenuated basal autophagic flux ()). These data were confirmed by treating Mks with the lysosome inhibitor choloroquine, followed by western blot analysis of LC3B and SQSTM1/p62 turnover ().
Figure 3. Insufficient basal autophagy activation in col6a1−⁄− Mks. (A) Representative confocal microscopy images of WT and col6a1−⁄− Mks expressing the tandem mCherry-EGFP-LC3B construct in standard culture conditions. Scale bar: 50 μm. (B) Quantification of the number of LC3B puncta per cell area. (C) Quantification of the percentage of mCherry-only positive puncta in WT and col6a1−⁄− Mks. A minimum of 40 Mks per sample was analyzed. Data are expressed as mean ± SD (n = 7). (D) Western blotting of LC3B lipidation (LC3-II) in WT and col6a1−⁄− Mks. Where indicated, Mks were treated for 4 h with 50 μM of the lysosome inhibitor chloroquine (CQ). ACTB/β-actin was used as a loading control. Densitometric quantification of the LC3-II:ACTB ratio is shown in the right panel. Data are expressed as mean ± SD (n = 4). (E) Western blotting of SQSTM1/p62 accumulation-degradation in WT and col6a1−⁄− Mks. Where indicated, Mks were treated for 4 h with 50 μM of the lysosome inhibitor chloroquine (CQ). ACTB was used as a loading control. Densitometric quantification of the SQSTM1:ACTB ratio is shown in the right panel. Data are expressed as mean ± SD (n = 4). *, P < 0.05; **, P < 0.01; a.u., arbitrary units.
Col6a1−⁄− mouse Mks and platelets display increased apoptosis
To study whether the induction of UPR and the alterations in basal autophagic flux impact Mk apoptosis, we determined the apoptosis/necrosis rate by staining WT and col6a1−⁄− Mks with ANXA5/annexin V and 7-amino-actinomycin D (7-AAD). Both in vitro and in vivo, a higher percentage of col6a1−⁄− Mks underwent apoptosis (ANXA5/annexin V+ 7-AAD–), culminating in a higher percentage of necrotic Mks (ANXA5/annexin V+ 7-AAD+) (), and Fig. S3A). These data were confirmed by the increased ratio of the pro-apoptotic protein BAX vs. the anti-apoptotic proteins BCL2 and BCL2L1/Bcl-xL [Citation21] in col6a1−⁄− Mks with respect to WT ()). A higher percentage of peripheral blood platelets in col6a1−⁄− mice were ANXA5/annexin V+ ()), with increased ratio of BAX vs. BCL2 and BCL2L1/Bcl-xL ()) as compared to WT. Consequently, in vivo platelets from col6a1−⁄− mice were cleared prematurely in the peripheral blood, with a t1/2 reduction of approximately 30% (from approx. 60 h to 40 h), as revealed by tracking the in vivo survival of biotin-labeled platelets (Fig. S3B). To demonstrate whether the observed platelet defect in col6a1−⁄− mice was intrinsic to platelets, we performed reciprocal adoptive transfers by infusing WT platelets in col6a1−⁄− mice, and col6a1−⁄− platelets in WT mice [Citation22]. By this approach, we found that both WT and col6a1−⁄− peripheral blood platelets maintained their original half-lives (Fig. S3C), thus demonstrating that the decreased half-life was intrinsic to platelets and not dependent on environmental factors.
Figure 4. Col6a1−⁄− Mks and platelets display increased apoptosis in vitro and in vivo. (A and B) Representative flow cytometry of WT and col6a1−⁄− BM flushes stained for ITGA2B/CD41, ANXA5/annexin V and 7-AAD. ITGA2B/CD41+ Mks were gated and analyzed for ANXA5/annexin V surface expression and 7-AAD staining. Data are expressed as mean ± SD (n = 5). (C and D) Western blotting for BAX, BCL2 and BCL2L1/Bcl-xL protein levels in WT and col6a1−⁄− Mks. ACTB/β-actin was used as a loading control. Densitometric quantification of the BAX:BCL2L1 ratio (D, left panel) and of the BAX:BCL2 ratio (D, right panel) are shown. Data are expressed as mean ± SD (n = 4). (E and F) Representative flow cytometry for ITGA2B/CD41 and ANXA5/annexin V in peripheral blood platelets from WT and col6a1−⁄− mice. The percentage of ANXA5/annexin V+ ITGA2B/CD41+ platelets is shown in the right panel. Data are expressed as mean ± SD (n = 4). (G H) Western blotting for BAX, BCL2 and BCL2L1/Bcl-xL protein levels in WT and col6a1−⁄− peripheral blood platelets. ACTB/β-actin was used as a loading control. Densitometric quantification of the BAX:BCL2L1 ratio (H, left panel) and of the BAX:BCL2 ratio (H, right panel) are shown. Data are expressed as mean ± SD (n = 3). ***, P < 0.001, **, P < 0.01; *, P < 0.05; a.u., arbitrary units.
Starvation and rapamycin treatments rescue autophagy activation in col6a1−⁄− Mks
Autophagy is regulated by the PI3K-AKT-MTOR pathway, which we recently demonstrated to be hyperactivated in COL6-deficient Mks [Citation19]. To circumvent the decrease in basal autophagy induction and in the autophagic flux displayed by col6a1−⁄− Mks, we performed serum starving and rapamycin treatment, two known stimuli of autophagy [Citation23–25]. Both treatments rescued the activation of the MTOR pathway (Fig. S4) and concomitantly autophagy induction and autophagic flux in col6a1−⁄− Mks, as demonstrated by the total number of LC3B puncta, by the number of mCherry+ EGFP− puncta, and by the percentage of mCherry+-only puncta ()). Blocking lysosome function with chloroquine led to a further increase in LC3B lipidation in col6a1−⁄− Mks with respect to WT, both upon serum starvation and rapamycin treatment (). These treatments rescued also the accumulation of the autophagic substrate SQSTM1/p62 () and induced the formation of WIPI2 puncta in col6a1−⁄− Mks (Fig. S5).
Figure 5. Starvation and rapamycin treatment rescue autophagy activation in col6a1−⁄− Mks. (A) Representative images of confocal microscopy WT and col6a1−⁄− Mks expressing the tandem mCherry-EGFP-LC3B construct unDer Standard culture conditions and upon 4 h serum starvation or 100 nM rapamycin treatment. Scale bar: 10 μm. (B) Quantification of LC3B-tagged puncta per cell area in WT and col6a1−⁄− Mks. (C) Quantification of the percentage of mCherry-only positive puncta in WT and col6a1−⁄− Mks. A minimum of 40 Mks per sample was analyzed. Data are expressed as mean ± SD (n = 4). (D) Western blotting for LC3B lipidation (LC3-II) in WT and col6a1−⁄− Mks unDer Standard culture conditions (ctrl) and upon 4 h serum starvation or 100 nM rapamycin treatment. Where indicated, Mks were treated for 4 h with 50 μM of the lysosome inhibitor chloroquine (CQ). Densitometric quantification of the LC3-II:ACTB ratio is shown in the right panel. Data are expressed as mean ± SD, (n = 4). (E) Western blotting for SQSTM1/p62 accumulation-degradation in WT and col6a1−⁄− Mks unDer Standard culture conditions (ctrl) and upon 4 h serum starvation or 100 nM rapamycin treatment. Where indicated, Mks were treated for 4 h with 50 μM of the lysosome inhibitor chloroquine (CQ). Densitometric quantification of the SQSTM1:ACTB ratio is shown in the right panel. Data are expressed as mean ± SD, (n = 4). *, P < 0.05; **, P < 0.01. n.s., not significant; rapa, rapamycin; starv, serum starvation; a.u., arbitrary units.
Starvation and rapamycin treatments rescue intracellular COL6 retention, ER stress and apoptosis in col6a1−⁄− Mks
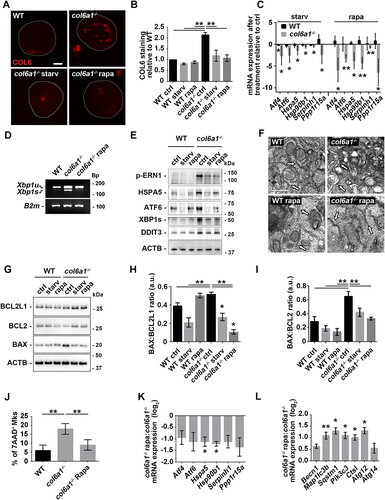
Starvation and rapamycin treatments increased the colocalization of LC3B-positive autophagosomes and of LAMP2-positive lysosomes with the ER in both WT and col6a1−⁄− Mks (), which was followed by a rescue, to WT levels, of the amount of intracellular COL6 retention in col6a1−⁄− Mks, as revealed by confocal microscopy ()). The reduction in intracellular COL6 retention upon starvation and rapamycin treatment was not due to COL6 secretion as demonstrated by western blot analysis of COL6 secreted in the culture media (Fig. S6). This effect was paralleled by a significant reduction of the UPR pathway both at the mRNA and protein levels in BM-derived col6a1−⁄− Mks (). ER morphological alterations were not observed in col6a1−⁄− Mks upon serum starvation and rapamycin treatment as revealed by transmission electron microscopy (). To prove that the rescue in UPR activation upon starvation and rapamycin treatment was due to autophagy activation, we treated Mks with the autophagy inhibitor chloroquine. In the presence of chloroquine, the two treatments failed to normalize the expression of UPR markers (Fig. S7). The effects of serum starvation and rapamycin treatment on autophagy induction and ER stress also had a significant impact on the survival of col6a1−⁄− Mks. Indeed, both flow cytometry analysis of 7-AAD staining and western blot analysis of the ratio of BAX to BCL2 and BCL2L1/Bcl-xL showed a significant reduction in apoptosis and cell death in col6a1−⁄− Mks subjected to serum starvation or rapamycin treatment (). Consistently, in vivo rapamycin treatment determined a significant reduction in ER stress and an induction of autophagy molecular signatures in col6a1−⁄− BM-sorted Mks as compared to their respective non-treated controls ()). As we recently published, in vivo rapamycin administration also induced a significant increase in circulating platelet numbers only in col6a1−⁄− mice, which reached WT levels [Citation19].
Figure 6. ER colocalization with LC3B-positive autophagosomes and LAMP2-positive lysosomes in WT and col6a1−⁄− Mks. (A) Representative confocal laser microscopy images of WT and col6a1−⁄− Mks maintained in standard culture conditions (ctrl) or cultured for 6 h in serum starved conditions (starv) or in the presence of 100 nM rapamycin (rapa), following labeling with anti-LC3B (red) and anti-CANX (green) antibodies. Scale bar: 10 μm. (B) The white line indicates the segment used for line scan analysis of colocalization. The line scan shows colocalization between autophagosomes (LC3B, red line) and the ER (CANX, green line). (C) Quantification of the percentage of CANX-positive ER colocalizing with LC3B. A minimum of 40 Mks per sample was analyzed. Data are expressed as mean ± SD (n = 3). *, P < 0.05. (D) Representative confocal laser microscopy images of WT and col6a1−⁄− Mks cultured as in A, following labeling with anti-LAMP2 (red) and anti-KDEL (green) antibodies. Scale bar: 10 μm. (E) The white line indicates the segment used for line scan analysis of colocalization. The line scan shows colocalization between lysosomes (LAMP2, red line) and the ER (KDEL, green line). (F) Quantification of the percentage of KDEL-positive ER colocalizing with LAMP2. A minimum of 40 Mks per sample was analyzed. Data are expressed as mean ± SD (n = 3). *, P < 0.05.
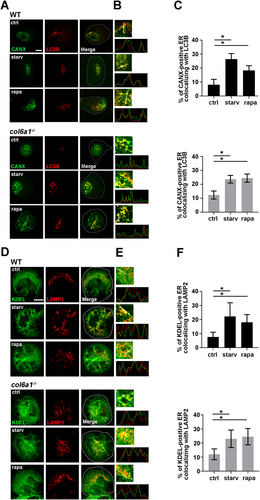
Figure 7. Starvation and rapamycin treatment rescue intracellular COL6 retention, ER stress and apoptosis in col6a1−⁄− Mks. (A and B) Representative confocal microscopy of COL6 immunofluorescence (red) in WT and col6a1−⁄− Mks. Where indicated, col6a1−⁄− Mks were cultured for 6 h in serum-starved conditions or in the presence of 100 nM rapamycin. Staining densities were quantified and expressed relative to WT Mks. Values for WT cells in standard culture conditions were arbitrarily set to 1. Data are expressed as mean ± SD (n = 3). Scale bar: 10 μm. (C) RT-qPCR quantification of the mRNA levels for different UPR markers on in vitro differentiated WT and col6a1−⁄− Mks upon 6 h serum starvation or 100 nM rapamycin treatments. Levels of the different transcripts after serum starvation or rapamycin treatment are expressed relative to standard culture conditions (ctrl). Data are expressed as mean ± SD (n = 3). (D) PCR analysis of Xbp1 spliced (Xbp1s) and unspliced (Xbp1u) transcript isoforms in WT and col6a1−⁄− Mks in the absence or presence of 100 nM rapamycin treatment for 6 h. B2m (beta-2 microglobulin) transcript was used as loading control. (E) Western blotting for key transcription factors and molecular chaperones of the UPR in WT and col6a1−⁄− Mks in standard culture conditions (ctrl) and upon 6 h serum starvation or 100 nM rapamycin treatment. ACTB/β-actin was used as loading control. (F) Transmission electron micrograph showing ER morphology in WT and col6a1−⁄− Mks treated or not with 100 nM rapamycin for 8 h (white arrows). Scale bar: 500 nm. (G) Western blotting for BAX, BCL2 and BCL2L1/Bcl-xL in WT and col6a1−⁄− Mks in standard culture conditions (ctrl) and upon 6 h serum starvation or 100 nM rapamycin treatment. ACTB/β-actin was detected as loading control. The right panels show densitometric quantification of the BAX:BCL2L1 ratio (H) and of the BAX:BCL2 ratio (I). Data are expressed as mean ± SD (n = 3). (J) Percentage of 7-AAD-positive cells, as determined by flow cytometry analysis of 7-AAD staining in WT and col6a1−⁄− Mks treated or not for 48 h with 100 nM rapamycin. Data are expressed as mean ± SD (n = 4). (K and L) RT-qPCR quantification of the UPR and autophagy signatures in BM-sorted Mks obtained from col6a1−⁄− mice maintained unDer Standard housing conditions or following in vivo administration of rapamycin (2 mg/kg body weight) for 14 days. For each transcript, data are given as the ratio of its respective levels in rapamycin-treated vs. untreated mice. Data are expressed as mean ± SD (n = 3). *, P < 0.05; **, P < 0.01; a.u., arbitrary units; rapa, rapamycin; starv, serum starvation.
Increased apoptosis, ER stress and defective autophagy in Mks and platelets derived from patients affected by COL6-related disorders
We differentiated Mks from hematopoietic progenitors derived from the peripheral blood of patients affected by Bethlem myopathy and UCMD, and of healthy subjects. Mks derived from patients showed an increased expression of ER stress markers at both molecular and protein level ()). In addition, confocal microscopy showed a marked dilation of the ER in patient Mks (). Mks derived from patients displayed a reduced number of LC3B puncta both in basal conditions and after lysosome function blockage with chloroquine, when compared to Mks derived from healthy subjects ().
Figure 8. Mks derived from patients affected by COL6-related disorders display increased apoptosis, endoplasmic reticulum stress and defective autophagy. (A) RT-qPCR quantification of the UPR signature in in vitro differentiated Mks derived from healthy subjects (HS) and Bethlem myopathy/UCMD patients (p). Data are expressed as mean ± SD (n = 3 HS; n = 4 P). (B and C) Quantitative capillary-based gel electrophoresis with the indicated antibodies. Representative data are displayed as blots (B) and as quantified peak areas (C) Data are expressed as mean ± SD (n = 3 HS; n = 3 P). 5 F, 1 F and 2 M acronyms refers to patient as described in Fig. S8. (D) Representative images of confocal microscopy analysis of the ER marker KDEL (gray) in Mks derived from healthy subjects (HS) and Bethlem myopathy/UCMD patients (P). Nuclei were counterstained with Hoechst. Scale bar: 10 μm. The percentage of Mks with expanded ER (top panel) and the percentage of ER area coverage (bottom panel), as determined from confocal microscopy analysis, are shown on the right. A minimum of 30 Mks per sample was analyzed. Data are expressed as mean ± SD (n = 3 HS; n = 4 P). (E) Representative confocal microscopy images for LC3B (red) in Mks derived from healthy subjects (HS) and Bethlem myopathy/UCMD patients (P) unDer Standard culture conditions (CQ -) or following treatment for 4 h with 50 μM chloroquine (CQ +). Nuclei were counterstained with Hoechst. Scale bar: 10 μm. The right panel shows the number of LC3B puncta per cell area. Data are expressed as mean ± SD (n = 3 HS; n = 4 P). (F) Percentages of apoptotic and necrotic ITGA2B/CD41+ Mks from healthy subjects (HS) and Bethlem myopathy/UCMD patients (P), as determined by flow cytometry. ITGA2B/CD41+ Mks were gated and analyzed for ANXA5/annexin V surface expression and 7-AAD staining. Data are expressed as mean ± SD (n = 3 HS; n = 4 P). (G) Percentages of apoptotic ITGA2B/CD41+ peripheral blood platelets (Plt) from healthy subjects (HS) and Bethlem myopathy/UCMD (P), as determined by flow cytometry. Data are expressed as mean ± SD (n = 5 HS; n = 5 P). *, P < 0.05; **P < 0.01; n.s., not significant.
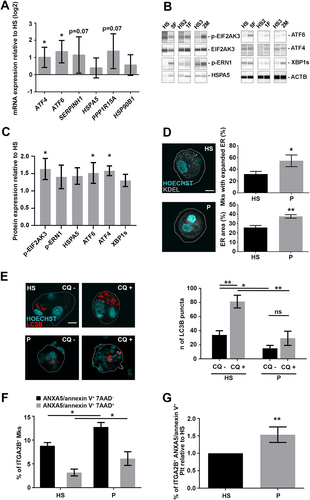
Finally, Mks differentiated from patients displayed increased apoptosis and necrosis when compared to Mks differentiated from healthy control subjects (). The higher apoptosis rate was also present in peripheral blood platelets from patients when compared to healthy subjects ().
Discussion
Mutations of COL6 genes in humans are known to cause a range of inherited muscle diseases, including Bethlem myopathy and UCMD [Citation14]. A number of studies in col6a1−⁄− mice revealed various aspects of the pathophysiological defects affecting skeletal muscles, which include ultrastructural alterations of mitochondria and sarcoplasmic reticulum, latent mitochondrial dysfunction, increased ROS production, and spontaneous apoptosis of myofibers [Citation15,Citation26]. These defects were shown to be the consequence of a failure of the autophagy-lysosome system, which determines the accumulation of damaged organelles in COL6-deficient myofibers [Citation16,Citation27].
In addition to the dominant negative effect exerted in the extracellular matrix, mutant collagens retained in the ER have been shown to induce ER stress and trigger the UPR [Citation9]. The upregulation of the UPR response has been previously demonstrated in muscle biopsies derived from Bethlem myopathy and UCMD patients by a proteomic study [Citation28]. While, despite the intracellular retention of COL6 chains, no differences in mRNA expression of some UPR markers has been observed in dermal fibroblast and muscles derived from mutant col6a3 hypomorphic mice and in human dermal fibroblast treated with COL6A1 shRNA constructs [Citation29,Citation30]. Our in vitro and in vivo data show that Mks derived from col6a1−⁄− mice display ultrastructural alterations of the ER, UPR activation and defective autophagy which lead to apoptosis. The increased apoptosis was observed also in col6a1−⁄− platelets which show a premature clearance from the circulation. Apoptosis has been extensively studied in mouse Mks with the conclusion that, although Mks possess the complete apoptotic machinery, apoptosis does not seem to contribute to the regulation of platelet production [Citation31]. It is still not known how activation or deregulation of apoptotic pathways may lead to Mk and platelet abnormalities in human disease. On the contrary, defective autophagy was correlated to some hematologic diseases, such as myelodysplastic syndromes or leukemias, but its role in platelet formation and Mk function remains to be clarified [Citation32–35].
It is well known that the synthesis, assembly and secretion of COL6 require the association of three different chains in a 1:1:1 stoichiometric ratio, and that in the absence of one α-chain, the other chains cannot undergo assembly and secretion of COL6 [Citation36,Citation37]. Accordingly, it was shown that the lack of α1(VI) in col6a1−⁄− mice prevents COL6 secretion and extracellular matrix (ECM) deposition by fibroblasts, since the other α-chains are still expressed and synthesized but cannot form COL6 assemblies [Citation13]. Interestingly, our data show that col6a1−⁄− Mks display dilated ER, a typical hallmark of ER stress [Citation3,Citation38] and activation of the UPR, which appears to be related to the retention of unfolded collagen chains within the ER, as suggested by the upregulation of the collagen-specific chaperone SERPINH1. In accordance, col6a1−⁄− Mks showed an increased intracellular accumulation of the COL6A2/α2(VI) chain, compared to WT Mks, when cultured in the presence of ascorbic acid, a fundamental cofactor for collagen assembly and secretion [Citation39]. To understand whether ER stress was related to a defect in autophagy, we transfected WT and col6a1−⁄− Mks with an mCherry-EGFP-LC3B reporter plasmid [Citation40] and found that col6a1−⁄− Mks have both reduced autophagy initiation and defective autophagosome maturation when compared to WT Mks.
Autophagy is regulated by the PI3K-AKT-MTOR pathway [Citation41], which is known to be hyperactivated in COL6-deficient skeletal muscles, thus contributing to the defective autophagy [Citation16]. In a recent paper we found that col6a1−⁄− Mks display increased activation of the PI3K-AKT-MTOR pathway [Citation19]. The defective autophagy observed in col6a1−⁄− Mks may be at the basis of the unresolved ER stress indicated by the upregulation of the key pro-apoptotic regulator DDIT3/CHOP. In agreement with this, here we show that in vitro treatment with the MTOR inhibitor rapamycin rescued autophagy activation in col6a1−⁄− Mks and resolved both ER stress and apoptosis. These data were further confirmed in vivo, as Mks sorted from the BM of col6a1−⁄− mice, treated with rapamycin, displayed a significant reduction in UPR activation and an increased autophagy molecular signature. Recently, it has been demonstrated that misfolded collagen molecules are cleared from the ER through CANX (calnexin)-RETREG1/FAM134B-mediated reticulophagy [Citation42]. Proteomic analysis demonstrated that, among the proteins accumulated in canx and retreg1 knockout cells, COL6 peptides were the most represented [Citation42].
In agreement with the data obtained with the col6a1−⁄− mouse model, we found that Mks derived from Bethlem myopathy and UCMD patients display enlarged ER, UPR activation and defective autophagosome maturation. Both Mks and platelets from patients displayed increased apoptosis. Finally, the Bethlem myopathy and UCMD patients we studied presented a mild bleeding tendency suggesting a defect in platelet functionality [Citation19]. Some studies and case reports have described hemostatic abnormalities and platelet function defects in patients affected by heritable connective tissue disorders, such as collagenopathies [Citation43–45]. Further studies, in larger patient populations, are needed to establish whether COL6-related myopathies may have increased risk of bleeding. However, these data represent the first evidence of a link between genetic disorders of collagens, ER stress and autophagy in Mks. These data should be taken into consideration when determining the long-term management of patients affected by congenital muscle diseases caused by mutations in the COL6-encoding genes, such as Bethlem myopathy and UCMD.
Materials and methods
Reagents and antibodies
EZ-Link™ Sulfo-NHS-Biotin (Thermo Fisher Scientific, 21217); PE-conjugated streptavidin (Biolegend, 405204); rapamycin (LC laboratories, R-5000); Chloroquine (Sigma, C6628); FITC-ANXA5/annexin V and 7AAD (Biolegend, 640922); pDest-mCherry-EGFP-LC3B plasmid was a gift from the Terje Johansen lab (University of Tromsø, Norway) [Citation46]; Precision Plus protein standard (Bio-Rad, 1610374); Low DNA mass ladder (Invitrogen, 10068013). Rabbit polyclonal antiserum against COL6 (AS72) was a kind gift from A. Colombatti (CRO Aviano National Cancer Institute, Italy); rabbit polyclonal anti-TUBB1/β1 tubulin was kindly supplied by J. Italiano (Harvard Medical School, USA); Alexa Fluor-conjugated secondary antibodies (Invitrogen, A-11005, A-11034, A-21442, A-11001); horseradish peroxidase-conjugated secondary antibody (Bio-Rad, 1706515, 1,706516). The following commercial antibodies were used: rat monoclonal anti-ITGA2B/CD41 (BioLegend, 133903, RRID: AB_1626237; 133906, RRID:AB_2129745); rabbit polyclonal anti-HSPA5/Bip (Cell Signaling Technology, 3183, RRID:AB_2119843); mouse monoclonal anti-CANX/calnexin (Abcam, ab22595, RRID:AB_2069006); mouse monoclonal anti-SQSTM1/p62 (Abcam, ab56416, RRID:AB_945626); rabbit polyclonal anti-XBP1 (Santa Cruz Biotechnology, sc-7160, RRID:AB_794171); mouse monoclonal anti-DDIT3/CHOP (Cell Signaling Technology, 2895, RRID:AB_2089254); rabbit polyclonal anti-ERN1/IRE1 (phospho S724; Abcam, ab104157, RRID:AB_11158767); rabbit polyclonal anti-BCL2L1/Bcl-xL (Cell Signaling Technology, 2762S, RRID:AB_10694844); rabbit polyclonal anti-BAX (Cell Signaling Technology, 2772, RRID:AB_329921); mouse monoclonal anti-BCL2 (Santa Cruz Biotechnology, sc-7382, RRID:AB_626736); rabbit polyclonal anti-LC3B (Cell Signaling Technology, 2775, RRID:AB_915950); mouse monoclonal anti-COL6A2/α2(VI) chain (Santa Cruz Biotechnology, sc-374566, RRID:AB_10991101); mouse monoclonal anti-ACTB/β-actin (Sigma, A1978, RRID: AB_476692); rabbit polyclonal anti-BECN1/beclin 1 (Cell Signaling Technology, 3738, RRID:AB_490837); mouse monoclonal anti-KDEL (Abcam, ab12223, RRID:AB_298945); mouse monoclonal anti-WIPI2 antibody (Abcam, ab105459, RRID:AB_10860881); Guinea pig polyclonal anti-SQSTM1/p62 antibody (Progen, GP62-C, RRID:AB_2687531); mouse monoclonal anti-ATF6 antibody (Novus NBP1-40256, RRID:AB_2058774); rabbit monoclonal anti-ATF4 antibody (Cell Signaling Technology, 11815, RRID:AB_2616025); rabbit monoclonal anti-EIF2AK3/PERK (Thr980; Cell Signaling Technology, 3179, RRID:AB_2095853); rabbit monoclonal anti-EIF2AK3/PERK antibody (Cell Signaling Technology, 3192, RRID:AB_2095847); mouse monoclonal anti-LAMP2 antibody (Thermo Fisher Scientific, MA1-205-A647, RRID: AB_2688320).
Cell cultures
Mouse Mks were obtained by differentiating BM cells for 4 days in DMEM (Gibco, 41966029) supplemented with 1% penicillin-streptomycin (Euroclone, ECB3001), 1% L-glutamine (Euroclone, ECB3000D) and 10% fetal bovine serum (Gibco, 10270106), in the presence of 10 ng/mL recombinant murine thrombopoietin (PeproTech, 315–14) and 50 μg/mL ascorbic acid (Sigma Aldrich, A92902). On day 4, mature Mks were isolated by bovine serum albumin (BSA; Sigma Aldrich, 3059) gradient sedimentation. For patient cell cultures, Mks were differentiated from peripheral blood PTPRC/CD45+ cells as previously described [Citation47]. PTPRC/CD45+ cells were separated by magnetic bead selection (Miltenyi, 130–045-801) and cultured for 13 days in Stem Span medium (Stem-Cell Technologies, 09650) supplemented with 10 ng/mL recombinant human TPO (PeproTech, 300–18) and IL11 (PeproTech, 200–11) at 37°C in a 5% CO2 fully-humidified atmosphere. All human samples were collected in accordance with the ethical committee of the IRCCS Policlinico San Matteo Foundation, Pavia, Italy, and the principles of the Declaration of Helsinki. For autophagy induction experiments, mature Mks were subjected to either serum starving or rapamycin treatment, two well-known autophagy-inducing stimuli [Citation23–25]. For serum starving experiments, mature Mks were cultured for the indicated time in DMEM supplemented with 1% of penicillin-streptomycin. For in vitro treatment with rapamycin, mature Mks were cultured in full media for the indicated time in the presence of 100 nM rapamycin. For LC3B turnover experiments, 50 μM chloroquine was added to the culture media for the indicated time.
Mice and in vivo treatment
We performed experiments in WT mice of the inbred C57BL/6NCrl strain and in col6a1−⁄− mice that we had previously back-crossed in the C57BL/6NCrl strain for eight generations [Citation15]. We obtained data in 3-month old mice by comparing sex-matched WT and col6a1−⁄− animals. Mouse procedures were approved by the Ethics Committee of the University of Pavia, Italy, and authorized by the Italian Ministry of Health (approval #282-2017). For in vivo treatment with rapamycin, mice were subjected to intraperitoneal (i.p.) injection of rapamycin (2 mg/kg body weight) every 24 h for 14 days, as previously described [Citation48]. Cell count and differential cell count in blood samples were performed on an ADVIA 120 hematology analyzer (Siemens).
Patient samples
Five subjects were selected from a cohort of Bethlem myopathy and UCMD patients followed at the Neuromuscular Center of the University of Padova. The study was conducted in accordance with the ethical rules and guidelines issued by local Ethical committee and with the declaration of Helsinki. Every patient provided written informed consent to study procedures. All the relevant data concerning symptoms at disease onset, clinical features at last clinical evaluation, disease progression and genetic analysis are reported in Fig. S8.
Two males (M) and three females (F) belonging to three different families were studied. Four patients were affected by Bethlem myopathy and one by UCMD intermediate [phenotype was defined upon loss of ambulation by 20 years and start of NIMV by 20 years, patient 2/M] [Citation49].
RT-qPCR
Reverse transcription was performed in a final volume of a 20-µL reaction using the iScriptTM cDNA Synthesis Kit (Bio-Rad, 1708891) according to the manufacturer’s instructions. The following primers were used: MmB2m forward CGAGACATGTGATCAAGCATC; MmB2m reverseTGGGGGTGAGAATTGCTAAG; MmBecn1 forward TGAATGAGGATGACAGTGAGCA; MmBecn1 reverse CACCTGGTTCTCCACACTCTTG; MmMap1lc3b forward CACTGCTCTGTCTTGTGTAGGTTG; MmMap1lc3b reverse TCGTTGTGCCTTTATTAGTGCATC; MmSqstm1/p62 forward CCCAGTGTCTTGGCATTCTT; MmSqstm1/p62 reverse AGGGAAAGCAGAGGAAGCTC; MmPik3c3/VPS34 forward TGTCAGATGAGGAGGCTGTG; MmPik3c3/VPS34 reverse CCAGGCACGACGTAACTTCT; MmAtg12 forward TCCGTGCCATCACATACACA; MmAtg12 reverse TAAGACTGCTGTGGGGCTGA; MmAtg14 forward GCAGGTCAGGACCCTTTGAA; MmAtg14 reverse TCCTCATCGCTTACACGCTC; MmXbp1 forward ACACGCTTGGGAATGGACAC; MmXbp1 reverse CCATGGGAAGATGTTCTGGG; MmCtsl forward GTGGACTGTTCTCACGCTCAAG; MmCtsl reverse TCCGTCCTTCGCTTCATAGG. Pre-designated KiCqStart™ primers for both human and mouse ATF4, ATF6, HSPA5/BIP, HSP90B1/GRP94, SERPINH1/HSP47, PPP1R15A/GADD34 and GAPDH genes (for both human and mouse) were purchased from Sigma-Aldrich (KSPQ12012G). Samples were loaded on a 2% agarose gel containing ethidium bromide and visualized with a ChemiDoc XRS Imaging System (Bio-Rad). Transcribed samples were diluted up to three times with ddH2O and the resulting cDNA was amplified in triplicate with 200 nM of each primer and SsoFast Evagreen Supermix (Bio-Rad, 1725201). The amplification was performed in a CFX real-time system (Bio-Rad, USA). The Bio-Rad CFX Manager software 3.0 was used to normalize the samples. GAPDH gene expression was used for comparative quantitative analysis.
Western blotting
Human and mouse Mks were lysed for 30 min at 4°C in HEPES-glycerol lysis buffer (50 mM HEPES, pH 7.4, 150 mM NaCl, 10% glycerol, 1% Triton X-100 [Sigma Aldrich, T9284], 1.5 mM MgCl2, 1 mM EGTA) containing 1 μg/mL leupeptin (Sigma Aldrich, L2884) and 1 μg/mL aprotinin (Sigma Aldrich, A1153). Samples were clarified by centrifugation at 15,700 x g at 4°C for 15 min. The analysis of COL6 secretion was performed in cell culture medium of Mks cultured in the presence of 50 μg/mL ascorbic acid for the indicated time. Laemmli sample buffer was then added to supernatants. Samples were heated at 95°C for 3 min, separated by electrophoresis on 8% or 12% sodium dodecyl sulfate-polyacrylamide gel and then transferred to polyvinylidene fluoride membranes (Bio-Rad, 1620177). Membranes were probed with primary antibodies, washed three times with PBS (Sigma Aldrich, P4417) and Tween 0.1% (Bio-Rad, 1610781), and incubated with peroxidase-conjugate secondary antibodies. Membranes were visualized using Immobilon western chemiluminescent HRP substrate (Millipore, WBKLS0), images were acquired by UVITEC Alliance Mini HD9 (UVitec, U.K.), and the protein levels detected were quantified using UVITEC NineAlliance 1D software. Mks lysates from patients and healthy subjects were analyzed with an automated capillary-based immunoassay platform (Wes, ProteinSimple, San Jose, CA, USA), according to the manufacturer instructions. Briefly, Mk lysates were diluted to the required concentration with sample buffer, then prepared by adding master mix containing 200 mM dithiothreitol, sample buffer and fluorescent standards (Standard Pack 1, PS-ST01-8) and boiled for 5 min at 95°C. Wes 12–230 kDa prefilled microplates were used (SM-W004). Compass Software for Simple Western was used to analyze results (version 3.1.7, ProteinSimple). Separation time was set to 25 min, stacking loading time to 15s and sample loading time to 9 s. Primary antibodies were incubated for 30 min and the High Dynamic Range (HDR) profile was used for detection. For each antibody, a lysate dilution experiment was performed first to confirm the optimal dynamic range of the corresponding protein on Wes. This was followed by an antibody optimization experiment to compare a range of dilutions and to select an antibody concentration that was close to saturation level to allow a quantitative comparison of signals between samples [Citation50].
Platelet preparation
Mice were anesthetized by i.p. injection of Avertin 1x. Blood was collected from inferior vena cava using heparinized insulin syringes (1 mL, BD Micro-fine, 0.33 mm, 29 G needle; heparin solution 1000 U/mL). Whole blood was collected and pooled into a tube containing acid citrate dextrose (ACD-A) 1:8; then 2 volumes of Tyrode pH 6.5 were added and immediately after 1/10 of the final volume of 1.1 M citrate was added. For human platelets, whole blood was collected from healthy volunteers and patients using ACD as anticoagulant. In both cases, blood samples were separated to obtain platelet-rich plasma (PRP) by centrifuging at 200 x g for 7 min. PRP was washed by centrifugation at 600 x g for 13 min and the pellet resuspended in one volume Tyrode’s solution pH 6.5.
Cell transfection
Mouse BM-derived cells at day 1 of differentiation were transfected with the Amaxa Nucleofector II device (Amaxa, MD, USA), using the solution C kit (Lonza, VCA-1004) according to the manufacturer’s instructions [Citation51]. For each transfection experiment, aliquots of 2.2 × 10⁶ BM cells and of 2 μg of mCherry-EGFP-LC3B plasmid DNA were used. Preliminary experiments demonstrated that the transfection efficiency, as evaluated by immunofluorescence analysis, was maximal at 48–72 h after transfection and then subsequently declined. Therefore, experiments aiming at studying autophagic flux in basal conditions and after serum starving and rapamycin treatment were started 72 h after transfection.
Immunofluorescence
For immunofluorescence microscopy assays, mature Mks (2x10⁵) were cytospun on 12-mm glass coverslips coated with poly-L-lysine (Sigma Aldrich, P8920) or plated to adhere onto fibrinogen-coated (Sigma Aldrich, 341576) glass coverslips for the indicated time. For intracellular staining, adhering Mks were washed with PBS, fixed in 4% paraformaldehyde (PFA) for 20 min, permeabilized with 0.1% Triton X-100 for 5 min, and stained for immunofluorescence evaluation with the indicated antibodies, as previously described [Citation52]. The coverslips were mounted onto glass slides with ProLong Gold antifade reagent (Invitrogen, P10144). Images were acquired with a confocal laser-scanning microscope Olympus FluoView FV10i (Olympus, Tokyo, Japan).
Transmission electron microscopy
WT and col6a1−⁄− mature Mk pellets were fixed in 2.5% glutaraldehyde and 2% PFA in cacodylate buffer pH 7.3 for 4 h at 4°C, post-fixed in 1% osmium tetroxide for 1 h at room temperature and embedded in epon-araldite resin mixture (Electron Microscopy Sciences, 13940). Ultramicrotome sections were stained with uranyl and lead, and then analyzed by transmission electron microscopy using a Jeol 1200 EX II microscope (Jeol Ltd, Tokyo, Japan) [Citation53]. At least 30 Mks per sample were examined.
Image analysis
Megakaryocytes with dilated ER were defined if CANX-labeled ER occupied over 20% of cell area. The ER area measurements were conducted using ImageJ. Briefly, the background threshold was manually defined and set for all images. Borders of each cell were drawn, and the ER area was then calculated and presented as a fraction of the total cell area [Citation54]. Intracellular COL6 staining density measurements, such as corrected total cell fluorescence, were carried out with ImageJ [Citation55]. For mCherry-EGFP-LC3B puncta analysis, Mks were outlined manually, and each channel was independently auto-thresholded using the same settings across all images from each channel. mCherry (red) and EGFP (green) puncta were quantified using the Analyze Particles plugin in ImageJ. Double-positive puncta were identified and counted using the Colocalization and Analyze Particles plugins in ImageJ. Red-only puncta were determined by subtracting the green puncta from the red puncta [Citation40].
Flow cytometry
For the analysis of apoptosis in primary BM Mks, femurs were flushed, and red blood cells lysed with a 0.8% ammonium chloride solution. The remaining cells were washed twice by centrifugation with PBS, then resuspended in ANXA5/Annexin V Binding Buffer (BioLegend, 422201) and stained with fluorescein isothiocyanate (FITC)-ANXA5/annexin-V and with 7-AAD. For analysis of apoptosis in peripheral blood circulating platelets, PRP was incubated with FITC-ANXA5/annexin-V and with a phycoerythrin (PE)-ITGA2B/CD41 antibody. Samples were acquired with a Beckman Coulter FacsDiva flow cytometer (Beckman Coulter Inc.). The analytical gating was set using unstained samples and relative isotype controls. Off-line data were analyzed using the Beckman Coulter Kaluza software package (Beckman Coulter Inc.). Mks were sorted from BM cells as previously described [Citation19,Citation56]. Mk purity was routinely performed and assessed to be more than 95%. Cell sorting experiments were performed using a FACSAria Iiu (three lasers; BD Bioscience). Diva software (BD Pharmingen) was used for data acquisition and analysis. For platelet lifespan analysis, platelets were labeled in vivo by a single intravenous injection of 800 μg EZ-Link™ NHS-Biotin (Thermo Fisher Scientific, 21217) in 100 μL PBS. Whole blood was drawn after every 24 h, diluted, and incubated with PE-conjugated streptavidin and FITC-conjugated anti CD41 antibody for 10 min at room temperature [Citation22]. Reciprocal adoptive platelet transfer was carried out as previously described [Citation22]. Briefly, mice were injected intravenously with 800 μg EZ-Link™ NHS-Biotin. Thirty min after biotin injection, 2 mL of blood were drawn. Platelet-rich plasma was isolated and resuspended in PBS before intravenous injection into recipient mice.
Statistics
Values are expressed as mean ± standard deviation (SD). A 2-tailed Student’s t test was used for comparisons between two groups. For comparisons of 1 factor across multiple groups, one-way ANOVA was performed followed by the post-hoc Tukey test. For comparisons of 2 factors across multiple groups, two-way ANOVA was performed followed by the post-hoc Tukey test. GraphPad Prism 8 (GraphPad Software) was used for statistical analysis and graphing. Values of p<0.05 were considered statistically significant. All experiments were independently replicated at least 3 times.
Supplemental Material
Download MS Word (50.4 MB)Acknowledgments
We thank the group of Carlo Gaetano (Fondazione Maugeri, Pavia, Italy) for helping with Wes, ProteinSimple analysis.
Disclosure statement
No potential conflict of interest was reported by the author(s).
Supplementary material
Supplemental data for this article can be accessed online at https://doi.org/10.1080/15548627.2022.2100105
Additional information
Funding
References
- Rutkowski DT, Hegde RS. Regulation of basal cellular physiology by the homeostatic unfolded protein response. J Cell Biol. 2010 May 31;189(5):783–794.
- Hetz C. The unfolded protein response: controlling cell fate decisions under ER stress and beyond. Nat Rev Mol Cell Biol. 2012 Jan 18;13(2):89–102.
- Urra H, Dufey E, Lisbona F, et al. When ER stress reaches a dead end. Biochim Biophys Acta. 2013 Dec;1833(12):3507–3517.
- Sano R, Reed JC. ER stress-induced cell death mechanisms. Biochim Biophys Acta. 2013 Dec;1833(12):3460–3470.
- Senft D, Ronai ZA. UPR, autophagy, and mitochondria crosstalk underlies the ER stress response. Trends Biochem Sci. 2015 Mar;40(3):141–148.
- Boya P, Reggiori F, Codogno P. Emerging regulation and functions of autophagy. Nat Cell Biol. 2013 Jul;15(7):713–720.
- Levine B, Packer M, Codogno P. Development of autophagy inducers in clinical medicine. J Clin Invest. 2015 Jan;125(1):14–24.
- Myllyharju J, Kivirikko KI. Collagens, modifying enzymes and their mutations in humans, flies and worms. Trends Genet. 2004 Jan;20(1):33–43.
- Bateman JF, Boot-Handford RP, Lamandé SR. Genetic diseases of connective tissues: cellular and extracellular effects of ECM mutations. Nat Rev Genet. 2009 Mar;10(3):173–183.
- Bienkowski RS, Curran SF, Berg RA. Kinetics of intracellular degradation of newly synthesized collagen. Biochemistry. 1986 May 06;25(9):2455–2459.
- Ishida Y, Yamamoto A, Kitamura A, et al. Autophagic elimination of misfolded procollagen aggregates in the endoplasmic reticulum as a means of cell protection. Mol Biol Cell. 2009 Jun;20(11):2744–2754.
- Cescon M, Gattazzo F, Chen P, et al. Collagen VI at a glance. J Cell Sci. 2015 Oct;128(19):3525–3531.
- Bonaldo P, Braghetta P, Zanetti M, et al. Collagen VI deficiency induces early onset myopathy in the mouse: an animal model for Bethlem myopathy. Hum Mol Genet. 1998 Dec;7(13):2135–2140.
- Bönnemann CG. The collagen VI-related myopathies: muscle meets its matrix. Nat Rev Neurol. 2011 Jun;7(7):379–390.
- Irwin WA, Bergamin N, Sabatelli P, et al. Mitochondrial dysfunction and apoptosis in myopathic mice with collagen VI deficiency. Nat Genet. 2003 Dec;35(4):367–371.
- Grumati P, Coletto L, Sabatelli P, et al. Autophagy is defective in collagen VI muscular dystrophies, and its reactivation rescues myofiber degeneration. Nat Med. 2010 Nov;16(11):1313–1320.
- Cescon M, Chen P, Castagnaro S, et al. Lack of collagen VI promotes neurodegeneration by impairing autophagy and inducing apoptosis during aging. Aging (Albany NY). 2016 May;8(5):1083–1101.
- Castagnaro S, Chrisam M, Cescon M, et al. Extracellular collagen VI has prosurvival and autophagy instructive properties in mouse fibroblasts. Front Physiol. 2018;9:1129.
- Abbonante V, Gruppi C, Battiston M, et al. Ablation of collagen VI leads to the release of platelets with altered function. Blood Adv. 2021 Sep 21;5(23):5150–5163.
- Bernales S, McDonald KL, Walter P. Autophagy counterbalances endoplasmic reticulum expansion during the unfolded protein response. PLoS Biol. 2006 Nov;4(12):e423.
- Perlman H, Zhang X, Chen MW, et al. An elevated bax/bcl-2 ratio corresponds with the onset of prostate epithelial cell apoptosis. Cell Death Differ. 1999 Jan;6(1):48–54.
- Mason KD, Carpinelli MR, Fletcher JI, et al. Programmed anuclear cell death delimits platelet life span. Cell. 2007 Mar;128(6):1173–1186.
- Shang L, Chen S, Du F, et al. Nutrient starvation elicits an acute autophagic response mediated by Ulk1 dephosphorylation and its subsequent dissociation from AMPK. Proc Natl Acad Sci U S A. 2011 Mar;108(12):4788–4793.
- Sharifi MN, Mowers EE, Drake LE, et al. Measuring autophagy in stressed cells. Methods Mol Biol. 2015;1292:129–150.
- Zhou J, Tan SH, Nicolas V, et al. Activation of lysosomal function in the course of autophagy via mTORC1 suppression and autophagosome-lysosome fusion. Cell Res. 2013 Apr;23(4):508–523.
- Bernardi P, Bonaldo P. Dysfunction of mitochondria and sarcoplasmic reticulum in the pathogenesis of collagen VI muscular dystrophies. Ann N Y Acad Sci. 2008 Dec;1147(1):303–311.
- Chrisam M, Pirozzi M, Castagnaro S, et al. Reactivation of autophagy by spermidine ameliorates the myopathic defects of collagen VI-null mice. Autophagy. 2015;11(12):2142–2152.
- De Palma S, Capitanio D, Vasso M, et al. Muscle proteomics reveals novel insights into the pathophysiological mechanisms of collagen VI myopathies. J Proteome Res. 2014 Nov 07;13(11):5002–5030.
- Pan TC, Zhang RZ, Markova D, et al. COL6A3 protein deficiency in mice leads to muscle and tendon defects similar to human collagen VI congenital muscular dystrophy. J Biol Chem. 2013 May 17;288(20):14320–14331.
- Theocharidis G, Drymoussi Z, Kao AP, et al. Type VI collagen regulates dermal matrix assembly and fibroblast motility. J Invest Dermatol. 2016 Jan;136(1):74–83.
- Josefsson EC, Burnett DL, Lebois M, et al. Platelet production proceeds independently of the intrinsic and extrinsic apoptosis pathways. Nat Commun. 2014 Mar;5(1):3455.
- Auberger P, Puissant A. Autophagy, a key mechanism of oncogenesis and resistance in leukemia. Blood. 2017 02;129(5):547–552.
- Houwerzijl EJ, Blom NR, van der Want JJ, et al. Megakaryocytic dysfunction in myelodysplastic syndromes and idiopathic thrombocytopenic purpura is in part due to different forms of cell death. Leukemia. 2006 Nov;20(11):1937–1942.
- Watson AS, Mortensen M, Simon AK. Autophagy in the pathogenesis of myelodysplastic syndrome and acute myeloid leukemia. Cell Cycle. 2011 Jun;10(11):1719–1725.
- You T, Wang Q, Zhu L. Role of autophagy in megakaryocyte differentiation and platelet formation. Int J Physiol Pathophysiol Pharmacol. 2016;8(1):28–34.
- Colombatti A, Bonaldo P, and Ainger K, et al. Biosynthesis of chick type VI collagen. I. intracellular assembly and molecular structure. J Biol Chem. 1987 Oct;262(30):14454–14460.
- Colombatti A, Bonaldo P. Biosynthesis of chick type VI collagen. II. processing and secretion in fibroblasts and smooth muscle cells. J Biol Chem. 1987 Oct;262(30):14461–14466.
- Schuck S, Prinz WA, Thorn KS, et al. Membrane expansion alleviates endoplasmic reticulum stress independently of the unfolded protein response. J Cell Biol. 2009 Nov;187(4):508–523.
- Pinnell SR. Regulation of collagen biosynthesis by ascorbic acid: a review. Yale J Biol Med. 1985 Nov-Dec;58(6):553–559.
- Murrow L, Malhotra R, Debnath J. ATG12-ATG3 interacts with Alix to promote basal autophagic flux and late endosome function. Nat Cell Biol. 2015 Mar;17(3):300–310.
- Jung CH, Ro SH, Cao J, et al. mTOR regulation of autophagy. FEBS Lett. 2010 Apr;584(7):1287–1295.
- Forrester A, De Leonibus C, Grumati P, et al. A selective ER-phagy exerts procollagen quality control via a Calnexin-FAM134B complex. EMBO J. 2019 Jan 15;38(2). 10.15252/embj.201899847.
- Artoni A, Bassotti A, Abbattista M, et al. Hemostatic abnormalities in patients with ehlers-danlos syndrome. J Thromb Haemost. 2018 Oct 12;16(12):2425–2431.
- Estes JW. Platelet abnormalities in heritable disorders of connective tissue. Ann N Y Acad Sci. 1972 Oct;201(1):445–450.
- Malfait F, De Paepe A. Bleeding in the heritable connective tissue disorders: mechanisms, diagnosis and treatment. Blood Rev. 2009 Sep;23(5):191–197.
- Pankiv S, Clausen TH, Lamark T, et al. p62/SQSTM1 binds directly to Atg8/LC3 to facilitate degradation of ubiquitinated protein aggregates by autophagy. J Biol Chem. 2007 Aug;282(33):24131–24145.
- Bluteau D, Balduini A, Balayn N, et al. Thrombocytopenia-associated mutations in the ANKRD26 regulatory region induce MAPK hyperactivation. J Clin Invest. 2014 Feb;124(2):580–591.
- Urciuolo A, Quarta M, Morbidoni V, et al. Collagen VI regulates satellite cell self-renewal and muscle regeneration. Nat Commun. 2013;4(1):1964.
- Foley AR, Quijano-Roy S, Collins J, et al. Natural history of pulmonary function in collagen VI-related myopathies. Brain. 2013 Dec;136(Pt 12):3625–3633.
- Vögtle T, Sharma S, Mori J, et al. Heparan sulfates are critical regulators of the inhibitory megakaryocyte-platelet receptor G6b-B. Elife. 2019 Aug 22;8. 10.7554/eLife.46840
- Pecci A, Bozzi V, Panza E, et al. Mutations responsible for MYH9-related thrombocytopenia impair SDF-1-driven migration of megakaryoblastic cells. Thromb Haemost. 2011 Oct;106(4):693–704.
- Abbonante V, Chitalia V, Rosti V, et al. Upregulation of lysyl oxidase and adhesion to collagen of human megakaryocytes and platelets in primary myelofibrosis. Blood. 2017 08; 130(6):829–831.
- Necchi V, Balduini A, Noris P, et al. Ubiquitin/proteasome-rich particulate cytoplasmic structures (PaCSs) in the platelets and megakaryocytes of ANKRD26-related thrombo-cytopenia. Thromb Haemost. 2013 Feb;109(2):263–271.
- Khaminets A, Heinrich T, Mari M, et al. Regulation of endoplasmic reticulum turnover by selective autophagy. Nature. 2015 Jun;522(7556):354–358.
- Hansen MD, Johnsen IB, Stiberg KA, et al. Hepatitis C virus triggers Golgi fragmentation and autophagy through the immunity-related GTPase M. Proc Natl Acad Sci U S A. 2017 04; 114(17):E3462–E3471.
- Abbonante V, Di Buduo CA, Gruppi C, et al. Thrombopoietin/TGF-β1 loop regulates megakaryocyte extracellular matrix component synthesis. Stem Cells. 2016 Apr;34(4):1123–1133.