
ABSTRACT
TFEB (transcription factor EB) regulates multiple genes involved in the process of macroautophagy/autophagy and plays a critical role in lifespan determination. However, the detailed mechanisms that regulate TFEB activity are not fully clear. In this study, we identified a role for HSP90AA1 in modulating TFEB. HSP90AA1 was phosphorylated by CDK5 at Ser 595 under basal condition. This phosphorylation inhibited HSP90AA1, disrupted its binding to TFEB, and impeded TFEB’s nuclear localization and subsequent autophagy induction. Pro-autophagy signaling attenuated CDK5 activity and enhanced TFEB function in an HSP90AA1-dependent manner. Inhibition of HSP90AA1 function or decrease in its expression significantly attenuated TFEB’s nuclear localization and transcriptional function following autophagy induction. HSP90AA1-mediated regulation of a TFEB ortholog was involved in the extended lifespan of Caenorhabditis elegans in the absence of its food source bacteria. Collectively, these findings reveal that this regulatory process plays an important role in modulation of TFEB, autophagy, and longevity.
Abbreviations : AL: autolysosome; AP: autophagosome; ATG: autophagy related; BafA1: bafilomycin A1; CDK5: cyclin-dependent kinase 5; CDK5R1: cyclin dependent kinase 5 regulatory subunit 1; CR: calorie restriction; FUDR: 5-fluorodeoxyuridine; HSP90AA1: heat shock protein 90 alpha family class A member 1; MAP1LC3: microtubule associated protein 1 light chain 3; NB: novobiocin sodium; SQSTM1: sequestosome 1; TFEB: transcription factor EB; WT: wild type.
Introduction
Aging is a progressive failure in the maintenance of homeostatic balance. It is described as accumulation of damages, including damaged and aggregated proteins and organelles in cells. Autophagy functions to maintain cellular homeostasis and plays crucial roles in cellular quality control [Citation1]. Major processes relevant to aging such as increase of reactive oxygen species, clearance of mitochondrial damage, nutrient sensing, and genome instability converge on lysosomes and autophagy [Citation1–3]. Various studies indicate that the expression of multiple ATG (autophagy related) proteins and autophagy activity decline with aging. For instance, expression of the key autophagy genes such as ATG5 and ATG7 is downregulated during normal aging in the human brain [Citation4]. Conversely, induction of autophagy delays aging and extends longevity [Citation5]. Thus, autophagy plays a critical role in aging with high autophagy activity being associated with a delay in aging.
Autophagic and lysosomal machineries are highly regulated. TFEB (transcription factor EB), a member of the microphthalmia family of basic helix-loop-helix-leucine-zipper (bHLH-Zip) transcription factors [Citation6], has been identified as the key regulator of autophagy and lysosome biogenesis. TFEB promotes the transcription of multiple autophagy and lysosomal genes and plays an important role in regulating autophagy, lysosome biogenesis, and metabolism [Citation7]. In C. elegans, over-expression of HLH-30, the worm TFEB ortholog, leads to an increase in lifespan in various longevity paradigms [Citation8,Citation9]. TFEB activity is tightly regulated via several mechanisms including spatial distribution. Under resting or nutrient rich conditions, TFEB is sequestered in the cytoplasm and remains transcriptionally inactive. Upon signaling such as starvation or lysosomal stress, TFEB is released from sequestration and actively translocates to the nucleus to promote the transcription of its target genes [Citation10,Citation11]. However, the signaling mechanisms that regulate TFEB in aging and longevity remain to be determined.
HSP90AA1 (heat shock protein 90 alpha family class A member 1) is a highly conserved molecular chaperone and ubiquitously expressed in eukaryotic cells [Citation12]. Through interaction with co-chaperones and hundreds of client proteins, HSP90AA1 participates in many cellular processes and performs diverse functions dependent on tissue organs. Interestingly, inhibition of HSP90AA1ʹs expression has been shown to decrease longevity of Age-1(hx546), a long-lived mutant, but not wild-type worms [Citation13]. Nevertheless, the specific downstream targets mediating the potential longevity effect of HSP90AA1 have not been elucidated. Several studies have reported that HSP90AA1 interacts with BECN1 [Citation14], ULK1 [Citation15] and MAP1LC3A [Citation16,Citation17], raising the possibility that HSP90AA1 may play an important role in regulating autophagy.
Recently, it also has been shown that apart from its chaperone activity, HSP90AA1 plays an important role in modulating transcription machineries [Citation18]. It assists the folding of various transcription factors and promotes their nuclear translocation [Citation19–23]. However, whether HSP90AA1 affects transcription factors related to autophagy, especially TFEB, remains unknown.
Post-translational modifications including phosphorylation regulate HSP90AA1 activity. Several kinases such as PRKA/protein kinase A [Citation24], PRKCG/PKCγ (protein kinase C gamma) [Citation25], and CSNK2 (casein kinase 2) [Citation26] have been shown to phosphorylate HSP90AA1 and affect HSP90AA1 chaperone function. Quantitative mass spectrometry-phosphoproteomic analyses of tissue samples suggest that HSP90AA1 can be phosphorylated at Ser595 [Citation27]. Although Ser595 resides in a putative phosphorylation consensus site for CDK5 (cyclin dependent kinase 5) [Citation28], the identity of the kinase responsible for phosphorylating Ser595 has not been established experimentally.
In this study, we identified a new mechanism by which signals engage TFEB to modulate autophagy-lysosome pathway. We showed that HSP90AA1 interacts with TFEB to promote TFEB nuclear translocation upon signaling and this was important for the induction of autophagy. CDK5, an important kinase known to be involved in neurodegeneration, phosphorylated HSP90AA1 and negatively regulated HSP90AA1-TFEB interaction. HSP-90/HSP90AA1-mediated enhancement of HLH-30/TFEB in the nucleus played an important role in starvation-induced lifespan increase in C. elegans. Thus, we had established HSP90AA1-TFEB as a key regulatory pathway involved in promoting autophagy and longevity in cells and in model animal.
Results
HSP90AA1 was necessary for autophagy induction following starvation
To assess the role of HSP90AA1 in autophagy, we used SN4741 cells, a mouse midbrain dopaminergic neuronal progenitor cell line [Citation29], as the primary model due to its wide application in studying the role of autophagy and neurodegeneration [Citation30–32]. We starved the cells, which is known to induce autophagy and determined the level of SQSTM1 (sequestosome 1), an autophagy substrate and MAP1LC3B-II, a marker of autophagy. We found that the level of MAP1LC3B-II and SQSTM1 decreased over time. Inhibiting fusion between autophagosomes (APs) and lysosomes and therefore MAP1LC3B-II degradation with bafilomycin A1 (BafA1) caused an increase in MAP1LC3B-II, indicating that starvation enhances autophagy flux and increases MAP1LC3B-II turnover in SN4741 cells (). We also determined the level of HSP90AA1 and found that starvation modestly increased HSP90AA1 level in the nucleus (). Using this model, we treated cells with 17-AAG, an inhibitor of HSP90AA1, and found impaired the degradation of SQSTM1 under starvation. We also found significantly reduced MAP1LC3B-II expression () and endogenous LC3B puncta formation (Fig. S1A and S1B) in the presence of BafA1 during starvation. Similar effect was also observed with novobiocin sodium (NB), another HSP90AA1 inhibitor (, Fig. S1A and S1B) or knocking down HSP90AA1 by small interference RNA (siRNA) (, Fig. S1A and S1C), indicating that starvation-induced autophagy flux requires HSP90AA1.
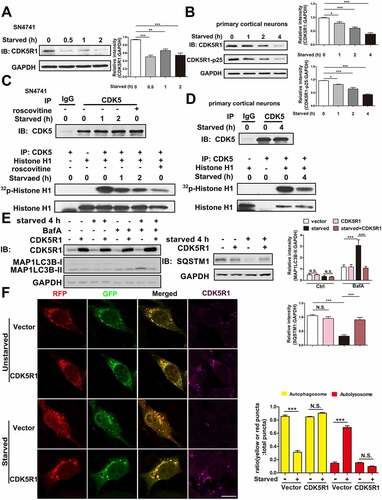
Figure 1. HSP90AA1 was necessary for autophagy induction by starvation. (A) Autophagy is induced by starvation. SN4741 cells were exposed to starvation media (HBSS with 10 mM HEPES) for 2 or 4 h in the presence or absence of 400 nM of BafA1, and immunoblotted for MAP1LC3B, SQSTM1 and GAPDH. The right graph shows the quantification of MAP1LC3B-II and SQSTM1 levels. Starvation increases HSP90AA1 level in nucleus. The cytosolic and nuclear fractions from SN4741 cells following starvation were prepared. Then the expression of HSP90AA1, GAPDH (cytosolic marker) and histone H3 (nuclear marker) was determined by immunoblotting. The right graph shows the quantification of HSP90AA1 levels. (B, C and D) 17-AAG (B) and NB (C), inhibitors of HSP90AA1 with different mechanisms, and si-Hsp90aa1 (D) inhibit autophagy induction by starvation. SN4741 cells were pre-treated with 5 μM 17-AAG or 500 μM NB for 0.5 h or transfected with si-Hsp90aa1 for 36 h. Cells were starved for 4 h with or without 400 nM BafA1. Then the expression of MAP1LC3B, SQSTM1 (B, C and D) and HSP90AA1 (D) was determined by immunoblotting. NB, Novobiocin sodium. The graphs show the quantification of MAP1LC3B-II and SQSTM1 levels. (E) Starvation-induced autophagy flux is inhibited by 17-AAG, NB or si-Hsp90aa1. SN4741 cells were transfected with RFP-GFP-MAP1LC3B plasmid for 36 h. After that, cells were pre-treated with 5 μM 17-AAG or 500 μM NB for 0.5 h and then starved for 4 h. For si-Hsp90aa1 experiment, SN4741 cells were cotransfected with RFP-GFP-MAP1LC3B and si-Hsp90aa1 or control siRNA (siCtrl) for 36 h. Then the cells starved for 4 h. Autophagy flux were tested by immunofluorescence. Right graphs show the ratio of yellow (AP) or red (AL) puncta in total yellow and red puncta (mean ± SEM, n = 3; *p < 0.05, **p < 0.01, ***p < 0.001, N.S., not significant compared with the indicated group; scale bar: 10 μm).
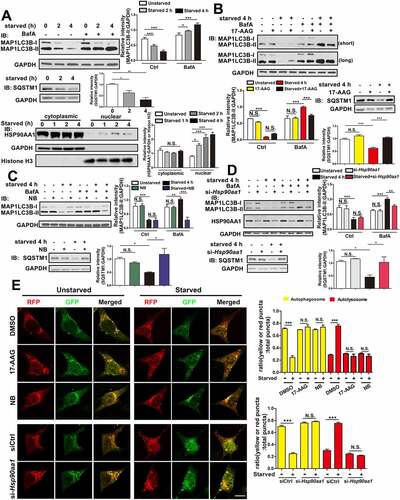
To corroborate the above findings, we transiently expressed RFP-GFP-MAP1LC3B in cells and assessed autophagy by imaging analysis. Since acidic pH in lysosomes quenches GFP fluorescence, the number of yellow (GFP and RFP co-labeling) and red only puncta represent AP and autolysosome (AL), respectively. This analysis indicated that the ratio of AP or AL among the total number of puncta was not significantly different between control and groups treated with HSP90AA1 inhibitors or si-Hsp90aa1 under basal condition (). Starvation increased the numbers of both AP (yellow puncta) and AL (red puncta), as well as the ratio of AL among total puncta but decreased the ratio of APs, indicating a robust induction of autophagy. However, inhibition of HSP90AA1 significantly increased the ratio of APs but decreased the ratio of ALs while decreasing both the absolute number of AP and AL puncta under starvation (, Fig. S1D-F). Thus, HSP90AA1 appears to be required for starvation-induced increase in autophagy flux.
HSP90AA1 promoted starvation-induced TFEB nuclear translocation
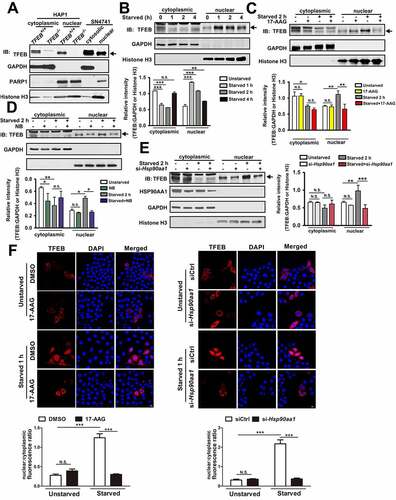
HSP90AA1 interacts with a number of client proteins including transcription factors to regulate their function [Citation18]. Translocation of TFEB from the cytoplasmic compartment to the nucleus is a critical step of its regulation and tightly controlled. We determined the expression of TFEB in the cytosol and nucleus under basal condition. Analysis of the whole cell and the cytoplasmic or nuclear lysates from TFEB−/− and TFEB+/+ HAP1 cells showed that there were high levels of TFEB in both whole (Fig. S2A) or cytoplasmic/nuclear compartments (). Starvation led to decrease of cytoplasmic TFEB and concurrent significant increase of TFEB in the nucleus and we also found that starvation-induced TFEB nuclear enrichment is strongest in the first hour of starvation, but decreases with prolonged starvation (). Inhibition of HSP90AA1 with 17-AAG, NB or si-Hsp90aa1 greatly attenuated starvation-induced accumulation of TFEB in the nucleus which was accompanied with significant decrease of the cytoplasmic TFEB compared to the non-starved condition (). Immunofluorescence assay also showed that 17-AAG or si-Hsp90aa1 attenuated the TFEB signal in the nucleus following starvation in HeLa cells, suggesting that the findings are conserved between different cell types (). Inhibition of UPS by MG132 prevented the decrease of cytoplasmic TFEB induced by starvation alone or in combination with HSP90AA1 inhibition (Fig. S2B). These findings indicate clearly that starvation-induced nuclear translocation of TFEB requires HSP90AA1.
Figure 2. HSP90AA1 promoted starvation-induced nuclear translocation of TFEB. (A) The subcellular location of TFEB is confirmed in TFEB−/− or TFEB+/+ HAP1 cells and SN4741 cells. The cytoplasmic and nuclear lysates from TFEB−/− or TFEB+/+ HAP1 and SN4741 cells were blotted as shown. Then the expression of TFEB, GAPDH, PARP1 (nuclear marker) and histone H3 was determined by immunoblotting. Arrow indicates TFEB band. (B) Starvation modulates the levels of TFEB in the cytosolic or nuclear compartments. The cytosolic and nuclear fractions from SN4741 cells following starvation were prepared. Then the expression of TFEB, GAPDH and histone H3 was determined by immunoblotting. The below graph shows the quantification of TFEB levels. Arrow indicates TFEB band. (C, D and E) Inhibition of HSP90AA1 attenuates the level of nuclear TFEB following starvation. SN4741 cells were pre-treated with 5 μM 17-AAG (C) or 500 μM NB (D) for 0.5 h and then starved for 2 h. For (E), SN4741 cells were transfected with si-Hsp90aa1 for 36 h. Then cells were starved for 2 h. The cytosolic and nuclear fractions were prepared. Then the expression of TFEB, GAPDH and histone H3 was determined by immunoblotting. The graphs show the quantification of TFEB levels (mean ± SEM, n = 3; *p < 0.05, **p < 0.01, ***p < 0.001, N.S., not significant compared with the indicated group). (F) Inhibition of HSP90AA1 attenuates the level of nuclear TFEB following starvation. HeLa cells were transfected with TFEB-mCherry for 36 h and then were pre-treated with 5 μM 17-AAG for 0.5 h and then starved for 1 h. 17-AAG was included during the subsequent starvation phase. Fluorescence images show TFEB-mCherry. The below graph shows the nuclear/cytoplasmic fluorescence ratio. HeLa cells were co-transfected with si-Hsp90aa1 and TFEB-mCherry for 36 h and then starved for 1 h. Fluorescence images show TFEB-mCherry. The below graph shows the nuclear/cytoplasmic fluorescence ratio (mean ± SEM, n = 3; ***p < 0.001, N.S., not significant compared with the indicated group; scale bar: 10 μm).
HSP90AA1 enhanced TFEB’s transcriptional function
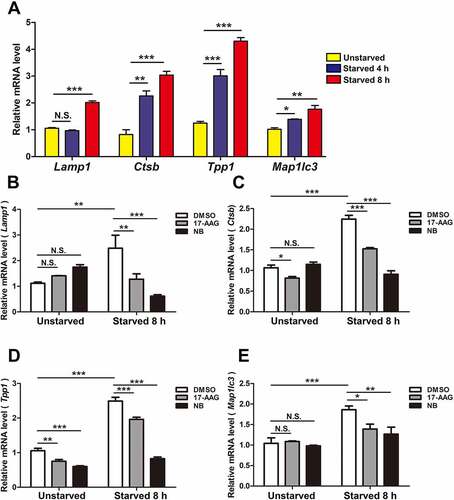
TFEB is known to bind to the promoter regions of many autophagy genes and enhance their transcription under starvation. To confirm that HSP90AA1 modulated TFEB’s transcriptional function under starvation, we inhibited HSP90AA1 upon starvation and then measured the levels of mRNA of TFEB’s target genes, such as Lamp1, Ctsb, Tpp1 and Map1lc3 by qPCR. Starvation alone induced the expression of these TFEB target genes compared with different housekeeping genes (, Fig. S3A and S3B). Inhibition of HSP90AA1 by 17-AAG or NB significantly reduced the levels of these starvation-induced mRNAs (). In addition, 17-AAG also reduced TFEB’s transcriptional activity in its luciferase reporter assay in SN4741 cells under starvation (Fig. S3C). Besides, 17-AAG or si-Hsp90aa1 also reduced TFEB’s transcriptional activity in HeLa cells under TFEB overexpression (Fig. S3D and S3E). These findings indicate that HSP90AA1 plays a role in starvation-induced expression of TFEB transcriptional target genes.
Figure 3. HSP90AA1 was required for starvation-induced expression of TFEB target genes. (A) Starvation induces the expression of TFEB target genes. SN4741 cells were starved for 4 or 8 h, and the mRNA levels of Lamp1, Ctsb, Tpp1 and Map1lc3 were quantified by qPCR. (B, C, D and E) Inhibition of TFEB reduces the expression of TFEB target genes. SN4741 cell were pre-treated with 5 μM 17-AAG or 500 μM NB for 0.5 h and then starved for 8 h. The mRNA levels were quantified by qPCR. The value of control sample without any treatment (starvation and inhibitor) was the calibrator and set as 1. All gene-specific mRNA expression values were normalized to Gapdh mRNA. All data are shown as mean ± SD; n = 3; *p < 0.05, **p < 0.01, ***p < 0.001, N.S., not significant compared with the indicated group.
HSP90AA1 directly interacted with TFEB
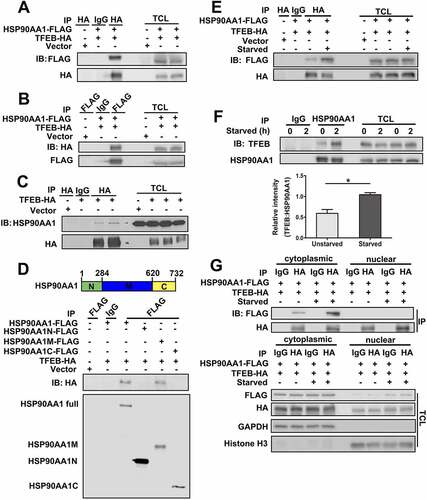
The results above indicate that HSP90AA1 regulates autophagy by promoting starvation-induced TFEB’s nuclear translocation and transcription of its target genes. To test how HSP90AA1 may modulate TFEB, we assessed whether HSP90AA1 could directly interact with TFEB. We overexpressed both HSP90AA1-FLAG and TFEB-HA in SN4741 cells, immunoprecipitated with anti-HA antibody, and blotted the precipitates with anti-FLAG antibody or performed the co-IP in reverse. This analysis showed that HSP90AA1 was associated with TFEB (). Similar co-IP studies indicated that overexpressed TFEB-HA also interacted with endogenous HSP90AA1 (). To map the domain of HSP90AA1 involved in mediating its binding to TFEB, we expressed the N-terminal, C-terminal, and middle region of HSP90AA1 with TFEB and showed that HSP90AA1 middle region (amino acid residues 284 to 620) was sufficient to interact with TFEB (). We investigated whether the interaction between HSP90AA1 and TFEB was modulated by autophagy signal and found that starvation significantly increased the binding between HSP90AA1 and TFEB (). Furthermore, endogenous HSP90AA1 and TFEB bound to each other, and starvation also induced their binding (). Immunofluorescence staining also revealed the TFEB-HA colocalized well with HSP90AA1-FLAG (Fig. S4). We also tested the interaction using cytoplasmic and nuclear lysates and found that HSP90AA1 and TFEB interaction was readily detectable in the cytoplasmic compartment ().
Figure 4. HSP90AA1 interacted with TFEB. (A and B) HSP90AA1 binds to TFEB in co-IP assay. SN4741 cells were co-transfected with TFEB-HA and HSP90AA1-FLAG plasmids. For (A), TFEB-HA was immunoprecipitated from the lysates with an anti-HA antibody and the precipitates were blotted with an anti-FLAG antibody and the same membrane was re-blotted with anti-HA (left three lanes). The levels of the expressed proteins in whole lysates were determined with anti-FLAG and anti-HA antibodies (right three lanes). For (B), HSP90AA1-FLAG was immunoprecipitated from the lysates by an anti-FLAG antibody and the precipitates were blotted with an anti-HA antibody and the same membrane was re-blotted with an anti-FLAG antibody (left three lanes). The levels of FLAG and HA signals were determined by blotting the whole lysates as shown (right three lanes). TCL, total cell lysate. (C) TFEB-HA binds to endogenous HSP90AA1. SN4741 cells were transfected with TFEB-HA plasmid. TFEB-HA was immunoprecipitated from the lysates by an anti-HA antibody and the precipitates were blotted with an anti-HSP90AA1 antibody and the same membrane was re-blotted with an anti-HA antibody (left four lanes). The whole lysates were blotted with anti-HSP90AA1 and anti-HA antibodies (right four lanes). (D) The middle domain of HSP90AA1 (HSP90AA1-M) binds to TFEB. SN4741 cells were co-transfected with TFEB-HA and HSP90AA1-FLAG full length, HSP90AA1N-FLAG (1–264 aa), HSP90AA1C-FLAG (265–620 aa), or HSP90AA1M-FLAG (621–732 aa) (diagram) plasmids for 36 h. Lysates were immunoprecipitated with an anti-FLAG antibody and blotted with an anti-HA antibody (top panel). The same membrane was blotted with an anti-FLAG antibody (bottom panel). (E) Starvation increases the binding between HSP90AA1 and TFEB. SN4741 cells were co-transfected with TFEB-HA and HSP90AA1-FLAG plasmids for 36 h and then starved for 2 h. Immunoblotting was carried out as described in (A). (F) Endogenous HSP90AA1 interacts with endogenous TFEB. Endogenous HSP90AA1 was immunoprecipitated from the lysates by an anti-HSP90AA1 antibody and the precipitates were blotted with an anti-TFEB antibody, and the same membrane was re-blotted with an anti-HSP90AA1 antibody (left four lanes). The whole lysates were blotted with anti-TFEB and anti-HSP90AA1 antibodies (right four lanes). The graph shows the quantification of TFEB levels (mean ± SEM, n = 3; *p < 0.05). (G) HSP90AA1 and TFEB interact in the cytoplasmic compartment. SN4741 cells were co-transfected with TFEB-HA and HSP90AA1-FLAG plasmids for 36 h and then starved for 2 h. The cytosolic and nuclear fractions were used for immunoprecipitation and immunoblotting as described in (A).
Starvation-induced autophagy was accompanied by inhibition of CDK5
CDK5 is an important kinase in the nervous system. We found that prolonged starvation led to a significant decrease in the level of CDK5R1 (cyclin dependent kinase 5 regulatory subunit 1), a CDK5 activator [Citation33], in SN4741 cells (). Similarly, the levels of CDK5R1 and CDK5R1-p25, a CDK5R1 cleavage product, declined in primary cortical neurons upon starvation (). We immunoprecipitated CDK5 from SN4741 cells ( top) or primary cortical neurons ( top) and tested the phosphorylation of histone H1, a substrate of CDK5, by in vitro kinase assay. Starvation caused a decline of CDK5 kinase activity in both SN4741 cells ( bottom) and primary cortical neurons ( bottom). Overexpression of CDK5R1 decreased MAP1LC3B-II expression (), endogenous MAP1LC3B puncta formation (Fig. S5A and S5B) in the presence of BafA1 and inhibited the degradation of SQSTM1 under starvation (). Overexpression of CDK5R1 significantly increased the ratio of AP and decreased the ratio of AL while decreasing the absolute numbers of both AP and AL under starvation condition (, Fig. S5C and S5D). These data show that CDK5 activity declines following starvation, and this appears to be required for starvation-induced autophagy.
Figure 5. CDK5 inhibited autophagy induced by starvation. (A) Starvation reduces the level of CDK5R1 in SN4741 cells. SN4741 cells were starved for 0.5, 1 and 2 h. The lysates were blotted for CDK5R1 and GAPDH. The right graph shows the quantification of CDK5R1 levels. (B) Starvation reduces the levels of CDK5R1 and p25 in primary cortical neurons. Rat primary cortical neurons were starved for 1, 2 and 4 h. The lysates were blotted for CDK5R1, CDK5R1-p25 and GAPDH. The right graphs show the quantification of CDK5R1 or CDK5R1-p25 levels. (C and D) Starvation reduces the activity of CDK5. SN4741 cells (C) or primary cortical neurons (D) were starved for the indicated period of time and SN4741 cells also were treated with 20 μM roscovitine, an inhibitor of CDK5, alone for 2 h. CDK5 was immunoprecipitated from cell lysates by an anti-CDK5 antibody and the level was blotted (C and D top panel). Immunoprecipitated CDK5 was incubated with purified histone H1 in kinase assay (C and D bottom panel). The same membrane was blotted with an anti-histone H1 antibody. (E) CDK5 inhibits MAP1LC3B-II expression and SQSTM1 degradation under starvation. SN4741 cells were transfected with CDK5R1 plasmids for 36 h and then starved for 4 h with or without 400 nM BafA1. Then the expression of CDK5R1, MAP1LC3B, SQSTM1 and GAPDH was determined by immunoblotting. The right graph shows the quantification of MAP1LC3B-II and SQSTM1 levels. (F) Starvation-induced autophagy flux is inhibited by overexpression of CDK5R1. SN4741 cells were transfected with RFP-GFP-MAP1LC3B and CDK5R1 plasmids for 36 h and then starved for 4 h. Autophagy flux were tested by immunofluorescence. The ratio of yellow (AP) or red (AL) puncta in total puncta (yellow and red) was shown. (mean ± SEM, n = 3; *p < 0.05, **p < 0.01, ***p < 0.001 compared with the indicated group, N.S., not significant compared with the indicated group; scale bar: 10 μm).
CDK5 inhibited TFEB nuclear localization by phosphorylating HSP90AA1
Sequence analysis revealed that HSP90AA1 contains a consensus CDK5 phosphorylation motif at Ser595 [Citation28], which is conserved in other HSP90AA1 orthologs (). We therefore tested whether CDK5 could phosphorylate HSP90AA1 directly. We found that CDK5 could bind to HSP90AA1 in HEK293T cells (Fig. S6A) and CDK5 inhibitor roscovitine reduced the HSP90AA1 phosphorylation under basal condition in SN4741 cells (). We immunoprecipitated HSP90AA1 and HSP90AA1S595A from transfected HEK293T cells and incubated the precipitates with purified CDK5 in an in vitro kinase assay. This analysis showed that CDK5 phosphorylated HSP90AA1 but not HSP90AA1S595A mutant and roscovitine inhibited the phosphorylation (). Next, we immunoprecipitated HSP90AA1 and HSP90AA1S595A from transfected SN4741 cells under starvation and blotted the precipitates with an antibody that specifically recognizes phosphorylated serine followed by a proline and found that HSP90AA1 was phosphorylated at Ser 595 in cells under basal condition and this phosphorylation was greatly reduced upon starvation ().
Figure 6. CDK5 phosphorylated HSP90AA1 and inhibited TFEB’s nuclear localization and target gene expression. (A) HSP90AA1 contains a putative CDK5 phosphorylation motif at Ser595. (B) Roscovitine reduces HSP90AA1 phosphorylation in vivo. SN4741 cells were transfected with HSP90AA1-FLAG for 36 h and then treated with roscovitine for 1 or 4 h. HSP90AA1 was immunoprecipitated from the lysates by an anti-FLAG antibody and the precipitates were blotted with an antibody that specifically recognizes phosphorylated serine followed by a proline (top panel). The same membrane was blotted with anti-FLAG (bottom panel). (C) Phosphorylation of HSP90AA1 by CDK5-CDK5R1-p25 at serine 595. FLAG-tagged HSP90AA1 or HSP90AA1S595A overexpressed in HEK293T cells was immunoprecipitated using an anti-FLAG antibody. The precipitates were incubated with purified CDK5-CDK5R1-p25 in an in vitro kinase assay (upper panel). The lower panel shows the total CDK5, immunoprecipitated-HSP90AA1 and immunoprecipitated-HSP90AA1S595A by sequential western blotting. (D) CDK5 leads to HSP90AA1 phosphorylation at Ser595 in vivo and starvation decreases the phosphorylation level. SN4741 cells were transfected with HSP90AA1-FLAG or HSP90AA1S595A-FLAG for 36 h and starved for 2 h. HSP90AA1 was immunoprecipitated from the lysates by an anti-FLAG antibody and the phosphorylation of HSP90AA1 was blotted as described in (B). The same membrane was blotted with anti-FLAG. (E) HSP90AA1S595D mutant inhibits the dimer formation. HEK293T cells were transfected with HSP90AA1-FLAG or HSP90AA1S595D-FLAG and treated with the non-cleavable and membrane-permeable crosslinker disuccinimidyl suberate (DSS), a noncleavable and membrane permeable crosslinker, as described in Methods. HSP90AA1 dimer and HSP90AA1 monomer were determined by immunoblotting. (F) HSP90AA1S595D mutant reduces the binding between HSP90AA1 and HSPA/HSP70. HEK293T cells were transfected with HSP90AA1-FLAG or HSP90AA1S595D-FLAG. The lysates were precipitated with an anti-FLAG antibody and the precipitates were blotted for HSPA/HSP70 (top two panels). The whole lysates were blotted with antibodies to HSP90AA1 and ACTB (bottom two panels). (G) Overexpression of CDK5 and CDK5R1 or HSP90AA1S595D mutant decreases the binding level between HSP90AA1 and TFEB. SN4741 cells were co-transfected as indicated. HSP90AA1-FLAG, HSP90AA1S595A-FLAG or HSP90AA1S595D-FLAG was immunoprecipitated from the lysates by an anti-FLAG antibody and the precipitates were blotted with an anti-HA antibody. The same membrane was blotted with anti-FLAG. The total cell lysis was blotted with anti-HA and anti-FLAG. (H) Overexpression of CDK5 and CDK5R1 reduces starvation-induced nuclear TFEB, while HSP90AA1S595A rendered TFEB less sensitive to the effect of CDK5-CDK5R1. Cells were co-transfected with TFEB-mCherry or TFEB-mCherry, CDK5 and CDK5R1 or TFEB-mCherry and HSP90AA1S595A or TFEB-mCherry, CDK5, CDK5R1 and HSP90AA1S595A for 36 h and then starved for 1 h. Fluorescence images show TFEB-mCherry. The below graph shows the nuclear/cytoplasmic fluorescence ratio (mean ± SEM, n = 3; ***p < 0.001, N.S., not significant compared with the indicated group; scale bar: 10 μm). (I) Overexpression of CDK5 and CDK5R1 reduces starvation-induced expression of TFEB target genes. SN4741 cells were co-transfected with CDK5 and CDK5R1 for 36 h and then starved for 8 h. The mRNA levels were quantified by qPCR. The control sample without any treatment (starvation and overexpression of CDK5 and CDK5R1) was the calibrator and set as 1. All gene-specific mRNA expression values were normalized to Gapdh mRNA. All data are shown as mean ± SEM (H) or mean ± SD (I); n = 3; *p < 0.05, **p < 0.01, ***p < 0.001, N.S., not significant compared with the indicated group.
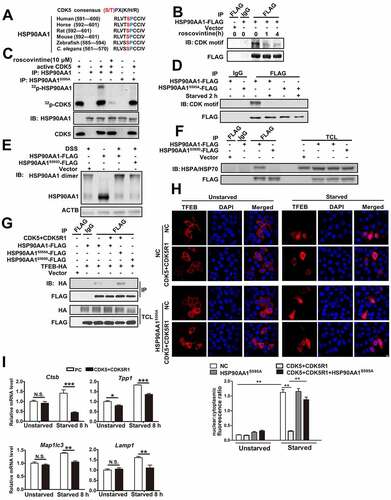
HSP90AA1 functions through dimerization [Citation34]. To determine if Ser 595 phosphorylation of HSP90AA1 might affect its dimer formation, we generated a phosphorylation mimetic HSP90AA1 mutant S595D, expressed it in HEK293T cells, treated cells with cross-linking agent, and analyzed dimer formation. Mutation of Ser595 to D did not change the level of monomeric HSP90AA1 but resulted in a significant decrease of HSP90AA1 dimer (). Furthermore, HSP90AA1S595D largely lost its ability to interact with HSPA/HSP70, a common HSP90AA1ʹs client protein in immunoprecipitation ().
To assess the role of CDK5 in modulating TFEB, we tested the binding between TFEB and HSP90AA1 by overexpressing CDK5 and CDK5R1. Increasing CDK5 and CDK5R1 level significantly inhibited the binding between HSP90AA1 and TFEB as well as starvation-induced increase of TFEB in the nucleus, while HSP90AA1S595A rendered TFEB less sensitive to the effect of CDK5 and CDK5R1 ( and Fig. S6D). Increasing CDK5 and CDK5R1 also inhibited the mRNA levels of TFEB target genes (). Similarly, overexpression of CDK5 and CDK5R1-p25 clearly inhibited TFEB activity in luciferase reporter assay (Fig. S6B) and the binding between HSP90AA1 and TFEB in HeLa cells (Fig. S6C). Together, these findings show that CDK5 phosphorylates HSP90AA1 and reduces its interaction with and the activity of TFEB.
HSP90AA1-TFEB regulatory process was involved in starvation-induced longevity in C. elegans
Because high activities of TFEB and autophagy have associated with delayed aging [Citation4,Citation5,Citation8], we assessed the role of HSP90AA1 in cellular aging model of oxidative stress-induced senescence. Analysis of the senescence-associated GLB1/β-galactosidase (SA-GLB1/β-gal) activity showed that overexpression of HSP90AA1S595A in HeLa cells reduced the activity of GLB1/β-gal compared to controls, suggesting that HSP90AA1S595A attenuates senescence process induced by oxidative stress (Fig. S7A).
We tested the role of HSP90AA1-TFEB in vivo in C. elegans. We attempted many times to generate the C. elegans carrying the equivalent mutation as human HSP90AA1S595D in its ortholog HSP-90S565D. Despite our effort, we were unable to obtain such a mutant strain. It is possible that such a mutant may be lethal for the worms. Because the hsp-90(p673) worm, which harbors a point mutation at a highly conserved E292 (E292K) that leads to a loss of HSP-90 function [Citation35], are widely used for longevity studies [Citation36], it provided us a useful alternative model.
The TFEB ortholog HLH-30 in C. elegans regulates autophagy and modulates longevity under starvation [Citation8,Citation35]. Our data above showed that HSP90AA1 promotes autophagy by enhancing TFEB’s nuclear localization under starvation. Therefore, we investigated whether orthologs HLH-30 and HSP-90 participate in starvation-induced longevity. We also tested the effect of HSP-90 on survival with hsp-90(p673) worms. To analyze the effect of hsp-90(p673) on HLH-30, we generated a strain that expresses a GFP-tagged HLH-30 in hsp-90(p673) background. Starvation analysis showed that GFP signal was highly enriched in the nuclei of intestinal cells upon starvation in wild-type (WT) animals, but not in hsp-90(p673) worms (). Prolonged starvation significantly increased the levels of mRNAs of hlh-30 and orthologs of TFEB target genes, such as lmp-1/LAMP1, lgg-1/MAP1LC3 and Atg-18, in WT animals. However, their levels remained unchanged in hsp-90(p673) worms (, Fig. S7B and S7C). To monitor the effect on autophagy, we generated a strain that expresses a GFP-tagged LGG-1 in hsp-90(p673) background or got the strain which is created by gonadal microinjection of the reporter (lgg-1p::mCherry::gfp::lgg-1). Our analysis revealed that starvation led to a great increase in the number of GFP::LGG-1-positive puncta in WT animals but this increase was significantly attenuated in hsp-90(p673) worms (). We also showed that starvation led to a significant increase of the number of red puncta but moderate increase of the number of yellow puncta, which represent AL and AP, respectively, in WT animals (Fig. S7D). But no significant increase in puncta was observed in hsp-90(p673) worms following starvation, indicating that starvation fails to enhance the autophagic flux in hsp-90(p673) worms (Fig. S7D).
Figure 7. HSP90AA1 played a role in starvation-induced longevity in C. elegans. (A) Nuclear localization of HLH-30 was visualized and quantified in the intestinal cells of WT and hsp-90(p673) animals expressing HLH-30::GFP under starvation. Synchronized worms were raised at 20°C on media plates seeded with OP50. Worms expressing HLH-30::GFP were starved for 8 h at young adults. Then worms were put on a 2% agarose pad in M9 medium containing 0.1% NaN3. The number of worms with nuclear localization of HLH-30::GFP in intestinal cells was counted within 5 min. The right graph shows the percentage of animals with HLH-30 in the nuclei of the intestinal cells (n, total number of animals observed (the number of independent experiments performed is given in parentheses), n = 120 from 3 independent experiments; scale bar: 200 μm). (B) hsp-90(p673) animals show change in the expression of hlh-30 and its target genes. Synchronized worms were grown on 20°C. At the L4 stage, worms were transferred to plates without food for 8 h or 12 h. RNA isolation and quantitative RT-PCR was performed as Methods. Data were analyzed using the Act-1 level as endogenous control. The sample of WT worms without starvation was the calibrator for the comparison of gene expression and set as 1 (n = 3). (C) The number of GFP::LGG-1 puncta is reduced in seam cells in hsp-90(p673) animals under starved. Synchronized worms were raised at 20°C on media plates seeded with OP50. Worms expressing GFP::LGG-1 were starved for 4 h at L4. Then worms were put on a 2% agarose pad in M9 medium containing 0.1% NaN3. The number of GFP::LGG-1 puncta was counted in seam cells within 5 min. The right graph shows number of GFP::LGG-1 puncta in the seam cells (n = 20 from 3 independent experiments; scale bar: 200 μm). (D) HLH-30 increases the levels of hlh-30 target genes in hsp-90(p673) animals. Synchronized worms were grown on 20°C. At the L4 stage, worms were transferred to plates without food for 24 h. RNA isolation and quantitative RT–PCR was performed as Methods. Data were analyzed using the Act-1 level as endogenous control. The sample of hsp-90(p673) worms without starvation was the calibrator and set as 1 (n = 3). (E) hsp-90(p673) animals fail to extend their lifespan upon starvation, while HLH-30 extends the lifespan of hsp-90(p673) animals. Animals were grown and treated for lifespan study as described in Methods. The curves shown represent the sum of all animals examined in three independent experiments (m, mean lifespan. P values were calculated between the experimental and control animals. For wild type (strain N2), unstarved, n = 117, m = 20 ± 0.466; starved, n = 103, m = 32 ± 0.778; p < 0.0001. For hsp-90(p673) mutant worms, unstarved, n = 110; m = 16 ± 0.653; starved, n = 125, m = 16 ± 0.498. For hlh-30::GFP; hsp-90(p673) worms, unstarved, n = 129, m = 20 ± 0.563; starved, n = 111, m = 30 ± 0.826). All data are shown as mean ± SEM, *p < 0.05, **p < 0.01, ***p < 0.001, N.S., not significant compared with the indicated group.
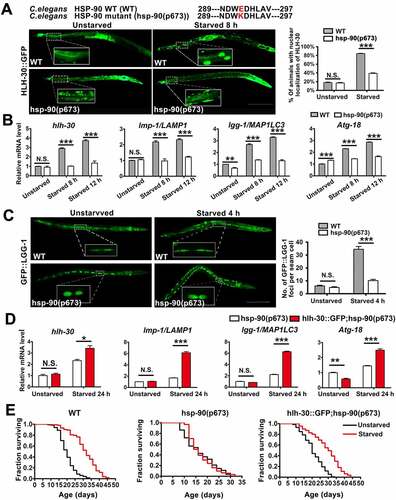
To show that HLH-30 functions downstream of HSP-90, we overexpressed HLH-30 in hsp-90(p673) worms and subjected them to starvation. Overexpressing HLH-30 caused an increase in the mRNA levels of hlh-30 and its target genes in hsp-90(p673) worms following starvation (). To test whether HSP90AA1 plays a role in starvation-induced longevity, we fed either a control diet of abundant food or a diet of complete absence of food to WT and hsp-90(p673) animals. As expected, starvation increased the lifespan in WT animals but failed to extend the lifespan in hsp-90(p673) worms (). Importantly, the high level of HLH-30 significantly extended the lifespan of starved hsp-90(p673) animals (). These findings place HLH-30 downstream of HSP-90, supporting that HSP-90-HLH-30 signaling is involved in regulating longevity in C. elegans.
Discussion
Autophagy is the major pathway for bulk degradation and functions to restore many cellular homeostasis processes that are important for the beneficial effects of many lifespan-extending manipulations. TFEB has been shown to bind to the promoter regions of multiple autophagy genes to induce AP biogenesis, AP-lysosome fusion and extend longevity [Citation7,Citation8]. Under basal condition, TFEB exists in the cytosol and is kept in an inactive state. Upon stress, it is known to be de-phosphorylated, which facilitates its subsequent transportation to the nucleus, the most important critical step in regulating TFEB activity [Citation10,Citation11]. Several kinases are involved in modulating TFEB subcellular localization. For example, MTORC1 and MAPK1/ERK2 phosphorylate TFEB at Ser211 and Ser142, respectively, to retain it in the cytoplasm [Citation10,Citation37]. However, the factors or mechanisms that facilitate TFEB nucleus transportation following dephosphorylation are still unknown. Our discovery showed that HSP90AA1 plays an important role in autophagy by regulating a critical transcription factor. In this study, we provided the first evidence demonstrating that HSP90AA1 was a key factor required for TFEB’s nuclear transportation process in response to nutrient starvation. In this context, our data revealed that autophagy process was highly sensitive to the level and activity of HSP90AA1 and demonstrated clearly that the chaperone function of HSP90AA1 was necessary for TFEB nuclear localization and autophagy flux in response to starvation-induced pro-autophagy signal. In addition to nutrient deprivation, TFEB is known to be regulated by various types of cellular stress and thus plays context-specific roles [Citation38]. Recent evidence indicates that TFEB can be activated upon direct cysteine oxidation by reactive oxygen species or in response to ER stress and damaged mitochondria [Citation39–41]. Whether the mechanism that we have identified in this study may be involved in regulating TFEB in other contexts remains to be tested.
The molecular chaperone HSP90AA1 is a key regulator in various cellular processes under a variety of physiological and pathological conditions. It functions primarily by interacting with substrate proteins and promoting their folding and activity. For example, ULK1 function requires its physical interaction with HSP90 and the kinase-specific co-chaperone CDC37. This interaction promotes ULK1 stability and activation [Citation15]. It also has been shown that HSP90AA1 forms complexes with either activators or repressors to enhance or inhibit transcriptional programs [Citation18]. Different from the mechanism by which HSP90AA1 forms a transcriptional complex in the promoter region, HSP90AA1 regulates the activity of transcriptional factors via two different mechanisms, affecting their level or their intracellular transport. HSP90AA1 also regulates the stability of transcription factors. For example, HSP90AA1 forms a complex with mutant TP53 in the cytoplasmic compartment [Citation42], while inhibition of HSP90AA1 activity causes a rapid destabilization of TP53 [Citation43]. Our new findings expanded the mechanisms by which HSP90AA1 modulated transcription factors to induce facilitation of nuclear translocation. Since HSP90AA1 had not been found to increase in the nucleus in our model, it suggested that complexing with HSP90AA1 primarily affected a cytoplasmic step(s) that ensures TFEB to the nucleus. In addition, our findings further supported the possibility that part of this facilitation may also involve preventing TFEB from being degraded once it was mobilized in the cytoplasm in response to signals.
HSP90AA1 protein can homodimerize [Citation44]. It is interesting to note that HSP90AA1 and client protein interactions may occur independent of the dimerization [Citation45,Citation46]. Our data suggested that HSP90AA1 Ser 595 phosphorylation had at least two distinct effects on HSP90AA1. Firstly, HSP90AA1 Ser 595 phosphorylation significantly attenuated the binding between HSP90AA1 and TFEB. Secondly, this phosphorylation also resulted in a significant decrease of HSP90AA1 dimer. Although HSP90AA1 M domain alone cannot form dimmer, HSP90AA1-M is sufficient to interact with TFEB. Consistent with reports for some other HSP90AA1 client proteins [Citation45,Citation46], our data supported the interpretation that dimerization and binding to client proteins could be uncoupled experimentally and are not necessarily dependent on each other.
Several kinases such as PRKA [Citation24], PRKCG [Citation25], and CSNK2 [Citation26] have been shown to phosphorylate HSP90AA1 and impair HSP90AA1 chaperone function, while YES1, a member of SRC non-receptor tyrosine kinase family, phosphorylates HSP90AA1 and stimulates its activity by promoting the formation of HSP90AA1-AHSA1/AHA1 ATPase-active chaperone complex [Citation47]. Recent quantitative analyses of HSP90AA1 clients indicate that HSP90AA1 interacts with many human protein kinase [Citation27]. Our current studies added CDK5 to the list of kinases that directly regulated HSP90AA1. Many pathogenic stress signals are known to activate CDK5. Abnormal high level of CDK5 activity has been shown to occur in conditions associated with Alzheimer disease (AD) and Parkinson disease (PD) and proposed to contribute to neurodegenerative processes [Citation48]. It will be important to investigate if HSP90AA1-TFEB regulatory axis is dysfunctional under neuropathogenic stress and if the loss of anti-aging effect from this pathway underlies, at least in part, the increased risk of neurodegeneration with aging.
For any living organism, aging is an inevitable and spontaneous process as time passes. Studies have shown that calorie restriction (CR) extends the lifespan in several model organisms [Citation49]. A complete removal of food during adulthood increases both median and maximum lifespan in C. elegans [Citation50]. Similarly, replacing growth medium with water also extends the lifespan of S. cerevisiae [Citation51]. While the reason that CR extends lifespan may be complex, one of the most sensitive molecular processes to CR is autophagy. Given its central role in clearing cellular damages and maintaining homeostasis, it is not surprising that level of autophagy has been closely linked to aging with reduced autophagy correlating with an accelerated aging whereas high autophagy having a potent anti-aging effect [Citation1]. HLH-30 (TFEB ortholog in C. elegans), as an important transcriptional factor for autophagy, has been found to play a critical role in six mechanistically distinct C. elegans longevity models, including CR model [Citation8]. However, it remains to be investigated how the activity of HLH-30 is regulated by longevity signals in C. elegans [Citation52]. Our study identified HSP90AA1 as a candidate regulator. We showed that HSP90AA1 ortholog HSP-90 regulated autophagy process and promoted HLH-30ʹs nuclear localization and transcriptional function under starvation. Since hsp-90(p673) mutant worms were impaired in starvation-induced longevity while HLH-30 restores it, HSP-90-HLH-30 signaling appeared to be indispensable for starvation-induced longevity in vivo. Our data also indicated that starvation suppressed CDK5 activity and released HSP90AA1ʹs function, which in turn increased TFEB’s activity and autophagy flux. Thus, our findings provided evidence supporting HSP90AA1-TFEB signaling as a pathway that regulated autophagy and longevity in response to starvation condition.
Materials and methods
Animals
Strains were maintained at 20°C using standard methods and fed on Escherichia coli OP50. Strains used in this study include: wild-type N2 (Bristol), DA2123 adls2122 [lgg-1p::GFP::lgg-1 + rol-6(su1006)], PR673 hsp-90(p673) V, MAH235 sqls19 [hlh-30p::hlh-30::GFP+ rol-6(su1006)], CSM1167 adls2122 [lgg-1p::GFP::lgg-1 + rol-6(su1006)]; hsp-90(p673) V, CSM1168 sqls19 [hlh-30p::hlh-30::GFP + rol-6(su1006)]; hsp-90(p673) V.
Plasmids
pcDNA3.1-HSP90AA1-FLAG, pcDNA3.1-HSP90AA1N-FLAG, pcDNA3.1-HSP90AA1C-FLAG or pcDNA3.1-HSP90AA1M-FLAG were gifts from Dr. Mehdi Mollapour (SUNY Upstate Medical University, USA) [Citation53]; pcDNA3.1-HSP90AA1S595D-FLAG and pcDNA3.1-HSP90AA1S595A-FLAG were generated from wt-HSP90AA1 with primers: F: 5’-CAATACAGCATGGATCTGTCACCAATCGGTTTGACACAACCA-3’ and R: 5’ – TGGTTGTGTCAAACCGATTGGTGACAGATCCATGCTGTATTG-3’ and F: 5’ -GACAATACAGCATGGAGCTGTCACCAATCGGTTTG-3’ and R: 5’ -CAAACCGATTGGTGACAGCTCCATGCTGTATTGTC-3’, respectively, with QuickChange II XL Site-Directed Mutagenesis kit (Agilent Technologies Inc, 200,522); HSV-CDK5, HSV-CDK5R1 and HSV-p25 were gifts from Dr. Li-Huei Tsai (Harvard Medical School and Howard Hughes Medical Institute, USA) [Citation54]; TFEB complementary DNA was synthesized in HA-tagged pcDNA3.1 vector backbone (Thermo Fisher Scientific, V79520) or mCherry-tagged pCS2 vector backbone (Addgene, 34,935; deposited by Amro Hamdoun Lab).
Microbe strains
E. coli (OP50) bacteria were cultured in a shaker overnight in LB (10 g/L tryptone, 5 g/L yeast extract, 10 g/L NaCl, pH 7.4) at 37°C, after which 200 mL of liquid culture was seeded on plates to grow for 18 h at 37°C.
Cell lines
SN4741 cells were cultured at 33°C with 5% CO2 in RF medium (DMEM [Corning, 10–013-CV] with 10% FBS [AusGeneX, FBS500-S], 1% D-glucose [Sigma-Aldrich, G7021], 1% penicillin-streptomycin [Hyclone, SV30010], and 140 mM L-glutamine [Gibco, 56–85-9]). Experiments were usually done when cells reached suitable density. Cortical neurons were grown in primary culture according to a previously described protocol. Cells were cultured for 14 days before use in the experiments. HAP1 cells were cultured at 37°C with 5% CO2 in Iscove’s Modified Dulbecco’s Medium (IMDM; Fisher Scientific, 12,440,061) supplemented with 10% FBS and 1% penicillin-streptomycin.
Cells treatment
Cells were treated with HBSS (Gibco, 14,025,076) media with Ca2+ and Mg2+ supplemented with 10 mM HEPES (Sigma-Aldrich, PHR1428) for starvation for indicated time. For some experiments, cells were pretreated with HSP90AA1 inhibitors 17-AAG (Abcam, 141,433) or novobiocin sodium (Millipore, 491,207) for 0.5 h before starvation. During the subsequent starvation phase, HSP90AA1 inhibitors were added to the starvation medium with or without BafA1 (Abcam, 120,497). Cells were also treated with roscovitine (Sigma-Aldrich, 557,360), the inhibitor of CDK5, for indicated time.
Transfection and siRNA
Both plasmids and siRNA were transfected with the Lipofectamine 2000 reagent (Invitrogen, 11,668,019) according to the manufacturer’s instructions.
Nuclear-cytoplasmic fractionation
Cells were lysed in Nuclei ez lysis buffer (Sigma-Aldrich, NUC101) supplemented with fresh protease inhibitor (Millipore, 539,134) and phosphatase inhibitor (Millipore, 524,627) for 10 min. And then, the lysate was centrifugated for 5 min at 500 g/min. The supernatant represented cytoplasmic fraction while pellet (nuclear fraction) was washed three times and lysed in RIPA buffer (Millipore, 20–188) and sonicated.
Immunoblotting
Cells were harvested and incubated in ice-cold RIPA buffer supplemented with protease and phosphatase inhibitors for 30 min. Samples were then clarified by centrifugation and the protein content was measured using the BCA assay. Protein was separated by 10%-15% sodium dodecyl sulfate polyacrylamide gel electrophoresis, and then the separated protein was transferred onto polyvinylidene fluoride membranes (Roche, 03010040001). After 2 h blocking with 5% fat-extracted milk at room temperature, the membranes were incubated overnight at 4°C with primary antibodies against MAP1LC3B (Cell Signaling Technology, 43,566), SQSTM1 (Cell Signaling Technology, 5114), TFEB (Cell Signaling Technology, 37,785), HSP90AA1 (Cell Signaling Technology, 4877), PARP1 (Cell Signaling Technology, 9532), histone H3 (Cell Signaling Technology, 4499), CDK5 (Cell Signaling Technology, 14,145), FLAG (Sigma-Aldrich, F1804), HA (Cell Signaling Technology, 3724), CDK5R1/p25 (Cell Signaling Technology, 2680), histone H1 (Merck Millipore, 14–155), MAPK/CDK motif (Cell Signaling Technology, 2325), HSPA/HSP70 (Cell Signaling Technology, 4873) and GAPDH (Cell Signaling Technology, 5174). Then the membranes were washed with TBST three times and then were treated with horseradish peroxidase-conjugated secondary antibody for 2 h at room temperature. Protein bands were visualized by chemiluminescence detection.
Quantitative real-time PCR
Total RNA was extracted from each sample according to the manufacturer’s protocol for TRIzol reagent (Roche, 11,667,165,001). Complementary DNA (cDNA) was generated from total RNA using Transcriptor First Strand cDNA Synthesis Kit (Roche, 04896866001), using a final volume of 20 μl. Quantitative real-time PCR (qPCR) analysis was performed in triplicate using a SYBR qPCR Master Mix (Vazyme, Q311-02).
For C. elegans experiments, synchronized worms were grown on 20°C. At the L4 stage, worms were transferred to plates without food for indicated time. RNA isolation and quantitative RT–PCR was performed as above. Sequences of primers are listed in Table S1.
Immunoprecipitation
Cell lysates were harvested, and protein content was measured as described above. The lysates containing equal amounts of protein were incubated with the specific primary antibody more than 16 h at 4°C. After that, incubate with protein A/G agarose beads (Santa Cruz Biotechnology, sc-2003) for 6 h. Thereafter, the precipitants were washed five times with ice-cold lysis buffer, and the immunocomplexes were eluted with sample buffer containing 1% SDS for10 min at 100°C and analyzed by 10% SDS-PAGE using the specific antibodies.
HSP90AA1 dimer assay
Cells were harvested and shaken with disuccinimidyl suberate (DSS; Thermo Fisher Scientific, A39267), a noncleavable and membrane permeable crosslinker, for 30 min at room temperature in the dark. The final concentration is 4 mM Tris-HCl (pH is 7 and final concentration is 20 mM) was added to the tube and it was shaken for 15 min in dark. And then, samples were collected by centrifugation. The precipitate was tested by immunoblotting as above.
Luciferase assay
Luciferase reporter assay was performed with a reporter carrying four tandem copies of TFEB binding sites [Citation10,Citation11]. Briefly, luciferase reporters with or without TFEB binding sites were transfected into SN4741 cells using Lipofectamine 2000 reagent for 36 h. The cells were starved with or without 17-AAG treatment. For HeLa cells, luciferase reporter was transfected along with TFEB-HA plasmid or vector with or without si-Hsp90aa1 for 36 h. Plasmid encoding GLB1/β-galactosidase was co-transfected as a standard control. After that, cells were lysed at room temperature and luciferase activities were determined by using D-(-)-luciferin (Promega, E1910) as the substrate. GLB1/β-galactosidase activities were determined with Galacto-Light Plus (Thermo Fisher Scientific, T1009) as the substrate. The chemiluminescence from activated luciferin or Galacto-Light Plus was measured on a luminometer plate reader (Molecular Devices, CA, US). The experiment was performed at least three times.
In vitro kinase assay
Purified HSP90AA1-FLAG or HSP90AA1S595A-FLAG which was immunoprecipitated from cell extracts were incubated with active CDK5 (Thermo Fisher Scientific, PV4677), or purified CDK5 which was immunoprecipitated from cell extracts with commercial histone H1 in a kinase reaction buffer (Thermo Fisher Scientific, PV3189) containing [γ-32P] and cold ATP. In brief, cell lysates were harvested, and protein content was measured as described above. For immunoprecipitation, the lysates containing equal amounts of protein were incubated with the specific primary antibody for more than 16 h at 4°C, and then incubated with protein A/G Sepharose for 6 h. The beads were washed with kinase buffer five times. The kinase reaction was carried out for 30 min at 30°C and terminated by the addition of laemmli sample buffer. Reaction products were resolved by SDS-PAGE, and 32P-labeled proteins were visualized by autoradiography.
Senescence-associated GLB1/β-galactosidase activity assay
HeLa cells were seeded at the density of 0.4 × 10⁴ cells/cm2 in 6-well dishes, cultured, and transfected with HSP90AA1S595A-FLAG and pcDNA3.1 for 48 h. Cells were treated with 400 uM H2O2 for another 4 h. Senescence-associated GLB1/β-galactosidase (SA-GLB1/β-gal) activity was detected with the Senescence Associated beta-Galactosidase Staining Kit (Beyotime, C0602) according to the manufacturer’s protocol. Quantification of SA-GLB1/β-gal-positive cells was carried out by counting cells at four random fields per dish and assessing the percentage of SA-GLB1/β-gal-positive cells from at least 200 cells per dish.
Lifespans
Lifespan assays were performed as described previously [Citation44]. Synchronized animals were fed on NGM plates (2.5 g/L peptone, 3.0 g/L sodium chloride, 0.111 g/L calcium chloride, 0.12 g/L magnesium sulfate, 0.005 g/L Cholesterol, 3.4 g/L potassium phosphate monobasic, 17.0 g/L agar) containing UV-killed OP50. L4 animals then were transferred to fresh NGM + UV-killed OP50 supplemented with 50 µM FUDR (5-fluorodeoxyuridine; Sigma-Aldrich, F0503) to prevent eggs from hatching. At the second day of adulthood animals were transferred to experimental media: NGM + UV-killed OP50 + 50 µM FUDR (control groups) or NGM + 50 µM FUDR (starvation groups). Fed animals were transferred to fresh plates every 2 days to prevent depletion of the food source and scored every other day. Animals were judged as dead when they ceased pharyngeal pumping and did not respond to prodding with a platinum wire. Lifespan time = 0 was the first day of synchronized animals. Experiments were performed three times. Lifespan analysis was performed using GraphPad Prism. Using the log-rank (Mantel-Cox method) p-values were calculated for three lifespan experiments.
Immunofluorescence
Cells were washed with PBS (Corning, 21–040-CM) 3 times and fixed with 4% formaldehyde solution. Samples transfected with RFP-GFP-MAP1LC3B plasmids were incubated with DAPI (Sigma-Aldrich, D9542) for 10 min. Cells transfected with HSP90AA1-FLAG and TFEB-HA were incubated at 4°C overnight with primary antibodies of anti-FLAG and anti-HA; then they were washed three times with PBS and incubated with secondary antibody in room temperature for 2 h. After counterstained with DAPI, they were photographed by a confocal microscope (Nikon, Tokyo, Japan).
For C. elegans experiments, synchronized worms were raised at 20°C on media plates seeded with OP50. Worms expressing HLH-30::GFP were starved for 8 h at young adults, while worms expressing GFP::LGG-1 were starved for 4 h at L4. Then worms were put on a 2% agarose pad in M9 medium containing 0.1% NaN3. The number of worms with nuclear localization of HLH-30::GFP in intestinal cells was counted within 5 min and the number of GFP::LGG-1 puncta was also counted in seam cells using a Leica fluorescence microscope.
Statistical analysis
The results were repeated at least three experiments (n = 3). Statistical analyses were performed by the Analysis of Variance (ANOVA). Differences were accepted as significant at p < 0.05. One-way ANOVA was used for single variable samples, while two-way ANOVA was used for bivariate samples.
Supplemental Material
Download MS Word (56.3 MB)Acknowledgments
We thank Hong Zhang for the C. elegans strain of MAH235.
Disclosure statement
The authors declare that they have no competing interests.
Supplementary material
Supplemental data for this article can be accessed online at https://doi.org/10.1080/15548627.2022.2105561
Additional information
Funding
References
- Rubinsztein DC, Marino G, Kroemer G. Autophagy and aging. Cell. 2011;146:682–695.
- Kapahi P, Chen D, Rogers AN, et al. With TOR, less is more: a key role for the conserved nutrient-sensing TOR pathway in aging. Cell Metab. 2010;11:453–465.
- Guo H, Chitiprolu M, Gagnon D, et al. Autophagy supports genomic stability by degrading retrotransposon RNA. Nat Commun. 2014;5:5276.
- Lipinski MM, Zheng B, Lu T, et al. Genome-wide analysis reveals mechanisms modulating autophagy in normal brain aging and in Alzheimer’s disease. Proc Natl Acad Sci U S A. 2010;107:14164–14169.
- Pyo JO, Yoo SM, Ahn HH, et al. Overexpression of Atg5 in mice activates autophagy and extends lifespan. Nat Commun. 2013;4:2300.
- Steingrimsson E, Copeland NG, Jenkins NA. Melanocytes and the microphthalmia transcription factor network. Annu Rev Genet. 2004;38:365–411.
- Palmieri M, Impey S, Kang H, et al. Characterization of the CLEAR network reveals an integrated control of cellular clearance pathways. Hum Mol Genet. 2011;20:3852–3866.
- Lapierre LR, De Magalhaes Filho CD, McQuary PR, et al. The TFEB orthologue HLH-30 regulates autophagy and modulates longevity in caenorhabditis elegans. Nat Commun. 2013;4:2267.
- O’Rourke EJ, Ruvkun G. MXL-3 and HLH-30 transcriptionally link lipolysis and autophagy to nutrient availability. Nat Cell Biol. 2013;15:668–676.
- Sardiello M, Palmieri M, Di Ronza A, et al. A gene network regulating lysosomal biogenesis and function. Science. 2009;325:473–477.
- Settembre C, Di Malta C, Polito VA, et al. TFEB links autophagy to lysosomal biogenesis. Science. 2011;332:1429–1433.
- Picard D. Heat-shock protein 90, a chaperone for folding and regulation. Cell Mol Life Sci. 2002;59:1640–1648.
- Morley JF, Morimoto RI. Regulation of longevity in Caenorhabditis elegans by heat shock factor and molecular chaperones. Mol Biol Cell. 2004;15:657–664.
- Xu C, Liu J, Hsu LC, et al. Functional interaction of heat shock protein 90 and Beclin 1 modulates Toll-like receptor-mediated autophagy. FASEB J. 2011;25:2700–2710.
- Joo JH, Dorsey FC, Joshi A, et al. Hsp90-Cdc37 chaperone complex regulates Ulk1- and Atg13-mediated mitophagy. Mol Cell. 2011;43:572–585.
- Alemu EA, Lamark T, Torgersen KM, et al. ATG8 family proteins act as scaffolds for assembly of the ULK complex: sequence requirements for LC3-interacting region (LIR) motifs. J Biol Chem. 2012;287:39275–39290.
- Seguin-Py S, Lucchi G, Croizier S, et al. Identification of HSP90 as a new GABARAPL1 (GEC1)-interacting protein. Biochimie. 2012;94:748–758.
- Khurana N, Bhattacharyya S. Hsp90, the concertmaster: tuning transcription. Front Oncol. 2015;5:100.
- Wang SA, Chuang JY, Yeh SH, et al. Heat shock protein 90 is important for Sp1 stability during mitosis. J Mol Biol. 2009;387:1106–1119.
- Shaffer AL, Yu X, He Y, et al. BCL-6 represses genes that function in lymphocyte differentiation, inflammation, and cell cycle control. Immunity. 2000;13:199–212.
- Gilmore TD. Introduction to NF-kappaB: players, pathways, perspectives. Oncogene. 2006;25:6680–6684.
- Cerchietti LC, Lopes EC, Yang SN, et al. A purine scaffold Hsp90 inhibitor destabilizes BCL-6 and has specific antitumor activity in BCL-6-dependent B cell lymphomas. Nat Med. 2009;15:1369–1376.
- Stark GR, Darnell JE Jr. The JAK-STAT pathway at twenty. Immunity. 2012;36:503–514.
- Wang X, Lu XA, Song X, et al. Thr90 phosphorylation of Hsp90alpha by protein kinase A regulates its chaperone machinery. Biochem J. 2012;441:387–397.
- Lu XA, Wang X, Zhuo W, et al. The regulatory mechanism of a client kinase controlling its own release from Hsp90 chaperone machinery through phosphorylation. Biochem J. 2014;457:171–183.
- Mollapour M, Tsutsumi S, Truman AW, et al. Threonine 22 phosphorylation attenuates Hsp90 interaction with cochaperones and affects its chaperone activity. Mol Cell. 2011;41:672–681.
- Mertins P, Mani DR, Ruggles KV, et al. Proteogenomics connects somatic mutations to signalling in breast cancer. Nature. 2016;534:55–62.
- Dhavan R, Tsai L-H. A decade of CDK5. Nat Rev Mol Cell Biol. 2001;2(10):749–759.
- Son JH, Chun HS, Joh TH, et al. Neuroprotection and neuronal differentiation studies using substantia nigra dopaminergic cells derived from transgenic mouse embryos. J Neurosci. 1999;19(1):10–20.
- Li W, Zhu J, Dou J, et al. Phosphorylation of LAMP2A by p38 MAPK couples ER stress to chaperone-mediated autophagy. Nat Commun. 2017;8:1763.
- Wang B, Cai Z, Tao K, et al. Essential control of mitochondrial morphology and function by chaperone-mediated autophagy through degradation of PARK7. Autophagy. 2016;12:1215–1228.
- Yang Q, She H, Gearing M, et al. Regulation of neuronal survival factor MEF2D by chaperone-mediated autophagy. Science. 2009;323:124–127.
- Tsai LH, Delalle I, Caviness VS, et al. p35 is a neural-specific regulatory subunit of cyclin-dependent kinase 5. Nature. 1994;371:419–423.
- Ratzke C, Mickler M, Hellenkamp B, et al. Dynamics of heat shock protein 90 C-terminal dimerization is an important part of its conformational cycle. Proc Natl Acad Sci U S A. 2010;107:16101–16106.
- Gaiser AM, Kaiser CJ, Haslbeck V, et al. Downregulation of the Hsp90 system causes defects in muscle cells of Caenorhabditis elegans. PloS one. 2011;6:e25485.
- Somogyvari M, Gecse E, Soti C. DAF-21/Hsp90 is required for C. elegans longevity by ensuring DAF-16/FOXO isoform A function. Sci Rep. 2018;8:12048.
- Martina JA, Chen Y, Gucek M, et al. MTORC1 functions as a transcriptional regulator of autophagy by preventing nuclear transport of TFEB. Autophagy. 2012;8:903–914.
- Raben N, Puertollano R. TFEB and TFE3: linking lysosomes to cellular adaptation to stress. Annu Rev Cell Dev Biol. 2016;32:255–278.
- Wang H, Wang N, Xu D, et al. Oxidation of multiple MiT/TFE transcription factors links oxidative stress to transcriptional control of autophagy and lysosome biogenesis. Autophagy. 2020;16:1683–1696.
- Martina JA, Diab HI, Brady OA, et al. TFEB and TFE3 are novel components of the integrated stress response. EMBO J. 2016;35:479–495.
- Siddiqui A, Bhaumik D, Chinta SJ, et al. Mitochondrial quality control via the PGC1alpha-TFEB signaling pathway is compromised by parkin Q311X mutation but independently restored by rapamycin. J Neurosci. 2015;35:12833–12844.
- Sepehrnia B, Paz IB, Dasgupta G, et al. Heat shock protein 84 forms a complex with mutant p53 protein predominantly within a cytoplasmic compartment of the cell. J Biol Chem. 1996;271:15084–15090.
- Dasgupta G, Momand J. Geldanamycin prevents nuclear translocation of mutant p53. Exp Cell Res. 1997;237:29–37.
- Rohl A, Rohrberg J, Buchner J. The chaperone Hsp90: changing partners for demanding clients. Trends Biochem Sci. 2013;38:253–262.
- Zhang R, Luo D, Miao R, et al. Hsp90-Akt phosphorylates ASK1 and inhibits ASK1-mediated apoptosis. Oncogene. 2005;24:3954–3963.
- Sato S, Fujita N, Tsuruo T. Modulation of Akt kinase activity by binding to Hsp90. Proc Natl Acad Sci U S A. 2000;97:10832–10837.
- Xu W, Mollapour M, Prodromou C, et al. Dynamic tyrosine phosphorylation modulates cycling of the HSP90-P50(CDC37)-AHA1 chaperone machine. Mol Cell. 2012;47:434–443.
- Cheung ZH, Ip NY. Cdk5: a multifaceted kinase in neurodegenerative diseases. Trends Cell Biol. 2012;22:169–175.
- Hou L, Wang D, Chen D, et al. A systems approach to reverse engineer lifespan extension by dietary restriction. Cell Metab. 2016;23:529–540.
- Kaeberlein TL, Smith ED, Tsuchiya M, et al. Lifespan extension in Caenorhabditis elegans by complete removal of food. Aging Cell. 2006;5:487–494.
- Wei M, Fabrizio P, Hu J, et al. Life span extension by calorie restriction depends on Rim15 and transcription factors downstream of Ras/PKA, Tor, and Sch9. PLoS Genet. 2008;4:e13.
- Rehli M, Den Elzen N, Cassady AI, et al. Cloning and characterization of the murine genes for bHLH-ZIP transcription factors TFEC and TFEB reveal a common gene organization for all MiT subfamily members. Genomics. 1999;56:111–120.
- Woodford MR, Dunn DM, Blanden AR, et al. The FNIP co-chaperones decelerate the Hsp90 chaperone cycle and enhance drug binding. Nat Commun. 2016;7:12037.
- Patrick GN, Zukerberg L, Nikolic M, et al. Conversion of p35 to p25 deregulates Cdk5 activity and promotes neurodegeneration. Nature. 1999;402:615–622.