
ABSTRACT
Glioblastoma multiforme (GBM) is the most common brain malignancy insensitive to radiotherapy (RT). Although macroautophagy/autophagy was reported to be a fundamental factor prolonging the survival of tumors under radiotherapeutic stress, the autophagic biomarkers coordinated to radioresistance of GBM are still lacking in clinical practice. Here we established radioresistant GBM cells and identified their protein profiles using tandem mass tag (TMT) quantitative proteomic analysis. It was found that SDC1 and TGM2 proteins were overexpressed in radioresistant GBM cells and tissues and they contributed to the poor prognosis of RT. Knocking down SDC1 and TGM2 inhibited the fusion of autophagosomes with lysosomes and thus enhanced the radiosensitivity of GBM cells. After irradiation, TGM2 bound with SDC1 and transported it from the cell membrane to lysosomes, and then bound to LC3 through its two LC3-interacting regions (LIRs), coordinating the encounter between autophagosomes and lysosomes, which should be a prerequisite for lysosomal EPG5 to recognize LC3 and subsequently stabilize the STX17-SNAP29-VAMP8 QabcR SNARE complex assembly. Moreover, when combined with RT, cystamine dihydrochloride (a TGM2 inhibitor) extended the lifespan of GBM-bearing mice. Overall, our findings demonstrated the EPG5 tethering mode with SDC1 and TGM2 during the fusion of autophagosomes with lysosomes, providing new insights into the molecular mechanism and therapeutic target underlying radioresistant GBM.Abbreviations: BafA1: bafilomycin A1; CQ: chloroquine; Cys-D: cystamine dihydrochloride; EPG5: ectopic P-granules 5 autophagy tethering factor; GBM: glioblastoma multiforme; GFP: green fluorescent protein; LAMP2: lysosomal associated membrane protein 2; LIRs: LC3-interacting regions; MAP1LC3/LC3: microtubule associated protein 1 light chain 3; NC: negative control; RFP: red fluorescent protein; RT: radiotherapy; SDC1: syndecan 1; SNAP29: synaptosome associated protein 29; SQSTM1/p62: sequestosome 1; STX17: syntaxin 17; TGM2: transglutaminase 2; TMT: tandem mass tag; VAMP8: vesicle associated membrane protein 8; WT: wild type
Introduction
Glioblastoma multiforme (GBM) is a WHO grade IV brain malignancy and represents one of the most lethal human cancers with 5-year survival of 7.2% [Citation1]. Owing to the highly infiltrative nature of GBM, surgical curative resection provides quite marginal benefits [Citation2]. The adjuvant radiotherapy (RT) is considered an opportunity to prolong the survival [Citation3]. Nevertheless, GBM is not sensitive to ionizing radiation [Citation4]. In this setting, the present study investigated the molecular mechanisms associated with GBM radioresistance and explored the potential novel strategy to improve the outcome of GBM RT.
Autophagy is an evolutionarily conserved dynamic cellular process for the catabolism of proteins and damaged organelles in a lysosome-dependent manner [Citation5,Citation6]. It plays a vital role in metabolism and serves as a protective guard for cells and tissues under sublethal stress conditions [Citation7]. With respect to malignancies, autophagy-mediated intracellular catabolism acts as a survival-promoting process for tumors in response to treatments such as RT. As such, autophagy is considered an adaptive mechanism that leads to tumors’ acquisition of resistance to therapies [Citation8]. In the treatment of cancers such as GBM, it is very meaningful to study inhibitors against this survival response [Citation9–11]. However, the attempts to suppress autophagy involved nonspecific agents with high toxicity, which limited their clinical applications [Citation12]. Improved insight into the molecular mechanism of autophagy could discover novel agents selectively and specifically elevating the anti-tumor efficiency of RT.
In the current study, we established radioresistant GBM cells from its parental cell line and screened the differentially expressed genes by tandem mass tag (TMT) quantitative proteomic analysis. Among the upregulated genes, we characterized and identified two novel genes SDC1 (syndecan 1) and TGM2 (transglutaminase 2) associated with GBM radioresistance. Both of them were reported to promote cancer progression and metastasis, sustain cell stemness and act as biomarkers of prognosis [Citation13–15]. However, the roles of SDC1 and TGM2 in tumor autophagy and radioresistance have not yet been demonstrated. Therefore, we investigated the molecular interaction mode of SDC1 and TGM2 contributing to autophagic activity and disclosed that SDC1 and TGM2 facilitated the fusion of autophagosomes with lysosomes by engaging the lysosomal tethering factor EPG5-mediated SNARE assembly. Our data provided a novel insight into autophagosome maturation and demonstrated the pivotal role of SDC1 and TGM2 in GBM radioresistance.
Results
The autophagic activity was enhanced in radioresistant GBM cells
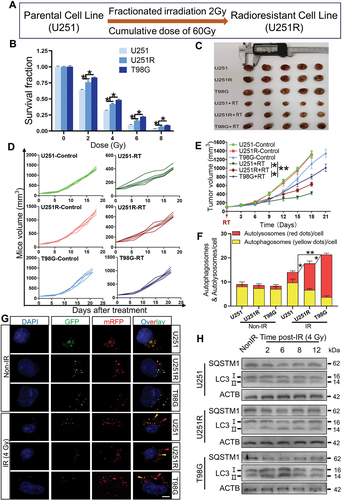
To reveal the molecular mechanisms of GBM radioresistance, we firstly established the radioresistant U251R cells by irradiating U251 cells with fractionated doses of X-rays (), and confirmed that the radioresistance of U251R was significantly higher than its parental U251 cells, while still lower than T98G cells with extremely high malignancy (). Consistently, the radiosensitivity of xenografts of U251, U251R and T98G cells in mice also decreased orderly (). Next, we sought the difference in autophagic activity between radiosensitive and radioresistant cells by transiently transfecting mRFP-GFP-LC3 adenovirus vector into GBM cells in order to localize and assess the autophagic flux. The GFP was sensitive to acidic change owing to the fusion of autophagosomes with lysosomes, while mRFP was stable. It was observed that radiation induced autolysosome formation (also known as autophagosome maturation) was enhanced in radioresistant GBM cells (). To validate the increased autophagic flux in radioresistant cells, we also detected the expression levels of autophagic markers MAP1LC3/LC3 and SQSTM1/p62. Compared with radiosensitive cells, the ratio of LC3-II:I and SQSTM1 degradation were elevated in radioresistant cells within 12 h, especially at 6 h after irradiation (), which indicated a sustained autophagic activation [Citation16]. When the cells were treated with rapamycin (50 nM, an autophagy activator) or bafilomycin A1 (BafA1, 100 nM, an autophagy inhibitor) for 2 h before irradiation, it was found that enhancement of autophagy attenuated cell killing response to irradiation (Fig. S1A-C), while inhibition of autophagy increased radiosensitivity of GBM cells (Fig. S1D-F). These results suggested the radioresistance of GBM cells was correlated with the enhancement of autophagic activity.
Figure 1. The radioresistance of GBM cells was associated with the enhancement of autophagic activity. (A) Pattern of the establishment of U251R radioresistant cell line. (B) The radiosensitivity of U251, U251R and T98G cells were assessed by colony formation assay. (C) Representative images of xenograft tumors from U251, U251R and T98G cells with or without irradiation. (D-E) Tumor growth curves (E) for each mouse (D) in the indicated groups (n = 5 per group). (F-G) Average number of autophagosomes and autolysosomes per GBM cell with or without 4 Gy irradiation and the representative images of autophagy indicated by the expression of mRFP-GFP-LC3 fusion protein (scale bars: 10 μm). (H) Western blot analysis of the protein levels of SQSTM1 and LC3 in GBM cells at different times after 4 Gy irradiation. *P < 0.05 and **P < 0.01.
SDC1 and TGM2 were upregulated in GBM patients and associated with poor prognosis
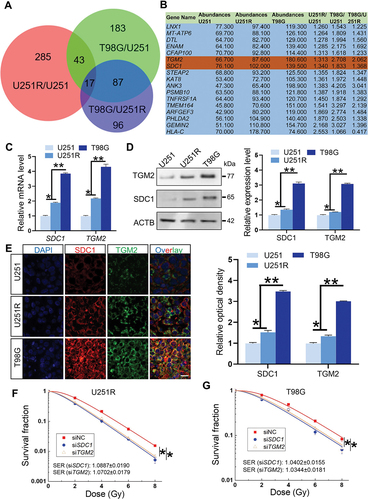
To identify the key genes potentially participating in GBM radioresistance, we pairwise divided U251, U251R and T98G cells into three groups: U251R/U251, T98G/U251 and T98G/U251R, and investigated the differentially expressed genes between them according to TMT quantitative proteomic analysis (Fig. S2A-C). In the present study, we mainly focused on the upregulated genes that could serve as therapeutic targets or prognostic biomarkers, and found that a total of 17 genes were simultaneously upregulated among these groups (), where SDC1 and TGM2 genes were both overexpressed in GBM patients (Fig. S2D-E) and contributed to poor prognosis (Fig. S2F-G). Furthermore, the histologic staining assay showed that SDC1 and TGM2 were upregulated in GBM tissues insensitive to radiotherapy (Fig. S2H-I). Due to these clinical values, SDC1 and TGM2 were further investigated for their interaction.
Figure 2. SDC1 and TGM2 enhanced radioresistance of GBM cells. (A) Wayne chart of the overexpressed genes in U251R and T98G cells in comparison with U251 or U251R cells. The interaction contains 17 genes. (B) List of above 17 upregulated genes. (C) Real-time PCR analysis of SDC1 and TGM2 mRNA levels in U251, U251R and T98G cells. (D) Western blot analysis (left) and quantification (right) of SDC1 and TGM2 protein expression levels in U251, U251R and T98G cells. (E) Immunofluorescence staining (left) of SDC1 and TGM2 and their relative densities (right) in xenografts of U251, U251R and T98G cells. Scale bars: 20 μm. (F-G) Dose responses of the survival fractions of U251R (F) and T98G (G) cells transfected with siNC (negative control), siSDC1 and siTGM2, respectively. *P < 0.05 and **P < 0.01.
The protein interaction network analysis suggested that SDC1 and TGM2 had an indirect linkage (Fig. S3A). Clinically, SDC1 and TGM2 overexpression was found to be co-occurrence (Fig. S3B). In 141 GBM patients, neither SDC1 or TGM2 was altered in 129 patients; SDC1 overexpressed while TGM2 did not in 2 patients. TGM2 overexpressed while SDC1 did not in 7 patients. SDC1 and TGM2 simultaneous overexpressed in 3 patients. Odds ratio (OR = (Neither × Both)/(A Not B × B Not A)) quantified a strong relevance of SDC1 and TGM2 overexpression. Meanwhile, Spearman and Pearson correlation analysis revealed a positive relation between SDC1 and TGM2 expression in GBM patients (Fig. S3C). Collectively, these findings demonstrated that SDC1 and TGM2 were simultaneously elevated in radioresistant GBM cells and tissues and contributed to tumor development and poor prognosis.
SDC1 and TGM2 enhanced cell radioresistance and autophagy by promoting autophagosome maturation
To further disclose the function of SDC1 and TGM2 on GBM radioresistance, we detected the transcriptional and protein levels of SDC1 and TGM2 by PCR and western blot, respectively, and found that they increased orderly in U251, U251R and T98G cells () i.e. having a positive correlation with radiation resistance. This correlation was also demonstrated by the immunofluorescence staining of SDC1 and TGM2 proteins in the xenografts of U251, U251R and T98G cells (). Moreover, when GBM cells were interfered with siRNA against SDC1 and TGM2 (siSDC1 and siTGM2) to knock down SDC1 and TGM2 effectively (Fig. S4A-B), the survival fractions of U251R and T98G cells exposed to X-rays were significantly decreased (), indicating that SDC1 and TGM2 contributed to radioresistance of GBM cells.
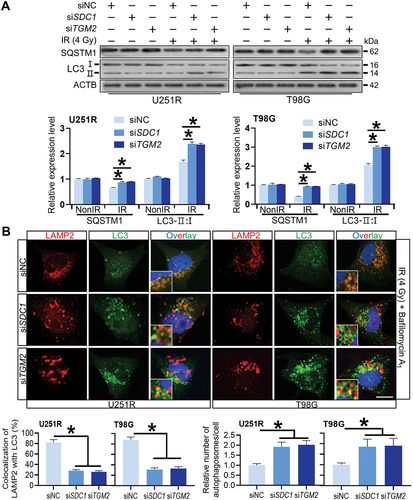
We then investigated the relationship of SDC1 and TGM2-regulated radiosensitivity and autophagic activity. KEGG enrichment analysis manifested that both SDC1 and TGM2 were involved in autophagy regulation pathways (). When GBM cells were transfected with siSDC1 or siTGM2, the autolysosome formation was reduced, LC3-II:I was increased and SQSTM1 degradation was decreased at 6 h after 4 Gy irradiation (), suggesting a blockage in autophagosome maturation process. We also compared the colocalization of endogenous LC3 with lysosomal marker protein LAMP2 (lysosomal associated membrane protein 2) in siNC, siSDC1 and siTGM2 transfected cells that were treated with BafA1 to inhibit LC3 degradation 2 h before 4 Gy X-rays irradiation. We defined two puncta as colocalized if their fluorescent signals overlapped by >70%, and found that radiation-induced clusters of lysosomal LAMP2 and autophagosomal LC3 were significantly reduced to low levels by siSDC1 and siTGM2 transfection in both U251R and T98G cells (). In addition, there were much more LC3-marked autophagosomes being accumulated and deposited in the cytoplasm of SDC1- or TGM2-knockdown cells, in accordance with the enhanced conversion of LC3-I to LC3-II (). These findings revealed that the interaction of SDC1 and TGM2 promoted the fusion process of autophagosomes with lysosomes in GBM cells.
Figure 3. Inhibition of SDC1 and TGM2 suppressed autolysosome formation. (A) KEGG pathway enrichment analysis of SDC1 (left) and TGM2 (right). (B) Representative image of the mRFP‐GFP‐LC3 fusion protein expressions in U251R and T98 G cells under different siRNAs transfection at 6 h after 4 Gy IR. Red dots indicate autolysosomes while yellow dots indicate autophagosomes in overlays. Nuclei were stained with DAPI. Scale bars: 10 μm. The average number of autophagosomes and autolysosomes in each indicated cell was quantified. ns P ≥ 0.05 and **P < 0.01.
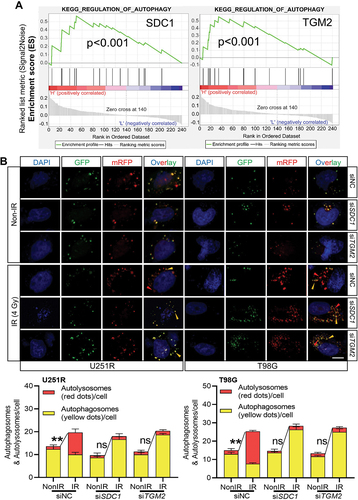
Figure 4. Reduced autophagosome and lysosome encounter occurred in SDC1 and TGM2 knockdown cells. (A) Western blot analysis of LC3-II:I and SQSTM1 protein levels in different siRNAs transfected GBM cells at 6 h after 4 Gy IR. (B) Control, SDC1- and TGM2-knockdown cells were treated with 4 Gy irradiation and then incubated with 100 nM BafA1 for 6 h before stained with antibodies to LC3 and LAMP2. Nuclei were stained with DAPI. Scale bar: 10 μm. Colocalization LC3 and LAMP2 was quantified, and the relative number of autophagosomes in each cell was counted in comparison with the siNC group. *P < 0.05.
SDC1 triggered the translocation of TGM2 from cell membrane to lysosome after irradiation
In an attempt to further understand how SDC1 and TGM2 induced the autophagosomes maturation, we explored the locations of SDC1 and TGM2 in GBM cells. The immunofluorescence staining showed that, without irradiation, SDC1 protein was mainly localized on cytomembrane, TGM2 was partly colocalized with SDC1 on cytomembrane and partly localized alone in nuclei. However, within 12 h after 4 Gy irradiation, especially at 6 h, the amount of SDC1 and TGM2 proteins on cell membrane were markedly decreased but were elevated in cytoplasm ( and S5A). Consistently, western blot analysis demonstrated that SDC1 and TGM2 proteins were decreased on membrane while increased in cytoplasm to a peak value at 6 h after irradiation (Fig. S5B). Since TGM2 protein also enriched in nuclei, we detected the changes of nuclear TGM2 after IR and ruled out that the increased TGM2 protein in cytoplasm was derived from nuclear (Fig. S5C). Then, we wondered which protein initiated this cytoplasmic transport, SDC1, TGM2 or other protein? For this purpose, we knocked down the expression of SDC1 or TGM2 in GBM cells. It was found that SDC1 knockdown significantly reduced radiation-induced cytoplasmic translocation of TGM2, while TGM2 suppression had no effect on SDC1 translocation (Fig. S5E). Same results were identified by western blot analysis of the membrane and cytoplasmic proteins of SDC1 and TGM2 in siNC, siSDC1 and siTGM2 transfected cells (Fig. S5D). These data, coupled with reports that SDC1 could be translocated from cell surface to lysosome to fuel cells under potentially lethal stress through macropinocytosis [Citation17,Citation18], prompted us to investigate whether SDC1 could regulate the cytoplasmic translocation of TGM2 via macropinocytosis. As measured by tetramethylrhodamine (TMR)-labeled dextran uptake at 6 h post-irradiation, macropinocytosis was dramatically inhibited upon the treatment of cells with macropinocytosis inhibitor, EIPA, as well as transfection with siSDC1, while it remained at a high level in siTGM2-transfected GBM cells (Fig. S6A). In addition, it was verified that numerous SDC1 and TGM2-puncta did co-localize with LAMP2 in GBM cells after 4 Gy irradiation (Fig. S6B).
Figure 5. SDC1 bond to TGM2, and transported from cell surface to intracellular. (A) Immunofluorescence images of subcellular location of SDC1 (red) and TGM2 (green) proteins in GBM cells at 2–12 h after 4 Gy IR. DAPI-stained nuclei are blue. Scale bars: 10 μm. (B) Immunoblots of Co-IP assay that verified the binding of SDC1 to TGM2. (C) Schematic diagram depicting wild-type and fragmental SDC1 proteins. (D) Co-IP assay was used to validate the binding of TGM2 to wild-type SDC1 or SDC1 fragments.
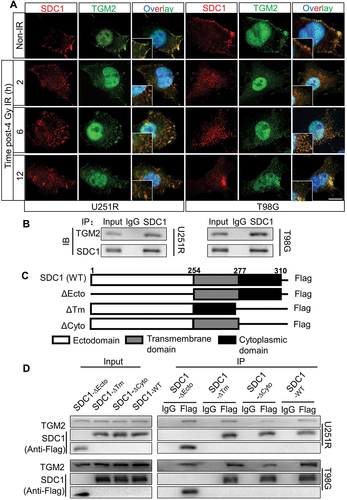
The subcellular localization of SDC1 and TGM2 prompted us to investigate how SDC1 interacted with TGM2. Co-IP assay demonstrated that SDC1 strongly bond to TGM2 in both U251R and T98G cells (). SDC1 protein has three simple domain organizations: a single ectodomain, transmembrane and cytoplasmic domains. Thus, we designed four constructs in pcDNA3(-) expression plasmid where one construct encoded wild-type (WT) human SDC1 and the other three encoded domain-deleted fragments (∆) of human SDC1 (). Co-IP assay disclosed that the SDC1 fragments containing cytoplasmic domain (SDC1-∆Ecto and SDC1-∆Tm) but not ectodomain and transmembrane domain (SDC1-∆Cyto) could bind to TGM2 in GBM cells (). These findings confirmed that SDC1 could carry TGM2 through its cytoplasmic domain and transported to lysosome, participating in autophagosome maturation after irradiation.
TGM2-LC3 interaction promoted EPG5 capture of autophagosome and assembly of STX17-contained QabcR SNARE complex
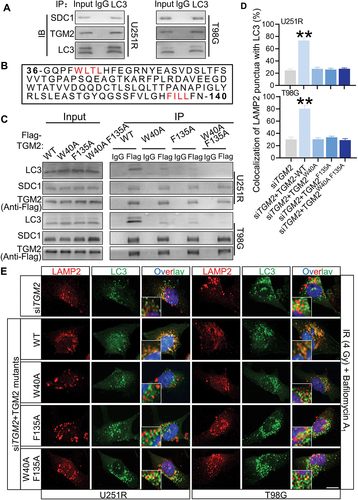
Since SDC1 and TGM2 facilitated autophagosomal-lysosomal fusion, we considered the possibility that the lysosome positioned SDC1 and TGM2 could directly interact with LC3. Co-IP assay proved that the endogenous SDC1 and TGM2 could specifically precipitated endogenous LC3 (). In this regard, we noticed that the TGM2 contained two potential LC3-interacting region (LIR) motifs of WLTL and FILL [Citation19] while SDC1 did not (). Co-IP assay indeed demonstrated that LC3 binding to TGM2 was reduced by the mutation of W40A and F135A and was further abolished by the double mutations of W40A and F135A of TGM2 (). Meanwhile, rescue of siTGM2 transfected cells with TGM2 mutant having substitutions in the two LIR motifs could not restore the level of autophagosomal-lysosomal encounter to control level as WT-TGM2 plasmid did (), indicating that these two motifs were indispensable for the function of TGM2 in autophagosome maturation.
Figure 6. The LIR motifs in TGM2 mediated LC3 binding. Cells were irradiated with 4 Gy X-rays 6 h before relevant detection. (A) In a Co-IP assay, SDC1 and TGM2 precipitated endogenous LC3. (B) Two potential LIR (LC3-interacting region) motifs in TGM2 were highlighted in red. (C) Lysates of GBM cells transfected with plasmids encoding Flag-tagged WT TGM2 or TGM2 with mutations in two LIR motifs were immunoprecipitated with an antibody to Flag followed by immunoblotting with antibodies to Flag, SDC1 and LC3. (D-E) Colocalization of LC3 and LAMP2 was quantified (D) in TGM2-knockdown cells that were stained with antibodies to LC3 and LAMP2 after 100 nM BafA1 treatments for 6 h (E). The TGM2-knockdown cells were rescued with TGM2-WT plasmid or TGM2-LIR mutants. Nuclei were stained with DAPI. Scale bars: 10 μm. **P < 0.01.
We further investigated whether TGM2 interacted with STX17-SNAP29-VAMP8 QabcR SNARE complex, a key factor directly mediating the encounter and fusion of autophagosomes with lysosomes. Co-IP assay showed that TGM2 strongly bond to STX17, SNAP29 and VAMP8 in GBM cells post-irradiation (). The formation of STX17-SNAP29-VAMP8 SNARE complex was also examined. It was found that the level of endogenous SNAP29 co-immunoprecipitated by STX17 did not change in the TGM2-knockdown cells. However, much less endogenous VAMP8 was precipitated by endogenous STX17 in TGM2-knockdown cells (). Inhibition of SDC1 had same results as TGM2 knockdown. These results suggested that TGM2 promoted the recruitment of STX17-contained SNARE complex in lysosomes, which was required for the fusion of autophagosomes with lysosomes. Generally, several tethering proteins participate in the assembly of QabcR SNARE complex during autophagosome maturation.
Figure 7. TGM2 bond to EPG5 and promoted EPG5-mediated QabcR SNARE assembly. Cells were irradiated with 4 Gy X-rays 6 h before detection. (A) Endogenous STX17, SNAP29 and VAMP8 were precipitated by TGM2 in Co-IP assays. (B) Co-IP assay of endogenous SNAP29 and VAMP8 bond with STX17 in the SDC1- or TGM2-knockdown cells. (C) The levels of co-precipitated SNAP29 and VAMP8 were normalized to the corresponding STX17 (set to 1 in control cells). (D) Endogenous EPG5, WDR45 and RAB7 were precipitated by TGM2 in Co-IP assays. (E) Co-IP assay of endogenous STX17, SNAP29 and LC3 bond with EPG5 in the SDC1- or TGM2-knockdown cells. (F) The levels of co-precipitated STX17, SNAP29 and LC3 were normalized to the corresponding EPG5 (set to 1 in control cells). ns P ≥ 0.05 and **P < 0.01.
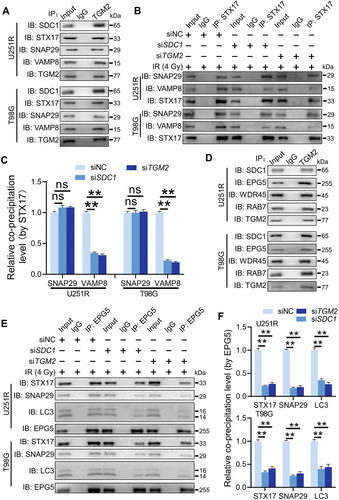
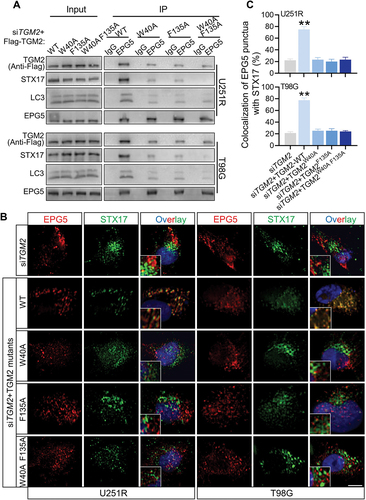
Did TGM2 act as an individual tethering factor or function by its interaction with other tethering proteins? Co-IP assay revealed that TGM2 could immuneprecipitate a tethering complex containing EPG5, WDR45 and RAB7 (), while did not bind to other classical tethering factors such as PLEKHM1 or HOPS complex (Fig. S7A). During autophagosome maturation, EPG5 is recruited to lysosome by RAB7, captures autophagosomes by binding to LC3 and promotes assembly of STX17-SNAP29-VAMP8 complex [Citation20]. How did TGM2 interact with EPG5? Whether this interaction was critical for EPG5 function. It was found that the levels of VAMP8 and RAB7 immunoprecipitated by EPG5 were not affected by siTGM2 and siSDC1 (Fig. S7B), suggesting that TGM2 was dispensable for the late endosomal/lysosomal localization of EPG5. However, EPG5 immunoprecipitated much less endogenous STX17, SNAP29 and LC3 once TGM2 and SDC1 were knockdown in GBM cells (), indicating that TGM2 was essential for the function of autophagosome capture of EPG5. In addition, TGM2 interacted with less QabcR SNARE complex in EPG5-knockdown cells, while still strongly bond to LC3 (Fig. S7C-D), demonstrating that TGM2 could recognize autophagosomes while not stabilize the assembly of SNARE complex alone without the cooperation with EPG5. Thus, we assumed that TGM2-LC3 binding preceded EPG5-LC3 binding i.e., binding of TGM2 to LC3 facilitated the encounter of autophagosomes with lysosomes, and subsequent capture of LC3 by EPG5. Further Co-IP assay demonstrated that the binding of EPG5 to autophagosomal LC3 and STX17 was restored to normal level in TGM2- knockdown GBM cells rescued with TGM2-WT plasmid, while it sustained lower level in GBM cells with TGM2 mutants having two LIR motifs substituted (). Also, the recruitment of STX17-contained SNARE by EPG5 was not repaired in TGM2 inhibited cells that were rescued with two LIR motifs substituted TGM2 mutants (). Taken together, these results demonstrated that the binding of TGM2 to LC3 was prior to EPG5 and determined the tethering effect of EPG5.
Figure 8. TGM2-LC3 binding determined EPG5 recognition of autophagosomal LC3. Cells were irradiated with 4 Gy X-rays 6 h before detecting. (A) Co-IP assay of endogenous LC3, STX17 and Flag-tagged TGM2 bond with EPG5 in TGM2-knockdown cells rescued with TGM2 WT or mutants having substitution on two LIR motifs. (B-C) TGM2-knockdown cells with or without rescue of TGM2-WT plasmid or TGM2-LIR mutants were stained with antibodies to EPG5 and STX17 (B). Colocalization of EPG5 and STX17 was quantified (C). Nuclei were stained with DAPI. Scale bars: 10 μm. **P < 0.01.
Combination of RT and Cys-D improved survival and pathologic response in GBM‑bearing mice
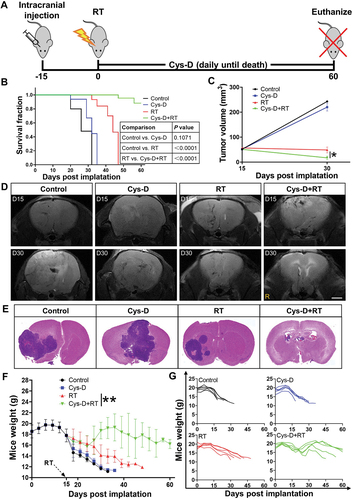
After explicating the mechanism on how SDC1 and TGM2 promoted GBM radioresistance, we investigated the effect of cystamine dihydrochloride (Cys-D), a TGM2 inhibitor capable of crossing blood-brain barrier [Citation21], on GBM radiosensitization. According to the chemical toxicity IC50 of Cys-D on GBM cells and glia cells (Fig. S8A, B), a concentration of 10 μM, about IC50/5, was applied for this study. Cys-D treatment effectively suppressed the expression of TGM2 (Fig. S8C) and significantly raised the radiosensitivity of U251R and T98G cells (Fig. S8E). Notably, although Cys-D treatment could also sensitize glia cells HA1800 and HMC3 to irradiation (Fig. S8D and F), the sensitization effect was much lower than that observed in GBM cells. Applying an orthotopic U251R xenograft model (), it was found that the U251R glioma-bearing mice had a median survival of 26 days. Monotherapy with Cys-D prolonged mice survival up to 32 days while with no statistical significance, and RT alone improved the median survival of mice to 44 days. After the combination treatment of RT and Cys-D, 60% mice were still alive at 60 days (). MRI scans, taken at days 15 and 30 after U251R cells implantation, showed remarkable delays in the average volumetric tumor growth in the RT and Cys-D combination treatment group, compared to tumor-bearing control and other groups (). The brain specimens of the surviving mice up to 60 days after GBM cells implantation showed favorable tumor elimination with almost no microscopic evidence of disease after combinational treatment with RT and Cys-D (). With Cys-D treatment, the TGM2 expression in U251R xenograft tissue was reduced remarkably (Fig. S8G). Moreover, all mice were weighted until sacrificed. Mice in RT and Cys-D combinational treatment group had weight gain in comparison with other groups where malnutrition and eventually cachexia were induced since tumor development ().
Figure 9. GBM was sensitized to RT with anti-TGM2 blockade (Cys-D) treatment. (A) Schematic of experimental design. (B) Kaplan–Meier survival curves of U251R xenograft-bearing mice from the day of tumor cells implantation to mice death or maximum study duration of 60 days (n = 5 per group). Survival differences were determined by log-rank Mantel-Cox test. (C) Tumor growth delay curves with U251R xenograft tumor volumes measured by MRI scan. (D) U251R xenograft tumor volume was measured by T2-weighted MR image on day 15 (upper panel) and day 30 (lower panel) after cell implantation. Mice were treated with RT, Cys-D, or their combination. Scale bars: 2 mm. (E) Whole mount HE-stained brain sections of mice treated with RT, Cys-D, or their combination. (F-G) Time responses upon the weight of mice after U251R cells implantation on average (F) and individual (G). Mice were treated with RT, Cys-D, or their combination. *P < 0.05 and **P < 0.01.
Discussion
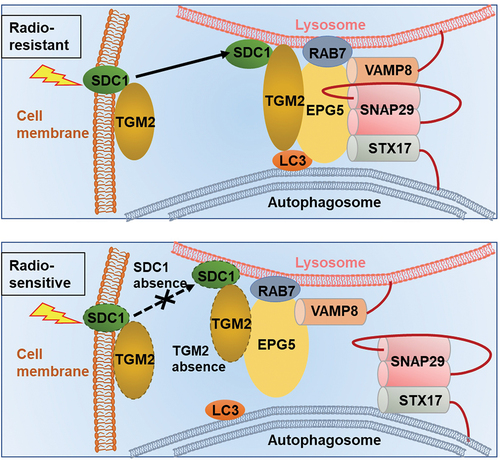
This study revealed for the first time that SDC1-TGM2 complex could regulate radioresistance of GBM by activating autophagy. Especially, the expressions of SDC1 and TGM2 were upregulated in radioresistant GBM cells and tissues, and might be applicable as potential biomarkers of tumorigenesis, malignancy progression and poor prognosis clinically. We demonstrated that SDC1 and TGM2 determined the fusion of autophagosome with lysosome through coordinating the binding of EPG5 to LC3 and thus influenced GBM resistance to RT (). Pharmacologic inhibition of TGM2 with Cys-D markedly enhanced the anti-tumor activity of RT in orthotopic GBM xenograft model, implying the potential application of SDC1-TGM2 in the targeted RT.
Figure 10. Mechanism diagram showed how SDC1 and TGM2 mediate fusion of autophagosomes with lysosomes in GBM cells after IR. In radioresistant cells, with the transport of SDC1, TGM2 was recruited to lysosome. TGM2 in turn bond to LC3 on autophagosomal membrane, activating EPG5 interaction with LC3, promoting assembly of the STX17-SNAP29-VAMP8 QabcR SNARE complex and autophagosome-lysosome fusion. In SDC1 or TGM2 absence cells, EPG5 could not interact with LC3 and capture autophagosome, impairing STX17-SNAP29-VAMP8 QabcR SNARE assembly and autophagosome-lysosome fusion, which ultimately enhanced radiosensitivity.
SDC1, a transmembrane (type I) heparan sulfate proteoglycan, has been implicated in multiple diseases including cancers [Citation22]. Increased level of SDC1 at cell surface regulates macropinocytosis, fuels cell growth and promotes tumor maintenance and progression in pancreatic ductal adenocarcinoma [Citation17]. Inhibition of SDC1 expression in breast cancer cells significantly reduced metastasis to brain by changing cell-secreted cytokines that influence blood-brain barrier [Citation23]. TGM2 is an enzyme that catalyzes the crosslink between proteins via glutamyl lysine isopeptide bonds, whose activities also have been reported in normal development and diseases states [Citation24]. Gene expression analysis of 128 esophageal adenocarcinoma patients suggested that overexpression of TGM2 was associated with higher tumor grade, poor differentiation, and increased inflammatory and desmoplastic response [Citation25]. However, so far, there is no literature concerning the clinical significance of SDC1 and TGM2 in radioresistant GBM patients as well as the interaction between these two molecules. The current findings advanced the knowledge of the relationships among the high levels of SDC1 and TGM2, GBM radioresistance, and autophagic activity (). We demonstrated that SDC1 was a TGM2 transporter while TGM2 is a SDC1 effector during autophagosome maturation ( and S5). Briefly, SDC1 carried TGM2 from cell membrane to lysosome through internalization (shedding [Citation26] or endocytosis [Citation27]) and then TGM2 coordinated the encounters of autophagosomes with lysosomes.
Particularly, we proposed a novel concept that SDC1 and TGM2 might determine EPG5-mediated fusion of autophagosomes with lysosomes. Generally, autophagy flux consists of two important steps: formation of autophagosomes, and fusion of autophagosomes with lysosomes [Citation28]. Numerous studies have elucidated the pathways involved in autophagosomes formation. Accompanied by LC3, cytoplasmic TP53INP2 is targeted to early autophagic membranes, which contributes to autophagosome biogenesis by mediating LC3-ATG7 [Citation29]. A genome-wide CRISPR screen identified that TMEM41B and VMP1 functioned together at an early step of autophagosome formation [Citation30]. Takuo et al. found that Atg2 acted as a lipid-transfer protein that supplied phospholipids for autophagosome formation [Citation31]. However, study of autophagosomal-lysosomal fusion process is hitherto lacking. This fusion process may require the concerted actions of multiple regulators of membrane dynamics, including SNAREs, tethering proteins and RAB GTPases [Citation32]. Tethering factors, such as PLEKHM1, HOPS and EPG5 have been shown to facilitate autophagosomal-late endosomes/lysosomes fusion via stabilizing SNARE complex [Citation20,Citation33,Citation34]. According to our results, TGM2 exhibited some properties of tethering proteins within SNARE complex assembly. In TGM2-knockdown GBM cells, the level of the assembled STX17-SNAP29-VAMP8 QabcR SNARE complex was dramatically reduced while the initial formation of autophagosomal STX17-SNAP29 Qabc complex was not affected (). Our findings also disclosed that the binding of TGM2 to LC3 with its two LIR motifs was essential for the autophagosome maturation (). The function of TGM2 was partly in line with EPG5, a classical tethering factor capturing autophagosome by recognizing LC3 and serving as a platform to allow the directly interaction of SNARE complex [Citation20]. It turned out that TGM2 could bond to EPG5 tethering complex and facilitate its tethering function. In TGM2- knockdown cells, EPG5 recruited lower levels of autophagosomal LC3 and STX17-SNAP29 Qabc complex (). TGM2 appeared not to affect EPG5 localization on late endosome/lysosome, and the binding of EPG5 to VAMP8 and RAB7 was not changed in TGM2-knockdown cells (Fig. S7B). Significantly, TGM2-LC3 binding may occur prior to EPG5 recognition of LC3 and thus regulates this recognition. Rescue of TGM2-knockdown cells with TGM2 mutant having two LIR motifs substitution could not reverse the impaired EPG5-LC3 interaction and the recruitment of STX17-contained SNARE by EPG5 (). Before capture of autophagosome, lysosomes should anterogradely transport in cytoplasm, enabling their meet with peripheral autophagosomes, which required the recruitment of small GTPase ARL8 on lysosome to activate the kinesin [Citation35]. Similarly, two most important enzymatic functions of TGM2 are transglutaminase and GTP binding activities [Citation36]. Thus, we speculated that recruitment of TGM2 on lysosome assisted the anterogradely transport of lysosome, followed by binding to LC3 and promoting the interaction of EPG5 and LC3. In vitro Co-IP assay also elucidated that the constitutive GT-protein active TGM2W241A but not transglutaminase active TGM2R580A interacted with LC3 as well as EPG5 (Fig. S9). However, this hypothesis still needs further verification on how the GT-protein active TGM2 lysosomal position influences vesicle trafficking. As for SDC1, it may not directly bind to LC3 during EPG5 tethering of autophagosomes and lysosomes, but it engages in the initial lysosomal localization of TGM2.
Autophagy had differential impacts on distinct phases of tumorigenesis. Generally, healthy cells appear to be protected from malignant transformation by proficient autophagic responses; conversely, autophagy promotes tumor progression and therapy resistance in a variety of models [Citation37]. In some cases, autophagy was reported to induce cell death via ferroptosis [Citation38] or autosis [Citation39] in response to anticancer treatments. However, numerous reports noted that autophagy had a function on maintaining the survival of tumor cells after RT and eventually led to radioresistance and malignancy recurrence [Citation40–42]. Blocking autophagic activity with autophagy inhibitors, such as chloroquine (CQ) or hydroxychloroquine (HCQ) could sensitize tumor cells to radiation [Citation43,Citation44]. Similarly, our study suggested an elevated autophagic activity in radioresistant GBM cells. Autophagy modulation had a pivotal impact on the IR-induced cell death of GBM. Enhancement of autophagy using rapamycin desensitized GBM cells to radiation, while inhibition of autophagy by BafA1 and CQ sensitized it. Extensive pre-clinical studies regarding autophagy inhibition [Citation45,Citation46] triggered mounting clinical trials targeting autophagy in the conjunction therapy of cancer treatment. A phase I/II trial of HCQ in combination with RT demonstrated that HCQ led to an encouraging improvement in the overall survival of GBM patients [Citation12]. A recent phase 1b trail also showed the feasibility of co-administration of CQ in integration with RT [Citation47]. Nonetheless, clinical data including the above two trails co-emphasized that the dose-limiting toxicity prevented the escalation of higher doses CQ and HCQ, which may be attributed to the nonspecific nature of these agents [Citation12,Citation47–49].
Cys-D, a TGM2 inhibitor, has been approved by the Food and Drug administration (FDA) and the European Medicines Agency (EMA) for the treatment of cystinosis and pancreatic cancer. Our preclinical animal experiments demonstrated that Cys-D could significantly enhance the effect of tumor RT, and the mice had good tolerance to Cys-D. Moreover, the cytotoxicity and radiosensitization effect of Cys-D for neuroglia cells (HA1800 and HMC3) were significantly weaker than that of GBM cells (Fig. S8B, D and F). Indeed, a series of clinical trials have extensively tested the safety and efficacy of cystamine formulations in treating neurodegenerative disorders such as Huntington’s disease [Citation50,Citation51]. Notably, RT may cause severe lymphopenia that affects the overall survival of patients [Citation52,Citation53], while cystamine could prevent this side effect via its protection on leukocyte [Citation54]. Consistently, we found that Cys-D administration obviously eliminated lymphopenia induced by RT in GBM bearing mice (Fig. S8H).
Since CQ was the most potential autophagy-targeted radiosensitizer in clinical trial, we compared the influence of Cys-D and CQ on autophagic flux. First, we validated the radiosensitization effect of CQ (Fig. S10A) on GBM cells and found it was similar to that of Cys-D (Fig. S8E). In addition, we observed the simultaneous increases of LC3-II:I ratio and SQSTM1 level in both Cys-D and CQ pretreated cells post-irradiation (Fig. S10B). Immunostaining of LC3 and LAMP2 also revealed a blockage on the encounter of autophagosomes with lysosomes in the Cys-D and CQ pretreated cells after irradiation (Fig. S10C). These results suggested that Cys-D could sensitize GBM to RT by inhibiting the formation of autolysosomes, and thereby the clinical translational value of Cys-D could co-opt the application pattern of CQ. Importantly, our findings not only indicated TGM2 as a feasible target for integrative therapy of GBM, but presented evidence for the new application of clinical drugs targeting TGM2, such as Cys-D, which could be more specific in inhibiting autophagy and effective in the combination of tumor RT.
In summary, we identified that SDC1 and TGM2 played vital roles in autophagy by promoting EPG5-mediated fusion of autophagosome with lysosome, contributed to maintenance of autophagic flux, and ultimately enhanced radioresistance of GBM. Therefore, SDC1-TGM2 should represent a novel sensitization target for GBM RT.
Materials and methods
Cell culture, irradiation and autophagic reagents
Human glioblastoma cell lines of U251 (TCHu 58) and T98G (CRL 1690) were purchased from Cell Bank of Chinese Academy of Science. The stable radioresistant U251R cell line was developed from its parental cell line U251 by exposing it with 2 Gy X-ray/day for 30 fractions (5 fractions/weekly in general) with a total dose of 60 Gy. Human astrocyte HA1800 cells (C1244) and human microglia HMC3 cells (C1026) were kindly provided by Shanghai WHELAB Bioscience Limited. U251, U251R and HA1800 cells were cultured in Dulbecco’s modified Eagle’s medium (Thermo Fisher Scientific, C11995500BT), while T98G and HMC3 cells were cultured in Minimum Essential medium (Thermo Fisher Scientific, C12571500BT). The above media contained 10% fetal bovine serum, 100 units/mL penicillin and 100 mg/mL streptomycin (Yeasen Biotechnology, 40130ES76). Cells were incubated in a 5% CO2-humidified incubator at 37°C. Cells in log-phase were irradiated with a dose rate of 0.883 Gy/min X-ray by X-Rad320 irradiator (PXI Inc., Santa Rosa, CA, USA). For regulation of autophagic activity, rapamycin (HY-10219), bafilomycin A1 (HY-100558) and chloroquine (HY-17589A) from MedChemExpress were employed.
TMT quantitative proteomic analysis
Total proteins of U251, U251R and T98G cells were extracted and their concentrations were detected with the bicinchoninic acid (BCA) assay (Beyotime Biotechnology, P0012). A quantity of 0.2 mg protein was used for TMT analysis according to the manufacturer’s protocol (Genechem, M-GSGC0182977). A high-resolution mass spectrometer Q Exactive plus (Thermo Fisher Scientific, Waltham, MA, USA) was used to perform the quantitative proteomics analysis. Protein sequence was analyzed according to Uniprot_HomoSapiens_20386_20180905 database (www.uniprot.org).
Colony formation assay
Cells were planted in 6-well plates at different densities and allowed to grow overnight, followed by irradiating with different doses of X-rays. After 10–14 days, colonies with more than 50 cells were washed with PBS (Beyotime Biotechnology, ST447), fixed with paraformaldehyde (Beyotime Biotechnology, P0099), stained with crystal violet for 15 min, and counted. Survival fraction curves were fitted and sensitizer enhancement ratio (SER) was calculated using origin software (OriginLab, Northampton, NC, USA).
RNA extraction and real-time PCR analysis
Total RNA was isolated using total RNA Kit I (OmegaBiotek, R0834-01). Complementary DNA (cDNA) was synthesized using a real-time SuperMix (TIANGEN, KR118). Real-time PCR was performed using SuperReal PreMix Plus (TIANGEN, FP205). ACTB/β-actin was used as an internal control for mRNA. Relative RNA abundances were calculated by the standard 2−ΔΔCt method. Primers used in the study were listed in .
Table 1. Primers used for RT-PCR
Western blot assay
Cytoplasmic and membrane proteins were extracted using a subcellular protein fractionation kit (Beyotime Biotechnology, P0033), and nuclear proteins were extracted using Nuclear and Cytoplasmic Protein Extraction Kit (Beyotime Biotechnology, P0027) according to the manufacturer’s instruction. Quantified cell proteins were extracted and separated by 12.5% SDS-PAGE gels and transferred to PVDF membranes (Millipore Corp., IPFL00010). After probing with appropriate primary and secondary antibodies, the membrane was detected using an ECL detection system (Bio-Rad, 1,708,265) and the protein bands were quantified using Quantity one software (Bio-Rad). ACTB/β-actin was used as a control. Antibodies were described in .
Table 2. Antibodies used in the experiments
RNA interference
Small interfering RNAs (siRNAs) were synthetized by RIBOBIO (Guangzhou, China). Cells were cultured on six-well plates to confluence and transfected with siRNA using riboFECTTM CP Transfection Agent (RIBOBIO, C10511-1) according to the manufacture’s instruction. The RNA interference sequences were listed in .
Table 3. Target sequences of siRNAs
Transiently expressing mRFP-GFP-LC3
The adenovirus vector containing the mRFP-GFP-LC3 reporter was purchased from Hanbio (HB-LP2100001). Cells were transfected with 1% adenovirus for 24 h followed by irradiation or other treatments. Then, cells were fixed and analyzed using fluorescence microscopy (ImageXpress Micro 4).
Co-immunoprecipitation (Co-IP) assay
The whole cell lysates were collected according to the manufacturer’s instruction (Beyotime Biotechnology, P2179M) and then centrifuged at 10,000 g for 10 min at 4°C. Then 1 ml supernatant was incubated with 1 μg anti-SDC1/-LC3/-TGM2/-STX17/-EPG5/-Flag antibody, or anti-IgG antibody (Cell signaling Technology, 3423; 1:100) for 16 h followed by addition of 20 μl protein A/G plus agarose beads (Santa Cruz Biotechnology, SC-2003) and incubated overnight at 4°C. Samples were spun down, washed four times with immunoprecipitation buffer and heated for 10 min at 100°C prior to loading on an SDS-PAGE gel for western blotting assay. Antibodies used were described in .
Immunofluorescence (IF) staining
At different times after irradiation, cells were washed with PBS, fixed with 4% formaldehyde for 10 min, permeabilized with 0.5% Triton X-100 (Beyotime Biotechnology, P0096) for 10 min and then incubated in 0.1% PBS-Tween solution containing 1% BSA, 10% normal goat serum, and 0.3 M glycine (QuickBlock assay, Beyotime Biotechnology, P0260) for 1 h to block nonspecific protein-protein interactions. Cells were sequentially incubated with primary antibody for 12 h (anti-LAMP2 or -EPG5) or 24 h (anti-SDC1) and Alexa Fluor 555-conjugated secondary antibody for 1 h at 4°C. Next, cells were incubated with another primary antibody for 12 h (anti-LC3 or -STX17) or 24 h (anti-TGM2) and followed by corresponding Alexa Fluor 488-conjugated secondary antibody for 1 h at 4°C. DAPI was then used to stain the cell nuclei at a concentration of 1.43 µM. Cell fluorescence image was photographed with ImageXpress Micro 4 screening system (Molecular Devices, San Jose, CA, USA). For fluorescence spots quantification in each cell were counted using the Granularity Analysis function of ImageXpress software and 50 cells were analyzed for each sample. Antibodies used for IF staining were described in
Detection and quantification of macropinocytosis
Macropinocytic index was determined as described before [Citation55]. Briefly, macropinosomes were marked utilizing a high molecular weight TMR-dextran (MW 65–85 kDa; Sigma-Aldrich, T1162) uptake assay wherein TMR-dextran was added to culture-medium at a final concentration of 1 mg/mL for 30 min at 6 h post-irradiation. At the end of incubation, cells were fixed in 4% polyformaldehyde and DAPI-treated to stain nuclei. Cell images were captured using an ImageXpress Micro 4 screening system. The total particle area per cell was calculated from 5 fields that were randomly selected from different regions across the entirety of each sample. Macropinocytosis inhibitor, EIPA (MedChemExpress, HY-101840) treatment served as positive control.
Plasmid construction
We constructed a plasmid encoding Flag-tagged wild-type SDC1 or TGM2, and plasmids with domain-deleted fragments (ectodomain, transmembrane and cytoplasmic domains deleted, respectively) of SDC1 and site-directed mutants (tryptophan 40, phenylalanine 135, arginine 580 and tryptophan 241 mutated to alanine) of TGM2 in the pcDNA3.1(-) backbone (Genechem, CV702). Each plasmid was transiently transfected into U251R and T98G cells by Lipofectamine 3000 (Invitrogen, L3000008). After 24 h of transfection, cells were irradiated and their proteins were prepared for immunoprecipitation and immunoblot assay.
Animal treatments
The subcutaneous xenograft model was built as described previously [Citation56]. For orthotopic xenograft model, a total of 20 five-week-old male BALB/c nude mice (18–20 g) were used. U251R cells (1 × 10⁶) in a volume of 3 μl were stereotactically injected into the right striatum as defined by the following coordinates: 2 mm posterior to the coronal suture, 2 mm lateral to the sagittal suture, and 3 mm deep to the cortical surface. On day 15 after tumor implantation, mice were randomly divided into four groups: control, Cys-D only, radiation alone, combined radiation and Cys-D. For radiation, a single dose of 15 Gy was given to the brain on day 15 post-tumor cells implantation. For Cys-D+ RT or Cys-D alone groups, a dose of 20 mg/kg Cys-D was intragastrically administrated 2 h before irradiation or shield irradiation. After irradiation, mice were weighed every three days and kept until death or maximum 60 days, and Kaplan-Meier survival curves were fitted using GraphPad software (San Diego, CA, USA). On day 7 post-irradiation, mice tail vein blood was collected for hemocytes analysis using the BC-2800Vet auto hematology analyzer (Mindray, Shenzhen, China). To harvest brain sample, mice were anesthetized with ketamine and xylazine before intracardiac perfusion with PBS followed by 4% PFA in PBS. The brains were removed and post-fixed in 4% PFA-PBS for 12 h followed by cryoprotection in 30% w:v sucrose for 48 h, and followed by HE and immunofluorescence staining (RecordBio, RC035). This project was approved by the Animal Ethics Committee of Fudan University (approval number 20171304A215). All procedures performed involving animals were in accordance with the Guide for the Care and Use of Laboratory Animals published by the US National Institutes of Health.
MR imaging
Mice were imaged by a 7.0 T small animal MRI scanner (Biospec, Bruker, Karlsruhe, Germany) with ADVANCE III hardware/software, 1 H and X nuclide RF amplifiers, and a 300 V/200A gradient power Copley amplifier. Various MR sequences of T2-weighed images were used to compute the tumor volumes with standard analysis method [Citation57].
Statistical analysis
Data were presented as mean ± standard deviation (SD) of three independent experiments. Student’s t-test was used for two-group comparisons. Kaplan-Meier method was used to analyze the survival. Log-rank test was used to determine the significance, and a two-sided P value less than 0.05 was considered to be statistically significant.
Data Availability
Data presented in this study are available on request from the corresponding author upon reasonable request.
Supplemental Material
Download Zip (4.2 MB)Acknowledgments
We sincerely acknowledge the Department of Nuclear Medicine, Shanghai Cancer Center, Department of Oncology, Shanghai Medical College and Center for Biomedical Imaging, Fudan University for the generous help.
Disclosure statement
No potential conflicts of interest were disclosed.
Supplementary material
Supplemental data for this article can be accessed online at https://doi.org/10.1080/15548627.2022.2105562
Additional information
Funding
Related Research Data
References
- Ostrom QT, Patil N, Cioffi G, et al. CBTRUS statistical report: primary brain and other central nervous system tumors diagnosed in the United States in 2013-2017. Neuro Oncol. 2020;22(12 Suppl 2):v1–96.
- Lara-Velazquez M, Al-Kharboosh R, Jeanneret S, et al. Advances in brain tumor surgery for glioblastoma in adults. Brain Sci. 2017;7(12):166.
- Chiblak S, Tang Z, Lemke D, et al. Carbon irradiation overcomes glioma radioresistance by eradicating stem cells and forming an antiangiogenic and immunopermissive niche. JCI Insight. 2019;4(2):e123837.
- Dunn GP, Rinne ML, Wykosky J, et al. Emerging insights into the molecular and cellular basis of glioblastoma. Genes Dev. 2012;26(8):756–784.
- Levine B, Kroemer G. Autophagy in the pathogenesis of disease. Cell. 2008;132(1):27–42.
- Mizushima N, Komatsu M. Autophagy: renovation of cells and tissues. Cell. 2011;147(4):728–741.
- White E. The role for autophagy in cancer. J Clin Invest. 2015;125(1):42–46.
- Amaravadi R, Kimmelman AC, White E. Recent insights into the function of autophagy in cancer. Genes Dev. 2016;30(17):1913–1930.
- Janku F, McConkey DJ, Hong DS, et al. Autophagy as a target for anticancer therapy. Nat Rev Clin Oncol. 2011;8(9):528–539.
- Kroemer G. Autophagy: a druggable process that is deregulated in aging and human disease. J Clin Invest. 2015;125(1):1–4.
- Kondo Y, Kanzawa T, Sawaya R, et al. The role of autophagy in cancer development and response to therapy. Nat Rev Cancer. 2005;5(9):726–734.
- Rosenfeld MR, Ye X, Supko JG, et al. A phase I/II trial of hydroxychloroquine in conjunction with radiation therapy and concurrent and adjuvant temozolomide in patients with newly diagnosed glioblastoma multiforme. Autophagy. 2014;10(8):1359–1368.
- Spinler K, Bajaj J, Ito T, et al. A stem cell reporter based platform to identify and target drug resistant stem cells in myeloid leukemia. Nat Commun. 2020;11(1):5998.
- Jary M, Hasanova R, Vienot A, et al. Molecular description of ANGPT2 associated colorectal carcinoma. Int J Cancer. 2020;147(7):2007–2018.
- Malkomes P, Lunger I, Oppermann E, et al. Transglutaminase 2 promotes tumorigenicity of colon cancer cells by inactivation of the tumor suppressor p53. Oncogene. 2021;40(25):4352–4367.
- Sahani MH, Itakura E, Mizushima N. Expression of the autophagy substrate SQSTM1/p62 is restored during prolonged starvation depending on transcriptional upregulation and autophagy-derived amino acids. Autophagy. 2014;10(3):431–441.
- Yao W, Rose JL, Wang W, et al. Syndecan 1 is a critical mediator of macropinocytosis in pancreatic cancer. Nature. 2019;568(7752):410–414.
- Burbach BJ, Friedl A, Mundhenke C, et al. Syndecan-1 accumulates in lysosomes of poorly differentiated breast carcinoma cells. Matrix Biol. 2003;22(2):163–177.
- Birgisdottir AB, Lamark T, Johansen T. The LIR motif - crucial for selective autophagy. J Cell Sci. 2013;126(Pt 15):3237–3247.
- Wang Z, Miao G, Xue X, et al. The Vici Syndrome Protein EPG5 Is a Rab7 Effector that Determines the Fusion Specificity of Autophagosomes with Late Endosomes/Lysosomes. Mol Cell. 2016;63(5):781–795.
- Cicchetti F, David LS, Siddu A, et al. Cysteamine as a novel disease-modifying compound for Parkinson’s disease: over a decade of research supporting a clinical trial. Neurobiol Dis. 2019;130:104530.
- Jenkins LM, Horst B, Lancaster CL, et al. Dually modified transmembrane proteoglycans in development and disease. Cytokine Growth Factor Rev. 2018;39:124–136.
- Sayyad MR, Puchalapalli M, Vergara NG, et al. Syndecan-1 facilitates breast cancer metastasis to the brain. Breast Cancer Res Treat. 2019;178(1):35–49.
- Cardoso AL, Fernandes A, Aguilar-Pimentel JA, et al. Towards frailty biomarkers: candidates from genes and pathways regulated in aging and age-related diseases. Ageing Res Rev. 2018;47:214–277.
- Leicht DT, Kausar T, Wang Z, et al. TGM2: a cell surface marker in esophageal adenocarcinomas. J Thorac Oncol. 2014;9(6):872–881.
- Subramanian SV, Fitzgerald ML, Bernfield M. Regulated shedding of syndecan-1 and −4 ectodomains by thrombin and growth factor receptor activation. J Biol Chem. 1997;272(23):14713–14720.
- Chen K, Williams KJ. Molecular mediators for raft-dependent endocytosis of syndecan-1, a highly conserved, multifunctional receptor. J Biol Chem. 2013;288(20):13988–13999.
- Kim KH, Lee MS. Autophagy–a key player in cellular and body metabolism. Nat Rev Endocrinol. 2014;10(6):322–337.
- You Z, Xu Y, Wan W, et al. TP53INP2 contributes to autophagosome formation by promoting LC3-ATG7 interaction. Autophagy. 2019;15(8):1309–1321.
- Morita K, Hama Y, Izume T, et al. Genome-wide CRISPR screen identifies TMEM41B as a gene required for autophagosome formation. J Cell Biol. 2018;217(11):3817–3828.
- Osawa T, Kotani T, Kawaoka T, et al. Atg2 mediates direct lipid transfer between membranes for autophagosome formation. Nat Struct Mol Biol. 2019;26(4):281–288.
- Zhao YG, Codogno P, Zhang H. Machinery, regulation and pathophysiological implications of autophagosome maturation. Nat Rev Mol Cell Biol. 2021;22(11):733–750.
- McEwan DG, Popovic D, Gubas A, et al. PLEKHM1 regulates autophagosome-lysosome fusion through HOPS complex and LC3/GABARAP proteins. Mol Cell. 2015;57(1):39–54.
- Jiang P, Nishimura T, Sakamaki Y, et al. The HOPS complex mediates autophagosome-lysosome fusion through interaction with syntaxin 17. Mol Biol Cell. 2014;25(8):1327–1337.
- Pu J, Guardia CM, Keren-Kaplan T, et al. Mechanisms and functions of lysosome positioning. J Cell Sci. 2016;129(23):4329–4339.
- Gundemir S, Colak G, Tucholski J, et al. Transglutaminase 2: a molecular Swiss army knife. Biochim Biophys Acta. 2012;1823(2):406–419.
- Galluzzi L, Pietrocola F, Bravo-San PJ, et al. Autophagy in malignant transformation and cancer progression. Embo J. 2015;34(7):856–880.
- Li C, Zhang Y, Liu J, et al. Mitochondrial DNA stress triggers autophagy-dependent ferroptotic death. Autophagy. 2021;17(4):948–960.
- Liu Y, Shoji-Kawata S, Sumpter RJ, et al. Autosis is a Na+,K+-ATPase-regulated form of cell death triggered by autophagy-inducing peptides, starvation, and hypoxia-ischemia. Proc Natl Acad Sci U S A. 2013;110(51):20364–20371.
- Ishaq M, Ojha R, Sharma AP, et al. Autophagy in cancer: recent advances and future directions. Semin Cancer Biol. 2020;66:171–181.
- Amaravadi RK, Kimmelman AC, Debnath J. Targeting autophagy in cancer: recent advances and future directions. Cancer Discov. 2019;9(9):1167–1181.
- Chen Q, Zheng W, Zhu L, et al. LACTB2 renders radioresistance by activating PINK1/Parkin-dependent mitophagy in nasopharyngeal carcinoma. Cancer Lett. 2021;518:127–139.
- Udristioiu A, Nica-Badea D. Autophagy dysfunctions associated with cancer cells and their therapeutic implications. Biomed Pharmacother. 2019;115:108892.
- Liu H, He Z, Simon HU. Targeting autophagy as a potential therapeutic approach for melanoma therapy. Semin Cancer Biol. 2013;23(5):352–360.
- Golden EB, Cho HY, Jahanian A, et al. Chloroquine enhances temozolomide cytotoxicity in malignant gliomas by blocking autophagy. Neurosurg Focus. 2014;37(6):E12.
- Hori YS, Hosoda R, Akiyama Y, et al. Chloroquine potentiates temozolomide cytotoxicity by inhibiting mitochondrial autophagy in glioma cells. J Neurooncol. 2015;122(1):11–20.
- Compter I, Eekers D, Hoeben A, et al. Chloroquine combined with concurrent radiotherapy and temozolomide for newly diagnosed glioblastoma: a phase IB trial. Autophagy. 2020;17(9):2604–2612.
- Jorge A, Ung C, Young LH, et al. Hydroxychloroquine retinopathy - implications of research advances for rheumatology care. Nat Rev Rheumatol. 2018;14(12):693–703.
- Amaravadi RK, Lippincott-Schwartz J, Yin XM, et al. Principles and current strategies for targeting autophagy for cancer treatment. Clin Cancer Res. 2011;17(4):654–666.
- Prundean A, Youssov K, Humbert S, et al. A phase II, open-label evaluation of cysteamine tolerability in patients with Huntington’s disease. Mov Disord. 2015;30(2):288–289.
- Verny C, Bachoud-Levi AC, Durr A, et al. A randomized, double-blind, placebo-controlled trial evaluating cysteamine in Huntington’s disease. Mov Disord. 2017;32(6):932–936.
- Jin JY, Mereniuk T, Yalamanchali A, et al. A framework for modeling radiation induced lymphopenia in radiotherapy. Radiother Oncol. 2020;144:105–113.
- Abravan A, Faivre-Finn C, Kennedy J, et al. Radiotherapy-related lymphopenia affects overall survival in patients with lung cancer. J Thorac Oncol. 2020;15(10):1624–1635.
- Bacq ZM, Dechamps G, Fischer P, et al. Protection against x-rays and therapy of radiation sickness with beta-mercaptoethylamine. Science. 1953;117(3049):633–636.
- Commisso C, Flinn RJ, Bar-Sagi D. Determining the macropinocytic index of cells through a quantitative image-based assay. Nat Protoc. 2014;9(1):182–192.
- Zheng W, Chen Q, Liu H, et al. CD81 enhances radioresistance of glioblastoma by promoting nuclear translocation of rad51. Cancers (Basel). 2021;13(9):1998.
- Brockmann MA, Ulmer S, Leppert J, et al. Analysis of mouse brain using a clinical 1.5 T scanner and a standard small loop surface coil. Brain Res. 2006;1068(1):138–142.