
ABSTRACT
Age-related macular degeneration (AMD), the leading cause of blindness among the elderly, is without treatment for early disease. Degenerative retinal pigment epithelial (RPE) cell heterogeneity is a well-recognized but understudied pathogenic factor. Due to the daily phagocytosis of photoreceptor outer segments, unique photo-oxidative stress, and high metabolism for maintaining vision, the RPE has robust macroautophagy/autophagy, and mitochondrial and antioxidant networks. However, the autophagy subtype, mitophagy, in the RPE and AMD is understudied. Here, we found decreased PINK1 (PTEN induced kinase 1) in perifoveal RPE of early AMD eyes. PINK1-deficient RPE have impaired mitophagy and mitochondrial function that triggers death-resistant epithelial-mesenchymal transition (EMT). This reprogramming is mediated by novel retrograde mitochondrial-nuclear signaling (RMNS) through superoxide, NFE2L2 (NFE2 like bZIP transcription factor 2), TXNRD1 (thioredoxin reductase 1), and phosphoinositide 3-kinase (PI3K)-AKT (AKT serine/threonine kinase) that induced canonical transcription factors ZEB1 (zinc finger E-box binding homeobox 1) and SNAI1 (Snail family transcriptional repressor 1) and an EMT transcriptome. NFE2L2 deficiency disrupted RMNS that paradoxically normalized morphology but decreased function and viability. Thus, RPE heterogeneity is defined by the interaction of two cytoprotective pathways that is triggered by mitophagy function. By neutralizing the consequences of impaired mitophagy, an antioxidant dendrimer tropic for the RPE and mitochondria, EMT (a recognized AMD alteration) was abrogated to offer potential therapy for early AMD, a stage without treatment.
Abbreviations: ACTB: actin beta; AKT: AKT serine/threonine kinase; AMD: age-related macular degeneration; CCCP: cyanide m-chlorophenyl hydrazone; CDH1: cadherin 1; DAVID: Database for Annotation, Visualization and Integrated Discovery; DHE: dihydroethidium; D-NAC: N-acetyl-l-cysteine conjugated to a poly(amido amine) dendrimer; ECAR: extracellular acidification rate; EMT: epithelial-mesenchymal transition; GAPDH: glyceraldehyde-3-phosphate dehydrogenase; GSEA: Gene Set Enrichment Analysis; HSPD1: heat shock protein family D (Hsp60) member 1; IVT: intravitreal; KD: knockdown; LMNA, lamin A/C; MAP1LC3B: microtubule associated protein 1 light chain 3 beta; MMP: mitochondrial membrane potential; NAC: N-acetyl-l-cysteine; NQO1: NAD(P)H quinone dehydrogenase 1; NFE2L2: NFE2 like bZIP transcription factor 2; O2−: superoxide anion; OCR: oxygen consumption rate; PI3K: phosphoinositide 3-kinase; PINK1: PTEN induced kinase 1; RMNS: retrograde mitochondrial-nuclear signaling; ROS: reactive oxygen species; RPE: retinal pigment epithelium; SNAI1: snail family transcriptional repressor 1; TJP1: tight junction protein 1; TPP-D-NAC: triphenyl phosphinium and N-acetyl-l-cysteine conjugated to a poly(amido amine) dendrimer; TIMM23: translocase of inner mitochondrial membrane 23; TOMM20: translocase of outer mitochondrial membrane 20; Trig: trigonelline; TXNRD1: thioredoxin reductase 1; VIM: vimentin; WT: wild-type; ZEB1: zinc finger E-box binding homeobox 1
Introduction
Age-related macular degeneration (AMD) is the most common cause of blindness among the elderly in western societies [Citation1]. In the US, the number of people with AMD is similar to those with all invasive cancers combined and double those with Alzheimer disease [Citation2]. While treatment is available for intermediate and effective for neovascular AMD, no therapy exists for early disease. Like many age-related diseases, AMD has multiple pathogenic etiologies. The National Eye Institute’s AMD Pathobiology group concluded that identifying and prioritizing the major pathogenic signals and determining whether they interact with one another at each disease stage will accelerate the development of treatment for each stage [Citation3].
The retinal pigment epithelium (RPE) is situated between photoreceptors and the choriocapillaris at its apex and base, respectively, where it is uniquely and chronically exposed to light for vision. As a result, the RPE possesses multiple specialized, energy dependent functions involved with vision and a robust mitochondrial network to match this demand [Citation4]. As a post-mitotic epithelium, the RPE relies on multiple cytoprotective processes such as a robust antioxidant system including NFE2L2 (NFE2 like bZIP transcription factor2) to neutralize metabolically derived oxidative stress and chronic light exposure to survive because they are unable to proliferate in response to stress. In addition, the RPE relies on efficient macroautophagy/autophagy to process oxidatively damaged proteins and organelles in addition to the 30,000 photoreceptor outer segments phagocytosed per day [Citation5–7].
In early AMD, the traditional perspective is that the RPE degenerates and dies [Citation8]. However, RPE heterogeneity is well-described [Citation9–14], but underappreciated, and if understood, could guide therapeutic development. While ordered cell heterogeneity protects any organism [Citation15], degenerative heterogeneity from stress is pathogenic from disease driving subclones, even if comprised of few cells [Citation16]. In early AMD, perifoveal macular RPE are dysmorphic, coinciding with rod death [Citation17–24], which suggests that a perifoveal RPE clone drives early AMD and thus, are a viable treatment target.
Autophagy impairment and mitochondrial dysfunction have emerged as early pathophysiologic events in AMD [Citation1,Citation25–29]. Mitochondrial injury markedly increases reactive oxygen species (ROS), which can disrupt homeostatic signaling [Citation30–33]. Previously, we showed that NFE2L2 is decreased in dysmorphic perifoveal RPE with early AMD, and that impaired NFE2L2 signaling induced RPE degeneration [Citation34,Citation35]. Mitophagy is an autophagy subtype where damaged mitochondrial fragments are sequestered and degraded to preserve mitochondrial network health. Unlike autophagy, the role of mitophagy in the RPE is understudied. Furthermore, in early AMD, it is unclear how impaired mitophagy, mitochondrial function, and NFE2L2 signaling contribute to RPE degeneration. Given AMD’s multifactorial etiology, we hypothesized that mitophagy becomes impaired to induce mitochondrial dysfunction and oxidative stress, which signals degenerative RPE heterogeneity. Herein, we showed in vitro and in an in vivo model that simulates the human perifovea that PINK1 (PTEN induced kinase 1) mediated mitophagy launches retrograde mitochondrial to nuclear signaling (RMNS) that critically depends upon NFE2L2 stress signaling to define RPE heterogeneity. In essence, two cytoprotective pathways, initiated by PINK1 mediated mitophagy and dependent upon NFE2L2 antioxidant signaling, intimately interact to regulate cell heterogeneity, a hallmark feature of many age-related diseases including AMD. Finally, we used a novel RPE and mitochondrial specific antioxidant dendrimer to mitigate epithelial-mesenchymal transition (EMT), a subclone of RPE heterogeneity recognized in AMD, which offers therapeutic potential in treating early AMD, a disease stage without treatment.
Results
PINK1 is decreased in perifoveal RPE of early AMD eyes
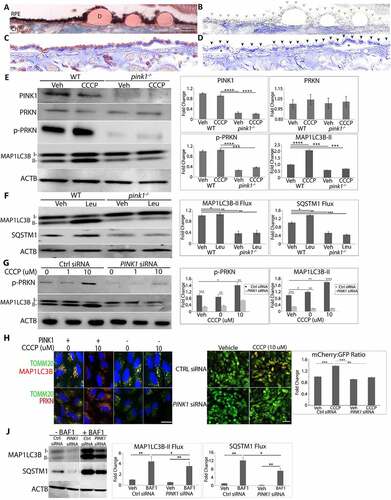
Since the earliest AMD changes to the RPE occur in the perifovea [Citation17,Citation18,Citation23,Citation24], the distribution of PINK1, a mitochondrial serine/threonine-protein kinase that initiates mitophagy, was examined in early AMD eyes (Minnesota grade 1–3; Table S1). In AMD perifoveas, PINK1 immunolabeling was abundant and uniform throughout the neurosensory retina, but a mosaic of strong and weak labeling in morphologically normal and dysmorphic RPE, respectively () and Figure. S1). In non-AMD perifoveas, PINK1 labeling was uniformly strong in the RPE ()). This labeling pattern suggests that PINK1 is reduced in dysmorphic perifoveal RPE with early AMD.
Figure 1. PINK1 immunolabeling in early AMD and its effect on mitophagy. (a) Perifoveal section from an 87 yo F with AMD (MGS2) with decreased PINK1 immunolabeling in the RPE. Ch, choroid; D, drusen; Bar: 25 μm. (b) Same image after Nuance correction to remove pigment. Grey arrowheads show RPE with weak PINK1 staining. (c) Perifoveal section from an 87 yo male without AMD with strong PINK1 labeling in the RPE. (d) After Nuance correction. Black arrowheads show RPE with strong PINK1 labeling. *indicates artifactitious RPE detachment from tissue preparation. (e) Western blot of mitophagy proteins in the RPE after WT and pink1−/− mice were given IVT 10 μM CCCP or vehicle (DMSO) and sacrificed after 4 h. (f) Western blot of mitophagy flux of MAP1LC3B conversion and SQSTM1 accumulation in the RPE after WT and pink1−/− mice were given 40 mg/kg lysosome inhibitor leupeptin or vehicle (DMSO) intraperitoneally and sacrificed after 4 h. (g) Western blot of mitophagy genes in ARPE-19 cells treated with control (ctrl) or PINK1 siRNA for 5 days and then exposed to 10 μM CCCP for 4 h. (h) PRKN and MAP1LC3B (both red) co-stained with mitochondrial TOMM20 (green) after CCCP in control and PINK-KD ARPE-19 cells. Bar: 10 μm (i). Control or PINK1-KD cells were transduced with adenovirus containing mCherry-eGFP-COX8A and then treated with 10 μM CCCP or vehicle. Control cells have prominent eGFP mitochondrial labeling. When mitochondrial injury is induced with CCCP to stimulate mitophagy, a shift to acid resistant mCherry labeling was seen in control cells, but not PINK1-KD cells treated with CCCP. Bar: 25 μm. The graph quantifies the mCherry:eGFP ratio (N = 30 cells; N = 3 experiments). (j). Western blot of mitophagy flux in PINK1-KD cells 4 h after 100 nM bafilomycin A1 or vehicle of MAP1LC3B conversion and SQSTM1 accumulation. ACTB was used for normalization. Band intensities were plotted as fold change. Mean ± SD, N = 3, Student’s t-test; * P < 0.05, **P < 0.01, ***P < 0.001, ****P < 0.0001.
PINK1 deficiency impairs mitophagy in the RPE
Mice are a reasonable anatomic model for studying early AMD because their RPE and rod/cone density are similar to the human perifovea [Citation36]. To interrogate impaired PINK1 signaling in the RPE, pink1−/− and littermate wild-type (WT) controls were given intravitreal (IVT) injections of CCCP (carbonyl cyanide m-chlorophenyl hydrazone) to induce mitophagy. Mice were sacrificed at 9 am to reduce circadian variability with photoreceptor phagocytosis and fed to minimize generalized autophagy. p-PRKN (parkin RBR E3 ubiquitin protein ligase)-S65, which is phosphorylated by PINK1 [Citation37], was increased in the RPE of controls, but barely detected in pink1−/− mice ()). MAP1LC3B (microtubule associated protein 1 light chain 3 beta) lipidation was increased in the RPE of controls after CCCP but not in pink1−/− mice ()). When mice were given intraperitoneal leupeptin, a lysosomal protease inhibitor, MAP1LC3B lipidation was increased in controls, but not in pink1−/− mice. Furthermore, SQSTM1 was increased in WT mice given leupeptin, but was markedly decreased in the RPE of pink1−/− mice and remained so after leupeptin ()). These results suggest that mitophagy flux was impaired with PINK1 deficiency.
To determine whether PINK1 deficiency impairs mitophagy in human cells, ARPE-19 cells were cultured in serum and treated with an siRNA-PINK1 (PINK1-KD) and CCCP. PRKN was detected in mitochondrial, but not cytoplasmic fractions by western blot (Fig. S2A), was co-localized with outer mitochondrial membrane protein TOMM20 (translocase of outer mitochondrial membrane 20), inner mitochondrial membrane protein TIMM23 (translocase of inner mitochondrial membrane 23), and mitochondrial matrix protein HSPD1 (heat shock protein family D (Hsp60) member 1; ) Fig S3). In addition, p-PRKN was increased after CCCP in controls, effects that were blunted with PINK1-KD ()). MAP1LC3B lipidation was observed in mitochondrial, but not cytoplasmic fractions by western blot (Fig. S2A) and MAP1LC3B colocalized with TOMM20, TIMM23, and HSPD1 in control cells but not in PINK1-KD cells after treatment with CCCP (), Figure S3). As in mice, these changes were abrogated with PINK1-KD (), )). Control or PINK1-KD cells were then transduced with an adenovirus containing mCherry-eGFP-COX8A which targets mitochondria. In lysosomes, the green eGFP is quenched while red mCherry is resistant to acidic pH. In , Ctrl siRNA cells transduced with mCherry-eGFP-COX8A had green eGFP labeling, which suggests a low level of mitophagy. When treated with CCCP, cells displayed a distinct shift toward red mCherry fluorescence, suggestive of autolysosome-enwrapped mitochondria, which reflects mitophagy [Citation38]. In contrast, transfected PINK1-KD cells did not display red mCherry fluorescence with or without CCCP treatment. Furthermore, mitophagy flux was reduced with PINK1-KD. MAP1LC3B lipidation in mitochondrial fractions was greater in controls than PINK1-KD cells, and more so after treatment with lysosomal inhibitor bafilomycin A1 ()). These observations suggest that PINK1 induces mitophagy in mouse and human RPE and that PINK1 deficiency impairs mitophagy.
PINK1 deficiency impairs mitochondrial function
Mitochondria were dysfunctional in the RPE of both pink1−/− mice and ARPE-19 cells using several indicators of mitochondrial function. The RPE of pink1−/− mice had increased superoxide anion (O2−) and decreased oxygen consumption rates (OCR) relative to WT mice ()). Likewise, PINK1-KD cells had decreased OCR ()) and increased glycolysis, as detected by decreased extracellular acidification rates (ECAR) ()) and increased lactate (Fig. S2B). With PINK1-KD, ATP and mitochondrial membrane potential (MMP) were also decreased while mitochondrial O2− was increased ()).
Figure 2. PINK1 deficient cells exhibit mitochondrial dysfunction. (a) In WT and pink1−/− mice, sections were labeled with 5 μM DHE (dihydroethidium) and the number of superoxide stained cells per 50 cells were counted and plotted (N = 3). (b) In vivo oxygen consumption measured using Mito-ID oxygen consumption kit and plotted as fluorescence units per eye (N = 3). (c-g) Seahorse assay was used to measure mitochondrial respiration in ARPE-19 cells as a function of OCR over time (min) following serial injections of oligomycin, 2-(2-[4 {trifluoromethoxy}phenyl]hydrazinylidene)-propanedinitrile, and rotenone-antimycin. Maximal respiration was measured after 2-[2-[4 (trifluoromethoxy)phenyl]hydrazinylidene]-propanedinitrile injection and spare respiratory capacity was calculated by subtracting basal from maximal respiration. Glycolysis was measured as a function of ECAR (N = 5). (h) ATP was measured using CellTiter-Glo® Luminescent Assay in ARPE-19 cells and plotted as fluorescence units per well. (i) Mitochondrial membrane potential was measured after 20 nM Tetramethylrhodamine, Methyl Ester, Perchlorate treatment. (j) Mitochondrial superoxide was quantified using the MitoSOX (5 µM, 20 min; N = 3). Graphs show fluorescence units/well; OCR, oxygen consumption rate; ECAR, extracellular acidification rate; mean ± SD, Student’s t-test; * P < 0.05, **P < 0.01, ***P < 0.001.
![Figure 2. PINK1 deficient cells exhibit mitochondrial dysfunction. (a) In WT and pink1−/− mice, sections were labeled with 5 μM DHE (dihydroethidium) and the number of superoxide stained cells per 50 cells were counted and plotted (N = 3). (b) In vivo oxygen consumption measured using Mito-ID oxygen consumption kit and plotted as fluorescence units per eye (N = 3). (c-g) Seahorse assay was used to measure mitochondrial respiration in ARPE-19 cells as a function of OCR over time (min) following serial injections of oligomycin, 2-(2-[4 {trifluoromethoxy}phenyl]hydrazinylidene)-propanedinitrile, and rotenone-antimycin. Maximal respiration was measured after 2-[2-[4 (trifluoromethoxy)phenyl]hydrazinylidene]-propanedinitrile injection and spare respiratory capacity was calculated by subtracting basal from maximal respiration. Glycolysis was measured as a function of ECAR (N = 5). (h) ATP was measured using CellTiter-Glo® Luminescent Assay in ARPE-19 cells and plotted as fluorescence units per well. (i) Mitochondrial membrane potential was measured after 20 nM Tetramethylrhodamine, Methyl Ester, Perchlorate treatment. (j) Mitochondrial superoxide was quantified using the MitoSOX (5 µM, 20 min; N = 3). Graphs show fluorescence units/well; OCR, oxygen consumption rate; ECAR, extracellular acidification rate; mean ± SD, Student’s t-test; * P < 0.05, **P < 0.01, ***P < 0.001.](/cms/asset/74f4682d-695e-4a73-a0a3-26d15ae85707/kaup_a_2109286_f0002_oc.jpg)
Impaired mitophagy induces epithelial-mesenchymal transition (EMT)
RPE cells that had impaired mitophagy due to PINK1 deficiency displayed morphologic, ultrastructural, and molecular evidence of EMT. While hexagonally shaped in 2-month-old pink1−/− mice, the RPE of 4-month-old pink1−/− mice were enlarged and dysmorphic with increased cell-aspect ratios ()). These dysmorphic RPE of 4-month-old pink1−/− mice had ultrastructural changes suggestive of mitochondrial injury and EMT ()). Specifically, while mitochondria number in the RPE of 4-month-old WT and pink1−/− mice was similar, the mitochondria in the RPE of pink1−/− mice were diffusely distributed rather than basally located, as in WT mice. Mitochondria were round with loss of cristae while in WT mice, they remained elongated and branched with well-defined cristae. Tight junctions were confined to the apex in the RPE of pink1−/− mice but spanned the entire RPE of WT mice. Basolateral infoldings were shortened and fewer, especially when adjacent to basal laminar deposits in the RPE of pink1−/− mice relative to WT mice ()). Molecularly, VIM (vimentin) was increased and tight junction component CDH1 (cadherin 1) was decreased in the RPE of pink1−/− mice relative to WT mice. Likewise, the mRNA expression of prototypical EMT transcription factors Zeb1 (zinc finger E-box binding homeobox1) and Snai1 (snail family transcriptional repressor 1) was increased in the RPE of pink1−/− mice ()).
Figure 3. PINK1 loss induces EMT in RPE cells. (a) RPE flatmount from a WT and pink1−/− mouse stained with anti-TJP1 (tight junction protein1) and imaged at 20X. Cell shape change was quantified using the cell aspect ratio with ImageJ (>15 cells measured/group, N = 5). (b) By TEM, the junctional complex of WT RPE is well developed (red arrowhead) from apical to basal region between 2 RPE cells. Mitochondria are elongated and adjacent to junctional complexes (left panel). Elongated mitochondria have well developed cristae (red arrowhead), are diffusely distributed including basal location (right panel), and RPE have normal basal infoldings (red arrowhead). In contrast, pink1−/− RPE have truncated junctional complexes (red arrowhead; left panel) and rounded mitochondria with degenerated cristae (red arrowhead; right panel). pink1−/− RPE have basal laminar deposits (red line) and truncated basal infoldings (lower panel). A, apical microvilli, BI, basal infoldings, M, melanin granule, N, nucleus. Bar: 250 μm. (c) Western blot of mesenchymal marker VIM and epithelial specific CDH1 using ACTB for signal normalization and graphed as fold change. EMT transcription factors Snai1 and Zeb1 quantified as ddCt fold change using Taqman based qRT-PCR using Gapdh to normalize signal (N = 3). (d) Brightfield image of ARPE-19 cells treated with Ctrl or PINK1 siRNA and grown for 5 days on a plastic 6-well plate or a 6-well Transwell filter support system. (e) Brightfield image of iPSC-RPE cells grown on Matrigel coated plate after siRNA transfection, or PINK1 or control lentiviral particle transduction and grown for 4 weeks with puromycin selection. (f) Control or PINK1 siRNA treated ARPE-19 cells fixed and stained with anti-TJ1 (red) and anti-VIM (green) for immunocytochemistry, a western blot of CDH1 and VIM using ACTB for normalization and plotted as fold change. EMT transcription factors SNAI1 and ZEB1 were quantified using TaqMan qRT-PCR assay and plotted as fold change after ddCT calculations (N = 3). (g) RNA-seq analysis showing EMT specific genes from the Broad Institute’s GSEA data set plotted against Enrichment Score or log fold change in the most differentially expressed genes in PINK1 KD vs control ARPE-19 cells; NES, normalized enrichment score; FDR, false discovery rate. (h) The perifovea of an 87 yo female with early AMD has minimal SNAI1 labeling in morphologically normal RPE compared to mildly dysmorphic RPE over a small drusen (top, left) and severely dysmorphic RPE overlying large drusen (bottom left). Same images after removing pigment with Nuance (right panels). Arrowheads indicate regions of strong SNAI1 labeling in RPE. Note artifactual labeling due to debris in the subretinal space above the RPE (*). D, drusen; ch, choroid; bar: 25 μm. Mean ± SD, Student’s t-test; *P < 0.05; **P < 0.01; ***P < 0.001.
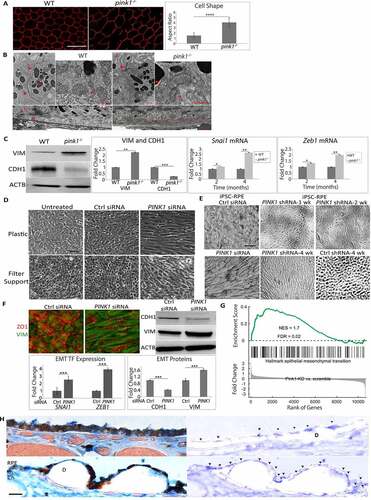
PINK1-KD in human ARPE-19 cells also developed mesenchymal morphology after 6 days in culture, whether grown on plastic or filter supports to maximize differentiation. In contrast, PINK1-KD cells did not develop mesenchymal morphology when transfected with a PINK1 plasmid () and Figure. S4A). Similarly, human iPSC-RPE cells transfected with siRNA or shRNA and grown for 4 weeks developed mesenchymal morphology ()). PINK1-KD cells had prominent VIM immunolabeling, increased VIM and reduced CDH1 by western blot, and increased expression of ZEB1 and SNAI1 ()).
RNA-seq was performed on ARPE-19 cells to explore the extent of transcriptional EMT that developed with PINK1-KD. After multiple testing corrections, 927 genes were upregulated and 859 genes were downregulated by PINK1-KD (Table S2). With function enrichment analysis, upregulated genes related to EMT including cell-cell adhesion, extracellular matrix organization, matrix-receptor interaction, and focal adhesion were among the highest ranked categories. Of downregulated genes, two highly ranked categories included oxidative phosphorylation and mitochondrial electron transport (Table S3). Furthermore, PINK1-KD had significant gene enrichment of the Broad Institute’s GSEA (Gene Set Enrichment Analysis) 200 EMT gene database (Enrichment score 1.7, FDR P-value 0.02; )). These data suggest that PINK1-KD induced a transcriptome suggestive of EMT.
To link these experimental findings of EMT with AMD, the distribution of SNAI1 in the perifovea of early AMD eyes was examined by immunohistochemistry. SNAI1 labeling was mosaic. SNAI1 immunolabeling was minimal in morphologically normal RPE. In contrast, SNAI1 labeling was increased in dysmorphic RPE overlying drusen in early AMD perifoveas () and Table S1). In the RPE of non-AMD perifoveas, SNAI1 labeling was also minimal (Fig. S4B, C).
Retrograde mitochondrial-nuclear signaling (RMNS) drives EMT
We next sought to identify how impaired mitophagy induces EMT, hypothesizing that elevated mitochondrial ROS initiates EMT signaling. Indeed, ARPE-19 PINK1-KD cells had elevated mitochondrial O2− due to impaired electron transport chain I, III, and IV activities () and S5A). PINK1-KD cells were treated with the mitochondrial antioxidant mitoTEMPO, the general antioxidant N-acetyl-l-cysteine (NAC), NAC conjugated to a poly(amido amine) dendrimer (D-NAC), which is tropic for the RPE, or D-NAC with Triphenyl phosphinium, a mitochondrial targeting ligand (TPP-D-NAC) [Citation39,Citation40]. Mitochondrial O2− was neutralized by mitoTEMPO and TPP-D-NAC, but not NAC and D-NAC ()). TPP-D-NAC also neutralized mitochondrial H2O2 with minimal effect on cytoplasmic H2O2 ()). Importantly, TPP-D-NAC most completely restored mesenchymal morphology with peripherally located CDH1 and minimal cytoplasmic VIM labeling. These changes corresponded with restored CDH1 and VIM levels after TPP-D-NAC from decreased CDH1 and increased VIM with PINK1-KD, as seen on western blot. TPP-D-NAC also minimized the increased expression of ZEB1 induced by PINK1-KD ()). In contrast, exogenously administered tert-butyl hydroperoxide did not induce EMT (Fig. S5B).
Figure 4. Mitochondrial ROS and NFE2L2 are required for EMT. ARPE-19 cells treated with Ctrl or PINK1 siRNA were incubated with MitoTEMPO, NAC, D-NAC or TPP-D-NAC for 24 h. (a) Mitochondrial superoxide was quantified with MitoSOX (5 μM, 20 min. treatment) and plotted as fluorescence units/well (N = 3). (b) Mitochondrial and cytoplasmic H2O2 were measured using mito-roGFP2-ORP1 or cyto-roGFP2 fusion protein as a redox sensitive fluorescent biosensor and plotted as fluorescence units/well (N = 4). (c) Immunocytochemistry image of CDH1 (green), VIM (red) and DAPI (blue) showing cell morphology and mesenchymal transition in PINK1-KD cells and cellular response after adding MitoTEMPO, NAC, D-NAC, or TPP-D-NAC. Graph shows the cell shape after calculating the cell aspect ratio (>20 cells measured/group). Note how CDH1 labeling in the periphery is lost and cytoplasmic VIM labeling is increased with PINK1-KD, and that these changes are decreased with antioxidant treatment. Bar: 25 μm. Western blot shows increased CDH1 and decreased VIM with PINK1-KD, changes that are mitigated with antioxidant treatment (MitoTEMPO, NAC, D-NAC, and TPP-D-NAC). Results are represented as fold change (N = 3). EMT transcription factor ZEB1 was quantified using TaqMan qRT-PCR and plotted as fold change after ddCT calculations (N = 3). (d) Western blot of nuclear NFE2L2 accumulation with PINK1-KD relative to Ctrl siRNA, represented as fold change (N = 3). LMNB1 (lamin B1) was used as loading control. (e) Immunocytochemistry image of CDH1 (green), VIM (red) and DAPI (blue) showing ARPE-19 cell morphology and mesenchymal transition after treatment with siRNAs for PINK1, PINK1 and NFE2L2, or PINK1 with NFE2L2 inhibitor Trigonelline (1 uM). Note how CDH1 labeling in the periphery is lost and cytoplasmic VIM labeling is increased with PINK1-KD, which are prevented with NFE2L2 inhibition. Bar: 25 μm. Relative to PINK1-KD cells, on western blot, CDH1 is increased and VIM is decreased VIM with NFE2L2 inhibition. Results are represented as fold change (N = 3). ZEB1 was quantified using TaqMan qRT-PCR and plotted as fold change after ddCT calculations (N = 3). (f) STRING analysis of DEGs (FDR<0.05) obtained from RNA-seq comparing PINK1-KD alone and PINK1-NFE2L2 siRNA treated ARPE-19 cells, which shows TXNRD1 as a major NFE2L2 downstream target. (g) Immunocytochemistry image of CDH1 (green), VIM (red), and DAPI (blue) showing ARPE-19 cell morphology and mesenchymal transition after treatment with siRNAs for PINK1 and prevention with TXNRD1 siRNA. Bar: 25 μm. Relative to PINK1-KD cells, on western blot, CDH1 is increased and VIM is decreased with TXNRD1 inhibition. Results are represented as fold change (N = 3). ZEB1 was quantified using TaqMan qRT-PCR and plotted as fold change after ddCT calculations (N = 3). Mean ± SD, Student’s t-test; *P < 0.05, **P < 0.01 ***P < 0.001, ****P < 0.0001.
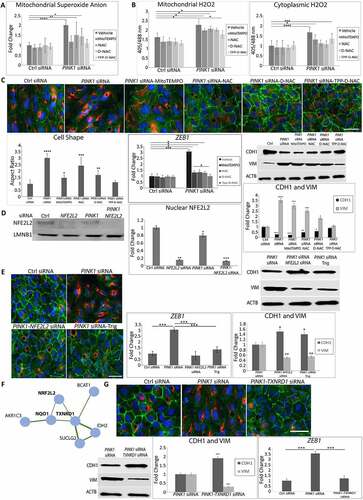
We then examined NFE2L2 as a signaling component of EMT induction because it can be induced by ROS. NFE2L2 was translocated to the nucleus in PINK1-KD and control siRNA ARPE-19 cells but was inhibited by the addition of NFE2L2 siRNA ()). PINK1-KD cells treated with either NFE2L2 siRNA or trigonelline (Trig), which prevents NFE2L2 nuclear translocation, did not develop mesenchymal morphology and maintained peripheral CDH1 location with minimal cytoplasmic VIM. With western blot, compared to levels with PINK1-KD, CDH1 was increased and VIM was decreased with NFE2L2 inhibition, either by NFE2L2 siRNA or Trig. Likewise, PINK1-KD cells treated with NFE2L2 inhibition did not have augmented expression of ZEB1 ()). Since NFE2L2 regulates a large cytoprotective gene cluster, RNA-seq was performed on PINK1-KD, NFE2L2-KD, PINK1-NFE2L2-KD, and scrambled control ARPE-19 cells. String analysis identified two genes, NQO1 (NAD(P)H quinone dehydrogenase 1) and TXNRD1 (thioredoxin reductase 1), that were downregulated with NFE2L2 KD in PINK1-NFE2L2-KD relative to PINK1-KD cells ()). This analysis suggests that NFE2L2 regulates these two genes under these experimental conditions. Indeed, TXNRD1 siRNA added to PINK1-KD cells maintained normal morphology and preserved peripheral CDH1 with minimal cytoplasmic VIM. Relative to PINK1-KD cells, on western blot, CDH1 was increased and VIM was decreased with TXNRD1-KD. In addition, TNXRD1-KD in PINK1-KD cells also prevented induction of ZEB1 mRNA expression relative to PINK1-KD cells ()).
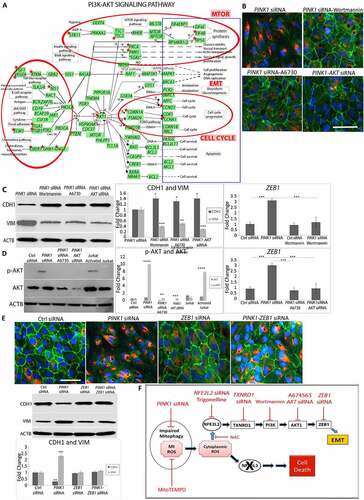
Using RNA-seq pathway analysis, we also identified over-represented genes in the (phosphoinositide 3-kinase (PI3K)-AKT (AKT serine/threonine kinase) pathway with PINK1-KD (p < 2.1E-5; )). DAVID (Database for Annotation, Visualization and Integrated Discovery pathway analysis) uncovered an AKT activation hub with PINK1-KD that potentially regulates EMT genes (Table S4). We therefore explored whether PI3K-AKT is involved in the RMNS that induces EMT. Using the PI3K inhibitor wortmannin, we found that the mesenchymal morphology was prevented, the peripheral CDH1 immunolocalization was maintained, and cytoplasmic VIM remained low ()). On western blot, relative to PINK1-KD cells, CDH1 was increased and VIM was decreased after wortmannin ()). Likewise, wortmannin treatment also prevented ZEB1 induction that was normally observed with PINK1-KD ()). With PINK1-KD, AKT signaling was induced, as indicated by increased p-AKT1-ser473 relative to control siRNA cells. Using A6730, an AKT1 inhibitor, or AKT1 siRNA, we found that mesenchymal morphology was prevented, p-AKT1-ser473 was decreased, and ZEB1 was decreased relative to PINK1-KD cells (), ), )). Finally, when treated with ZEB1 siRNA, PINK1-KD cells did not develop a mesenchymal morphology and maintained peripheral CDH1 with minimal cytoplasmic VIM ()). On western blot, CDH1 was decreased and VIM was increased with PINK1-KD. These levels were restored to that of controls with ZEB1-KD. These data suggest that RMNS is initiated by mitochondrial O2− to activate NFE2L2, TXNRD1, and PI3K/AKT that induces ZEB1 ()).
Figure 5. Mitochondrial retrograde signaling. (a) DEGs (FDR<0.05) from RNA-seq (red stars) in Ctrl vs PINK1 siRNA treated ARPE-19 cells plotted on DAVID PI3K-AKT signaling pathway. Red circles indicate the regions of the pathway that have a high concentration of DEGs with their annotated functional features. “SGKs” indicates multiple SGK isoforms. (b) Immunocytochemistry images of CDH1 (green), VIM (red), and DAPI (blue) showing ARPE-19 cell morphology and mesenchymal transition after treatment with PINK1 siRNA alone and prevention after treatment with 100 nM wortmannin (PI3K inhibitor), 100 nM A6730 (AKT1 inhibitor), or AKT siRNA. Bar: 25 μm. (c) On western blot, CDH1 was increased and VIM was decreased after treatment with wortmannin, A6730, or AKT siRNA (N = 3). ZEB1 induction was prevented with wortmannin and was quantified using TaqMan qRT-PCR and plotted as fold change after ddCT calculations (N = 3). (d) Western blot of p-AKT and AKT in various siRNA treated cells and quantified as fold change (N = 3). Jurkat and activated Jurkat cell extracts were used as controls. ZEB1 increase was prevented with AKT inhibition and was quantified using TaqMan qRT-PCR and plotted as fold change after ddCT calculations (N = 3). (e) Immunocytochemistry images of CDH1 (green), VIM (red), and DAPI (blue) showing ARPE-19 cell morphology and mesenchymal transition after treatment with siRNAs for Ctrl, PINK1, ZEB1, or PINK1 and ZEB1. Bar: 25 μm. On western blot, CDH1 was increased and VIM was decreased after treatment with ZEB1 siRNA (N = 3). (f) Cartoon of the proposed mitochondrial retrograde signaling leading to EMT or cell death. Black oval, mitochondria, red texts indicate inhibition, blue arrows indicate activation. Mean ± SD, Student’s t-test, **P < 0. 01 ***P < 0.001.
The impairment of two cytoprotective pathways induces RPE death
While impaired mitophagy induced EMT, a protective response, the addition of another impaired cytoprotective pathway might jeopardize cell survival. RMNS requires NFE2L2, which activates a comprehensive cytoprotective network and is decreased in a number of age-related diseases including AMD [Citation34]. We thus interrogated whether impaired NFE2L2 combined with deficient PINK1 influences cell survival. Indeed, the combination of impaired NFE2L2 and PINK1 severely impaired basal OCR, which measures the mitochondria’s ability to meet the ATP demand, spare capacity, which reflects the cell’s stress response, and maximal OCR, which marks the mitochondria’s maximal stress response ()). Additionally, ATP and mitochondrial membrane potential (MMP) were dramatically decreased and mitochondrial O2− increased with PINK1-NFE2L2-KD ()).
Figure 6. Two impaired cytoprotective pathways induce cell death. ARPE-19 cells were treated with Ctrl, PINK1, NFE2L2, and PINK1-NFE2L2 siRNAs. (a) Basal, maximal, spare respiratory capacity oxygen consumption were measured by Seahorse assay and (b) ATP by CellTiter-Glo® Luminescent Assay, mitochondrial superoxide anion by MitoSOX assay, and mitochondrial membrane potential by TMRM assay were quantified. (c) 10X brightfield image showing ARPE-19 cell morphology after treatment with siRNAs for Ctrl, NFE2L2, PINK1, and NFE2L2-PINK1. Cell morphology was plotted after calculating the cell aspect ratio (>20 cells measured/group). ZEB1 and SNAI1 were quantified using TaqMan qRT-PCR and plotted as fold change after ddCT calculations (N = 3). (d) RNA-seq analysis showing EMT-specific genes from the Broad Institute’s GSEA data set with transcriptional reprogramming induced by PINK1-KD is modified by PINK1-NFE2L2-KD. (e) Cells were wounded with a plastic tip (top panels), migration was measured 24 h later, and graphed. (f) Cell viability quantified using the LIVE/DEAD assay. WT, pink1−/−, nfe2l2−/−, pink1−/−nfe2l2−/-, and pink1−/− mice treated with Trig mice were assessed for retrograde mitochondrial to nuclear signaling. (g) Txnrd1 was assessed using TaqMan RT-qPCR and plotted as fold change after ddCT calculations (N = 3). (h) Western blot of p-AKT and AKT and quantified as fold change (N = 3). ACTB was used as loading control. (i) Zeb1 was assessed using TaqMan RT-qPCR and plotted as fold change after ddCT calculations (N = 3). (j) In vivo oxygen consumption measured using Mito-ID oxygen consumption kit and plotted as fluorescence units per eye (N = 3). (k) RPE flatmounts stained with anti-TJ1 and imaged at 20X. Cell shape change was quantified using the cell aspect ratio with ImageJ (>15 cells measured/group, N = 5). (l) RPE cell survival from freshly dissected eyecups was assessed using ethidium homodimer staining with TJ1 immunolabeling to identify cell margins. The number of ethidium-stained nuclei was quantified and presented in the graph. A toxic dose of CSE (1000 μg/ml) was used. Bar: 25 μm. Mean ± SD, Student’s t-test; *P < 0.05, **P < 0.01, ***P < 0.001, ****P < 0.0001.
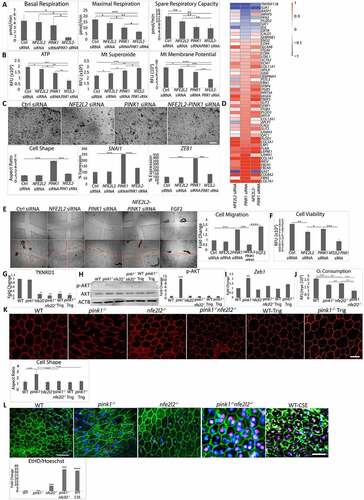
With PINK1-NFE2L2-KD, RPE morphology was paradoxically restored and the expression of SNAI1 and ZEB1 was uninduced ()). To explore how the morphology could be reversed, RNA-seq analysis was performed on PINK1-KD, NFE2L2-KD PINK1-NFE2L2-KD, and control ARPE-19 cells. NFE2L2-KD appeared to induce transcriptional reprogramming related to EMT. When differentially expressed genes from the Broad Institute’s GSEA EMT dataset in any of the 4 treatment groups were sorted by expression profile, the PINK1-KD profile was distinct from PINK1-NFE2L2-KD, which was similar to NFE2L2-KD ()). Functionally, PINK1-NFE2L2-KD cells did not migrate after injury and had significant cell death ()).
Similar changes were observed in mice. Both Trig treated pink1−/− and pink1−/−nfe2l2−/− 4-month-old mice had impaired RMNS. pink1−/− or WT mice given Trig in their water for 2 months [Citation41] had decreased NFE2L2 nuclear translocation in the RPE (Fig. S6A). While increased in the RPE of pink1−/− mice, TXNRD1, p-AKT, Zeb1, and Snai1 were decreased in Trig-treated pink1−/− and pink1−/−nfe2l2−/− mice () and Fig. S6B, S6C). The RPE of pink1−/−nfe2l2−/− mice had severely decreased OCR ()). The RPE was dysmorphic in pink1−/− mice, but hexagonal in pink1−/−nfe2l2−/− and Trig treated pink1−/− mice ()). RPE viability was decreased in pink1−/−nfe2l2−/− mice and was similar to WT RPE given a toxic smoke extract dose (1000 μg/ml; )).
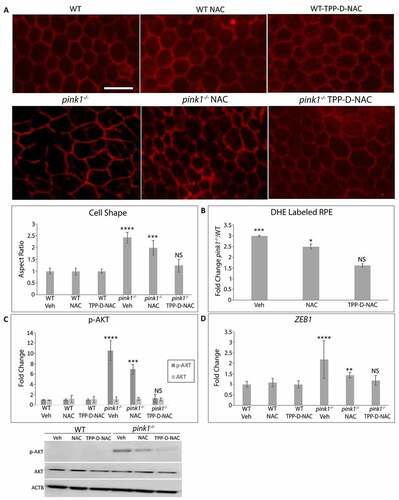
TPP-D-NAC prevents RPE EMT
The RPE enters EMT after mitochondrial derived ROS trigger a RMNS cascade. To determine whether RMNS is a therapeutic target to prevent RPE EMT in vivo, TPP-D-NAC was given intraperitoneally every 4 days for 1 month to 3-month-old pink1−/− mice, an age without EMT. As expected, the RPE of 4-month-old pink1−/− mice had mesenchymal morphology. While this mesenchymal morphology of the RPE in pink1−/− mice was unchanged by treatment with vehicle or NAC, TPP-D-NAC prevented mesenchymal transition and appeared similar to WT mice treated with vehicle, NAC, or TPP-D-NAC ()). TPP-D-NAC also decreased O2−, prevented AKT phosphorylation, and Zeb1 induction in the RPE of pink1−/− mice ()). These data indicate that TPP-D-NAC decreases mitochondrial ROS induced RPE EMT.
Figure 7. TPP-D-NAC prevents RPE EMT to the RPE of pink1−/− mice. WT and pink1−/− mice were treated with intraperitoneal TPP-D-NAC (25 mg/kg) or NAC (25 mg/kg) for 1 month. (a) RPE flatmounts stained with anti-TJ1 were imaged at 20X. Cell morphology was plotted after calculating the cell aspect ratio (>20 cells measured/group). (b) Superoxide anion in the RPE was measured using DHE labeling and quantified as the fold change of DHE labeled RPE in pink1−/−:WT mice using DAPI nuclei to count cells. (c) Western blot of p-AKT and AKT and quantified in the graph as fold change (N = 3). ACTB was used as loading control. (d) Zeb1 was assessed using TaqMan RT-qPCR and plotted as fold change after ddCT calculations (N = 3). Mean ± SD, Student’s t-test; *P < 0.05, **P < 0.01, ***P < 0.001, ****P < 0.0001. Bar: 25 μm.
Discussion
In this study, we showed both in vitro and in an in vivo model that is anatomically similar to the human perifovea that impaired PINK1 mediated mitophagy triggered mitochondrial dysfunction and instead of inducing cell death, paradoxically activated NFE2L2 dependent RMNS reprogramming to EMT, a protective response. Our study sheds light on how the integrity and interplay between these two cytoprotective pathways, initiated by PINK1 mediated mitophagy and dependent upon NFE2L2 signaling, influenced degenerative RPE heterogeneity. Given that we showed decreased PINK1 and increased SNAI1 immunolabeling in abnormal perifoveal RPE of early AMD eyes and we previously showed decreased NFE2L2 in dysmorphic perifoveal RPE of early AMD [Citation34], our experimental findings could explain how perifoveal RPE develop EMT in early AMD [Citation16,Citation42–50]. These pathways may also be pivotal determinants of heterogeneity in other diseases defined by mitochondrial dysfunction and oxidative damage. Importantly, we used a novel RPE and mitochondrial specific antioxidant dendrimer to neutralize mitochondrial ROS and inhibit RMNS, which mitigated EMT, a subclone of RPE heterogeneity, to offer therapeutic potential in treating early AMD, a stage without treatment.
RMNS was initiated by elevated mitochondrial O2− and H2O2. We used approaches to measure ROS that are recommended by the Free Radical Society to minimize artifact [Citation51]. While physiological mitochondrial ROS provide homeostatic signaling, elevated ROS can induce a compensatory, survival response [Citation52]. Mitochondrial health through mitophagy integrity determines whether ROS levels are homeostatic or elevated to initiate a survival response. Since most mitochondrial genes are nuclear encoded, it is logical that mitochondrial ROS initiate RMNS [Citation52]. In C. elegans, increased ROS activates protein SKN-1 (SKiNhead), an NFE2L2 analog, during RMNS to coordinate mitochondrial biogenesis and mitophagy gene expression that regenerates mitochondria [Citation53]. The conserved NFE2L2-RMNS from worms to humans underscores its importance for cell survival. In contrast to C. elegans, RMNS in mammalian cells did not reactivate PINK1, which is possible since NFE2L2 can regulate PINK1 [Citation54]. Instead, NFE2L2 activated TXNRD1 and PI3K-AKT to induce a comprehensive repair network. Unfortunately, by compromising RPE function, this adaptive response unintentionally contributed to a disease phenotype. In AMD, EMT has emerged as an RPE subtype with mesenchymal alterations, multilayering, proliferation, migration [Citation22,Citation55], increased VIM and SNAI1, and decreased CDH1 [Citation56]. In AMD, the resistance to death by EMT could cause prolonged RPE dysfunction that furthers disease progression.
When mitophagy and NFE2L2 fail, the RPE is vulnerable to death. While one impaired cytoprotective pathway induces a survival response, failure of an additional pathway renders the cell incapable of self-repair. In early AMD, the perifoveal RPE can have decreased PINK1, NFE2L2 [Citation34], and/or undergo cell death [Citation8,Citation57]. We propose a heterogeneity model that is based on PINK1 mediated mitophagy and NFE2L2 through RMNS (Fig S7). When both cytoprotective pathways are functional, the RPE is normal. When mitophagy is impaired, the RPE enters EMT to enhance survival. When NFE2L2 declines, the RPE degenerates [Citation34]. If both are impaired, the RPE dies.
Our model suggests that morphology unreliably represents the RPE phenotype since normal appearing RPE can have deficient mitophagy and NFE2L2 yet be dying. Preventing RPE death is a therapeutic target for AMD. Since RPE in EMT are resistant to death, we suggest that this subpopulation is a logical, alternative target, especially since mesenchymal-epithelial transition therapy has been investigated for cancer [Citation58]. We suggest that reversing EMT by inhibiting RMNS at or downstream of NFE2L2 will promote cell death and geographic atrophy, the advanced form of dry AMD. Instead, upstream mitochondrial repair or scavenging ROS are logical targets to restore the specialized RPE functions essential for vision. TPP-D-NAC provides proof-of-concept benefit. Given the high specificity of TPP-D-NAC for the RPE and the known safety profile of NAC [Citation59], the systemic side effects should theoretically be limited. TPP-D-NAC very effectively neutralized mitochondrial ROS with limited effect on cytoplasmic ROS. This high specificity would preserve physiologic cytoplasmic ROS signaling to maintain cellular homeostasis. Since NFE2L2 can be decreased in AMD, multi-drug therapy that includes NFE2L2 rejuvenation, such as the FDA approved dimethyl fumarate, should be considered [Citation60].
In conclusion, we described the novel finding that impaired PINK1-mediated mitophagy triggered an NFE2L2 dependent RMNS that induced EMT, and that the integrity of mitophagy and NFE2L2 signaling determines RPE heterogeneity. Studying the interaction between two cytoprotective pathways improved the modeling of a complex disease like AMD. By doing so, we identified therapeutic potential in TPP-D-NAC for early AMD. Future work should establish the relative contribution of impaired mitophagy and NFE2L2 signaling relative to other pathogenic processes in early and later AMD.
Materials and Methods
Human tissue
The tenets of the Declaration for Helsinki for research involving human tissue were followed. Human autopsy eyes (n = 10) were obtained from Ocular Pathology at the Wilmer Eye Institute. Donors were classified as “unaffected” (n = 4) if they had no AMD history or evidence of drusen. Early AMD donors (n = 6) had an AMD history and drusen (>63 and < 125 μm diameter) and no later disease such as geographic atrophy or choroidal neovascularization (Table S1). Eyes were fixed in 4% formaldehyde, paraffin embedded, and sectioned.
Mouse care
Experiments were in accordance with NIH guidelines and approved by the Johns Hopkins Animal Care and Use Committee. pink1tm1Shn (pink1−/−), nfe2l2tm1Ywk (nfe2l2−/−) in a C56BL/6 J background (Jackson Labs, Bar Harbor, ME) were without the Rd8 mutation. Wild-type littermates were used as controls. To generate pink1−/− and nfe2l2−/− double-knockout mice, pink1−/− and nfe2l2−/− mice were bred to generate F1 heterozygotes, which were inbred and genotype confirmed double-knockout animals were selected for further breeding. Mice without these mutations were used as littermate controls. An equal number of male and female mice were used for experiments. Mice were given water ad libitum and kept in a 12-h light–12-h dark cycle.
For some experiments, mice received an IVT injection in one eye and an equal volume (1 μl) of vehicle in the contralateral eye using a microinjection pump (Harvard Apparatus, Holliston, MA, USA). To induce mitophagy in vivo, animals were intravitreally injected with 10 µM CCCP or DMSO. Eyes were harvested 24 h later. To measure autophagic flux in vivo, mice were injected intraperitoneally (IP) with 40 mg/kg leupeptin (ThermoFisher, 78,435) or vehicle and sacrificed after 4 h. Protein was extracted from the RPE, as described [Citation61]. To pharmacologically induce NFE2L2 deficiency, pink1−/− mice were treated with 50 mg/kg Trig (Sigma-Aldrich, T5509) mixed in the drinking water [Citation62].
Mouse tissue preparation
Eyes were fixed in 2.5% glutaraldehyde and 1% paraformaldehyde in 0.08 M cacodylate buffer for transmission electron microscopy (TEM). The central 2 × 2 mm tissue around the optic nerve was prepared for osmium-tannic acid-paraphenylenediamine (OTAP) TEM to preserve neutral lipids [Citation63,Citation64]. Ultrathin sections were stained with uranyl acetate and lead citrate and examined with an electron microscope (JEM-100 CX; JEOL, Tokyo, Japan). Other eyes were fixed in 2% paraformaldehyde for immunohistochemistry or dissected and tissue was placed in RLT lysis buffer (Qiagen, 74,104) or RIPA buffer with protease and phosphatase inhibitors (Cell Signaling Technology, 5872) for extraction of RNA and protein, respectively, from the RPE with minimal choroidal contamination [Citation65].
Cell culture
Human ARPE-19 cells were maintained as described [Citation66]. Human induced pluripotent stem cells (Cb6.2 line) were differentiated into RPE monolayers, as described [Citation67]. Reagents used appear in Table S5. Cells were transfected with 15 nM PINK1, NFE2L2, TXNRD1, AKT, ZEB1, or scrambled control Silencer Select siRNA (ThermoFisher Scientific, TableS5) in Lipofectamine 2000 (ThermoFisher Scientific, 11,668,019) for 24 h after which medium was switched to regular RPE medium (Corning, 10–092-CV). For shRNA experiments, cells were treated with PINK1 or scrambled lentiviral particles per the manufacturer’s protocol (Origene, TL320728V). For experiments, cells were treated with the specific reagents listed in Table S5 for 4 or 24 h. Dendrimer-tagged NAC with or without tri-phenyl-phosphonium (TPP) was synthesized as described [Citation59]. For gene overexpression studies [Citation68], 0.5–1.0 μg of plasmid DNA was used for transfection, and cells were collected 48 h after transfection. pCLBW COX8A EGFP mCherry plasmid (COX8A-EGFP-mCherry) was purchased (Addgene, 78,520; deposited by the laboratory of Dr. David Chan) and the sequence corresponding to COX8A-EGFP-mCherry was subcloned into an adenovirus vector at Vector Biolabs as a paid service. The cells were infected at 50 multiplicity of infection for 24 h before conducting experiments as we previously described [Citation69]. The red and green fluorescence within single cells were measured using ImageJ (Rasband, W.S., ImageJ, U. S. National Institutes of Health, Bethesda, Maryland, USA, https://imagej.nih.gov/ij/ 1997–2018). The red:green fluroscence ratio was calculated as a measure of mitophagy.
Immunohistochemistry
For human eyes fixed in 4% formaldehyde, antigens were retrieved using the Target Retrieval System (Dako, S2367). Deparaffinized sections were blocked with horse serum (ThermoFisher, 26,050,070), incubated with primary antibody (), then biotinylated anti-rabbit IgG (Vectastain®ABC-AP Kit; Vector Labs, AK5001), and then with the ABC-AP. Slides were incubated with levamizole added to blue substrate working solution. Sections were imaged with a light microscope equipped with the Cri-Nuance system (Perkin Elmer Corp, Inc. Hopkinton, MA, USA) to remove melanin pigment.
Table 1. Antibodies used for immunohistochemistry studies.
Mouse flatmounts or human cells were blocked with TBS (Corning Inc., 46–012-CM), 1% BSA (Sigma-Aldrich, F4135), 5% goat serum (ThermoFisher, 50197Z) overnight at 4°C, then primary and secondary antibodies (). Human RPE cells were incubated with blocking serum – 1X TBS (Corning Inc., 46–012-CM) containing 0.1% Triton X-100 (Sigma-Aldrich, X100) and then the primary antibody and secondary antibodies (). Samples were examined with a confocal microscope (ZEN LSM 710, Carl Zeiss Microscopy, LLC, Thornwood, NY, USA).
Quantitative real-time RT-PCR
Reverse transcription was performed using random hexamers and MultiScribe reverse transcriptase (Applied Biosystems, 4,311,235). Quantitative real-time RT-PCR analyses were performed using Assay-on-Demand primer and probe sets (Applied Biosystems; Table S6) with a StepOnePlus TaqMan system (Applied Biosystems).
RNA sequencing
Total RNA was isolated from cells using the RNeasy Plus Mini Kit with on-column DNA digestion by RNase-free DNase (Qiagen, 74,134). RNA integrity was verified using Agilent Bioanalyzer 2100 (Agilent). Stranded RNA-seq library construction was carried out using 100 ng RNA with the TruSeq Stranded mRNA Sample Preparation Kit (Illumina, 20,020,594). Libraries were paired-end sequenced to 126 bases using a HiSeq 2500 Sequencing System (Illumina).
Analysis of RNA-Seq data
Using Illumina HiSeq, gene expression profiles were measured of 3 siRNA-scrambled, 3 NFE2L2-siRNA, 3 PINK1-siRNA, and 3 NFE2L2-PINK1-siRNA samples (Table S7). In total, 172,492,252 (51.3%) raw reads of RNA-Seq were uniquely mapped to the GRCh37/hg19 genome assembly using STAR [Citation70]. Differentially expressed genes between groups were identified through EdgeR [Citation71]. Gene function enrichment analysis was conducted using DAVID [Citation72]. The heatmap and clustering of gene expression were performed in R platform. To analyze the association of differentially expressed genes with EMT, we used a gene signature “HALLMARK EPITHELIAL MESENCHYMAL TRANSITION” from the GSEA database (https://www.gsea-msigdb.org/gsea/msigdb/cards/HALLMARK_EPITHELIAL_MESENCHYMAL_TRANSITION)
Western blot analysis
Western blot analysis was performed as described [Citation73]. Some experiments used Jurkat and activated Jurkat cell extracts supplied in SDS sample buffer (Cell Signaling Technology, 9273) as AKT control cell extracts. For mitochondrial extracts, cell pellets or tissue pieces were lysed or homogenized in the cold mitochondrial buffer, provided by the Mitochondrial and Cytoplasmic Extraction Reagents kit (Biovision, K256), with FAST Protease Inhibitor (Sigma, S8820) added. Cytoplasmic and mitochondrial protein fractions were prepared sequentially and quantified using the Bio-Rad DC Protein Assay Kit (5,000,112).
Nuclear extracts were prepared using the NE-PER Nuclear and Cytoplasmic Extraction Reagents (ThermoFisher, 78,833) according to the manufacturer’s instructions. In general, 10 μg protein was loaded per well onto 4–12% NuPage Bis-Tris gels (ThermoFisher, NP0336) and iBlot2 Transfer Stacks (ThermoFisher, IB23002) were used to transfer proteins onto nitrocellulose membranes. Membranes were incubated with the intended primary antibody and corresponding secondary antibodies (). Signal was detected with a chemiluminescence detection system (Thermo Scientific, Waltham, MA). Blots were imaged with an ImageQuant LAS4000 scanner (GE Healthcare, Inc., Piscataway, NJ, USA), and band intensity is reported as arbitrary densitometric units using ImageJ software. ACTB for whole cell or cytoplasmic protein, LMNA for nuclear protein fraction, and VDAC1 for mitochondrial protein assessment were used for signal normalization.
Table 2. Antibodies used for western blot experiments.
Cellular bioenergetics assay
Mitochondrial OCRs and ECARs from cell culture media was quantified with the Seahorse Bioscience XFe96 analyzer (Agilent Inc., Santa Clara, CA, USA) and the XF Cell Mito Stress Test. Lactate was measured with a kit (BioVision, K607). For Seahorse experiments, cellular respiration was analyzed by directly measuring the mitochondrial oxygen consumption rate (OCR) and extracellular acidification rate (ECAR) from the cell culture media using a Seahorse Bioscience XFe96 analyzer in combination with the Seahorse Bioscience XF Cell Mito Stress Test assay kit (103,015–100) as per the manufacturer’s protocol. Briefly, cells were plated at 50,000 cells/cm2 and cultured on Seahorse XFe96 plates for 6 days along with siRNA. On the day of analysis, cell medium was removed, cells were pretreated with 1 mmol/L glutamate for 1 h and then changed to base medium supplemented with 25 mmol/L glucose, 2 mmol/L sodium pyruvate, and 2 mmol/L glutamine (pH 7.4) followed by incubation at 37°C in a non-CO2 incubator for 1 h. The initial 35-min reading established the baseline. After injections of 1 μmol/L oligomycin (complex V inhibitor; Agilent, 103,015–100), 1 μmol/L FCCP (proton gradient uncoupler that collapses proton electrochemical gradients and allows the respiratory chain to operate maximally; Agilent, 103,015–100), and complex I inhibitors 0.5 μmol/L rotenone (Agilent, 103,015-100)-antimycin (Agilent, 103,015–100) spaced 35 min apart, 4 time points were recorded. The OCR and ECAR were calculated by the Seahorse XFe96 Wave software.
Oxygen consumption assay by Mito-ID in mouse tissue
Oxygen consumption was assessed in freshly dissected mouse eyes by Mito-ID (Enzo Life Sciences, ENZ-51045). Eye cups were placed in black clear bottom 96-well plates (Corning Inc., CLS3603) containing 150 µl RPE media containing 10% FBS. Ten µl Mito-ID Extracellular O2 Sensor probe (Enzo Life Sciences, ENZ-51045-K100) was added and Mito-ID HS Oil was used to seal each well. Samples were immediately analyzed at the beginning and after 30 min with a microplate plate reader (BMG Labtech, Inc., Cary, NC, USA). Samples were analyzed immediately and after 30 min with a microplate plate reader (BMG Labtech, Inc., Cary, NC, USA).
Mitochondrial assays
ATP was determined using the CellTiter-Glo (CTG) ATP assay (Promega, G7570). Mitochondrial superoxide and MMP was assessed with MitoSOX and tetramethylrhodamine, methyl ester, perchlorate (TMRM) assays, respectively (ThermoFisher Scientific, M36008 and T668). Mitochondrial and cytoplasmic H2O2 was measured using mito-roGFP2-Orp1(Addgene, 64,992; deposited by Dr. Tobias Dick) or cyto-roGFP2 fusion protein (Addgene, 64,991; deposited by Dr. Tobias Dick) as a redox sensitive biosensor after transfecting the plasmids with Lipofectamine 2000 (ThermoFisher, 11,668,019) [Citation74]. Untransfected cells were used as control. Mitochondrial complex (I–IV) activities were performed using commercially available kits (Biovision Inc., K968, K660, K520, K287).
Cell migration assay
Cells were wounded with a plastic tip and photographed (x100 magnification) 24 h later. The distance between the edges was measured and averaged.
Cell viability assay
Cell viability was evaluated with the LIVE/DEAD Assay (Invitrogen, L3224), as recommended by the manufacturer. Cells were exposed for 30 min to calcein‐AM, to measure cell viability, ethidium homodimer (EthD‐1), to measure cell death, and 4′,6‐diamidino‐2‐phenylindole (DAPI), to visualize DNA. Fluorescence was detected at excitation/emission of 495 nm/515 nm for calcein‐AM, and at excitation/emission of 495 nm/635 nm for EthD‐1. The number of live cells with calcein‐AM and DAPI labeling, but not EthD‐1 staining, was counted and expressed as a percentage of control.
Statistical Analysis
The difference between groups was compared by Student’s t-test using GraphPad Software (San Diego, CA) after verifying that the data were normally distributed using the Kolmogorov-Smirnov Test of Normality (https://www.socscistatistics.com/tests/kolmogorov/default.aspx). All data are expressed as the mean ± SEM or SD. Experiments were conducted in triplicate and performed at least 3 times.
Data deposition
The data from the RNA-seq experiments has been deposited in NCBI’s Gene Expression Omnibus (GEO), accession number is GSE186751. These data can be accessed at https://www.ncbi.nlm.nih.gov/geo/query/acc.cgi?acc=GSE186751.
Supplemental Material
Download Zip (25.1 MB)Acknowledgments
The authors wish to thank Hiromi Sesaki, PhD for his valuable expertise in mitochondrial biology, Cynthia Berlinicke, PhD for her help with the Cellomics based assays, Srinivas Sripathi, PhD for his help with the iPS-RPE cells, Sonny Dike for helping with the mouse experiments, Shang Peng, PhD and Sayan Ghosh, PhD for their help with the AAV-mCherry-eGFP-COX8 experiments, Micah Chrenek for help with immunocytochemistry imaging, and Rhonda Grebe for help with the TEM sample preparation and imaging.
Disclosure statement
JTH: Bayer Pharmaceuticals (received grant funding and royalties on unrelated project); Clover Pharmaceuticals (receives grant funding and for being on the Scientific Advisory Board on unrelated project), Seeing Medicines, Inc. (receives payment for being on Scientific Advisory Board on unrelated project)
KR: R.K. and his wife S. Kannan are co-founders and own shares of Ashvattha Therapeutics Inc. They have licensed more than 80 patents into Ashvattha and serve in the Board of Directors. As part of the licensing of inventions, they may receive royalties from sales of products. The conflict of interest is managed by Johns Hopkins University.
DS: receives grant funding from Astellas Pharma Inc., F. Hoffmann-La Roche Ltd., Generian Pharmaceuticals Inc, and UPMC Enterprises.
Data availability statement
Data relating to the manuscript are included in the paper and supplementary materials will be made available upon request.
Supplementary material
Supplemental data for this article can be accessed online at https://doi.org/10.1080/15548627.2022.2109286
Additional information
Funding
Related Research Data
References
- Wong WL, Su X, Li X, et al. Global prevalence of age-related macular degeneration and disease burden projection for 2020 and 2040: a systematic review and meta-analysis. Lancet Glob Health. 2014;2(2):e106–16.
- Pennington KL, DeAngelis MM. Epidemiology of age-related macular degeneration (AMD): associations with cardiovascular disease phenotypes and lipid factors. Eye Vis (Lond). 2016;3(1):34.
- Handa JT, Bowes Rickman C, Dick AD, et al. A systems biology approach towards understanding and treating non-neovascular age-related macular degeneration. Nat Commun. 2019;10(1):3347.
- Handa JT. New molecular histopathologic insights into the pathogenesis of age-related macular degeneration. Int Ophthalmol Clin. 2007;47(1):15–50.
- Kevany BM, Palczewski K. Phagocytosis of retinal rod and cone photoreceptors. Physiology (Bethesda). 2010;25(1):8–15.
- Ershov AV, Bazan NG. Photoreceptor phagocytosis selectively activates PPARgamma expression in retinal pigment epithelial cells. J Neurosci Res. 2000;60(3):328–337.
- Kaarniranta K, Sinha D, Blasiak J, et al. Autophagy and heterophagy dysregulation leads to retinal pigment epithelium dysfunction and development of age-related macular degeneration. Autophagy. 2013;9(7):973–984.
- Dunaief JL, Dentchev T, Ying GS, et al. The role of apoptosis in age-related macular degeneration. Arch Ophthalmol. 2002;120(11):1435–1442.
- Bhatia SK, Rashid A, Chrenek MA, et al. Analysis of RPE morphometry in human eyes. Mol Vis. 2016;22:898–916.
- Rashid A, Bhatia SK, Mazzitello KI, et al. RPE cell and sheet properties in normal and diseased eyes. Adv Exp Med Biol. 2016;854:757–763.
- Watzke RC, Soldevilla JD, Trune DR. Morphometric analysis of human retinal pigment epithelium: correlation with age and location. Curr Eye Res. 1993;12(2):133–142.
- Green WR, Enger C. Age-related macular degeneration histopathologic studies. The 1992 Lorenz E. Zimmerman Lecture. Ophthalmology. 1993;100(10):1519–1535.
- Sarks SH. Ageing and degeneration in the macular region: a clinico-pathological study. Br J Ophthalmol. 1976;60(5):324–341.
- Gambril JA, Sloan KR, Swain TA, et al. Quantifying retinal pigment epithelium dysmorphia and loss of histologic autofluorescence in age-Related macular degeneration. Invest Ophthalmol Vis Sci. 2019;60(7):2481–2493.
- Rubin H. Ordered heterogeneity and its decline in cancer and aging. Adv Cancer Res. 2007;98:117–147.
- Meacham CE, Morrison SJ. Tumour heterogeneity and cancer cell plasticity. Nature. 2013;501(7467):328–337.
- Curcio CA, Millican CL, Allen KA, et al. Aging of the human photoreceptor mosaic: evidence for selective vulnerability of rods in central retina. Invest Ophthalmol Vis Sci. 1993;34(12):3278–3296.
- Curcio CA, Medeiros NE, Millican CL. Photoreceptor loss in age-related macular degeneration. Invest Ophthalmol Vis Sci. 1996;37(7):1236–1249.
- Whitmore SS, Braun TA, Skeie JM, et al. Altered gene expression in dry age-related macular degeneration suggests early loss of choroidal endothelial cells. Mol Vis. 2013;19:2274–2297.
- Guidry C, Medeiros NE, Curcio CA. Phenotypic variation of retinal pigment epithelium in age-related macular degeneration. Invest Ophthalmol Vis Sci. 2002;43(1):267–273.
- Sarks JP, Sarks SH, Killingsworth MC. Evolution of geographic atrophy of the retinal pigment epithelium. Eye. 1988;2(Pt 5):552–577.
- Zanzottera EC, Messinger JD, Ach T, et al. Subducted and melanotic cells in advanced age-related macular degeneration are derived from retinal pigment epithelium. Invest Ophthalmol Vis Sci. 2015;56(5):3269–3278.
- Starnes AC, Huisingh C, McGwin G Jr., et al. Multi-nucleate retinal pigment epithelium cells of the human macula exhibit a characteristic and highly specific distribution. Vis Neurosci. 2016;33:e001.
- Chen M, Rajapakse D, Fraczek M, et al. Retinal pigment epithelial cell multinucleation in the aging eye - a mechanism to repair damage and maintain homoeostasis. Aging Cell. 2016;15(3):436–445.
- Mitter SK, Song C, Qi X, et al. Dysregulated autophagy in the RPE is associated with increased susceptibility to oxidative stress and AMD. Autophagy. 2014;10(11):1989–2005.
- Sinha D, Valapala M, Shang P, et al. Lysosomes: regulators of autophagy in the retinal pigmented epithelium. Exp Eye Res. 2016;144:46–53.
- Nordgaard CL, Berg KM, Kapphahn RJ, et al. Proteomics of the retinal pigment epithelium reveals altered protein expression at progressive stages of age-related macular degeneration. Invest Ophthalmol Vis Sci. 2006;47(3):815–822.
- Nordgaard CL, Karunadharma PP, Feng X, et al. Mitochondrial proteomics of the retinal pigment epithelium at progressive stages of age-related macular degeneration. Invest Ophthalmol Vis Sci. 2008;49(7):2848–2855.
- Terluk MR, Kapphahn RJ, Soukup LM, et al. Investigating mitochondria as a target for treating age-related macular degeneration. J Neurosci. 2015;35(18):7304–7311.
- Harman D. Aging: a theory based on free radical and radiation chemistry. J Gerontol. 1956;11(3):298–300.
- Harman D. The biologic clock: the mitochondria? J Am Geriatr Soc. 1972;20(4):145–147.
- Chance B, Sies H, Boveris A. Hydroperoxide metabolism in mammalian organs. Physiol Rev. 1979;59(3):527–605.
- Grivennikova VG, Kareyeva AV, Vinogradov AD. What are the sources of hydrogen peroxide production by heart mitochondria? Biochim Biophys Acta. 2010;1797(6–7):939–944.
- Wang L, Kondo N, Cano M, et al. signaling modulates cigarette smoke-induced complement activation in retinal pigmented epithelial cells. Free Radic Biol Med. 2014;70:155–166.
- Cano M, Datta S, Wang L, et al. Nrf2 deficiency decreases NADPH from impaired IDH shuttle and pentose phosphate pathway in retinal pigmented epithelial cells to magnify oxidative stress-induced mitochondrial dysfunction. Aging Cell. 2021;20(8):e13444.
- Volland S, Esteve-Rudd J, Hoo J, et al. A comparison of some organizational characteristics of the mouse central retina and the human macula. PLoS One. 2015;10(4):e0125631.
- Lee JY, Nagano Y, Taylor JP, et al. Disease-causing mutations in parkin impair mitochondrial ubiquitination, aggregation, and HDAC6-dependent mitophagy. J Cell Biol. 2010;189(4):671–679.
- Rojansky R, Cha MY, Chan DC. Elimination of paternal mitochondria in mouse embryos occurs through autophagic degradation dependent on PARKIN and MUL1. Elife. 2016;5. DOI:10.7554/eLife.17896
- Biswas S, Dodwadkar NS, Piroyan A, et al. Surface conjugation of triphenylphosphonium to target poly(amidoamine) dendrimers to mitochondria. Biomaterials. 2012;33(18):4773–4782.
- Bielski ER, Zhong Q, Brown M, et al. Effect of the conjugation density of triphenylphosphonium cation on the mitochondrial targeting of poly(amidoamine) dendrimers. Mol Pharm. 2015;12(8):3043–3053.
- Arlt A, Sebens S, Krebs S, et al. Inhibition of the Nrf2 transcription factor by the alkaloid trigonelline renders pancreatic cancer cells more susceptible to apoptosis through decreased proteasomal gene expression and proteasome activity. Oncogene. 2013;32(40):4825–4835.
- Potente M, Makinen T. Vascular heterogeneity and specialization in development and disease. Nat Rev Mol Cell Biol. 2017;18(8):477–494.
- Buenrostro JD, Wu B, Litzenburger UM, et al. Single-cell chromatin accessibility reveals principles of regulatory variation. Nature. 2015;523(7561):486–490.
- Dong N, Shi L, Wang DC, et al. Role of epigenetics in lung cancer heterogeneity and clinical implication. Semin Cell Dev Biol. 2017;64:18–25.
- Litzenburger UM, Buenrostro JD, Wu B, et al. Single-cell epigenomic variability reveals functional cancer heterogeneity. Genome Biol. 2017;18(1):15.
- Mazor T, Pankov A, Song JS, et al. Intratumoral heterogeneity of the epigenome. Cancer Cell. 2016;29(4):440–451.
- Cheow LF, Courtois ET, Tan Y, et al. Single-cell multimodal profiling reveals cellular epigenetic heterogeneity. Nat Methods. 2016;13(10):833–836.
- Torres CM, Biran A, Burney MJ, et al. The linker histone H1.0 generates epigenetic and functional intratumor heterogeneity. Science. 2016;353(6307). DOI:10.1126/science.aaf1644
- Luo Y, He J, Xu X, et al. Integrative single-cell omics analyses reveal epigenetic heterogeneity in mouse embryonic stem cells. PLoS Comput Biol. 2018;14(3):e1006034.
- Keren-Shaul H, Spinrad A, Weiner A, et al. A Unique microglia type associated with restricting development of alzheimer’s disease. Cell. 2017;169(7):1276–90 e17.
- Kowaltowski AJ. Strategies to detect mitochondrial oxidants. Redox Biol. 2019;21:101065.
- Khacho M, Clark A, Svoboda DS, et al. Mitochondrial dynamics impacts stem cell identity and fate decisions by regulating a nuclear transcriptional program. Cell Stem Cell. 2016;19(2):232–247.
- Palikaras K, Lionaki E, Tavernarakis N. Coordination of mitophagy and mitochondrial biogenesis during ageing in C. elegans. Nature. 2015;521(7553):525–528.
- Xiao L, Xu X, Zhang F, et al. The mitochondria-targeted antioxidant MitoQ ameliorated tubular injury mediated by mitophagy in diabetic kidney disease via Nrf2/PINK1. Redox Biol. 2017;11:297–311.
- Zanzottera EC, Ach T, Huisingh C, et al. Visualizing retinal pigment epithelium phenotypes in the transition to geographic atrophy in age-related macular degeneration. Retina. 2016;36(Suppl 1):S12–S25.
- Ghosh S, Shang P, Terasaki H, et al. A Role for betaA3/A1-Crystallin in type 2 EMT of RPE cells occurring in dry age-related macular degeneration. Invest Ophthalmol Vis Sci. 2018;59(4):AMD104–AMD13.
- Del Priore LV, Kuo YH, Tezel TH. Age-related changes in human RPE cell density and apoptosis proportion in situ. Invest Ophthalmol Vis Sci. 2002;43(10):3312–3318.
- Matossian MD, Elliott S, Hoang VT, et al. Novel application of the published kinase inhibitor set to identify therapeutic targets and pathways in triple negative breast cancer subtypes. PLoS One. 2017;12(8):e0177802.
- Sharma A, Liaw K, Sharma R, et al. Targeting mitochondrial dysfunction and oxidative stress in activated microglia using dendrimer-based therapeutics. Theranostics. 2018;8(20):5529–5547.
- Fox RJ, Miller DH, Phillips JT, et al. Placebo-controlled phase 3 study of oral BG-12 or glatiramer in multiple sclerosis. N Engl J Med. 2012;367(12):1087–1097.
- Nakahira K, Haspel JA, Rathinam VA, et al. Autophagy proteins regulate innate immune responses by inhibiting the release of mitochondrial DNA mediated by the NALP3 inflammasome. Nat Immunol. 2011;12(3):222–230.
- Folwarczna J, Janas A, Pytlik M, et al. Effects of trigonelline, an alkaloid present in coffee, on diabetes-induced disorders in the rat skeletal system. Nutrients. 2016;8(3):133.
- Curcio CA, Presley JB, Millican CL, et al. Basal deposits and drusen in eyes with age-related maculopathy: evidence for solid lipid particles. Exp Eye Res. 2005;80(6):761–775.
- Guyton JR, Klemp KF. Ultrastructural discrimination of lipid droplets and vesicles in atherosclerosis: value of osmium-thiocarbohydrazide-osmium and tannic acid-paraphenylenediamine techniques. J Histochem Cytochem. 1988;36(10):1319–1328.
- Wei H, Xun Z, Granado H, et al. An easy, rapid method to isolate RPE cell protein from the mouse eye. Exp Eye Res. 2015;145:450–455.
- Dunn KC, Aotaki-Keen AE, Putkey FR, et al. ARPE-19, a human retinal pigment epithelial cell line with differentiated properties. Exp Eye Res. 1996;62(2):155–169.
- Maruotti J, Wahlin K, Gorrell D, et al. A simple and scalable process for the differentiation of retinal pigment epithelium from human pluripotent stem cells. Stem Cells Transl Med. 2013;2(5):341–354.
- Cano M, Thimmalappula R, Fujihara M, et al. Cigarette smoking, oxidative stress, the anti-oxidant response through Nrf2 signaling, and age-related macular degeneration. Vision Res. 2010;50:652–664.
- Yazdankhah M, Ghosh S, Shang P, et al. BNIP3L-mediated mitophagy is required for mitochondrial remodeling during the differentiation of optic nerve oligodendrocytes. Autophagy. 2021;17(10):3140–3159.
- Dobin A, Davis CA, Schlesinger F, et al. STAR: ultrafast universal RNA-seq aligner. Bioinformatics. 2013;29(1):15–21.
- Robinson MD, McCarthy DJ, Smyth GK. edgeR: a bioconductor package for differential expression analysis of digital gene expression data. Bioinformatics. 2010;26(1):139–140.
- Huang da W, Sherman BT, Lempicki RA. Systematic and integrative analysis of large gene lists using DAVID bioinformatics resources. Nat Protoc. 2009;4(1):44–57.
- Cano M, Wang L, Wan J, et al. Oxidative stress induces mitochondrial dysfunction and a protective unfolded protein response in RPE cells. Free Radic Biol Med. 2014;69C:1–14.
- Roma LP, Deponte M, Riemer J, et al. Mechanisms and applications of redox-Sensitive green fluorescent protein-Based hydrogen peroxide probes. Antioxid Redox Signal. 2018;29(6):552–568.