
ABSTRACT
Drug resistance has greatly limited the clinical efficacy of lenvatinib in hepatocellular carcinoma (HCC). However, the underlying molecular mechanisms of lenvatinib resistance remain largely undetermined. Further in-depth exploration of mechanisms underlying lenvatinib resistance is still required for the majority of HCC patients. In this study, an integrated unbiased whole-genome CRISPR-Cas9 screen with database analysis indicated LAPTM5 (lysosomal protein transmembrane 5) as the critical contributor to lenvatinib resistance in HCC. We revealed that LAPTM5 could promote intrinsic macroautophagic/autophagic flux by facilitating autolysosome formation to drive lenvatinib resistance. The upregulation of LAPTM5 in HCC was induced by both DNA hypomethylation and driver mutations like TP53. Inhibition of autolysosome formation by either hydroxychloroquine (HCQ) or LAPTM5 abrogation worked synergistically with lenvatinib to inhibit tumor growth. In HCC cell lines, patient-derived primary cell lines and organoids, as well as human HCC xenografts and immunocompetent mouse HCC model, the close association between LAPTM5 and sensitivity to lenvatinib was consistently verified. Importantly, in clinical HCC samples, where lenvatinib was used as the first line or adjuvant therapy, LAPTM5 expression negatively correlated with lenvatinib sensitivity, implying it as a biomarker to predict patient response to lenvatinib. In conclusion, the combinational therapy targeting autophagy represented a promising strategy to overcome lenvatinib resistance in HCC, and LAPTM5 expression could provide potential guidance for clinical interference.
Abbreviations
cld-CASP3: cleaved caspase 3; cld-PARP: cleaved PARP; DTP: drug tolerant persister; GO: Gene Ontology; GTEx: The Genotype-Tissue Expression; HCC: hepatocellular carcinoma; HCQ: hydroxychloroquine; IC50: half maximal inhibitory concentration value; KEGG: Kyoto Encyclopedia of Genes and Genomes; LAPTM5: lysosomal protein transmembrane 5; NT: non-targeting; PDC: patient-derived primary cell lines; PDO: patient-derived primary organoid; TCGA: The Cancer Genome Atlas.
Introduction
Hepatocellular carcinoma (HCC), accounting for nearly 80% of all primary liver malignancies, ranks the fourth leading cause of cancer-associated death worldwide [Citation1,Citation2]. Surgical resection and transplantation remain the only curative treatments for HCC patients. However, the majority of HCC patients are usually diagnosed at advanced stages and not eligible for curative surgery [Citation3,Citation4]. Despite encouraging achievements in advanced HCC management such as the development of sorafenib, lenvatinib and regorafenib during the last decade, these multi-kinase inhibitors only prolonged lifespan of HCC patients by 2 to 3 months [Citation5–8]. The overall survival of advanced HCC patients remains extremely poor with the median survival less than one year [Citation9].
Lenvatinib, an oral multi-kinase inhibitor that targets FLT1/VEGFR1, KDR/VEGFR2, and FLT4/VEGFR3, FGFR1 to FGFR4, PDGFRA/PDGFRα, RET, and KIT, has been verified to achieve comparable survival benefit with sorafenib and recommended as the first-line therapy for advanced HCC patients since 2018 [Citation7,Citation10,Citation11]. However, drug resistance remarkably reduced its clinical efficacy. Therefore, exploring mechanisms underlying lenvatinib resistance and searching potential targets for rational combinational therapy is urgent to overcome lenvatinib resistance and improve HCC patient prognosis. Recently, ADAMTSL5 (a secreted glycoprotein) knockdown was found to sensitize HCC to lenvatinib treatment among those with a hypermethylated ADAMTSL5 [Citation12]. Co-treatment of EGFR (epidermal growth factor receptor) inhibitor gefitinib has also been proved to effectively improve the anti-cancer effect of lenvatinib only in patients with high EGFR expression [Citation13]. However, these studies can only define lenvatinib resistance in a minority of HCC patients, and the generalized mechanisms underlying lenvatinib resistance are complicated and remain largely undetermined. Further in-depth exploration of mechanisms underlying lenvatinib resistance is still required for the majority of HCC patients.
CRISPR-Cas9 system has provided us a novel tool to efficiently achieve complete protein depletion [Citation14,Citation15]. Moreover, genome-wide screening using CRISPR-Cas9 system has allowed us to systematically perform large-scale screen with high efficiency in an unbiased way [Citation16]. Compared to RNAi-based screen which reduced target mRNA expression instead of completely eliminating it, CRISPR-Cas9 library screen exhibited lower noise, minimal off-target effects and higher data reproducibility [Citation17,Citation18]. Herein, we performed unbiased whole-genome CRISPR-Cas9 knockout screen in HCC cell line to explore potential targets driving lenvatinib resistance. Combined with database exploration, we identified LAPTM5 (lysosomal protein transmembrane 5) as the crucial gene conferring HCC lenvatinib resistance, which was verified by in vitro and in vivo experiments as well as clinical data. Mechanistically, LAPTM5 contributed to intrinsic autophagic flux by promoting the formation of autolysosomes to reduce HCC sensitivity to lenvatinib. Thereby, combination therapy of LAPTM5 inhibition or hydroxychloroquine (HCQ), an inhibitor of autophagy by preventing autophagosome-lysosome fusion, with lenvatinib may serve as a promising strategy to overcome lenvatinib resistance in HCC.
Results
Integrated whole-genome CRISPR-Cas9 screen with database analysis to reveal critical contributors to lenvatinib resistance
Huh7, a commonly utilized HCC cell line, was well known to be sensitive to lenvatinib (IC50 = 2.85 µM) (). However, we found that even with high dose of lenvatinib (20 µM and above), a proportion of cancer cells could still survive (). Colony formation assay further confirmed the existence of a small fraction of viable cells, referred to as “drug tolerant persister” (DTP) cells () [Citation19,Citation20]. This phenomenon imitated clinical observations that HCC patients exhibited incomplete response and/or innate resistance toward lenvatinib treatment. Thereafter, we applied whole-genome CRISPR-Cas9 knockout library screen on Huh7 to explore potential contributors to lenvatinib resistance. Human GeCKOv2 CRISPR library that contains 122,411 unique sgRNAs targeting 19,052 protein-coding genes and 1,864 microRNAs, was utilized to generate a mutant cell pool (). To allow the survival and proliferation of DTP cells and development of drug resistance in the long-term, we intentionally applied relatively high dose of lenvatinib (20 µM) to treat mutant cell poor for consistent 21 days. Cells were then harvested and subjected to next-generation sequencing (NGS) to analyze the differential sgRNA representation between the two groups. Negative () and positive (Figure S1A) screen analysis was both performed based on MAGeCK algorithm [Citation21]. In the presence of lenvatinib, tumor cells carrying sgRNAs targeting genes conferring lenvatinib resistance will be eliminated in the mutant cell pool and their corresponding sgRNAs will also be depleted, which could be determined by high-throughput sequencing. Therefore, negative selection was applied to identify potential driver genes leading to lenvatinib resistance ().
Figure 1. Integrated whole-genome CRISPR-Cas9 screen with database analysis to identify genes driving lenvatinib resistance. (A) In vitro drug sensitivity assessment of Huh7 treated with serial dilutions of lenvatinib for 48 h. (B) Crystal violet staining colony formation assay of Huh7 treated with DMSO or 20 µM lenvatinib for indicated days. (C) Schematic outline of the whole-genome CRISPR-Cas9 screen workflow in Huh7. (D) Scatterplot depicting results for lenvatinib negatively selected hits in the CRISPR-Cas9 screen. The top 20 hits were shown in red. (E) GO analysis of the top 250 lenvatinib negatively selected hits in the CRISPR-Cas9 screen. (F) KEGG analysis the top 250 lenvatinib negatively selected hits in the CRISPR-Cas9 screen. (G) IC50 against lenvatinib of indicated HCC cell lines. (H) Volcanic map exhibiting the DEGs between lenvatinib-resistant and -sensitive HCC cell lines. (I) Venn diagram depicting the intersection between whole-genome CRISPR-Cas9 screen and CCLE database analysis. (J) the connection between LAPTM5, TNXB mRNA levels and IC50 against lenvatinib in HCC cell lines.
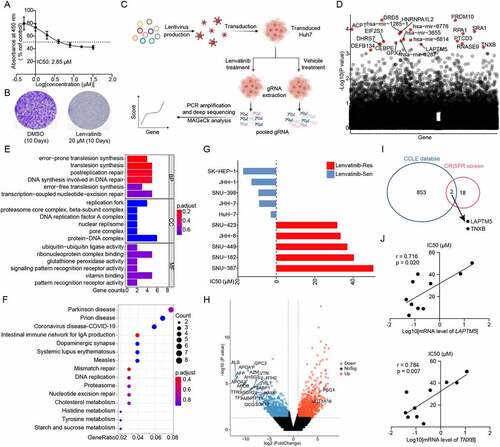
To systematically understand the molecular events associated with HCC lenvatinib resistance, Gene Ontology (GO) and Kyoto Encyclopedia of Genes and Genomes (KEGG) analysis were first performed on the top 250 genes mostly related to lenvatinib resistance. GO analysis showed that multiple biological processes participated in lenvatinib resistance including DNA repair, tumor immunity, and tumor metabolism (). In parallel, KEGG analysis also demonstrated that complex signaling pathways contributed to lenvatinib resistance such as DNA repair, intestinal immune network for IgA production and cellular metabolism (). These results were consistent to previous observations that lenvatinib response was intimately linked to tumor immunity [Citation22], confirming the good performance of our CRISPR screen. Meanwhile, CCLE database (Cancer Cell Line Encyclopedia, https://sites.broadinstitute.org/ccle) was analyzed to investigate mechanisms underlying lenvatinib resistance [Citation23]. HCC cell lines were divided into lenvatinib-resistant group (n = 5) and -sensitive group (n = 5) according to their IC50 against lenvatinib (). A total of 1,624 differentially expressed genes (DEGs) were detected based on the criteria of |log2(fold-change)| > 1 and P < 0.05 (). Subsequently, by an integrated analysis of our whole-genome CRISPR-Cas9 screen and database results, two potential hits, i.e., LAPTM5 and TNXB (tenascin XB) were identified (). Both the expression of LAPTM5 and TNXB significantly and positively correlated with IC50 toward lenvatinib at transcriptiomic level (LAPTM5: r = 0.716, P = 0.020; TNXB: r = 0.784, P = 0.007) (). Taken together, integrated whole-genome screen with database analysis identified LAPTM5 and TNXB as potential contributors to lenvatinib resistance in HCC.
LAPTM5 loss is synthetic lethal with lenvatinib in HCC
To validate the effects of TNXB and LAPTM5 on HCC resistance to lenvatinib, we first compared their expression levels between HCC tissues and normal liver tissues (NLTs) by analyzing TCGA and GTEx databases. LAPTM5 was significantly upregulated in HCC tissues compared to NLTs (Figure S1B) while TNXB was comparatively reduced (Figure S1C), implying that TNXB might not be an ideal target as therapy targeting TNXB potentially induced adverse effects. Furthermore, we knockdown TNXB in lenvatinib-resistant HCC cell lines (SNU-449 and HCC-LM3) and verified by qRT-PCR analysis (Figure S1D and E). Minimal influence on HCC sensitivity to lenvatinib was observed by TNXB silencing in either SNU-449 or HCC-LM3 (Figure S1F and G). Thereby, TNXB was eliminated in our further analysis.
Next, we examined the LAPTM5 expression level in 11 HCC cell lines as referred to normal liver epithelial cell-line L-02. HCC cell lines generally expressed higher levels of LAPTM5 compared to L-02, among which HCC-LM3 and SNU-449 exhibited the highest levels of LAPTM5 (). In parallel, we explored the mechanisms underlying LAPTM5 upregulation in HCC and discovered that LAPTM5 DNA methylation level was markedly reduced in HCC tissues compared to NLTs by analyzing TCGA HCC cohort (Figure S2A). Meanwhile, tumor with lower LAPTM5 DNA methylation level also exhibited higher LAPTM5 level (Figure S2B). Furthermore, inhibiting DNA methylation by 5-Azacytidine obviously upregulated LAPTM5 expression in Huh7 in a time-dependent manner (Figure S2C), confirming that LAPTM5 expression was regulated by DNA methylation. We also noticed that tumor with TP53 mutation expressed higher level of LAPTM5, indicating that LAPTM5 expression was also likely influenced by TP53 mutation (Figure S2D). Thereby, we transfected plasmid containing mutated TP53 (R249S) into HepG2 that harboring wild-type TP53 only, finding that LAPTM5 expression was significantly increased upon TP53 mutation (Figure S2E). Moreover, we analyzed TP53 associated public chip-sequence database (http://cistrome.org/) and found that TP53 could specifically bind to the promoter region of LAPTM5 (Figure S2F).
Figure 2. LAPTM5 contributes to in vitro lenvatinib resistance in HCC. (A) LAPTM5 levels in HCC cell lines and L-02 were evaluated by western blot. (B) The connection between LAPTM5 protein levels and IC50 against lenvatinib in HCC cell lines. (C) Western blot analysis of LAPTM5, LC3B and SQSTM1 levels in HCC-LM3 transfected with siRNA targeting LAPTM5 or si-NT (Left). Histogram exhibited IC50 against lenvatinib of HCC-LM3 transfected with siRNA targeting LAPTM5 or si-NT (Right). NT, non-targeting. (D) Essential-apoptosis proteins levels were evaluated by western blot in HCC-LM3 transfected with siRNA targeting LAPTM5 or si-NT in the presence of lenvatinib. cld-PARP, cleaved PARP; cld-CASP3, cleaved caspase 3. (E) Western blot analysis of LAPTM5, LC3B and SQSTM1 levels in SNU-449 transfected with siRNA targeting LAPTM5 or si-NT (Left). Histogram exhibited IC50 of SNU-449 transfected with siRNA targeting LAPTM5 or si-NT (Right). (F) Essential-apoptosis proteins levels were evaluated by western blot in SNU-449 transfected with siRNA targeting LAPTM5 or si-NT in the presence of lenvatinib. (G) LAPTM5 knockdown HCC-LM3 stable cell line was generated and validated by western blot (Upper); Histogram exhibited the effect of LAPTM5 knockdown on IC50 against lenvatinib in HCC-LM3 (Lower). (H) Essential-apoptosis proteins, LC3B and SQSTM1 levels were evaluated by western blot in indicated cells in the presence of lenvatinib or not. (I) Knockdown of LAPTM5 induced apoptosis significantly upon lenvatinib treatment in HCC-LM3 evaluated by flow cytometry analysis. (J) LAPTM5 overexpression Huh7 stable cell line was generated and validated by western blot (Upper); Histogram exhibited the effect of LAPTM5 upregulation on IC50 against lenvatinib in Huh7 (Lower). (K) Essential-apoptosis proteins, LC3B and SQSTM1 levels were evaluated by western blot in indicated cells in the presence of lenvatinib or not. (L) Overexpression of LAPTM5 reduced apoptosis significantly upon lenvatinib treatment in Huh7 evaluated by flow cytometry analysis. Data were presented as the means ± S.D. of values obtained in 3 independent experiments. *, P < 0.05; **, P < 0.01; ns, not significant.
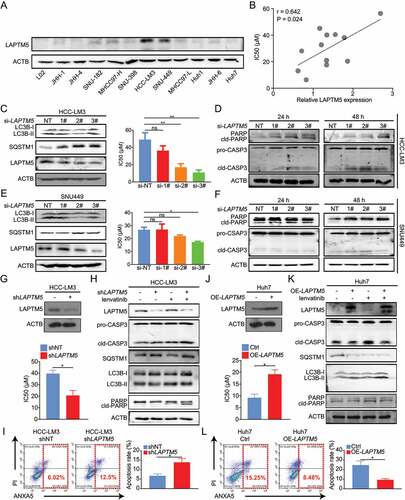
Simultaneously, we observed that a strong positive correlation existed between higher endogenous LAPTM5 protein levels and higher IC50 against lenvatinib in 11 HCC cell lines (r = 0.642, P = 0.024) (), implying that LAPTM5 could contribute to lenvatinib resistance in HCC. Then, LAPTM5 knockdown by siRNAs was performed in lenvatinib-resistant cell-line HCC-LM3 and verified by western blot (). As expected, LAPTM5 silencing significantly sensitized HCC-LM3 to lenvatinib as it remarkably reduced its IC50 against lenvatinib () and induced apoptosis in the presence of lenvatinib (). Similar phenomenon was also observed in SNU-449 ( E and F). Meanwhile, we noticed that siRNAs that showed minimal LAPTM5 knockdown efficiency also exhibited a limited influence on HCC sensitivity to lenvatinib ( C–F), minimizing the possibility of off-target effect. Also, LAPTM5 showed limited effect on HCC in vitro proliferation and apoptosis without the presence of lenvatinib (Figure S3A-C), indicating that the influence induced by LAPTM5 was lenvatinib dependent.
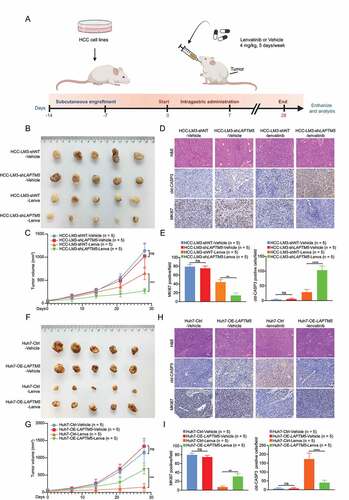
To further consolidate our observation that LAPTM5 was a key contributor to lenvatinib resistance, LAPTM5 knockdown HCC-LM3 stable cell line and its control (HCC-LM3-shLAPTM5 and HCC-LM3-shNT) were generated and validated via western blot (). Consistently, HCC-LM3-shLATPM5 showed drastically reduced IC50 against lenvatinib (0.44-fold, P = 0.035) and increased lenvatinib- induced apoptosis as compared to the control (2.03-fold, P = 0.011), symbolizing increased sensitivity to lenvatinib ( G–I). Conversely, LAPTM5 upregulation in Huh7 significantly reduced its sensitivity to lenvatinib (IC50: 2.41-fold, P = 0.034; Apoptosis: 0.36-fold, P = 0.013) ( J–L). Then, we inoculated HCC-LM3-shLAPTM5 and HCC-LM3-shNT to the flanks of nude mice, respectively. Mice were treated with either lenvatinib or vehicle control for 4 weeks (5 Days per week) since tumors became palpable (Day 14) (). While tumor raised from HCC-LM3-shNT grew steadily, lenvatinib remarkably retarded tumor growth of HCC-LM3-shLAPTM5 ( B and C). IHC analyses also revealed a decrease in the proliferation marker (MKI67/Ki-67) and an increase in the apoptotic marker (cleaved CASP3 [caspase 3]) in the LAPTM5 knockdown group ( D and E). Conversely, LAPTM5 upregulation in Huh7 exhibited opposite trend ( F–I). Taken together, integrated in vitro with in vivo experiments confirmed the critical role of LAPTM5 in driving lenvatinib resistance in HCC.
Figure 3. LAPTM5 contributed to in vivo lenvatinib resistance in HCC. (A) Workflow of in vivo drug sensitivity assay. (B and C) Knockdown of LAPTM5 inhibited HCC-LM3 growth in a lenvatinib dependent manner in nude mice. Lenva, lenvatinib. (D and E) Representative images of hematoxylin and eosin (H&E), MKI67/Ki67, cleaved CASP3 (cld-CASP3) in HCC-LM3 xenografts. Histogram compared the expression levels of MKI67 and cld-CASP3 between HCC-LM3-shNT and HCC-LM3-shLAPTM5. Scale bars: 50 µm. (F and G) Overexpression of LAPTM5 promoted Huh7 growth in a lenvatinib dependent manner in nude mice. (H and I) Representative images of H&E, MKI67, cld-CASP3 in Huh7 xenografts. Histogram compared the expression levels of MKI67 and cld-CASP3 between Huh7-Ctrl and Huh7-OE-LAPTM5. Scale bars: 50 µm. Data were presented as the means ± S.D. **, P < 0.01; ***, P < 0.001; ****, P < 0.0001; ns, not significant.
LAPTM5 regulates autophagic flux to reduce HCC sensitivity to lenvatinib
Autophagy, which has been proved to contribute to drug resistance in multiple types of cancer, is tightly connected with lysosome [Citation24–27]. Coincidentally, LAPTM5 is a multi-spanning trans-membrane protein that located in the late endosome/lysosome, raising the possibility that LAPTM5 might contribute to lenvatinib resistance by manipulating cellular autophagic flux. As expected, we discovered that LAPTM5 knockdown by siRNA significantly inhibited the autophagy flux, as indicated by the attenuated LC3-II:LC3-I ratio and increased SQSTM1/p62 protein level in HCC-LM3 and SNU-449 ( C and E). Meanwhile, no observable difference was found in LC3-II:LC3-I ratio and SQSTM1 level by siRNA that exhibited limited efficiency on LAPTM5 knockdown, ruling out the possibility of off-target effect ( C and E). Consistently, HCC-LM3-shLAPTM5 stable cell line exhibited a reduced autophagic flux as indicated by decreased LC3-II:LC3-I ratio and increased SQSTM1 level (). Transmission electron microscopy (TEM) analysis further indicated that LAPTM5 silencing significantly reduced cellular number of autolysosomes, indicative of reduced autophagic flux (0.30-fold, P = 0.002) (). On the contrary, LAPTM5 overexpression in Huh7 markedly promoted autophagic flux as evidenced by increased LC3-II:LC3-I ratio, reduced SQSTM1 level, and elevated intrinsic autolysosome number (3-fold, P = 0.043) ( C and D). In parallel, we designed four sgRNA targeting LAPTM5 to knockout LAPTM5 in Cas9-expressing HCC-LM3 and verified by western blot (Figure S2G). SgRNA with the best efficacy was selected for subsequent analysis. In addition, a rescue assay was performed by transfecting LAPTM5 knockout cell line with a plasmid harboring LAPTM5 (Figure S2H). Consistently, LAPTM5 knockout markedly reduced autophagic flux while LAPTM5 re-expression exhibited opposite effect (Figure S2G and H). Likewise, LAPTM5 knockout significantly sensitized the HCC toward lenvatinib treatment while re-expression of LAPTM5 reduced HCC sensitivity to lenvatinib (Figure S2I). These results collectively indicated that LAPTM5 could strengthen cellular autophagic flux by manipulating cellular formation of autolysosome.
Figure 4. LAPTM5 enhanced autophagic flux to lower HCC sensitivity to lenvatinib. (A) Western blot analyzed the effect of LAPTM5 knockdown on LC3B and SQSTM1 protein levels in HCC-LM3. (B) Autophagy was evaluated using TEM in HCC-LM3-shNT and HCC-LM3-shLAPTM5. (C) Western blot analyzed the effect of LAPTM5 overexpression on LC3B and SQSTM1 protein levels in Huh7. (D) Autophagy was evaluated using TEM in Huh7-Ctrl and Huh7-OE-LAPTM5. (E and F) Immunofluorescence analysis in indicated cells transfected with mRFP-GFP-tagged LC3B. Histogram compared the quantification of RFP+-GFP− (autolysosome) and RFP+-GFP+ (autophagosome) between HCC-LM3-shNT and HCC-LM3-shLAPTM5 (E), Huh7-Ctrl and Huh7-OE-LAPTM5 (F). White arrows indicate GFP−-RFP+ puncta. Scale bars: 10 µm. (G) Essential-apoptosis proteins were evaluated by western blot in HCC-LM3 and SNU-449 treated with HCQ or not in the presence of lenvatinib. (H) HCQ enhanced apoptosis significantly upon lenvatinib treatment in HCC-LM3 and SNU-449 evaluated by flow cytometry analysis. (I) The effect of HCQ and LAPTM5 on cellular IC50 against lenvatinib in indicated cell lines. (J) Lenvatinib upregulated LC3B-II:LC3B-I ratio, LAPTM5 level and downregulated SQSTM1 level in a time-dependent manner in HCC-LM3 and Huh7. Data were presented as the means ± S.D. of values obtained in 3 independent experiments. *, P < 0.05; **, P < 0.01; ns, not significant.
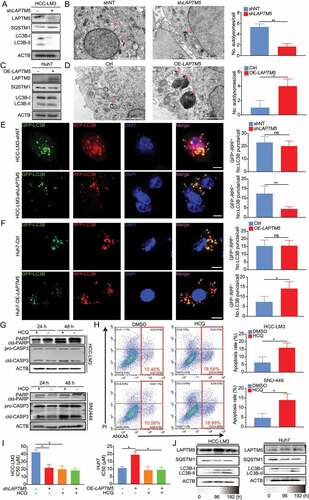
To further verify our observation, HCC cell lines were transfected with mRFP-GFP-LC3B lentivirus. LAPTM5 knockdown remarkably decreased RFP+-GFP− signal (autolysosomes) rather than RFP+-GFP+ signal (autophagosomes) in HCC-LM3, while LAPTM5 over-expression in Huh7 exhibited opposite trend, suggesting an increase in autolysosomes formation and autophagic flux (HCC-LM3: 0.29-fold, P = 0.006; Huh7: 1.8-fold, P = 0.024) ( E and F). Subsequently, we aimed to verify whether LAPTM5 could define HCC sensitivity to lenvatinib by mediating autolysosome formation. HCQ impaired lysosomal activities and disrupted the final stage of the autophagy pathway, specifically by impairing autophagosome-lysosome fusion [Citation28]. Accordingly, HCQ was applied to analyze the association among LAPTM5, autophagy, and lenvatinib resistance. We observed that HCQ significantly increased sensitivity to lenvatinib in HCC-LM3 and SNU-449, as evidenced by increased apoptosis upon lenvatinib treatment (HCC-LM3: 2.27-fold, P = 0.046; SNU-449: 2.52-fold, P = 0.026) ( G and H) and reduced IC50 against lenvatinib (). In parallel, HCQ did not work synergistically with LAPTM5 knockdown to sensitize HCC to lenvatinib, indicating that LAPTM5 knockdown mainly manipulated cellular autolysosome formation to influence HCC sensitivity to lenvatinib (). Furthermore, HCQ also worked synergistically with lenvatinib to inhibit in vivo tumor growth in HCC-LM3, as indicated by retarded tumor growth (0.47-fold, P = 0.004), reduced proliferation marker (MKI67/Ki-67) and increased apoptotic marker (cleaved CASP3 [caspase 3]) (Figure S4A-C).
Since lenvatinib was closely linked with anti-tumor immunity, we then determined whether HCQ could also work synergistically with lenvatinib to inhibit tumor progression in immunocompetent mouse C57BL/6. We discovered that HCQ considerably inhibited in vivo tumor growth of Hepa1–6 (0.38-fold, P = 0.007) (Figure S4D and E). IHC analysis also revealed decreased proliferation marker (MKI67) and increased apoptotic marker (cleaved CASP3) in the group treated with additional HCQ (Figure S4F). In parallel, we knocked down several essential autophagy genes including ATG5, ATG7 and RB1CC1/FIP200 in HCC-LM3 and certified by qRT-PCR (Figure S4 G). Similarly, suppression of those core autophagy genes could significantly sensitized HCC to lenvatinib (Figure S4 H), further highlighting the critical role of autophagy in lenvatinib response. In addition, we detected the dynamic change of cellular autophagic flux and LAPTM5 levels under successive stimulation of lenvatinib. We found that constant stimulation of lenvatinib could slightly but observably increase cellular autophagic flux and LAPTM5 level (, Figure S5A and B), implying that LAPTM5 and autophagy also contribute to the acquired resistance to lenvatinib.
Collectively, LAPTM5 contributed to lenvatinib resistance in HCC via manipulation of cellular autophagic flux.
PDC and PDO models certify the critical role of LAPTM5 in lenvatinib resistance
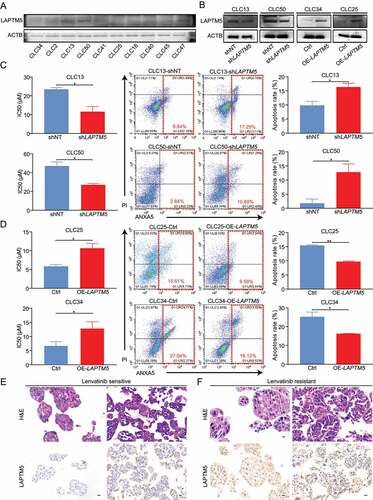
Considering that HCC was a heterogeneous tumor with different genetic background, we then investigated LAPTM5 effect on lenvatinib resistance by PDC and PDO models. We evaluated LAPTM5 expression in 10 PDCs with different genetic background such TP53 mutation and CTNNB1 mutation [Citation29] (). Among them, CLC16, CLC25, and CLC34 harbored TP53 mutation, CLC13, CLC40, and CLC41 harbored both TP53 and CTNNB1 mutations, and the rest exhibited no such mutation background. PDC with the highest LAPTM5 protein levels (CLC13 and CLC50) and those with the lowest LAPTM5 levels (CLC34 and CLC25) were selected to establish LAPTM5-knockdown and -overexpression stable cell lines, respectively, which was validated by western blot (). Identically, LAPTM5 silencing in CLC13 and CLC50 strikingly sensitized them to lenvatinib, as indicated by reduced IC50 and increased apoptosis in the presence of lenvatinib (CLC13: 0.59-fold, P = 0.028; CLC50: 0.61-fold, P = 0.042) (). Conversely, over-expression of LAPTM5 in CLC25 and CLC34 drastically reduced their sensitivity to Levatinib (CLC25: 1.76-fold, P = 0.011; CLC34: 1.90-fold, P = 0.026) (). Furthermore, we evaluated LAPTM5 levels in four PDOs with different degrees of sensitivity to lenvatinib. Among them, two lenvatinib-sensitive and one lenvatinib-resistant PDOs harbored TP53 mutation while the rest showed no such mutation. PDOs that were resistant to lenvatinib (IC50 > 20 µM) both exhibited significantly higher LAPTM5 levels compared to those with lower IC50 (IC50 < 20 µM) ( E and F). These above-mentioned results together consolidated our conclusion that LAPTM5 was a critical contributor to lenvatinib resistance in HCC irrespective of genetic background.
Figure 5. PDC and PDO models analyzed the association between LAPTM5 and HCC sensitivity to lenvatinib. (A) LAPTM5 protein levels in PDCs were evaluated by western blot. (B) LAPTM5 knockdown and upregulation stable cell lines were generated in indicated PDCs and validated by western blot. (C) LAPTM5 knockdown significantly sensitized CLC13 and CLC50 to lenvatnib as evidenced by reduced IC50 against lenvatinib (Left) and increased cell apoptosis upon lenvatinib treatment (Middle and Right). (D) LAPTM5 upregulation significantly lowered CLC25 and CLC34 sensitivity to lenvatinib as evidenced by increased IC50 against lenvatinib (Left) and reduced cell apoptosis upon lenvatinib treatment (Middle and Right). (E and F) Images of H&E and LAPTM5 of lenvatinib-sensitive and -resistant PDOs. Scale bar: 20 µm. Data were presented as the means ± S.D. of values obtained in 3 independent experiments. *, P < 0.05; **, P < 0.01.
LAPTM5 associates with clinical response to lenvatinib
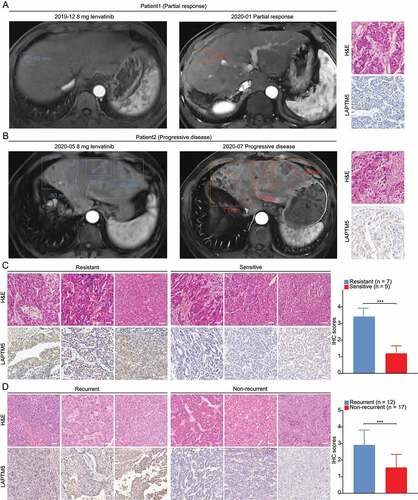
To further validate the clinical significance of LAPTM5, we then evaluated the association between LAPTM5 and lenvatinib resistance by analyzing clinical samples. A total of 12 HCC patients who accepted either lenvatinib alone or lenvatinib plus PDCD1/PD-1 treatments between March 1, 2019 and August 31, 2019 were recruited and their biopsy samples before the treatment were collected. Their clinical responses were defined according to mRECIST [Citation30]. Only patients who received a single lenvatinib treatment that defined as stable disease (SD), partial regression (PR) or complete regression (CR) were classified as lenvatinib-sensitive. Patients defined as progressive disease (PD) were divided into lenvatinib-resistant group irrespective of whether they adopted single lenvatinib or lenvatinib plus anti-PDCD1/PD-1 therapies. MRI and IHC analysis were performed to explore the link between LAPTM5 expression and clinical response to lenvatinib ( A and B). Generally, patients of lenvatinib-sensitive group tended to express drastically lower LAPTM5 as compared to those who were resistant to lenvatinib (1.98-fold, P < 0.001) (). Moreover, we included 29 patients who diagnosed with intermediate or advanced HCC and adopted consistent single lenvatinib therapy after surgery for 1 year in a phase II clinical trial [Citation31]. Patients were classified into two groups, i.e., recurrent group (n = 12) and non-recurrent group (n = 17), based on whether the recurrence happened or not within the period of follow-up. We found that patients with recurrence expressed significantly higher levels of LAPTM5 than those with no recurrence (1.87-fold, P < 0.001) (). This observation implied that LAPTM5 upregulation led to lenvatinib resistance as early recurrence after lenvatinib treatment might also be regarded as a symbol of drug resistance. Alternatively, LAPTM5 could be a reliable biomarker to predict patient response to lenvatinib so as to provide precise guidance for clinical interference.
Figure 6. The association between LAPTM5 and response to lenvatinib evaluated by clinical samples. (A) Representative images of MRI, H&E and LAPTM5 of patients with PR. Scale bars: 50 µm. (B) Representative images of MRI, H&E and LAPTM5 of patients with PD. Scale bars: 50 µm. (C) IHC analysis indicated patients sensitive to lenvatinib exhibited lower LAPTM5 levels compared to those resistant to lenvatinib. Scale bars: 50 µm. (D) IHC analysis indicated patients with tumor recurrence exhibited higher levels of LAPTM5 compared to those without recurrence. Scale bars: 50 µm. Data were presented as the means ± S.D. ***, P < 0.001.
Discussion
Despite the impressive clinical benefit from lenvatinib, therapeutic resistance inevitably develops following a period of either disease stabilization or regression, some patients even exhibited intrinsic resistance to lenvatinib, extremely limiting its clinical efficacy [Citation7]. Therefore, clarifying molecular events underlying lenvatinib resistance is urgent to develop new therapeutic strategies to maximize its clinical benefit. Herein, we integrated whole-genome CRISPR screen with database analysis to identify potential driver genes causing lenvatinib resistance, and identified LAPTM5 as a key contributor to lenvatinib resistance in HCC. LAPTM5 was significantly upregulated in HCC tissues compared to NLTs, and its expression was manipulated by both genetic and epigenetic factors such as DNA methylation and TP53 mutation. We demonstrated that LAPTM5 increased cellular autophagic flux to lower HCC sensitivity to lenvatinib, and blocking intrinsic autophagic flux by either LAPTM5 silencing or HCQ acted synergistically with lenvatinib to inhibit HCC growth. Also, we confirmed that LAPTM5 could be a reliable biomarker to predict patient response to lenvatinib and guide clinical interference.
To date, several studies have elucidated associated mechanisms contributing to lenvatinib resistance in HCC [Citation12,Citation13,Citation32]. Nonetheless, most of them mainly focus on subsets of genes, ignoring other potential molecular events contributing to lenvatinib resistance [Citation12,Citation32]. Jin et al. conducted a CRISPR-Cas9 library targeting the human kinome on intrinsic lenvatinib-resistant cell-line SNU-449 and found that the inhibition of EGFR worked synthetic lethal with lenvatinib in HCC [Citation13]. This study, however, mainly explored mechanisms associated with intrinsic lenvatinib resistance, neglecting the common clinical phenomenon of acquired resistance to lenvatinib. Lu et al. performed whole-genome CRISPR-Cas9 screen on Huh7, finding that loss of NF1 (neurofibromin 1) and DUSP9 (dual-specificity phosphatase 9) may participate in lenvatinib resistance [Citation33]. This study used 1000 nM lenvatinib to mimic resistance, while 1000 nM lenvatinib could not efficiently kill sensitive cells and potentially induce the loss of targets. Moreover, the positively selected hits in this study could be more likely connected to proliferation arrest instead of lenvatinib resistance. Thereafter, in our study, Huh7 with high sensitivity to lenvatinib was also applied. We consistently stimulated Huh7 with clinically relevant concentration of lenvatinib to mimic the clinical observation of incomplete response and/or innate resistance to lenvatinib. In parallel, we also analyzed the different expression profiles between intrinsic lenvatinib-resistant and –sensitive cell lines. These results together suggested that LAPTM5 potentially participated in both intrinsic and acquired resistance to lenvatinib. Therapy targeting LAPTM5 might work synergistically with lenvatinib on a larger scope of patients compared to EGFR inhibition which mainly benefited patients with high EGFR expression. In addition, by examining the association between LAPTM5 level and sensitivity to lenvatinib in multiple models including HCC cell lines, PDO and HCC patient samples, we also substantiated that LAPTM5 could be a reliable marker to predict the response to lenvatinib and provide dependable guidance for clinical interference.
LAPTM5 located on the membrane of lysosome, which raised the possibility that LAPTM5 might regulate autophagy to induce lenvatinib resistance. Chen et al. has previously reported the pro-tumor effect of LAPTM5 by regulating cell cycle arrest in bladder cancer [Citation34]. However, its effect on tumor drug resistance has not been reported yet. Autophagy, regarded as an adaption mechanism for tumor cells to survival under nutrients deprivation [Citation35], has been certified to play a vital role in inducing drug resistance in multiple types of cancer [Citation24–27]. In our study, we discovered that LAPTM5 could drastically promote autophagic flux by facilitating autophagosome-lysosome fusion to reduce HCC sensitivity to lenvatinib. Previously, HGF/c-MET axis activation has been reported to contribute to the lenvatinib resistance in HCC [Citation32]. Meanwhile, Hou et al. confirmed that HGF/c-MET axis significantly increased the cellular autophagy flux [Citation36]. These results further confirmed the reliability of our results. However, the exact mechanisms explaining how LAPTM5 contributes to the formation of autolysosome and how increased autophagic flux induces lenvatinib resistance needs further exploration.
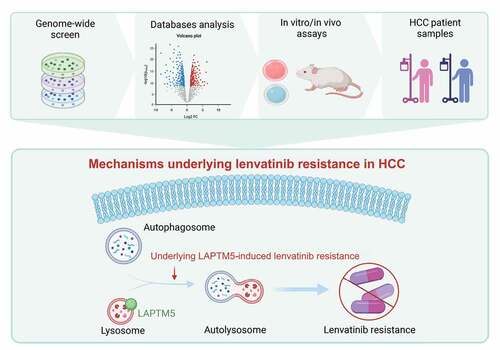
In summary, the new knowledge generated from this study contributes to a better understanding of lenvatinib resistance in HCC irrespective of genetic background (). Combination therapy of autophagy inhibition by either LAPTM5 knockdown or HCQ with lenvatinib is promising to overcome resistance and improve patient survival. Still more, LAPTM5 could also serve as a biomarker to predict patient response to lenvatinib, providing important information for personalized treatment.
Figure 7. The proposed model elaborating the mechanisms underlying LAPTM5 induced lenvatinib resistance in HCC. The proposed model elucidated that LAPTM5 enhanced autophagic flux to contribute to lenvatinib resistance.
Materials and methods
Cell lines and reagents
HCC cell lines HCC-LM3, MHCC97-H, and MHCC97-L were established in our institute [Citation37]. Hepa1–6 (CBP60574), Huh7 (CBP60202) and HepG2 (CBP60199) were purchased from COBIOER. Huh1, SK-HEP-1, SNU-182, SNU-387, SNU-423, SNU-398, JHH-1, JHH-4, JHH-6, JHH-7 and SNU-449 were granted by Daming Gao’s lab of Chinese Academy of Sciences. Normal liver epithelial cell-line L-02 (FH0109) was from Fuheng biology. HCC PDCs (CLC2 [BRICS0002]; CLC13 [BRICS0008]; CLC16 [BRICS0009]; CLC25 [BRICS00048]; CLC34 [BRICS00025]; CLC40 [BRICS00031]; CLC41 [BRICS00030]; CLC45 [BRICS00033]; CLC47 [BRICS00035]; CLC50 [BRICS00037]) were from Bio-Research Innovation Center Suzhou affiliated with Shanghai Institute of Biochemistry and Cell Biology and cultured according to the instructions [Citation29]. HCC PDOs were in-house established and cultured according to previous methods [Citation38]. All cell lines and PDO were and maintained at 37°C in a humidified atmosphere of 5% CO2.
Anti-LAPTM5 antibody (AP10077a) was from Abcepta. Anti-ACTB (AC026), anti-SQSTM1/p62 (A19700), anti-CASP3 (A19654), and anti-LC3B (A7198) antibodies were from Abclonal. HCQ (HY-17589A) was from MedChemExpress.
Whole-genome CRISPR-Cas9 knockout library screen
The Human GeCKO v2 CRISPR knockout pooled library that was provided by Feng Zhang’s lab [Citation39] was applied to screen genes driving lenvatinib resistance in HCC cells. Briefly, we transduced Huh7 with GeCKO v2 library which contains 122,411 unique sgRNA sequences targeting 19,052 human genes and 1,864 miRNAs (6 sgRNAs per gene, 4 sgRNAs per miRNA, and 1000 non-targeting controls) at a low MOI (0.3). Then, the transduced cells were cultured with medium containing 2 μg/ml of puromycin for 7 days to generate a mutant cell pool. Subsequently, the mutant cell pool was treated with either vehicle (DMSO) and lenvatinib (20 µM; MedChemExpress, HY -10,981) for 21 days, respectively. At least 3 × 10⁷ cells were collected for genomic DNA extraction to ensure over 400× coverage of GeCKO v2 library. The sgRNA sequences were amplified using NEBNext® High-Fidelity 2X PCR Master Mix (NEB, M0541) and subjected to massive parallel amplicon sequencing carried out by Novogene Technology (Beijing, China). The sgRNA read count and hits calling were analyzed by MAGeCK v0.5.7 algorithm [Citation21].
Patients and specimens
Patients accepted either lenvatinib or lenvatinib plus anti-PDCD1/PD-1 treatments after the diagnosis of HCC between March 1, 2019 and August 31, 2019 at Zhongshan Hospital of Fudan University were examined. Magnetic Resonance Imaging (MRI) was applied to monitor the tumor status 4 or 8 weeks after treatment. After elimination of patients who interrupted treatment or dropped out during the period of follow-up, a total of 12 patients were finally recruited and their biopsy samples before the treatment were collected for subsequent analysis.
Another independent cohort of patients (a phase II clinical trial in Zhongshan Hospital of Fudan University) who adopted single lenvatinib treatment after surgery during 2020 were analyzed (n = 29) [Citation31]. Their corresponding HCC samples were also obtained for subsequent analysis.
This study was approved by Zhongshan Hospital Research Ethics Committee (B2021-155R), and patients provided their informed consents.
Quantitative reverse transcription PCR (qRT-PCR)
Total RNA was extracted with TRIzol reagent (Invitrogen, 15596026) and cDNA synthesis was performed using a reverse transcription kit (Promega, A1702) according to the manufacturer’s instructions as previously described [Citation40]. Target mRNA levels were measured using the SYBR Green PCR Master Mix (Applied Biosystems, A25780) and the Applied Biosystems 7900HT sequence detection system (Applied Biosystems, MA, USA). The relative mRNA levels were calculated by 2−ΔΔCt method. Primer sequences were as follows:
ACTB:
Forward: AGAGCTACGAGCTGCCTGAC
Reverse: AGCACTGTGTTGGCGTACA
TNXB:
Forward: GCCCTGCTCACTTGGACTG
Reverse: GGAGCCGTGCATTGTAGGAG
RB1CC1/FIP200:
Forward: ATCGAAGAGTGTGTACCTACAGT
Reverse: GCAGGTGGACGATCACATAAGAT
ATG5:
Forward: AAAGATGTGCTTCGAGATGTGT
Reverse: CACTTTGTCAGTTACCAACGTCA
ATG7:
Forward: TGTGCCTCACCAGGTTCTTG
Reverse: TGGTCTCATCATCGCTCATGTC
Western blot analysis
Western blot was performed according to previously published methods [Citation41]. Briefly, cells were lysed in EBC buffer (50 mM Tris HCl, pH 8.0, 120 mM NaCl, 0.5% Nonidet P-40 [Solarbio, N8030]) with protease inhibitors (Roche, 04693116001) and phosphatase inhibitors (Millipore, 524265). 20 μg protein was loaded onto a 10% or 15% sodium dodecyl sulfate polyacrylamide gel, transferred onto 0.2 μm PVDF membranes (Millipore, ISEQ00010), blocked with 1 × TBST buffer (TBS/Tween Buffer) containing 5% bovine serum albumin (EpiZyme Biotech, PS113) and then incubated with the indicated primary antibodies. Results were obtained by Minichemi 610 chemiluminescent imager (Sagecreation, Beijing, China).
Immunohistochemistry (IHC)
HCC tissues blocks were cut into 4 µm in thickness and mounted onto 3-aminopropyltrioxysilane-coated slides, dewaxed and blocked in 3% hydrogen peroxide-methanol solution. Antigen retrieval was performed by 0.08% citrate buffer followed by anti-LAPTM5 antibody (Abcepta, AP10077a) incubation. Staining results were visualized by sequential incubation of tissues with the components of the Envision-plus detection system (EnVision+/HRP/Mo; Dako, K400611–2) and 3,3’-diaminobenidin (Sangon Biotech, A690009).
IHC staining was assessed by two independent pathologists with no prior knowledge of patient characteristics. Discrepancies were resolved by consensus. The staining extent score was on a scale of 1 to 4, corresponding to the percentage of immunoreactive tumor cells and the staining intensity. IHC score was computed as the sum of 4 x (%4+ cell) + 3 x (%3+ cell) + 2 x (% 2+ cell) + 1 x (% 1+ cell) [Citation42].
LAPTM5 Interference
The siRNAs were synthesized by Genomeditech (Shanghai, China). All siRNA transfection was performed with X-tremeGENE siRNA Transfection Reagent (Roche, 57276900) at 50 nM final concentration according to the manufacturer’s protocol. The siRNA transfected cells were harvested for western blot assay 48 h after transfection. The oligonucleotide sequences are as following:
siLAPTM5-1# Sense: CUGUGUCAUUGCUUGUGUAtt,
Antisense: UACACAAGCAAUGACACAGtt.
siLAPTM5-2# Sense: CCUCAUAACCAGUUCAUCAtt,
Antisense: UGAUGAACUGGUUAUGAGGtt.
siLAPTM5-3# Sense: CCACCUAUCUCAACUUCAAtt,
Antisense: UUGAAGUUGAGAUAGGUGGtt.
Construction of stable cell lines
PGMLV-hU6-MCS-CMV-Puro (Genomeditech, PGMLV-SB3) and PGMLV-CMV-MCS−3×Flag-PGK-Puro (Genomeditech, GM-18844) were chosen for lentivirus packaging for LAPTM5 knockdown referred to the sequence of siLAPTM5-3# and LAPTM5 overexpression, respectively. Subsequent generation of stable cell lines by infection was performed according to the protocol previously describe [Citation43].
Transmission electron microscopy (TEM)
TEM analysis was utilized to observe autophagic vesicles. Briefly, indicated cells were fixed in 0.1% glutaraldehyde. After dehydration, ultra-thin sections were prepared using a Sorvall MT5000 microtome. Subsequently, lead citrate and 3% uranyl acetate were applied to stain the samples. Images were acquired using a CM-120 electron microscope (PHILIPS, the Netherlands).
In vitro drug sensitivity assay and apoptosis assay
The cells in each condition were seeded at 4 × 10³ cells per well (As for PDC, 2 × 10⁴ cells per well) in a 96-well plate in six replicates. The culture medium containing different concentrations of lenvatinib or vehicle (DMSO) was added to each well. Forty-eight h post cultivation, culture medium was discarded, and 100 μl 10% CCK-8 (ZETA LIFE, K009) solution was added to each well and incubated for 2 h while blocking exposure to light. The absorbance was measured by scanning with a microplate reader (MRX; Dynex Technologies, West Sussex, United Kingdom) at 450 nm. Then, the half maximal inhibitory concentration value (IC50) for each cell line was calculated.
For the apoptosis assay, cells were seeded at 1 × 10⁶ cells/well into a six-well plate in triplicate. Subsequently, cells were subjected to either lenvatinib or vehicle for 48 h and then followed by flow cytometry analysis. The cell apoptosis assay was determined by FITC Annexin V Apoptosis Detection Kit (BD Biosciences, 556547) according to the instruction. Data were analyzed by FlowJo software.
Mouse xenografts
All mice were treated according to protocols approved by the Shanghai Medical Experimental Animal Care Commission and Shanghai Cancer Institute. HCC-LM3 and Huh7 cells (5 × 10⁶ cells per mouse) were injected subcutaneously into the right flanks of 5-week-old BALB/c nude mice (male, 5 mice per group). As for the immunocompetent mouse model, hepa1–6 (5 × 10⁶ cells per mouse) was injected subcutaneously into the right flanks of 5-week-old C56BL/6 mice (male, 6 mice per group).
Tumor volume based on caliper measurements was calculated using the modified ellipsoidal formula: tumor volume =½ × length × width2. After tumor establishment (Day 14), mice were randomly assigned to 5 days per week treatment with vehicle, lenvatinib (4 mg/kg, oral gavage) or lenvatinib plus HCQ (60 mg/kg, oral gavage) for four weeks. Then, all mice were sacrificed and the tumors were photographed and analyzed.
Generation of HCC-LM3 LAPTM5 knockout cell line
Cas9-expression HCC-LM3 was established by lenti-virus transfection and screened by blasticidin S (Yeasen, 60218ES10). Then, four sgRNA targeting LAPTM5 were designed to transfect Cas9-expressing HCC-LM3 and screened by puromycin. All screened cell lines were harvested for western blot assay.
Statistical analysis
All in vitro data are presented as the means ± S.D. of at least three technical replicates, as indicated in the figure legends. All in vivo data are presented as means ± S.D. Statistical tests including but not limited to Wilcoxon rank sum test, Student’s t-test, Chi-square test, Fisher’s exact test which were performed by GraphPad Prism (version 8.3.0). For continuous variables, Spearman correlation was performed. P < 0.05 (two-side) was considered to be statistically significant.
Supplemental Material
Download MS Word (5 MB)Acknowledgements
We thank Neville E Sanjana from NYU Grossman School of Medicine for providing us with GeCKOv2 CRISPR library.
Data availability statement
The datasets used and/or analyzed during the current study are available from the corresponding author on reasonable request.
Disclosure statement
No potential conflict of interest was reported by the author(s).
Supplementary material
Supplemental data for this article can be accessed online at https://doi.org/10.1080/15548627.2022.2117893.
Additional information
Funding
References
- Islami F, Miller KD, Siegel RL, et al. Disparities in liver cancer occurrence in the United States by race/ethnicity and state. CA Cancer J Clin. 2017;67:273–289.
- Villanueva A, Longo DL. Hepatocellular Carcinoma. N Engl J Med. 2019;380:1450–1462.
- Sherman M, Bruix J, Porayko M, et al. Screening for hepatocellular carcinoma: the rationale for the American Association for the Study of Liver Diseases recommendations. Hepatology. 2012;56:793–796.
- Llovet JM, Zucman-Rossi J, Pikarsky E, et al. Hepatocellular carcinoma. Nat Rev Dis Primers. 2016;2:16018.
- Bruix J, Qin S, Merle P, et al. Regorafenib for patients with hepatocellular carcinoma who progressed on sorafenib treatment (RESORCE): a randomised, double-blind, placebo-controlled, phase 3 trial. Lancet. 2017;389:56–66.
- Cheng AL, Kang YK, Chen Z, et al. Efficacy and safety of sorafenib in patients in the Asia-Pacific region with advanced hepatocellular carcinoma: a phase III randomised, double-blind, placebo-controlled trial. Lancet Oncol. 2009;10:25–34.
- Kudo M, Finn RS, Qin S, et al. Lenvatinib versus sorafenib in first-line treatment of patients with unresectable hepatocellular carcinoma: a randomised phase 3 non-inferiority trial. Lancet. 2018;391(10126):1163–1173. DOI:10.1016/S0140-6736(18)30207-1
- Llovet JM, Ricci S, Mazzaferro V, et al. Sorafenib in advanced hepatocellular carcinoma. N Engl J Med. 2008;359:378–390.
- Cabibbo G, Enea M, Attanasio M, et al. A meta-analysis of survival rates of untreated patients in randomized clinical trials of hepatocellular carcinoma. Hepatology. 2010;51:1274–1283.
- Matsui J, Yamamoto Y, Funahashi Y, et al. E7080, a novel inhibitor that targets multiple kinases, has potent antitumor activities against stem cell factor producing human small cell lung cancer H146, based on angiogenesis inhibition. Int J Cancer. 2008;122:664–671.
- Matsui J, Funahashi Y, Uenaka T, et al. Multi-Kinase inhibitor E7080 suppresses lymph node and lung metastases of human mammary breast tumor MDA-MB-231 via inhibition of vascular endothelial growth factor-receptor (VEGF-R) 2 and VEGF-R3 kinase. Clin Cancer Res. 2008;14:5459–5465.
- Arechederra M, Bazai SK, Abdouni A, et al. ADAMTSL5 is an epigenetically activated gene underlying tumorigenesis and drug resistance in hepatocellular carcinoma. J Hepatol. 2021;74:893–906.
- Jin H, Shi Y, Lv Y, et al. EGFR activation limits the response of liver cancer to lenvatinib. Nature. 2021;595:730–734.
- Shalem O, Sanjana NE, Zhang F. High-Throughput functional genomics using CRISPR-Cas9. Nat Rev Genet. 2015;16:299–311.
- Cong L, Ran FA, Cox D, et al. Multiplex genome engineering using CRISPR/Cas systems. Science. 2013;339(6121):819–823. DOI:10.1126/science.1231143
- Shalem O, Sanjana NE, Hartenian E, et al. Genome-Scale CRISPR-Cas9 knockout screening in human cells. Science. 2014;343(6166):84–87. DOI:10.1126/science.1247005
- Evers B, Jastrzebski K, Heijmans JP, et al. CRISPR knockout screening outperforms shRNA and CRISPRi in identifying essential genes. Nat Biotechnol. 2016;34:631–633.
- Housden BE, Perrimon N. Comparing CRISPR and RNAi-based screening technologies. Nat Biotechnol. 2016;34:621–623.
- Sharma SV, Lee DY, Li B, et al. A chromatin-mediated reversible drug-tolerant state in cancer cell subpopulations. Cell. 2010;141:69–80.
- Ramirez M, Rajaram S, Steininger RJ, et al. Diverse drug-resistance mechanisms can emerge from drug-tolerant cancer persister cells. Nat Commun. 2016;7:10690.
- Li W, Xu H, Xiao T, et al. MAGeCK enables robust identification of essential genes from genome-scale CRISPR/Cas9 knockout screens. Genome Biol. 2014;15:554.
- Yi C, Chen L, Lin Z, et al. Lenvatinib targets FGF Receptor 4 to enhance antitumor immune response of anti-programmed cell death-1 in HCC. Hepatology. 2021;74:2544–2560.
- Barretina J, Caponigro G, Stransky N, et al. The cancer cell line encyclopedia enables predictive modelling of anticancer drug sensitivity. Nature. 2012;483:603–607.
- Lin YX, Wang Y, An HW, et al. Peptide-Based autophagic gene and cisplatin co-delivery systems enable improved chemotherapy resistance. Nano Lett. 2019;19:2968–2978.
- Xu WP, Liu JP, Feng JF, et al. miR-541 potentiates the response of human hepatocellular carcinoma to sorafenib treatment by inhibiting autophagy. Gut. 2020;69:1309–1321.
- Carew JS, Nawrocki ST, Kahue CN, et al. Targeting autophagy augments the anticancer activity of the histone deacetylase inhibitor SAHA to overcome Bcr-Abl-mediated drug resistance. Blood. 2007;110:313–322.
- Hu F, Song D, Yan Y, et al. IL-6 regulates autophagy and chemotherapy resistance by promoting BECN1 phosphorylation. Nat Commun. 2021;12:3651.
- Stalnecker CA, Grover KR, Edwards AC, et al. Concurrent inhibition of IGF1R and ERK increases pancreatic cancer sensitivity to autophagy inhibitors. Cancer Res. 2021;82(4):586–598.
- Qiu Z, Li H, Zhang Z, et al. A pharmacogenomic landscape in human liver cancers. Cancer Cell. 2019;36:179–193.
- Llovet JM, Lencioni R. mRECIST for HCC: performance and novel refinements. J Hepatol. 2020;72:288–306.
- Zhou J, Sun H, Huang Z, et al. Adjuvant Lenvatinib after radical resection in patients with hepatocellular carcinoma (HCC): preliminary analysis of a prospective, multi-center, single-arm study. APPLE 2021;Abstract FV-26.
- Fu R, Jiang S, Li J, et al. Activation of the HGF/c-MET axis promotes lenvatinib resistance in hepatocellular carcinoma cells with high c-MET expression. Med Oncol. 2020;37:24.
- Lu Y, Shen H, Huang W, et al. Genome-Scale CRISPR-Cas9 knockout screening in hepatocellular carcinoma with lenvatinib resistance. Cell Death Discov. 2021;7:359.
- Chen L, Wang G, Luo Y, et al. Downregulation of LAPTM5 suppresses cell proliferation and viability inducing cell cycle arrest at G0/G1 phase of bladder cancer cells. Int J Oncol. 2017;50:263–271.
- Singh SS, Vats S, Chia AY, et al. Dual role of autophagy in hallmarks of cancer. Oncogene. 2018;37:1142–1158.
- Hou B, Li Y, Li X, et al. HGF protected against diabetic nephropathy via autophagy-lysosome pathway in podocyte by modulating PI3K/Akt-GSK3β-TFEB axis. Cell Signal. 2020;75:109744.
- Li Y, Tian B, Yang J, et al. Stepwise metastatic human hepatocellular carcinoma cell model system with multiple metastatic potentials established through consecutive in vivo selection and studies on metastatic characteristics. J Cancer Res Clin Oncol. 2004;130:460–468.
- Broutier L, Mastrogiovanni G, Verstegen MM, et al. Human primary liver cancer-derived organoid cultures for disease modeling and drug screening. Nat Med. 2017;23:1424–1435.
- Sanjana NE, Shalem O, Zhang F. Improved vectors and genome-wide libraries for CRISPR screening. Nat Methods. 2014;11:783–784.
- Pan J, Fan Z, Wang Z, et al. CD36 mediates palmitate acid-induced metastasis of gastric cancer via AKT/GSK-3beta/beta-catenin pathway. J Exp Clin Cancer Res. 2019;38:52.
- Xie X, Hu H, Tong X, et al. The mTOR-S6K pathway links growth signalling to DNA damage response by targeting RNF168. Nat Cell Biol. 2018;20:320–331.
- Lu M, Zhu WW, Wang X, et al. ACOT12-Dependent alteration of acetyl-CoA drives hepatocellular carcinoma metastasis by epigenetic induction of epithelial-mesenchymal transition. Cell Metab. 2019;29:886–900e885.
- Boehm JS, Hession MT, Bulmer SE, et al. Transformation of human and murine fibroblasts without viral oncoproteins. Mol Cell Biol. 2005;25:6464–6474.