
ABSTRACT
Isoginkgetin (ISO), a natural biflavonoid, exhibited cytotoxic activity against several types of cancer cells. However, its effects on hepatocellular carcinoma (HCC) cells and mechanism remain unclear. Here, we revealed that ISO effectively inhibited HCC cell proliferation and migration in vitro. LC3-II expression and autophagosomes were increased under ISO treatment. In addition, ISO-induced cell death was attenuated by treatment with chloroquine or knockdown of autophagy-related genes (ATG5 or ULK1). ISO significantly suppressed SLC2A1/GLUT1 (solute carrier family 2 member 1) expression and glucose uptake, leading to activation of the AMPK-ULK1 axis in HepG2 cells. Overexpression of SLC2A1/GLUT1 abrogated ISO-induced autophagy. Combining molecular docking with thermal shift analysis, we confirmed that ISO directly bound to the N terminus of CDK6 (cyclin-dependent kinase 6) and promoted its degradation. Overexpression of CDK6 abrogated ISO-induced inhibition of SLC2A1/GLUT1 transcription and induction of autophagy. Furthermore, ISO treatment significantly decreased the H3K27ac, H4K8ac and H3K4me1 levels on the SLC2A1/GLUT1 enhancer in HepG2 cells. Finally, ISO suppressed the hepatocarcinogenesis in the HepG2 xenograft mice and the diethylnitrosamine+carbon tetrachloride (DEN+CCl4)-induced primary HCC mice and we confirmed SLC2A1/GLUT1 and CDK6 as promising oncogenes in HCC by analysis of TCGA data and human HCC tissues. Our results provide a new molecular mechanism by which ISO treatment or CDK6 deletion promotes autophagy; that is, ISO targeting the N terminus of CDK6 for degradation inhibits the expression of SLC2A1/GLUT1 by decreasing the enhancer activity of SLC2A1/GLUT1, resulting in decreased glucose levels and inducing the AMPK-ULK1 pathway.
Introduction
Liver cancer, a major malignancy of the digestive system, ranks as the third leading cause of cancer-related death worldwide [Citation1,Citation2]. Hepatocellular carcinoma (HCC) accounts for more than 90% of primary liver cancers [Citation3]. For patients in the early stages of HCC, surgical resection and liver transplantation are effective treatment options. However, most patients with HCC are diagnosed at an advanced stage, where sorafenib- or lenvatinib-based chemotherapy is the mainstay of treatment [Citation1]. The median survival times of patients treated with sorafenib or lenvatinib are only 12.3 months and 13.6 months, respectively, in phase III trials [Citation4]. Hence, novel effective drugs are needed to improve the survival of patients with HCC.
Macroautophagy/autophagy is an evolutionarily conserved catabolic process that degrades misfolded proteins and dysfunctional organelles through the lysosomal machinery [Citation5,Citation6]. Autophagy is believed to be a defense mechanism to maintain cell survival under stress conditions. However, excessive autophagy may lead to a type of cell death different from apoptosis and necrosis, referred to as “autophagic cell death” or “type II programmed cell death” [Citation7,Citation8]. Autophagy plays a dual role in HCC initiation and development. On the one hand, studies have shown that knockout of the autophagy-related gene Becn1 leads to embryonic death in mice, whereas mice with loss of heterozygosity of Becn1 (Becn1±) are more likely to spontaneously develop HCC, suggesting that autophagy may inhibit the initiation of HCC. On the other hand, studies have shown that the Map1lc3/Lc3 mRNA level in HCC tissues is significantly higher than that in adjacent tissues, and the expression of LC3 is significantly positively correlated with tumor size, suggesting that autophagy may promote the development of HCC [Citation9–11]. Autophagic dysregulation is involved in the initiation and development of HCC. Targeting autophagy can be an effective strategy for the treatment of HCC. Autophagy has become a hot spot in drug targeting research, but there are still many obstacles in drug development. Autophagy inhibitors can improve the sensitivity of tumors to radiotherapy or chemotherapy, but most inhibitors lack selectivity, which will increase the risk of carcinogenesis of normal tissues [Citation12]. Inducing autophagic cell death has become an attractive method for the treatment of tumors. Current autophagy inducers are roughly divided into three categories: BH-3 mimetics, AMPK pathway stimulators and PI3K-MTOR pathway inhibitors [Citation13]. BH-3 mimetics, including ABT-737, (-)-gossypol and obatoclax mesylate, inhibit the binding of the BECN1 BH3 peptide to BCL2L1/Bcl-XL (BCL2 like 1), thus inducing BECN1-dependent autophagy [Citation13]. However, BH3 mimetics also bind to MCL1 (MCL1 apoptosis regulator, BCL2 family member) with low affinity, which inhibits their anti-tumor effects in HCC due to the elevated expression of MCL1 [Citation14–16]. The approved drug metformin and the natural compound resveratrol are AMPK pathway stimulators. Metformin has been shown to directly activate AMPK by phosphorylation of PRKAA/AMPKα (protein kinase AMP-activated catalytic subunit alpha) [Citation17]. However, this drug lacks selectivity, which leads to multiple AMPK-unrelated effects, such as inhibition of the respiratory complex I [Citation12]. Resveratrol induces intracellular free calcium accumulation and activates the AMPK pathway, leading to autophagic cell death in A549 cells, but it potentially causes nephrotoxicity [Citation12,Citation18,Citation19]. PI3K-MTOR pathway inhibitors, including rapamycin, everolimus, curcumin and ursolic acid, have been broadly studied. Rapamycin and its analog everolimus directly inhibit the MTORC1 pathway by binding to the intracellular receptor FKBP1A/FKBP12 (FKBP prolyl isomerase 1A), thus inducing autophagic cell death in multiple cancers. However, these molecules were reported to block growth-driven transduction signals in the T cell response to alloantigens, leading to immunosuppressive effects [Citation12,Citation20–23]. The natural compounds curcumin and ursolic acid were reported to induce autophagic cell death by inhibiting the PI3K-MTOR pathway in multiple cancers. However, these molecules have low solubility, poor stability and a low absorption rate, resulting in their low bioavailability [Citation24–26]. Therefore, safe and effective autophagy inducers are urgently needed.
CDK6 (cyclin-dependent kinase 6), a serine/threonine kinase, has been reported to be closely related to autophagy. CDK4 and CDK6 show 71% amino acid homology. These molecules induce cells entering the S phase from the G1 phase by phosphorylating RB1/RB (RB transcriptional corepressor 1) to prevent its inhibitory interaction with the E2F1 (E2F transcription factor 1) [Citation27,Citation28]. Recent evidence has shown that chemical or genetic inactivation of CDK4 and CDK6 can induce autophagy in HeLa cells [Citation29]. Abemaciclib, an FDA-approved CDK4 and CDK6 inhibitor, showed dose-dependent cell killing activity accompanied by autophagic vacuolization in myeloma cell lines [Citation30]. CDK4 and CDK6 were originally identified as two kinases with similar functions and may play complementary roles. However, some studies found that CDK6, unlike CDK4, can also act as a transcriptional regulator and has the kinase-independent function of promoting tumor angiogenesis [Citation27]. The amplification of CDK6 was observed in various tumors, including HCC [Citation28]. Thus, CDK6 is a potential tumor therapeutic target for activation of autophagic cell death.
Natural products remain a major source of drugs despite the current advances in rational drug designs. As an important component of traditional Chinese medicine, Ginkgo biloba extract has been used clinically in the treatment of chest arthralgia, heartache, stroke and other diseases caused by blood stasis [Citation31]. Modern pharmacological studies have shown that G. biloba extract has anti-liver cancer functions and alleviates liver injury [Citation32,Citation33]. Flavonoids, the main constituent of G. biloba extract, were reported to have a wide spectrum of anticancer activities [Citation34]. Twenty-nine flavonoids were assayed for their anti-liver cancer activity (Fig. S1A), and we found that isoginkgetin (ISO, ), a major constituent of G. biloba, showed a significant anticancer effect on HepG2 and Huh7 liver cancer cells (Fig. S2A and S2B). Various studies have confirmed that ISO, a potential spliceosome inhibitor [Citation35,Citation36], exhibits anti-inflammatory and anticancer activities [Citation37,Citation38]. In fibrosarcoma, ISO inhibited MMP9 (matrix metallopeptidase 9) expression by impairing NFKB/NF-κB signaling, thus inhibiting the invasion of HT1080 cells [Citation39]. ISO also exhibited proapoptotic activities by promoting BAX (BCL2 associated X, apoptosis regulator) and cleaved CASP3 (caspase 3) expression in HeLa cells [Citation38]. Moreover, ISO promoted the unfolded protein response (UPR) and autophagy pathway by inhibiting the activity of the 20S proteasome, leading to HeLa cell death [Citation40]. However, the molecular mechanisms underlying ISO-induced autophagic cell death remain unclear, and the effects of ISO on HCC cells are rarely reported. The aim of the present study was to investigate the anticancer effect of ISO in HCC cells and to explore the underlying mechanism.
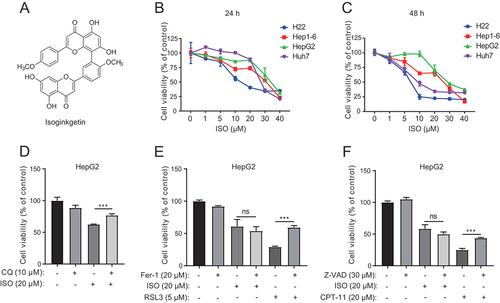
Figure 1. Isoginkgetin represses liver cancer cell growth. (A) Chemical structure of ISO. (B and C) Cells were exposed to ISO at the indicated doses for 24 h (B) and 48 h (C), and the dose-escalation effects of ISO were assessed by CCK-8 assays. (D) HepG2 cells were treated with ISO and CQ at the indicated doses for 48 h, and cell viability was measured with the CCK-8 assay. (E) HepG2 cells were treated with ISO, ferrostatin-1 (Fer-1) and RSL3 at the indicated doses for 48 h, and cell viability was measured with the CCK-8 assay. (F) HepG2 cells were treated with ISO, Z-VAD, and CPT-11 at the indicated doses for 48 h, and cell viability was measured with the CCK-8 assay. **p value ≤0.01, ***p value ≤0.001 (t-test). Histograms are presented as the mean ± s.D. Of three biological replicates.
Results
Chemical structure and purify of ISO
Nearly 2 g of ISO was purified from 3 kg of G. biloba L. extract. And the content of ISO in G. biloba L. extract is about 0.67 g/kg. ISO was analyzed on a high-performance liquid chromatography (HPLC) system. And the purity of ISO isolated was determined to be more than 98.12% (Fig. S1B).
ISO suppresses the viability and migration of HCC cells
To investigate the cytotoxic effect of ISO in HCC, we measured the changes in cell viability in four HCC cell lines, H22, Hep1–6, HepG2, and Huh7, by using a CCK-8 assay with the indicated concentrations for 24 h and 48 h. ISO significantly inhibited the growth of HCC cells (), among which the half maximal inhibitory concentrations (IC50) were 21.54 and 6.69 μM for HepG2 and Huh7 cells at 48 h, respectively. The number of colonies formed by HCC cells was significantly reduced by ISO treatment at the indicated concentrations (Fig. S3A). To determine whether ISO had any effect on cell migration, we conducted transwell (Fig. S3B) and wound healing assays (Fig. S3C and S3D). We found that ISO significantly inhibited the migration of HepG2 and Huh7 cells. These results indicate that ISO suppresses HCC cell viability and migration in vitro.
ISO induces autophagic cell death in HCC cells
To determine the type of ISO-induced cell death, we pretreated HepG2 cells treated with ISO with the pan-caspase inhibitor Z-VAD-FMK (Z-VAD), autophagy inhibitor chloroquine (CQ) and ferroptosis inhibitor ferrostatin-1 (Fer-1). Fer-1 and Z-VAD at the indicated concentrations rescued ferroptosis inducer RSL3- and apoptosis inducer irinotecan (CPT-11)-induced cell death, respectively, demonstrating that the indicated concentrations of Fer-1 and Z-VAD were effective. However, CQ () but not Fer-1 () or Z-VAD () sufficiently rescued cell viability compared to ISO treatment alone, suggesting that ISO may induce autophagic cell death in HCC. We then investigated whether ISO-induced autophagy in HepG2 cells. Western blotting was performed to examine the expression of the autophagy marker LC3. LC3-II expression in HepG2 cells showed a dose-dependent and time-dependent increase with ISO treatment compared with DMSO treatment ().
Figure 2. Isoginkgetin induces cytotoxic autophagy in liver cancer cells. (A and B) HepG2 cells were treated with ISO at the indicated doses for 24 h (A) or treated with ISO (20 μM) for the indicated time periods (B). ISO induces autophagosome formation in HepG2 cells in a dose-dependent and time-dependent manner, as revealed by western blotting. Quantifications are shown below. (C) HepG2 cells stably transfected with mRFP-GFP-LC3B plasmid were treated with PBS, 0.05% DMSO, 20 μM ISO and 10 μM CQ respectively for 24 h, fixed and subjected to confocal microscopy. Scale bar: 10 μm. 50 cells were imaged and the numbers of yellow LC3B and red LC3B dots per cell in each condition were quantified. (D) HepG2 cells were treated with ISO (20 μM) for 24 h, fixed and examined using transmission electron microscopy. Higher power magnification of the cell images revealed autophagosomes or autolysosome (arrows). Scale bar: 1 μm. (E) HepG2 cells were treated with 20 μM ISO together with 10 μM CQ for 24 h, and the protein levels of LC3 were assessed by western blotting. ImageJ densitometric analysis of the LC3-II:GAPDH ratio from LC3 immunoblots is shown below. (F and H) ULK1 and ATG5 were stably knocked down in HepG2 cells using CRISPR/Cas9. Wild-type (WT), ULK1 knockdown (ULK1 KD) and ATG5 knockdown (ATG5 KD) HepG2 cells were treated with 20 μM ISO for 24 h, and cell lysates were immunoblotted with the indicated antibodies. (G and I) WT, ULK1 KD and ATG5 KD cells were treated with 20 μM ISO for 48 h, and cell viability was assessed by CCK-8 assays. (J) WT, ULK1 KD and ATG5 KD cells were treated with 20 μM ISO for 24 h and then subjected to confocal microscopy using an LC3A/B antibody. Scale bar: 10 μm. *p value ≤0.05, **p value ≤0.01, ***p value ≤0.001 (t-test). Histograms are presented as the mean ± s.D. Of three biological replicates.
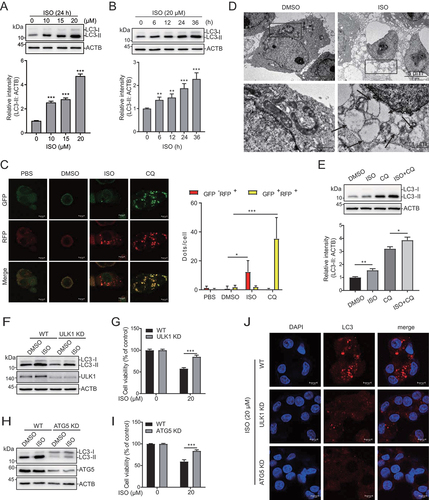
To further investigate whether ISO mediates autophagy, we stably transfected HepG2 cells with the tandem fluorescent-tagged LC3B (monomeric red fluorescent protein [mRFP]-GFP-LC3B) plasmid. GFP is sensitive to acid, while RFP is not. When lysosomes and autophagosomes fuse, GFP is quenched, but red fluorescence can be detected (GFP-negative and RFP-positive; red dots); when autophagosomes accumulate, GFP and RFP can be simultaneously detected (GFP positive and RFP positive; yellow dots) [Citation41]. As shown in , the number of yellow but not red dots increased in the CQ-treated cells, indicating that autophagic flux was blocked. The number of red dots increased in the ISO-treated cells, indicating that autophagic flux was increased (). Transmission electron microscopy was used to observe the accumulation of autophagic vacuoles in the ISO-treated cells, which revealed an increased number of autophagic vacuoles compared with those of the control cells (). Moreover, ISO treatment led to a further increase in LC3-II induced by CQ treatment (). During the initiation of autophagy, ULK1 (unc-51 like autophagy activating kinase 1) forms a complex with ATG5 (autophagy related 5) to participate in the assembly of autophagosomes. Knockdown of ULK1 or ATG5 by using CRISPR-Cas9 suppressed the ISO-mediated increase in LC3-II levels (), cell death () and LC3 puncta (). Taken together, our findings suggested that ISO regulated cell death via autophagic activation in HCC.
ISO treatment reduces the expression of glucose transporters
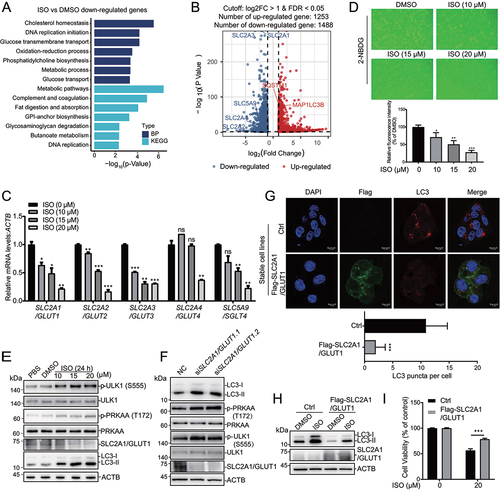
To explore the molecular mechanism of ISO-induced autophagy, we evaluated the potential effect of ISO on autophagy-related proteins. ISO seems to have no significant effect on those proteins (Fig. S4A). Next, we performed RNA-sequencing analysis to study the effect of ISO on global transcription. Out of the genes screened, 2741 genes were differentially expressed upon ISO treatment, with 1253 genes showing upregulated expression and 1488 genes showing downregulated expression compared with those after DMSO treatment (). The 1253 genes with upregulated expression after ISO treatment were enriched with genes involved in ERN1/IRE1 (endoplasmic reticulum to nucleus signaling 1)-mediated UPR after GO and KEGG analysis (Fig. S4B). Quantitative RT-PCR verified the effect of ISO on some genes involved in the UPR, including HSPA5/BIP (heat shock protein family A [Hspa70] member 5), EIF2AK3/PERK (eukaryotic translation initiation factor 2 alpha kinase 3), DDIT3/CHOP (DNA damage inducible transcript 3) and PPP1R15A/GADD34 (protein phosphatase 1 regulatory subunit 15A) (Fig. S4C). Moreover, ISO promoted the expression of the autophagy-related gene LC3B (Fig. S4D). These results indicate that ISO may induce autophagy in HCC by UPR activation, which was reported in HeLa cells [Citation40]. Among the 1488 genes with downregulated expression, genes related to glucose transmembrane transport and metabolic pathways were significant (). At first, we have examined the effect of different concentrations of DMSO on SLC2A1/GLUT1, SLC2A2/GLUT2, SLC2A3/GLUT3, SLC2A4/GLUT4 and SLC5A9/SGLT4 expression (Fig. S4E). Results showed that the expression of SLC2A1/GLUT1 was significantly inhibited when DMSO reached a concentration of 1% in HepG2 cells, and DMSO within 2% had no effect on the expression of SLC2A2/GLUT2, SLC2A3/GLUT3, SLC2A4/GLUT4 and SLC5A9/SGLT4. In our study, ISO was used with a final DMSO concentration of 0.05%. This DMSO concentration may have no effect on the expression of glucose transporters. We verified five genes related to glucose transmembrane transport (SLC2A1/GLUT1, SLC2A2/GLUT2, SLC2A3/GLUT3, SLC2A4/GLUT4 and SLC5A9/SGLT4) by quantitative real-time PCR ().
Figure 3. SLC2A1/GLUT1 plays an important role in isoginkgetin-mediated cytotoxic autophagy. (A) HepG2 cells were treated with 20 μM ISO for 24 h, and RNA-seq was performed. The top 7 enriched GO biological processes and KEGG pathway enrichment analysis of ISO-repressed DEGs. (B) Volcano plot displaying 1253 genes with upregulated and 1488 with downregulated expression after ISO treatment compared to DMSO treatment. (C) HepG2 cells were treated with ISO at the indicated doses for 24 h. The expression of SLC2A1/GLUT1, SLC2A2/GLUT2, SLC2A3/GLUT3, SLC2A4/GLUT4 and SLC5A9/SGLT4 was determined by qRT-PCR. (D) Fluorescent images show 2-NBDG uptake after treatment with 20 μM ISO for 24 h in HepG2 cells. More than 300 cells were analyzed and quantified for each treatment. Quantifications were shown below. (E) HepG2 cells were exposed to ISO at the indicated doses for 24 h, and cell lysates were immunoblotted with the indicated antibodies. (F) HepG2 cells were transfected with two different siRnas targeting SLC2A1/GLUT1 for 48 h, and cell lysates were immunoblotted with the indicated antibodies. (G) HepG2 cells stably transfected with Flag-SLC2A1/GLUT1 were treated with 20 μM ISO for 24 h and stained with the indicated antibodies. Scale bar: 10 μm. More than 50 cells were analyzed and quantified for each treatment. Quantifications were shown below. (H) HepG2 control (Ctrl) and stable Flag-SLC2A1/GLUT1-expressing (Flag-SLC2A1/GLUT1) cells were treated with 20 μM ISO for 24 h, and the expression of LC3 was determined by western blotting. (I) HepG2 control (Ctrl) and stable Flag-SLC2A1/GLUT1-expressing (Flag-SLC2A1/GLUT1) cells were treated with 20 μM ISO for 48 h, and cell viability was assessed by CCK-8 assays. *p value ≤0.05, **p value ≤0.01, ***p value ≤0.001 (t-test). Histograms are presented as the mean ± s.D. Of three biological replicates.
ISO induces glucose deprivation and AMPK-ULK1 axis activation in HCC cells
As these five genes (SLC2A1/GLUT1, SLC2A2/GLUT2, SLC2A3/GLUT3, SLC2A4/GLUT4 and SLC5A9/SGLT4) are responsible for the cellular uptake of glucose, we further studied the effect of ISO on glucose uptake by using 2-NBDG, a fluorescently labeled analog of glucose [Citation42], and found that the fluorescence signal of the DMSO-treated cells was much higher than that of the ISO treatment groups (). These results indicate that ISO can repress the cellular uptake of glucose. As the changes in the cellular distribution of these glucose transporters have an impact on 2-NBGD uptake [Citation43]. We have evaluated the effect of ISO on glucose transporters’ cellular distribution by immunofluorescence. The result showed that ISO may have no effect on their cellular distribution (Fig. S4F). As a master regulator of metabolism, AMPK is activated upon energy and glucose shortages. In addition, glucose deprivation activates AMPK by phosphorylation of PRKAA/AMPKα at T172 [Citation44], which further phosphorylates ULK1 at S555 [Citation45]. Phosphorylation of PRKAA/AMPKα and ULK1 in HepG2 cells showed a dose-dependent increase with ISO treatment, while total PRKAA/AMPKα levels remained unaffected (). These results indicate that ISO probably induces autophagy by promoting cell starvation and activating the AMPK-ULK1 axis.
GLUT1 plays an integral role in ISO-induced autophagy and tumor cell growth inhibition
SLC2A1/GLUT1 is the most highly conserved and widely distributed glucose transporter in mammalian cells. Its overexpression has been frequently observed in various human carcinomas [Citation46,Citation47]. Next, we investigated whether SLC2A1/GLUT1 is necessary for ISO-induced autophagy. SLC2A1/GLUT1 was knocked down with two different siRNAs, and western blotting showed that LC3-II, phospho-PRKAA/AMPKα and phospho-ULK1 levels were increased (). When SLC2A1/GLUT1 was overexpressed, we observed that LC3 puncta ( and S4 H) and LC3-II () levels induced by ISO were decreased. Moreover, SLC2A1/GLUT1 overexpression sufficiently rescued cell viability compared to ISO treatment alone ().
ISO may directly bind to CDK6 and promote its degradation
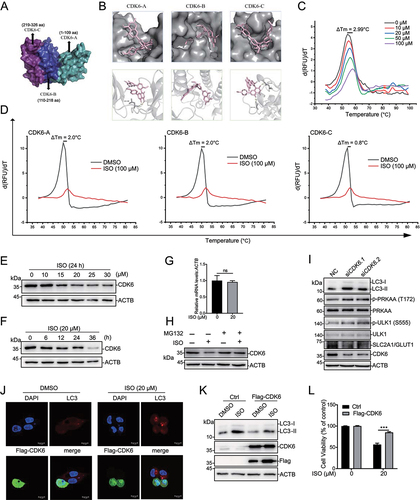
We found that ISO-induced autophagy by activating the AMPK-ULK1 pathway. However, the direct target of ISO is still unclear. To uncover the direct targets of ISO, we predicted candidate targets by utilizing the interactive web-portal SwissTargetPrediction (http://www.swisstarget prediction.ch). This analysis predicted many candidates (Table S2). We screened a pool of kinases and transcription factors and performed siRNA knockdown experiments to investigate their effects on SLC2A1/GLUT1 and LC3-II expression (Fig. S5A, S5B and S5C). Finally, we identified CDK6 as a candidate. To study the interaction of ISO and CDK6, we performed molecular docking with AutoDock Vina. The crystal structure of the CDK6 protein (PDB ID: 6OQO) was obtained from the PDB database. The three-dimensional structure of ISO (ZINC ID: 3,197,535) was obtained from the ZINC database. The CDK6 protein was divided into three truncations and docked with ISO based on AutoDock Vina ( S5D and S5E). The molecular docking model suggested that the binding free energies of ISO on CDK6 truncations were −8.4, −11 and −8.5 kcal/mol (Table S3). To further determine whether ISO can directly bind to the full-length protein and these three truncations of CDK6, we obtained synthetic peptides and performed thermal shift analysis. Thermal shift assays are used to study thermal stabilization of proteins upon ligand binding. This method is based on the biophysical principle of ligand-induced thermal stabilization of target proteins. The basic scheme of a thermal shift assay involves incubation of purified proteins with SYPRO Orange which undergoes a significant increase in quantum yield upon binding hydrophobic regions in denatured proteins. These fluorescence properties can be detected by RT-PCR instruments. Low fluorescence at room temperature indicates a well-folded protein. Fluorescence emission increases with increasing temperature, the fluorescence increases to a maximum value when the protein is fully denatured. The melting temperature (Tm) is identified by plotting the first derivative of the fluorescence emission as a function of temperature (dF/dT). Here, Tm is the temperature of the highest part of the curve [Citation48–50]. The combination of small molecules with the target proteins will change the thermal stability of the target proteins as well as Tm. It is widely accepted that ∆Tm ≥ 2°C is significant for indication of a small molecule binding to a protein [Citation51]. The addition of 100 μM ISO to full-length CDK6 in a thermal shift assay increased its Tm by 2.99°C (). Incubation of ISO with CDK6 fragment A or B increased the Tm by 2.0°C, but the Tm of fragment C resulted in an increase of only 0.8°C (), which suggested that ISO may prefer to bind to the N terminus of CDK6. Western blotting showed that CDK6 expression was dose-dependently () and time-dependently () decreased with ISO treatment. Moreover, ISO did not significantly affect the mRNA levels of CDK6 (). Next, we investigated the effect of ISO on the stability of CDK6 proteins; HepG2 cells were pretreated with ISO for the indicated time, followed by the addition of the proteasome inhibitor MG132, and MG132 caused an obvious increase in CDK6 (). These findings suggested that the regulatory effect of ISO on CDK6 expression may occur at the level of protein.
Figure 4. Isoginkgetin induces autophagy by targeting CDK6. (A) Structural overview of the CDK6 protein and its three truncations. (B) Binding pose of ISO in complex with CDK6 generated by induced-fit docking. Below, details of the interaction. ISO is shown as pink sticks, and protein is shown as a gray cartoon with key residues highlighted in sticks. Dashed lines represent hydrogen bonds. (C) in vitro binding of ISO to wild-type GST-CDK6 as determined by thermal shift assays. (D) in vitro binding of ISO to GST-CDK6 truncations as determined by thermal shift assays. (E and F) HepG2 cells were treated with ISO at the indicated doses for 24 h (E) or treated with ISO (20 μM) for the indicated time periods (F), and cell lysates were immunoblotted with the indicated antibodies. (G) HepG2 cells were treated with ISO at the indicated doses for 24 h, and the expression of CDK6 was determined by qRT-PCR. (H) HepG2 cells were treated with DMSO alone, 20 μM ISO alone for 24 h, or pretreated with DMSO or ISO for 20 h, followed by the addition of 10 μM MG132 for an additional 4 h. Cell lysates were harvested and subjected to western blotting with the indicated antibodies. (I) HepG2 cells were transfected with two different siRnas targeting CDK6 for 48 h. Cell lysates were harvested and subjected to western blotting with the indicated antibodies. (J) HepG2 cells transiently transfected with Flag-CDK6 were treated with 20 μM ISO for 24 h and stained with the indicated antibodies. Scale bar: 10 μm. (K and L) HepG2 cells were prepared as described in 4J. Cell lysates were harvested and subjected to western blotting with the indicated antibodies (K), and cell viability was measured with the CCK-8 assay (L). ns >0.05, ***p value ≤0.001 (t-test). Histograms are presented as the mean ± s.D. Of three biological replicates.
CDK6 is crucial for ISO-induced autophagy
Because CDK6 is the direct target of ISO, we wondered whether CDK6 participates in ISO-induced autophagy and the regulation of SLC2A1/GLUT1. To evaluate the role of CDK6 in ISO-induced autophagy, we knocked down CDK6 with two different siRNAs, and western blotting showed that LC3-II expression was increased (). CDK6 overexpression sufficiently abolished the formation of LC3 puncta () and the induction of LC3-II expression () upon ISO treatment. Moreover, LY2835219 (abemaciclib), a CDK4 and CDK6 kinase inhibitor, induced LC3-II expression without repressing CDK6 expression (Fig. S5F). Similar to LY2835219, ISO prevented HepG2 cells from entering S phase, causing an accumulation of cells in G0/G1 (Fig. S5 H). More importantly, CDK6 overexpression sufficiently rescued cell viability compared to ISO treatment alone (). These results indicated that CDK6 kinase activity may be essential for ISO-induced autophagic cell death. We also found that knockdown of CDK6 repressed phospho-PRKAA/AMPKα and phospho-ULK1 expression, as well as SLC2A1/GLUT1 expression (), indicating that CDK6 may regulate the expression of SLC2A1/GLUT1. As CDK4 and CDK6 show 71% amino acid homology. We wonder whether ISO may also affect CDK4 expression. Western blotting showed that CDK4 expression was also dose-dependently (Fig. S5I) and time-dependently (Fig. S5J) decreased with ISO treatment. Overexpression of CDK4 could not compensate for the impact of ISO-induced CDK6 degradation (Fig. S5K) and LC3-II increasing (Fig. S5 L). These results indicated that ISO-induced autophagy through CDK6 rather than CDK4.
Blocking autophagy cannot rescue ISO-inducing CDK6 degradation and cell cycle arrest
As a potential CDK6 inhibitor, ISO not only induced autophagy but also prevented HepG2 cells from entering the S phase, causing an accumulation of cells in G0/G1 (Fig. S5 H). We are curious about the role of autophagy in ISO-induced CDK6 degradation and cell cycle arrest. Results showed that CQ treatment or knockdown of autophagy-related genes (ATG5 or ULK1) did not completely rescue the ISO-inducing CDK6 degradation (Fig. S6A, S6B and S6C) and cell cycle arrest (Fig. S6D, S6E and S6F). These findings indicated that ISO-inducing CDK6 degradation and cell cycle arrest caused by ISO were independent of its autophagy pathway.
CDK6 deficiency decreases H3K27ac levels in the SLC2A1/GLUT1 enhancer
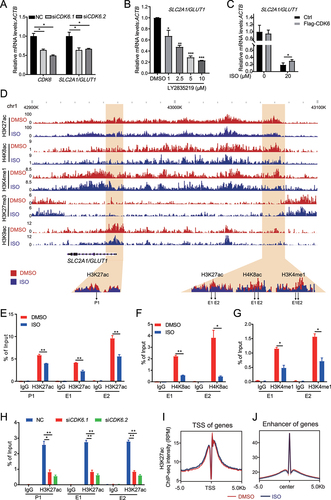
To study whether SLC2A1/GLUT1 is regulated by CDK6, we knocked down CDK6 with two different siRNAs, and RT-PCR showed that SLC2A1/GLUT1 mRNA expression was decreased (). LY2835219 treatment repressed the mRNA expression of glucose transmembrane transport genes (SLC2A1/GLUT1, SLC2A3/GLUT3, SLC2A4/GLUT4 and SLC5A9/SGLT4) ( and S5 G). Furthermore, CDK6 overexpression significantly attenuated the repressive effects of ISO on SLC2A1/GLUT1 mRNA levels (). Collectively, CDK6 is essential for ISO-mediated SLC2A1/GLUT1 repression, autophagic induction and cancer cell growth inhibition. CDK6 was initially identified as a typical cyclin-dependent kinase. Subsequent studies found that CDK6 also acted as a transcriptional regulator that is distinct from CDK4 [Citation52]. It has been reported that CDK inhibitors can exert anticancer activity by inhibiting the enhancer activity of oncogenes [Citation53]. To investigate the mechanism by which CDK6 regulates SLC2A1/GLUT1 expression, we firstly studied the changes in acetylation of histone 3 lysine 27 (H3K27ac), monomethylation of histone 3 lysine 4 (H3K4me1), trimethylation of histone 3 lysine 27 (H3K27me3), acetylation of histone 3 lysine 9 (H3K9ac) and acetylation of histone 4 lysine 8 (H4K8ac) levels around the SLC2A1/GLUT1 transcription start site (TSS) and enhancer upon ISO treatment. ChIP-Seq analysis showed that the H4K8ac and H3K4me1 are co-localized with H3K27ac on SLC2A1/GLUT1 enhancer (). ISO treatment decreased the H3K27ac, H4K8ac and H3K4me1 enrichment on SLC2A1/GLUT1 enhancer (). ChIP assays also confirmed these findings (). These results indicated that SLC2A1/GLUT1 might be regulated by epigenetic modification including H3K27ac, H4K8ac and H3K4me1. We then examined whether CDK6 regulates the activity of SLC2A1/GLUT1 enhancers. When CDK6 was knocked down, ChIP assays indicated that H3K27ac on the SLC2A1/GLUT1 enhancer significantly decreased (). These findings indicated that CDK6 deficiency repressed SLC2A1/GLUT1 enhancer activity. Our further study revealed that ISO treatment had little effect on the average H3K27ac level of the total TSS () and enhancer () regions.
Figure 5. Targeting CDK6 represses enhancer activation of SLC2A1/GLUT1. (A) HepG2 cells were transfected with two different siRnas targeting CDK6 for 48 h, and the expression of SLC2A1/GLUT1 was determined by qRT-PCR. (B) HepG2 cells were treated with LY2835219 at the indicated doses for 24 h, and the expression of SLC2A1/GLUT1 was determined by qRT-PCR. (C) HepG2 cells were prepared as described in 4J, and the expression of SLC2A1/GLUT1 was determined by qRT-PCR. (D) the Wash U epigenome browser view shows H3K27ac, H4K8ac, H3K4me1, H3K27me3 and H3K9ac enrichment around SLC2A1/GLUT1 after 20 μM ISO treatment for 24 h. The primer sets for qPCR are indicated using the arrow at the bottom. (E-G) ChIP analysis shows H3K27ac (E), H4K8ac (F) and H3K4me1 (G) enrichment on SLC2A1/GLUT1 enhancers after 20 μM ISO treatment for 24 h. (H) HepG2 cells were prepared as in 4I. ChIP analysis shows H3K27ac enrichment on SLC2A1/GLUT1 enhancers. (I) Metagene plot representation of the mean H3K27ac ChIP-seq density across TSSs. Metagene analysis is centered on TSS regions. (J) Metagene plot representation of the mean H3K27ac ChIP-seq density across enhancers. Metagene plot is centered on the enhancer regions. *p value ≤0.05, **p value ≤0.01, ***p value ≤0.001 (t-test). Histograms are presented as the mean ± s.D. Of three biological replicates.
ISO treatment abrogates hepatocarcinogenesis in the HepG2 xenograft mice and the DEN+CCl4-induced primary HCC mice
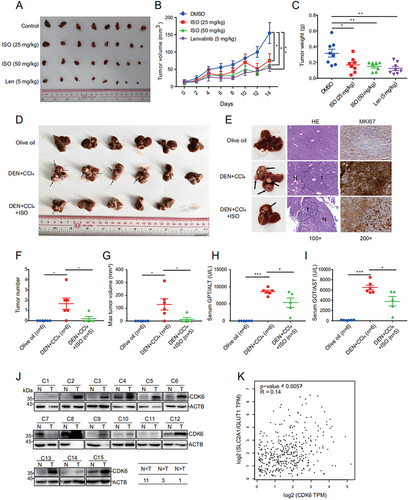
To evaluate whether the biological effect of ISO is potentially clinically relevant, we tested the in vivo effect of ISO on tumor growth in BALB/c nude mice with HepG2 xenografts. The results showed that ISO significantly decreased the volume () and weight () in the xenograft experiment. In addition, analysis of the spleen index, calculated as the ratio of spleen weight (g) to body weight (g), revealed that the lenvatinib-treated mice had a lower spleen index than the control group mice, and there were no obvious differences in the spleen index between the ISO-treated groups and the vehicle control group (Fig. S7A and S7B). Moreover, hematoxylin and eosin (H&E) staining of HepG2 xenograft tumor tissues revealed that ISO had the same inhibitory effect on tumor angiogenesis as lenvatinib (Fig. S7C). We also found that ISO and LY2835219 exerted similar anti-HCC activity (Fig. S7D, S7E and S7F). In order to further prove the anti-HCC effect ISO in vivo, we performed DEN+CCl4 (diethylnitrosamine+carbontetrachloride)-induced primary HCC model in C57BL/6 mice (Fig. S7 G). In the DEN+CCl4-induced primary HCC mouse model, 5 out of 6 (83.3%) mice formed visible tumors after CCl4 treatment for 20 weeks, in contrast, only 1 out of 5 (20%) mice in the ISO-treated group developed tumors (). Moreover, the expression of MKI67/Ki67 was significantly reduced with ISO treatment (). Total tumor numbers and the max tumor volume of ISO-treated mice were also decreased significantly compared to DEN+CCl4-injected mice (). Higher serum GPT/ALT and GOT/AST levels were observed in DEN+CCl4-injected mice, and the GPT/ALT and GOT/AST levels were significantly reduced after ISO treatment (). Collectively, these data demonstrated that ISO had potent anti-HCC activity in vivo. Moreover, ISO was predominantly excreted in the feces by a pharmacokinetic study in the rats (Fig. S7 H), which was previously reported [Citation54].
Figure 6. Isoginkgetin inhibits liver cancer growth and angiogenesis in vivo. (A-C) HepG2 cells were injected into nude mice. When tumors reached a size of 10 mm3, mice were treated daily for 14 days with the indicated concentration of ISO. Tumors were imaged (A), and growth curves (B) and tumor weights (C) are shown as the mean ± SEM of eight mice in each group. (D) Liver image in DEN+CCl4-induced HCC mice, black arrows indicate tumors in liver. (E) Representative images of livers, hematoxylin-eosin (HE) staining images of livers and MKI67/Ki67 staining in liver. Black-dotted lines indicate the boundary of normal tissues and tumor tissues. N, normal tissue; T, tumor tissue. (F and G) Quantification of total tumor numbers and the max tumor volume. (H and I) Serum levels of GPT/ALT and GOT/AST. (J) CDK6 protein levels in 15 pairs of HCC tumor and adjacent nontumor tissues detected by western blotting. (K) the correlation of CDK6 and SLC2A1/GLUT1 in liver cancer tissues was analyzed by an interactive web portal, GEPIA (http://gepia.Cancer-pku.Cn). Data are presented as the mean ± SEM. *p value ≤0.05, **p value ≤0.01, ***p value ≤0.001 (t-test.
GLUT1 and CDK6 are promising targets in HCC
Since ISO significantly inhibited the expression of SLC2A1/GLUT1 and CDK6, we further investigated the role of SLC2A1/GLUT1 and CDK6 in TCGA data and human HCC tissues. Analysis of TCGA data showed that SLC2A1/GLUT1 was more highly expressed in HCC tissues than in normal liver tissues (Fig. S7I). Low expression of SLC2A1/GLUT1 was significantly correlated with the overall survival rates of HCC patients (Fig. S7J). Moreover, we compared the protein levels of CDK6 in 15 pairs of human HCC tissues and matched adjacent normal liver tissues. The data revealed that highly amplified CDK6 was found in 11 patients, suggesting that CDK6 expression was strongly upregulated in the HCC tissues compared to the adjacent tissues (). Finally, the expression of CDK6 was positively correlated with SLC2A1/GLUT1 expression in liver cancer, supporting the role of CDK6 in activating SLC2A1/GLUT1 expression (). Nevertheless, SLC2A1/GLUT1 and CDK6 seem to act as oncogenes and may be useful in the prognosis of liver cancer patients.
Discussion
In the present study, we screened flavonoids with anti-liver cancer activity and found that ISO derived from G. biloba effectively inhibited HCC cell proliferation, invasion and metastasis, as well as the hepatocarcinogenesis in the HepG2 xenograft mice and the DEN+CCl4-induced primary HCC mice. The inhibition effects of ISO on HCC cells were mediated by inducing cell autophagic death. Our results demonstrated that ISO promoted cell autophagic death by repressing the expression of SLC2A1/GLUT1, whose deficiency led to significant activation of the AMPK-ULK1 pathway via glucose deprivation. Further research showed that ISO directly targets the N terminus of CDK6 and promotes CDK6 degradation. Moreover, ISO treatment and CDK6 deficiency inhibited the enhancer activity of SLC2A1/GLUT1. Finally, we identified SLC2A1/GLUT1 and CDK6 as promising oncogenes in HCC by analysis of TCGA data and human HCC tissues.
Studies have reported that glucose starvation can induce autophagy by activating the AMPK-ULK1 pathway [Citation45,Citation55,Citation56], and SLC2A1/GLUT1 is mainly responsible for glucose transport into cells [Citation57], suggesting that SLC2A1/GLUT1 is closely related to autophagy. Knockdown of SLC2A1/GLUT1 in the human laryngeal cancer cell line Tu212 can promote autophagy [Citation58]. However, there are no previous reports on autophagy regulated by SLC2A1/GLUT1 in HCC. SLC2A1/GLUT1 is highly expressed in many tumor tissues, including HCC tissues [Citation59,Citation60]. Knockdown of SLC2A1/GLUT1 expression by siRNA significantly inhibited the proliferation of HCC cells [Citation59]. The development of drugs that inhibit SLC2A1/GLUT1 is an attractive therapeutic strategy for HCC. Many small-molecule agents, including glucose analogs, flavonoids, and selective SLC2A1/GLUT1 inhibitors, have been reported as anticancer drugs that repress the functionality of SLC2A1/GLUT1 [Citation61]. The glucose analog 4,6-O-ethylidene-α-D-glucose competitively binds to the exofacial binding site of SLC2A1/GLUT1. However, this molecule shows poor affinity and inhibits wild-type transport with an inhibition constant (Ki) of approximately 12 mM [Citation62,Citation63]. Flavonoids, including genistein, quercetin and phloretin, were reported to inhibit the ATP-binding tyrosine kinase of SLC2A1/GLUT1, thus affecting the conformation and transporter affinity of SLC2A1/GLUT1 [Citation61,Citation63,Citation64]. However, these flavonoids are still used only for research purposes and are not yet approved for clinical use. Selective SLC2A1/GLUT1 inhibitors, including STF-31 [Citation65,Citation66] and BAY-876 [Citation67], show high selectivity and affinity for SLC2A1/GLUT1. However, STF-31 is toxic to human pluripotent stem cells (hPSCs) and is sufficient to selectively remove hPSCs from mixed cultures [Citation68]. BAY-876 was reported to possess antitumor activity against RB1-positive triple-negative breast cancer [Citation69] and ovarian cancer [Citation70], but there is no report on its antitumor effect in HCC. The development of new drugs that can repress SLC2A1/GLUT1 expression in HCC is important to improve the outcomes of HCC therapy. Moreover, there are no small molecules that have been reported to participate in autophagy by regulating SLC2A1/GLUT1 expression in HCC. In the current study, we revealed that ISO can induce autophagic HCC cell death by repressing SLC2A1/GLUT1 expression. We also confirmed that knocking down SLC2A1/GLUT1 can significantly activate the AMPK-ULK1 pathway induced by starvation to promote autophagy in HCC.
At present, there are three CDK4 and CDK6 inhibitors approved by the FDA to treat cancers, namely, palbociclib, ribociclib and abemaciclib. These inhibitors bind to the adenosine triphosphate (ATP)-binding pocket of CDK6 to inhibit its kinase activity [Citation71]. However, palbociclib and ribociclib often cause hematological toxicities, while diarrhea is the key side effect for abemaciclib [Citation72]. Moreover, several studies have shown that CDK6 has a kinase-independent function of promoting tumor angiogenesis [Citation27,Citation28]. Therefore, small molecules inducing CDK6 degradation are attractive therapeutic agents in cancers. Kevin Burgess developed specific CDK6-targeted proteolysis-targeting chimeras (PROTACs); for example, BSJ-03-123 can selectively degrade CDK6 without affecting CDK4 in acute lymphoblastic leukemia (ALL) cells [Citation73]. However, PROTACs may cause drug resistance due to the decrease or deletion of E3 ligases and related genes [Citation74]. Our data also revealed that CDK6 expression was strongly upregulated in 73.33% of the HCC tissues compared to the adjacent tissues. Therefore, new and effective CDK6 inhibitors that induce CDK6 degradation are needed. Experimental results showed that ISO directly targets CDK6 and promotes its degradation. Moreover, ISO treatment also inhibits CDK4 expression which may play a role in ISO-induced cell cycle arrest but not ISO-induced autophagy. We also found that ISO-induced cell cycle arrest was independent of autophagy. Thus, ISO has potential as a novel and effective anticancer agent that induces CDK6 degradation.
The expression of SLC2A1/GLUT1 is regulated by epigenetic modification, especially enhancer activity. Enhancers are cis-acting elements that remotely enhance gene transcription. Current studies usually define enhancers as gene regions more than 1.5 kb away from the gene TSS and enriched with acetylation of H3K27ac, which is also a marker of enhancer activity [Citation75]. The expression of SLC2A1/GLUT1 is regulated by enhancer activity. In human embryonic stem cells (hESCs), the SLC2A1/GLUT1 enhancer has been identified as the DNA region approximately 50 to 60 kb upstream of the TSS. The core transcription factors SOX2 (SRY-box transcription factor 2), POU5F1/OCT4 (POU class 5 homeobox 1) and NANOG (Nanog homeobox) in stem cells induce SLC2A1/GLUT1 expression by activating the SLC2A1/GLUT1 enhancer to promote glucose uptake and glycolysis in hESCs [Citation76]. At present, there is no report on the regulation of SLC2A1/GLUT1 enhancer activity in HCC. CDK4-CDK6 kinase inhibitors can significantly inhibit the expression of SLC2A1/GLUT1 [Citation77], but whether CDK6 directly regulates the expression of SLC2A1/GLUT1 has not been reported. We confirmed that CDK6 can activate SLC2A1/GLUT1 expression in liver cancer. We first found that ISO can inhibit the enhancer activity of SLC2A1/GLUT1 by H3K27ac, H4K8ac and H3K4me1 ChIP-seq. Moreover, the regulation of ISO on the SLC2A1/GLUT1 enhancer may be dependent on CDK6, whose knockdown can decrease the activity of the SLC2A1/GLUT1 enhancer. This work provides novel insights into the molecular mechanism by which the CDK6 protein regulates SLC2A1/GLUT1 expression.
In addition, RNA-seq analysis revealed that ISO can upregulate the expression of genes related to the UPR, such as HSPA5/BIP, EIF2AK3/PERK, DDIT3/CHOP and PPP1R15A/GADD34, indicating that ISO may induce autophagic cell death via activation of endoplasmic reticulum stress, which has been reported in HeLa cells by a previous study [Citation40]. Interestingly, some studies have shown that there is crosstalk between the UPR and metabolic signals. For example, AMPK activation can promote ERN1/IRE1α and EIF2AK3/PERK activation [Citation78]. Compound C, a small-molecule inhibitor of AMPK signaling, inhibited the UPR-induced transcription program [Citation79]. Thus, ISO may upregulate the expression of UPR-related genes by promoting AMPK activation. However, the detailed mechanisms require further study.
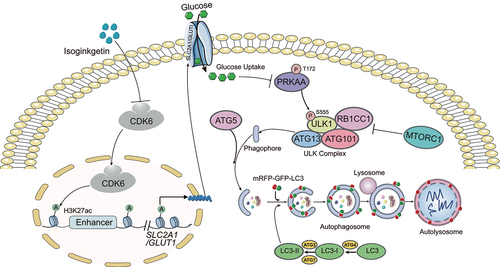
In summary, our study illustrated that ISO is a potential novel anticancer agent against HCC that directly binds the N terminus of CDK6 to induce its degradation with fewer side effects. Moreover, our results provide a new molecular mechanism by which ISO treatment or CDK6 deletion promotes autophagy; that is, ISO targeting the N terminus of CDK6 for degradation inhibits the expression of SLC2A1/GLUT1 by decreasing the enhancer activity of SLC2A1/GLUT1, resulting in decreased glucose and inducing the AMPK-ULK1 pathway. Here, we propose a working model illustrating the molecular mechanism of how ISO inducing cytotoxic autophagy (). To our knowledge, this is the first study to show that ISO promotes autophagic cell death via the AMPK-ULK1 axis in vitro. Further studies revealed that ISO may regulate the enhancer activity of SLC2A1/GLUT1 by targeting CDK6, and the regulatory effect of CDK6 on SLC2A1/GLUT1 enhancer activity was revealed for the first time.
Figure 7. Schematic illustration of ISO-induced cytotoxic autophagy in HepG2 cells. ISO induces cytotoxic autophagy through the CDK6-SLC2A1/GLUT1-PRKAA-ULK1 signaling pathway in HepG2 cells. Briefly, ISO targeting CDK6 for degradation inhibits the expression of SLC2A1/GLUT1 by decreasing the enhancer activity of SLC2A1/GLUT1, resulting in decreased glucose and inducing the AMPK-ULK1 pathway. The activated AMPK-ULK1 pathway further induced autophagy.
Materials and methods
Antibodies and reagents
Human antibodies recognizing LC3A/B (4108), SQSTM1/p62 (5114), ULK1 (6439), phospho-ULK1 (Ser555) (5869), PRKAA/AMPKα (D63G4), phospho-PRKAA/AMPKα (Thr172) (D4D6D), autophagy antibody sampler kit (4445), H3K4me1(5326), H3K9ac (9649), and H3K27me3 (9733) were purchased from Cell Signaling Technology. Anti-human ACTB/β-actin (AC004), CDK6 (A1545), and ATG5 (A19677) were purchased from ABclonal Technology. Anti-human H3K27ac (ab4729), H4K8ac (ab45166) and SLC2A1/GLUT1 (ab115730) were purchased from Abcam. Anti-Flag antibody (F1804) was from Sigma-Aldrich. Antibodies to SLC2A2/GLUT2 (21,829-1-AP), SLC2A3/GLUT3 (20,403-1-AP) and SLC2A4/GLUT4 (66,846-1-Ig) were from Proteintech. Anti-SLC5A9 (40,214) was from Signalway Antibody. Lenvatinib (L125518) and LY2835219 (L124851) were purchased from Aladdin Bio-Chem Technology. Chloroquine (HY-17589A), ferrostatin-1 (HY -100,579) and RSL3 (HY-100218A) were purchased from MedChemExpress, and 2-NBDG (B6035) was from APExBIO. Red fluorescent cell membrane dye DiI (C1991S) was from Beyotime. Protein A/G magnetic beads (B23202) for ChIP were purchased from Bimake. PCR primers were custom synthesized by Guangzhou IGE Technology, and siRNAs were synthesized by GenePharma. The sequences of primers and siRNAs are in Table S1. The ATG5 and ULK1 sgRNA plasmids were gifts from Dr. Min Wu of Wuhan University. Expression plasmids for CDK6 (HG11779-CF) and SLC2A1/GLUT1 (HG12102-NF) were purchased from Sino Biological.
ISO preparation from G. biloba L
G.biloba L. extract (3.0 kg) was suspended in H2O and then extracted with petroleum ether and ethyl acetate. The ethyl acetate fraction (80 g) was subjected to silica gel column chromatography and eluted with a gradient mixture of CHCl3 − CH3OH (100: 0 → 0: 100, v/v) to afford seven major fractions (Fr. A − Fr. G). Then, Fr. D (4 g) was subjected to passage over a Sephadex LH-20 column (CHCl3 − CH3OH, 1: 1, v/v) to yield four subfractions (Fr. D1− Fr. D4). Fr. D3 (2 g) was further purified by preparative HPLC (CH3CN − H2O, 47: 53, v/v) at a flow rate of 8 mL/min to yield ISO.
Cell lines and transfection
The liver cancer cell lines HepG2 (HB-8065) and Hep1–6 (CRL-1830) were purchased from the American Type Culture Collection/ATCC. Huh7 (GDC0134) and H22 (GDC0091) cell lines were purchased from China Center for Type Culture Collection/CCTCC. All cell lines were cultured in DMEM (Thermo Fisher Scientific, 11,995,065) supplemented with 10% (v/v) fetal bovine serum (Gemini, 900–108). For transient transfection, cells were transfected with siRNAs or plasmids using GP-transfect-Mate (GenePharma, G04009). Briefly, HepG2 cells were grown in 6-well plates and transiently transfected at 60–80% confluence with 5 nM siRNA or 1 μg plasmid according to the manufacturer’s instructions. After 24 h transfection, the cells were treated with the indicated concentrations of ISO for another 24 h. Then cells were harvested for RT-PCR or western blotting.
Cell viability assay
Cells were seeded in 96-well plates at approximately 5000 cells per well. After incubation for 24 h, cells were treated with different concentrations of compounds for 24 h and 48 h, and then, 10% CCK-8 reagent (APExBIO, K1018) was added for 2–3 h at 37°C. Absorbance was measured at 450 nm by a microplate system. Assays were repeated at least three times. The data shown are the average value ± s.d. of three representative experiments, and the p value was calculated using Student’s t-test.
Colony formation
HepG2 and Huh7 cells were seeded in 12-well plates at approximately 400 cells and 200 cells respectively per well, incubated for 24 h, and then treated with the indicated concentrations of compounds for 14 days. The cell colonies were fixed with 4% paraformaldehyde for 30 min and stained with 0.1% crystal violet for 15 min at room temperature. The stained cells were washed with PBS (10 mM Na2HPO4, 1.8 mM KH2PO4, 137 mM NaCl, 2.7 mM KCl, pH 7.4), and colonies containing more than 50 cells were counted. The data shown are the average value ± s.d. of three representative experiment, and p value was calculated using Student’s t-test.
Transwell assay
Transwell assays were performed as described previously. Briefly, the migration assay was performed using 8-μm pore size Transwell inserts (Corning, 3422) on a 24-well multiplate. 2 × 10⁵ HCC cells were plated in medium without serum or growth factors in the upper chamber. The indicated concentration of ISO was added to the upper chamber, and medium supplemented with 10% fetal bovine serum was used as a chemoattractant in the lower chamber. After 36 h of incubation, cells that did not migrate through the membrane were removed by a cotton swab. Cells on the lower surface of the membrane were fixed with 4% paraformaldehyde for 30 min and stained with 0.1% crystal violet for 15 min at room temperature. The stained cells were washed with PBS three times and counted by ImageJ software. Data are shown as the average value ± s.d. of at least three representative experiments, and the p value was calculated using Student’s t-test.
Scratch-Wound assay
For the scratch-wound assay, culture inserts (Ibidi, 80,209) were placed in 12-well plates, 1 × 10⁶ cells/mL suspensions were prepared, 70 μL suspensions were placed in culture inserts for 24 h, culture inserts were then removed, and the cells were washed with PBS three times to remove cell debris and cultured with DMEM with 1% serum. After 0, 24, 48 and 72 h incubation at 37°C, the migration distance of the cells was observed under a light microscope. The areas between the edges of the wounds were measured and analyzed using ImageJ software. Data are shown as the average value ± s.d. of three representative experiments, and the p value was calculated using Student’s t-test.
Immunofluorescence staining
Cells were cultured on coverslips and fixed with 4% paraformaldehyde for 10 min after washing twice in PBS. The coverslips were then incubated with PBS containing 0.1% Triton X-100 (Meryer, 9002-93-1) and 1% BSA (Sigma-Aldrich, SRE0096) for 10 min. The coverslips were then washed four times in PBS, followed by hybridization with primary and fluorescent secondary antibodies for 1 h each. Then, the coverslips were stained with 0.5 μg/mL DAPI (Coolaber, CD4261) for 10 min and observed with fluorescence microscopy. For plasma membrane staining, cells were incubated with non-immunological red fluorescent dye DiI (Beyotime, C1991S) at room temperature for 10–20 min after incubating the antibodies.
Transmission electron microscopy
Electron microscopy was performed as described previously [Citation80]. Briefly, cells were seeded in 6-well plates and treated with 20 μM ISO for 24 h. The cells were then fixed in 4% glutaraldehyde (Sigma-Aldrich, G5882) in 0.1 M phosphate buffer (pH 7.4) for 2 h, followed by dehydration in a graded ethanol series and embedding in Epon E812 resin (Sigma-Aldrich, 45,345). Ultrathin sections were mounted on copper grids. An electron microscope was used to visualize the samples.
Lentivirus and retrovirus infection
For ATG5 and ULK1 stable knockdown cell lines, the gRNAs targeting human ULK1 and ATG5 were designed by website (http://crispr.mit.edu). The sequences (human ULK1: 5“-CACCGAGCAGATCGCGGGCGCCATG-3”, ATG5: 5“-CACCGAAGAGTAAGTTATTTGACGT-3”) were selected and cloned into a lentiCRISPR v2 vector. Then plasmids were transfected into HEK293T cells together with psPAX2 and pMD2.G (gifts from Dr. Min Wu, Wuhan University) using calcium phosphate transfection. At 2 days after transfection, the medium was passed through a 0.45 μm pore filter and mixed with polybrene (Sigma-Aldrich, H9268). The medium containing lentiviruses was transferred to HepG2 cells. HEK293T cells were further cultured in fresh medium for 24 h. After 8 h of infection, the medium was changed. The next day, infection was repeated as above. After lentivirus infection, cells were selected with 2 μg/mL puromycin (Sigma-Aldrich, P9620) for 3 days. After two generations of cell culture, follow-up experiments were carried out. Stable overexpressing mRFP-GFP-LC3 or Flag-SLC2A1/GLUT1 cell lines were generated as follows: lentiviral plasmids mRFP-GFP-LC3 or Flag-SLC2A1/GLUT1 were transfected into HEK293T cells together with psPAX2 and pMD2.G using calcium phosphate transfection. The remaining steps are the same as the construction of ATG5 and ULK1 KD cell lines.
Pipeline of RNA-seq analysis
RNA-seq library construction was performed using an Illumina TruSeq library construction kit. Total RNA (5 µg) was used for initiation and then prepared according to the manufacturer’s instructions. mRNA-seq libraries were sequenced using HiSeq2000 for 100 bp paired-end sequencing. Quality control of the mRNA-seq data was performed using Fatsqc, and low-quality bases were trimmed. All RNA-seq data were mapped to the human genome (hg19) by TopHat (version 2.1.1) and allowed a maximum of 2 mismatches. The gene expression level was calculated by Cufflinks with default parameters, and gene ontology analysis was performed using DAVID (https://david.ncifcrf.gov).
RNA interference, reverse transcription and quantitative PCR
HepG2 cells were transfected with siRNA and washed once in PBS. Total RNA was extracted with an RNA extraction kit (Aidlab, RN0702) according to the manufacturer’s manual. Approximately 1 μg of total RNA was used for reverse transcription with a first strand cDNA synthesis kit (Vazyme, R211–02). The amount of mRNA was assayed by quantitative PCR. ACTB/β-actin was used to normalize the amount of each sample. Assays were repeated at least three times. The data shown are the average value ± s.d. of three representative experiments.
Glucose uptake assay
The glucose uptake ability of HepG2 cells was evaluated by using fluorescent glucose with 2-NBDG. 2 × 10⁵ HepG2 cells seeded in 24-well plates were cultured in DMEM without glucose or carbon sources. After being treated with 10, 15 and 20 μM ISO for 24 h, the cells were gently rinsed with HBSS (Gibco, 14,025,092) and incubated with 100 μM 2-NBDG at 37°C for 30 min. Consequently, the cells were rewashed with HBSS. The fluorescence intensity of the cells was detected on a fluorescence microscope.
Molecular docking
The crystal structure of the CDK6 protein (PDB ID: 6OQO) was obtained from the PDB database (https://www.rcsb.org/). The species and genus were selected as Homo sapiens, and the determination method was X-ray crystal diffraction. The three-dimensional structure of ISO was obtained from the ZINC database (https://www.zinc15.docking.org/). Docking was performed with Autodock Vina. The conformation with the lowest binding energy was selected for further force analysis and plotted with PyMOL.
Protein expression and GST purification
Human CDK6 cDNA and its truncations were cloned into the pGEX-KG vector. The constructs were then transformed into BL-21 bacteria (Shenzhen KT Life technology, KTSM104 L). When the absorbance of bacteria reached 0.6–0.8 at 600 nm, 0.5 mM IPTG (Coolaber, CI6621) was added, and bacteria were further cultured at 18°C for 4 h. Bacteria were collected by centrifugation at 10,000 g for 1 h. Recombinant proteins were purified from the supernatant with GST-tagged purification resin according to the manufacturer’s instructions (Beyotime, P2253). Protein concentration was quantified by a BCA protein concentration assay kit (Beyotime, P0010S).
Thermal shift assay
A thermal shift assay was performed as previously described [Citation50]. Briefly, the recombinant CDK6 protein was dissolved in 50 mM phosphate buffer (PB) solution (43.5 μM Na2HPO4·12 H2O, 7.35 μM NaH2PO4·2 H2O, pH 7.6) at a concentration of 0.5 mg/mL ISO and SYPRO orange probes (1: 200 dilution; Sigma-Aldrich, S5692) were then added to the CDK6 protein solution. Protein dissolution curves were detected in a Roche Light Cycler 480 fluorescence quantitative PCR instrument. The temperature was set from 37 to 99°C (1°C/min). The Tm of the protein was determined by calculating the peak value of the first derivative d(RFU)/dT of the protein dissolution curve.
ChIP assay
Briefly, approximately 1 × 10⁷ HepG2 cells were crosslinked with 1% formaldehyde for 10 min and quenched with 0.125 M glycine for 5 min. The cells were then washed three times with PBS and harvested in ChIP lysis buffer (50 mM Tris-HCl, pH 7.6, 1 mM CaCl2, 0.2% Triton X-100). DNA was digested to 150–300 bp by MNase (NEB, M0247S) before extensive centrifugation. Four volumes of ChIP dilution buffer (20 mM Tris-HCl, pH 8.0, 150 mM NaCl, 2 mM EDTA, 1% Triton X-100, 0.1% SDS) were added to the supernatant. The resulting lysate was then incubated with protein A/G magnetic beads (Bimake, B23202) and antibodies at 4°C overnight. The beads were washed 5 times, and DNA was eluted with ChIP elution buffer (0.1 M NaHCO3, 1% SDS, 20 µg/mL proteinase K [MedChemExpress, HY -108,717]). The elution was incubated at 65°C overnight, and DNA was extracted with a DNA purification kit (Tiangen, DP214). The purified DNA was assayed by quantitative PCR with Bio-Rad MyIQ. Assays were repeated at least three times. The data shown are the average value ± s.d. of three representative experiments.
Xenograft experiments of cancer cells
Five-week-old male BALB/C nude mice were purchased from Beijing HFK Bioscience Co., Ltd. A liver cancer mouse model was established by subcutaneously injecting the animals with 1 × 10⁷ HepG2 cells in the flank region. One week later, when the tumor size reached approximately 10 mm3, the mice were randomly divided into 4 groups (n = 8/group): control, ISO (25 mg/kg), ISO (50 mg/kg) and lenvatinib (5 mg/kg). Isoginkgetin was dissolved in 10% DMSO with deionized water and given by intraperitoneal injection each day for 14 days. Tumor volumes were measured twice a week using calipers. Tumor volumes were derived as V = 0.5 × length × width2. The tumors were harvested and weighed. All animal xenograft experiments were performed following the hospital laboratory animal guidelines and were approved by the Animal Experimentations Ethics Committee of Shenzhen People’s Hospital (No. 20,200,401–26).
DEN+CCl4-Induced primary liver cancer mouse model
The DEN+CCl4 induced hepatocarcinoma models were established according to previous reports [Citation81,Citation82]. Briefly, three-week-old male C57BL/6 mice were purchased and intraperitoneally injected once with diethylnitrosamine (DEN, 25 mg/kg, i.p.; Macklin, N814760). One week later, the mice were injected with 20% carbon tetrachloride (CCl4, 5 mL/kg of 4:1 mixture of olive oil and CCl4, i.p.; ACMEC, C27711) twice a week (Fig. S7 G) until the indicated time. ISO (25 mg/kg) was administrated (i.p.) at 8 weeks of age three times a week. The mice were then sacrificed at 24 weeks of age.
Immunohistochemical staining
Immunohistochemical staining of HCC tissue sections was performed using an Immunohistochemistry Kit (Fuzhou Maxim, KIT-9710). The sections were stained with anti-MKI67/Ki67 (Mreda, M193837) primary antibodies and then successively incubated with biotin-labeled anti-mouse/rabbit IgG and peroxidase-conjugated streptavidin. A DAB Detection Kit (Fuzhou Maxim, Kit-0014) was then employed to visualize the staining of interest.
Survival analysis
Disease-free survival (DFS, also called relapse-free survival and RFS) and overall survival analysis based on gene expression via GEPIA were performed (http://gepia.cancer-pku.cn/). GEPIA uses the log-rank test, also called the Mantel – Cox test, for hypothesis evaluation. The Cox proportional hazard ratio is based on the Cox PH model. The datasets of liver cancer are based on TCGA-LIHC (HCC).
Patients and samples
Fresh human HCC tumor tissues and matched adjacent liver tissues were collected from patients who underwent surgical resection at Shenzhen People’s Hospital between year 2020 and 2021 for western blot (n = 15) analyses. For western blot analysis, 20 mg tissue was calculated and then lysed in 500 μL RIPA buffer (Solarbio, R0010) mixed with protease inhibitors (APExBIO, K1007) and phosphatase inhibitors (Solarbio, P1260). The proteolysis was mixed with an equal volume of 2× SDS buffer and incubated at 95°C for 15 min, and then analyzed by SDS-PAGE gels. The studies were approved by Shenzhen People’s Hospital Ethics Committee (No. LL-KT -2,020,176).
Pharmacokinetic study in rats
Sprague – Dawley (SD) male rats were purchased from Beijing HFK Bioscience Co., Ltd (2,025,143). Rats were raised under standard experimental conditions (circadian cycle of 12 h, 18-22°C) and fed standard pellet feed and water. After adaptive feeding for 1 week, the rats were starved for 12 h but had free access to water. The experimental rats were randomly divided into two groups with three rats per group. One group was administered ISO using gastric gavage at a dose of 20 mg/kg, and the other group was administered a DMSO suspension. Subsequently, the urine and feces of the rats were collected for HPLC analysis.
Quantification and statistical analysis
All data were presented as mean ± standard deviation (s.d.) or standard error of mean (SEM). Differences between groups were compared by Student’s t-test or one way ANOVA using GraphPad Prism 7. Statistical significance was assigned with * p-value ≤0.05, ** p-value ≤0.01, *** p-value ≤0.001.
Online access of next generation sequencing data
All the deep sequencing data have been submitted to the GEO database with Acc. No. GSE188535.
Supplemental Material
Download MS Word (2.1 MB)Acknowledgments
We thank Dr. Wu Min and Dr. Lianyun Li of Wuhan University for sharing reagents.
Disclosure statement
No potential conflict of interest was reported by the author(s).
Supplementary material
Supplemental data for this article can be accessed online at https://doi.org/10.1080/15548627.2022.2119353
Additional information
Funding
References
- Villanueva A, Longo DL. Hepatocellular Carcinoma. N Engl J Med. 2019;380(15):1450–1462. 10.1056/NEJMra1713263
- Sung H, Ferlay J, Siegel RL, et al. Global cancer statistics 2020: gLOBOCAN estimates of incidence and mortality worldwide for 36 cancers in 185 countries. CA Cancer J Clin. 2021;71(3):209–249. 10.3322/caac.21660
- . European Association For The Study Of The Liver, European Organisation For Research And Treatment Of CancerEASL-EORTC clinical practice guidelines: management of hepatocellular carcinoma. J Hepatol. 2012;56(4):908–943. 10.1016/j.jhep.2011.12.001.
- Kudo M, Finn RS, Qin S, et al. Lenvatinib versus sorafenib in first-line treatment of patients with unresectable hepatocellular carcinoma: a randomised phase 3 non-inferiority trial. Lancet. 2018;391(10126):1163–1173. 10.1016/S0140-6736(18)30207-1
- Mizushima N, Komatsu M. Autophagy: renovation of cells and tissues. Cell. 2011;147(4):728–741. 10.1016/j.cell.2011.10.026
- Levine B, Kroemer G. BioloGical functions of autophagy genes: a disease perspective. Cell. 2019;176(1–2):11–42. 10.1016/j.cell.2018.09.048
- Denton D, Kumar S. Autophagy-Dependent cell death. Cell Death Differ. 2019;26(4):605–616. 10.1038/s41418-018-0252-y
- Noguchi M, Hirata N, Tanaka T, et al. Autophagy as a modulator of cell death machinery. Cell Death Dis. 2020;11(7):517. 10.1038/s41419-020-2724-5
- Qu X, Yu J, Bhagat G, et al. Promotion of tumorigenesis by heterozygous disruption of the beclin 1 autophagy gene. J Clin Invest. 2003;112(12):1809–1820. 10.1172/JCI20039
- Levy JMM, Towers CG, Thorburn A. Targeting autophagy in cancer. Nat Rev Cancer. 2017;17(9):528–542. 10.1038/nrc.2017.53
- Amaravadi RK, Kimmelman AC, Debnath J. Targeting autophagy in cancer: recent advances and future directions. Cancer Discov. 2019;9(9):1167–1181. 10.1158/2159-8290.CD-19-0292
- Galluzzi L, Bravo-San Pedro JM, Levine B, et al. Pharmacological modulation of autophagy: therapeutic potential and persisting obstacles. Nat Rev Drug Discov. 2017;16(7):487–511. 10.1038/nrd.2017.22
- Russo M, Russo GL. Autophagy inducers in cancer. Biochem Pharmacol. 2018;153:51–61.
- Cragg MS, Harris C, Strasser A, et al. Unleashing the power of inhibitors of oncogenic kinases through BH3 mimetics. Nat Rev Cancer. 2009;9(5):321–326. 10.1038/nrc2615
- Khaw SL, Huang DC, Roberts AW. Overcoming blocks in apoptosis with BH3-mimetic therapy in haematological malignancies. Pathology. 2011;43(6):525–535. 10.1097/PAT.0b013e32834b1b34
- Sieghart W, Losert D, Strommer S, et al. Mcl-1 overexpression in hepatocellular carcinoma: a potential target for antisense therapy. J Hepatol. 2006;44(1):151–157. 10.1016/j.jhep.2005.09.010
- Jinpiao Z, Zongze Z, Qiuyue Y, et al. Metformin attenuates sevoflurane-induced neurocognitive impairment through AMPK-ULK1-dependent autophagy in aged mice. Brain Res Bull. 2020;157:18–25. 10.1016/j.brainresbull.2020.01.018
- Ding DF, You N, Wu X-M, et al. Resveratrol attenuates renal hypertrophy in early-stage diabetes by activating AMPK. Am J Nephrol. 2010;31(4):363–374. 10.1159/000300388
- Zhang J, Chiu J, Zhang H, et al. Autophagic cell death induced by resveratrol depends on the Ca(2+)/AMPK/mTOR pathway in A549 cells. Biochem Pharmacol. 2013;86(2):317–328. 10.1016/j.bcp.2013.05.003
- Chen G, Ding X-F, Bouamar H, et al. Everolimus induces G 1 cell cycle arrest through autophagy-mediated protein degradation of cyclin D1 in breast cancer cells. Am J Physiol Cell Physiol. 2019;317(2):C244–C252. 10.1152/ajpcell.00390.2018
- Grimaldi A, Santini D, Zappavigna S, et al. Antagonistic effects of chloroquine on autophagy occurrence potentiate the anticancer effects of everolimus on renal cancer cells. Cancer Biol Ther. 2015;16(4):567–579. 10.1080/15384047.2015.1018494
- Guduru SKR, Arya P. Synthesis and biological evaluation of rapamycin-derived, next generation small molecules. Medchemcomm. 2018;9(1):27–43. 10.1039/C7MD00474E
- Liu N, Tai S, Ding B, et al. Arsenic trioxide synergizes with everolimus (Rad001) to induce cytotoxicity of ovarian cancer cells through increased autophagy and apoptosis. Endocr Relat Cancer. 2012;19(5):711–723. 10.1530/ERC-12-0150
- Deng S, et al. Targeting autophagy using natural compounds for cancer prevention and therapy. Cancer. 2019;125(8):1228–1246. 10.1002/cncr.31978
- Mlala S, Oyedeji AO, Gondwe M, et al. UrsoLic acid and its derivatives as bioactive agents. Molecules. 2019;24(15):2751. 10.3390/molecules24152751
- Wang L, Zhu Z, Han L, et al. A curcumin derivative, WZ35, suppresses hepatocellular cancer cell growth via downregulating YAP-mediated autophagy. Food Funct. 2019;10(6):3748–3757. 10.1039/C8FO02448K
- Nebenfuehr S, Kollmann K, Sexl V. The role of CDK6 in cancer. Int J Cancer. 2020;147(11):2988–2995. 10.1002/ijc.33054
- Goel S, DeCristo MJ, McAllister SS, et al. CDK4/6 inhibition in cancer: beyond cell cycle arrest. Trends Cell Biol. 2018;28(11):911–925. 10.1016/j.tcb.2018.07.002
- Yin Q, Jian Y, Xu M, et al. CDK4/6 regulate lysosome biogenesis through TFEB/TFE3. J Cell Biol. 2020;219(8):e201911036. 10.1083/jcb.201911036
- Iriyama N, et al. The cyclin-dependent kinase 4/6 inhibitor, abemaciclib, exerts dose-dependent cytostatic and cytocidal effects and induces autophagy in multiple myeloma cells.Leuk Lymphoma. 2018;59(6):1439–1450. 10.1080/10428194.2017.1376741
- Tian J, Liu Y, Chen K. Ginkgo biloBa extract in vascular protection: molecular mechanisms and clinical applications. Curr Vasc Pharmacol. 2017;15(6):532–548. 10.2174/1570161115666170713095545
- Sherif IO, Al-Shaalan NH. Hepatoprotective effect of Ginkgo biloba extract against methotrexate-induced hepatotoxicity via targeting STAT3/miRNA-21 axis. Drug Chem Toxicol. 2020;45(4)1–9. 10.1080/01480545.2020.1862859
- Wang R, Shao X, Yang J, et al. Ginkgo biloba extract mechanism inhibits hepatocellular carcinoma through the nuclear factor-κB/p53 signaling pathway. J Environ Pathol Toxicol Oncol. 2020;39(2):179–189. 10.1615/JEnvironPatholToxicolOncol.2020034510
- Hosseinzadeh E, Hassanzadeh A, Marofi F, et al. Flavonoid-Based cancer therapy: an updated review. Anticancer Agents Med Chem. 2020;20(12):1398–1414. 10.2174/1871520620666200423071759
- O’Brien K, Matlin AJ, Lowell AM, et al. The biflavonoid isoginkgetin is a general inhibitor of Pre-mRNA splicing. J Biol Chem. 2008;283(48):33147–33154. 10.1074/jbc.M805556200
- Sivaramakrishnan M, McCarthy KD, Campagne S, et al. Binding to SMN2 pre-mRNA-protein complex elicits specificity for small molecule splicing modifiers. Nat Commun. 2017;8(1):1476. 10.1038/s41467-017-01559-4
- Li M, Li B, Hou Y, et al. Anti-Inflammatory effects of chemical components from Ginkgo biloba L. male flowers on lipopolysaccharide-stimulated RAW264.7 macrophages. Phytother Res. 2019;33(4):989–997. 10.1002/ptr.6292
- Li M, et al. Anticancer effects of five biflavonoids from Ginkgo Biloba L. Male flowers in vitro. Molecules. 2019;24(8):1496. 10.3390/molecules24081496
- Yoon SO, Shin S, Lee H-J, et al. Isoginkgetin inhibits tumor cell invasion by regulating phosphatidylinositol 3-kinase/akt–dependent matrix metalloproteinase-9 expression. Mol Cancer Ther. 2006;5(11):2666–2675. 10.1158/1535-7163.MCT-06-0321
- Tsalikis J, Abdel-Nour M, Farahvash A, et al. Isoginkgetin, a natural biflavonoid proteasome inhibitor, sensitizes cancer cells to apoptosis via disruption of lysosomal homeostasis and impaired protein clearance. Mol Cell Biol. 2019;39(10):e00489–18. 10.1128/MCB.00489-18
- Kimura S, Noda T, Yoshimori T. Dissection of the autophagosome maturation process by a novel reporter protein, tandem fluorescent-tagged LC3. Autophagy. 2007;3(5):452–460. 10.4161/auto.4451
- Zou C, Wang Y, Shen Z. 2-NBDG as a fluorescent indicator for direct glucose uptake measurement. J Biochem Biophys Methods. 2005;64(3):207–215. 10.1016/j.jbbm.2005.08.001
- Zhang Z, Li X, Yang F, et al. DHHC9-Mediated GLUT1 S-palmitoylation promotes glioblastoma glycolysis and tumorigenesis. Nat Commun. 2021;12(1):5872. 10.1038/s41467-021-26180-4
- Jiang P, Ren L, Zhi L, et al. Negative regulation of AMPK signaling by high glucose via E3 ubiquitin ligase MG53. Mol Cell. 2021;81(3):629–637 e5. 10.1016/j.molcel.2020.12.008
- Egan DF, et al. Phosphorylation of ULK1 (hATG1) by AMP-activated protein kinase connects energy sensing to mitophagy. Science. 2011;331(6016):456–461. 10.1126/science.1196371
- Zhang Y, Wang J. Targeting uptake transporters for cancer imaging and treatment. Acta Pharm Sin B. 2020;10(1):79–90. 10.1016/j.apsb.2019.12.005
- Chen H, Gao S, Liu W, et al. RNA N(6)-methyladenosine methyltransferase METTL3 facilitates colorectal cancer by activating the m(6)a-GLUT1-mTORC1 Axis and is a therapeutic target. Gastroenterology. 2021;160(4):1284–1300 e16. 10.1053/j.gastro.2020.11.013
- Martinez Molina D, et al. Monitoring drug target engagement in cells and tissues using the cellular thermal shift assay. Science. 2013;341(6141):84–87. 10.1126/science.1233606
- Jafari R, Almqvist H, Axelsson H, et al. The cellular thermal shift assay for evaluating drug target interactions in cells. Nat Protoc. 2014;9(9):2100–2122. 10.1038/nprot.2014.138
- Huynh K, Partch CL. Analysis of protein stability and ligand interactions by thermal shift assay. Curr Protoc Protein Sci. 2015;79(1):2891–2894. 10.1002/0471140864.ps2809s79
- Sekiguchi M, Kobashigawa Y, Moriguchi H, et al. High-Throughput evaluation method for drug association with pregnane X receptor (PXR) using differential scanning fluorometry. J Biomol Screen. 2013;18(9):1084–1091. 10.1177/1087057113491826
- Bellutti F, Tigan A-S, Nebenfuehr S, et al. CDK6 antagonizes p53-induced responses during tumorigenesis. Cancer Discov. 2018;8(7):884–897. 10.1158/2159-8290.CD-17-0912
- Chou J, Quigley DA, Robinson TM, et al. Transcription-AssociaTed cyclin-dependent kinases as targets and biomarkers for cancer therapy. Cancer Discov. 2020;10(3):351–370. 10.1158/2159-8290.CD-19-0528
- Feng X, Chen Y, Li L, et al. Preparation, evaluation and metabolites study in rats of novel amentoflavone-loaded TPGS/soluplus mixed nanomicelles. Drug Deliv. 2020;27(1):137–150. 10.1080/10717544.2019.1709920
- Egan D, et al. The autophagy initiating kinase ULK1 is regulated via opposing phosphorylation by AMPK and mTOR. Autophagy. 2011;7(6):643–644. 10.4161/auto.7.6.15123
- Kim J, Kundu M, Viollet B, et al. AMPK and mTOR regulate autophagy through direct phosphorylation of Ulk1. Nat Cell Biol. 2011;13(2):132–141. 10.1038/ncb2152
- Freemerman AJ, Johnson AR, Sacks GN, et al. Metabolic reprogramming of macrophages: glucose transporter 1 (GLUT1)-mediated glucose metabolism drives a proinflammatory phenotype. J Biol Chem. 2014;289(11):7884–7896. 10.1074/jbc.M113.522037
- Dai LB, Zhong J-T, Shen L-F, et al. Radiosensitizing effects of curcumin alone or combined with GLUT1 siRNA on laryngeal carcinoma cells through AMPK pathway-induced autophagy. J Cell Mol Med. 2021;25(13):6018–6031. 10.1111/jcmm.16450
- Amann T, Maegdefrau U, Hartmann A, et al. GLUT1 expression is increased in hepatocellular carcinoma and promotes tumorigenesis. Am J Pathol. 2009;174(4):1544–1552. 10.2353/ajpath.2009.080596
- Pliszka M, Szablewski L. Glucose transporters as a target for anticancer therapy. Cancers (Basel). 2021;13(16):4184. 10.3390/cancers13164184
- Amann T, Hellerbrand C. GLUT1 as a therapeutic target in hepatocellular carcinoma. Expert Opin Ther Targets. 2009;13(12):1411–1427. 10.1517/14728220903307509
- Hashiramoto M, Kadowaki T, Clark AE, et al. Site-Directed mutagenesis of GLUT1 in helix 7 residue 282 results in perturbation of exofacial ligand binding. J Biol Chem. 1992;267(25):17502–17507. 10.1016/S0021-9258(19)37070-X
- Patra M, Johnstone TC, Suntharalingam K, et al. A potent glucose-platinum conjugate exploits glucose transporters and preferentially accumulates in cancer cells. Angew Chem Int Ed Engl. 2016;55(7):2550–2554. 10.1002/anie.201510551
- Kasahara T, Kasahara M. Expression of the rat GLUT1 glucose transporter in the yeast Saccharomyces cerevisiae. Biochem J. 1996;315(1):177–182. 10.1042/bj3150177
- Chan DA, Sutphin PD, Nguyen P, et al. Targeting GLUT1 and the Warburg effect in renal cell carcinoma by chemical synthetic lethality. Sci Transl Med. 2011;3(94):94ra70. 10.1126/scitranslmed.3002394
- Di Dedda C, Vignali D, Piemonti L, et al. PharmacoLogical targeting of GLUT1 to control autoreactive T cell responses. Int J Mol Sci. 2019;20(19):4962. 10.3390/ijms20194962
- Siebeneicher H, et al. Identification and optimization of the first highly selective GLUT1 inhibitor BAY-876. ChemMedchem. 2016;11(20):2261–2271. 10.1002/cmdc.201600276
- Kropp EM, Oleson BJ, Broniowska KA, et al. Inhibition of an NAD(+) salvage pathway provides efficient and selective toxicity to human pluripotent stem cells. Stem Cells Transl Med. 2015;4(5):483–493. 10.5966/sctm.2014-0163
- Wu Q, Ba-Alawi W, Deblois G, et al. GLUT1 inhibition blocks growth of RB1-positive triple negative breast cancer. Nat Commun. 2020;11(1):4205. 10.1038/s41467-020-18020-8
- Ma Y, Wang W, Idowu M, et al. Ovarian cancer relies on glucose transporter 1 to fuel glycolysis and growth: anti-tumor activity of BAY-876. Cancers (Basel). 2018;11(1):33. 10.3390/cancers11010033
- De Dominici M, et al. Selective inhibition of Ph-positive ALL cell growth through kinase-dependent and -independent effects by CDK6-specific PROTACs. Blood. 2020;135(18):1560–1573. 10.1182/blood.2019003604
- Eggersmann TK, Degenhardt T, Gluz O, et al. CDK4/6 inhibitors expand the therapeutic options in breast cancer: palbociclib, ribociclib and abemaciclib. BioDrugs. 2019;33(2):125–135. 10.1007/s40259-019-00337-6
- Brand M, Jiang B, Bauer S, et al. Homolog-Selective degradation as a strategy to probe the function of CDK6 in AML. Cell Chem Biol. 2019;26(2):300–306 e9. 10.1016/j.chembiol.2018.11.006
- Zhang L, Riley-Gillis B, Vijay P, et al. Acquired resistance to BET-PROTACs (Proteolysis-Targeting Chimeras) caused by genomic alterations in core components of E3 ligase complexes. Mol Cancer Ther. 2019;18(7):1302–1311. 10.1158/1535-7163.MCT-18-1129
- Yao J, et al. Epigenetic plasticity of enhancers in cancer. Transcription. 2020;11(1):26–36. 10.1080/21541264.2020.1713682
- Yu L, Ji K-Y, Zhang J, et al. Core pluripotency factors promote glycolysis of human embryonic stem cells by activating GLUT1 enhancer. Protein Cell. 2019;10(9):668–680. 10.1007/s13238-019-0637-9
- Bonelli M, Terenziani R, Zoppi S, et al. Dual inhibition of CDK4/6 and PI3K/AKT/mTOR signaling impairs energy metabolism in MPM cancer cells. Int J Mol Sci. 2020;21(14):5165. 10.3390/ijms21145165
- Yang L, Sha H, Davisson RL, et al. Phenformin activates the unfolded protein response in an AMP-activated protein kinase (AMPK)-dependent manner. J Biol Chem. 2013;288(19):13631–13638. 10.1074/jbc.M113.462762
- Saito S, et al. Compound C prevents the unfolded protein response during glucose deprivation through a mechanism independent of AMPK and BMP signaling. PLoS One. 2012;7(9):e45845. 10.1371/journal.pone.0045845
- Fu Y, Hong L, Xu J, et al. Discovery of a small molecule targeting autophagy via ATG4B inhibition and cell death of colorectal cancer cells in vitro and in vivo. Autophagy. 2019;15(2):295–311. 10.1080/15548627.2018.1517073
- Hou PP, Luo L-J, Chen H-Z, et al. Ectosomal PKM2 promotes HCC by inducing macrophage differentiation and remodeling the tumor microenvironment. Mol Cell. 2020;78(6):1192–1206 e10. 10.1016/j.molcel.2020.05.004
- Wang N, Liu H, Liu G, et al. Yeast β-D-glucan exerts antitumour activity in liver cancer through impairing autophagy and lysosomal function, promoting reactive oxygen species production and apoptosis. Redox Biol. 2020;32:101495. 10.1016/j.redox.2020.101495