
ABSTRACT
In the N-degron pathway, N-recognins recognize cognate substrates for degradation via the ubiquitin (Ub)-proteasome system (UPS) or the autophagy-lysosome system (hereafter autophagy). We have recently shown that the autophagy receptor SQSTM1/p62 (sequestosome 1) is an N-recognin that binds the N-terminal arginine (Nt-Arg) as an N-degron to modulate autophagic proteolysis. Here, we show that the N-degron pathway mediates pexophagy, in which damaged peroxisomal fragments are degraded by autophagy under normal and oxidative stress conditions. This degradative process initiates when the Nt-Cys of ACAD10 (acyl-CoA dehydrogenase family, member 10), a receptor in pexophagy, is oxidized into Cys sulfinic (CysO2) or sulfonic acid (CysO3) by ADO (2-aminoethanethiol (cysteamine) dioxygenase). Under oxidative stress, the Nt-Cys of ACAD10 is chemically oxidized by reactive oxygen species (ROS). The oxidized Nt-Cys2 is arginylated by ATE1-encoded R-transferases, generating the RCOX N-degron. RCOX-ACAD10 marks the site of pexophagy via the interaction with PEX5 and binds the ZZ domain of SQSTM1/p62, recruiting LC3+-autophagic membranes. In mice, knockout of either Ate1 responsible for Nt-arginylation or Sqstm1/p62 leads to increased levels of peroxisomes. In the cells from patients with peroxisome biogenesis disorders (PBDs), characterized by peroxisomal loss due to uncontrolled pexophagy, inhibition of either ATE1 or SQSTM1/p62 was sufficient to recover the level of peroxisomes. Our results demonstrate that the Cys-N-degron pathway generates an N-degron that regulates the removal of damaged peroxisomal membranes along with their contents. We suggest that tannic acid, a commercially available drug on the market, has a potential to treat PBDs through its activity to inhibit ATE1 R-transferases.
Abbreviations: ACAA1, acetyl-Coenzyme A acyltransferase 1; ACAD, acyl-Coenzyme A dehydrogenase; ADO, 2-aminoethanethiol (cysteamine) dioxygenase; ATE1, arginyltransferase 1; CDO1, cysteine dioxygenase type 1; ER, endoplasmic reticulum; LIR, LC3-interacting region; MOXD1, monooxygenase, DBH-like 1; NAC, N-acetyl-cysteine; Nt-Arg, N-terminal arginine; Nt-Cys, N-terminal cysteine; PB1, Phox and Bem1p; PBD, peroxisome biogenesis disorder; PCO, plant cysteine oxidase; PDI, protein disulfide isomerase; PTS, peroxisomal targeting signal; R-COX, Nt-Arg-CysOX; RNS, reactive nitrogen species; ROS, reactive oxygen species; SNP, sodium nitroprusside; UBA, ubiquitin-associated; UPS, ubiquitinproteasome system.
Introduction
Proteins and subcellular organelles such as the mitochondrion, endoplasmic reticulum (ER), and peroxisome are subject to constitutive and stress-induced degradation to maintain cellular homeostasis or in response to various stresses [Citation1–3]. These degradative processes are mainly mediated by the UPS and autophagy [Citation3–6]. One central question in the UPS and autophagy is how these substrates are selectively tagged with degradation signals (degrons) only when and where the substrates need to be degraded. The N-degron pathway is a degradative system in which single N-terminal residues of proteins act as a class of degrons, called N-degrons. In mammals, N-degrons include Arg, Lys, His (type 1), Phe, Tyr, Trp, Leu, and Ile (type 2) exposed at the N-termini [Citation7]. In the UPS, these degrons are recognized by the UBR box of N-recognins such as UBR1, UBR2, UBR4, and UBR5, which mediate substrate ubiquitination and proteasomal degradation. Among these, Nt-Arg can be generated through deamidation of Nt-Asn and Nt-Gln by NTAN1 (N-terminal asparagine amidase) or NTAQ1 (N-terminal glutamine amidase 1), respectively [Citation8,Citation9]. The resulting Asp and Glu are conjugated with the amino acid L-Arg by ATE1-encoded R-transferases [Citation10], generating Nt-Arg (R-degron). Substrates of the UPS-coupled N-degron pathway include short-lived regulators and soluble misfolded proteins in the cytosol and nucleus [Citation11].
We have recently shown that the N-degron pathway mediates autophagic proteolysis, in which N-degrons are recognized by the N-recognin SQSTM1/p62 (sequestosome 1) to target substrates to autophagy, leading to lysosomal degradation [Citation12]. Autophagic substrates carrying N-degrons include ER-residing molecular chaperones such as HSPA5/GRP78/BiP, PDI (protein disulfide isomerase), CALR (calreticulin), HSP90B1/GRP94, and DNAJC10/ERdJ5 [Citation12]. These proteins acquire pro-N-degrons when their signal peptides are cotranslationally cleaved off by the signal peptidase complex during translocation into the ER lumen. When cells are challenged by stresses, these ER chaperones may be retrotranslocated into the cytosol, during or after which their pro-N-degron are Nt-arginylated by ATE1 (arginyltransferase 1). The resulting Nt-Arg residues of arginylated proteins bind the ZZ domain of SQSTM1, which induces conformational changes [Citation13], exposing the Phox and Bem1p (PB1) domain that facilitates self-polymerization of SQSTM1 along with cargoes and the LC3-interacting region (LIR) domain that mediates SQSTM1 interaction with LC3 on autophagic membranes [Citation12–14]. This dual mechanism mediates timely clearance of misfolded proteins and their aggregates [Citation12–14].
The role of N-terminal cysteine (Nt-Cys) in proteolysis remains largely unclear. Whereas Nt-Cys is stabilized in S. cerevisiae [Citation15,Citation16], the Nt-Cys in mammalian cells can induce proteolysis through the UPS-coupled N-degron pathway [Citation10]. The substrates include RGS4, RGS5, and RGS16 whose metabolic stability is modulated by oxygen (O2) availability through oxidation and arginylation of the Nt-Cys2 [Citation17]. In normoxia, their Nt-Met is cotranslationally cleaved off by Met aminopeptidases, exposing Nt-Cys2, which in turn is oxidized by ADO (2-aminoethanethiol (cysteamine) dioxygenase) [Citation17,Citation18]. The resulting Cys sulfinic (CysO2) or sulfonic acid (CysO3) is arginylated by ATE1 to generate the Nt-Arg degron that can be recognized by UBR box-containing N-recognins, leading to ubiquitination and proteasomal degradation [Citation17,Citation19]. The oxidation and arginylation of Nt-Cys functions as a dual sensor for acute and chronic hypoxia as well as oxidative stress [Citation20]. It has been also shown that a number of plant proteins carrying the Met-Cys are degraded through oxidation and arginylation of Nt-Cys in a manner depending on oxygen availability [Citation21–23]. The Nt-Cys2 of these substrates are oxidized into CysO2 by either of plant cysteine oxidases (PCOs), HUP29/PCO1 and HUP43/PCO2 [Citation24,Citation25]. The resulting CysO2 is arginylated by ATE1 and ubiquitinated by the N-recognin PROTEOLYSIS6/PRT6 for proteasomal degradation [Citation26,Citation27]. Through a series of N-terminal modifications, these substrates are normally degraded but are metabolically stabilized under low oxygen conditions such as submergence and long-term cold exposure [Citation21–23,Citation28].
The peroxisome is a single lipid bilayer membrane structure that contains more than 50 hydrolytic enzymes [Citation29]. These enzymes participate in various processes such as the formation of ether glycerolipid, bile acid, and cholesterol and the catabolism of purines and amino acids [Citation30]. In addition, oxidases regulate β-oxidation of fatty acid, which produces reactive oxygen species (ROS) and reactive nitrogen species (RNS) [Citation31]. These ROS and RNS are detoxified into water and O2 by antioxidant enzymes such as peroxisomal catalases [Citation31]. In rat liver, peroxisomes produce about 35% of all H2O2 accounting for about 20% of total O2 consumption [Citation32]. In plants, photorespiratory glycolate oxidase of peroxisomes generates about 50-fold higher level of H2O2 than mitochondria [Citation33,Citation34]. Besides peroxisomes, mitochondria generate ROS and RNS from the electron transport chain [Citation35]. While producing and detoxifying ROS and RNS, both peroxisomes and mitochondria are prone to damage, necessitating their timely turnover via autophagy.
The number and size of peroxisomes are diverse depending on cell types and external environments and regulated by their fusion/fission, proliferation, and turnover [Citation36,Citation37]. Peroxisomal turnover involves pexophagy, which is triggered by oxidative stress, starvation, hypoxia, or peroxisomal dysfunction [Citation38–40]. Studies showed that the peroxisomal protein PEX5 functions as a receptor during pexophagy. PEX5 transfers cargo proteins, such as catalases and other major antioxidant enzymes, to peroxisomes by recognizing the peroxisomal targeting signal (PTS) 1, a tripeptide sequence at the C-terminus [Citation41].
During pexophagy, PEX5 is monoubiquitinated by the PEX10-PEX12 E3 complex in mammalian cells [Citation42, [Citation43]], which generates a molecular beacon to recruit the autophagic receptor NBR1 [Citation44]. NBR1 in complex with monoubiquitinated PEX5 recruits LC3 on autophagic membranes to initiate autophagic targeting and lysosomal degradation of peroxisomal membranes and their contents [Citation45]. A recent study also showed that HSPA9 regulates pexophagy through SQSTM1-dependent macroautophagy [Citation46].
The ACAD (acyl-Coenzyme A dehydrogenase) family contains mitochondrial enzymes involved in β-oxidation of fatty acids and catabolism of amino acids [Citation47]. The deficiency of ACADs can cause various metabolic disorders including muscle fatigue, hypoglycemia, and hepatic lipidosis [Citation48,Citation49]. The human genome encodes 11 ACAD members with different substrate specificities [Citation47]. ACAD10 is the longest member containing hydrolase, kinase, and ACAD domains and localized in both mitochondria and peroxisomes [Citation50–52]. The abnormalities in ACAD10 correlates to type 2 diabetes as shown by single nucleotide polymorphism analysis [Citation53] and in ACAD10-deficient mice [Citation50]. Metformin, a drug for type 2 diabetes, enhances the transcription of ACAD10 [Citation54].
Autophagy can be divided into several subtypes including microautophagy, chaperone-mediated autophagy (CMA), and macroautophagy depending on the mechanism by which cargoes are delivered to the lysosome [Citation55]. Among these, targeted degradation of misfolded proteins and their aggregates is mainly mediated by macroautophagy. In macroautophagy, cargoes are segregated by phagophores that mature into autophagosomes, which in turn are fused with lysosomes [Citation56]. Autophagic substrates are collected by specific receptors such as SQSTM1, NBR1, OPTN, CALCOCO2/NDP52, and BNIP3 L/NIX [Citation57], among which SQSTM1 plays a major role. SQSTM1 contains a UBA (ubiquitin-associated) domain that recognizes Ub chains assembled on protein cargoes and the PB1 domain that facilitates self-polymerization to form cargo-SQSTM1 complexes [Citation58]. Cargo-loaded SQSTM1 complexes are delivered to autophagic vacuoles through SQSTM1 interaction with LC3 or GABARAP on autophagic membranes [Citation56]. In addition to protein cargoes, macroautophagy facilitates the removal of various subcellular organelles such as mitochondria, peroxisomes, and the ER [Citation59]. Organellophagy typically initiates when autophagic receptors link polyubiquitinated transmembrane receptors to LC3 on autophagic membranes [Citation3,Citation59,Citation60]. Alternatively, LC3 on autophagic membranes may be directly recruited to LIR domains of membrane-associated receptors [Citation59,Citation60]
In this study, we show that the RCOX motif of ACAD10 acts as a key determinant in pexophagy. In this N-degron pathway, the Nt-Cys2 of ACAD10 is oxidized by ADO or ROS and arginylated to generate the RCOX motif, which in turn facilitates the translocalization of ACAD10 to the sites of pexophagy. The RCOX motif subsequently binds the ZZ domain of SQSTM1 to induce self-oligomerization of SQSTM1 in complex with ACAD10, recruiting autophagic membranes for lysosomal degradation. Pharmaceutical inhibition of the RCOX pathway using tannic acid efficiently restores peroxisomal levels in PBD cells. Our results suggest that the Met-Cys motif carried in approximately 350 human proteins may modulate the degradation of proteins as well as subcellular structures via oxidation and arginylation.
Results
The Nt-Cys2 residue generates an autophagic degron under oxidative stress.
To characterize the role of Nt-Cys2 as a substrate of oxidation and arginylation, we generated antibodies specific to the proteins that carry the Nt-Arg-CysOX (RCOX) motif following oxidation and arginylation. Rabbits were injected with a mixture of 20 RCO3XG tetrapeptides (X = all 20 principal amino acids) to produce RCO3 antibodies (). Dot blot analyses confirmed that RCO3 antibodies detected most of 20 peptides to a varying degree (). To validate the specificity of RCOX antibodies to oxidized Nt-Cys, cells treated with various stressors were subject to immunostaining analyses. The punctate signals were selectively induced under oxidative stresses caused by sodium nitroprusside (SNP, a nitric oxide donor) (), L-arginine (a precursor of nitric oxide) (Figure S1A), hydrogen peroxide (H2O2) (Figure S1B), or clofibrate (Figure S1C). These RCOX signals were markedly suppressed by N-acetyl-cysteine (NAC), a precursor of the antioxidant glutathione ( and S1D), confirming that the Nt-Cys has been oxidized by ROS. Next, we validated the antibody specificity to arginylated Nt-Cys. As expected, these RCOX puncta were inhibited by tannic acid (CAS number 1401-55-4), an astringent drug known to inhibit the enzymatic activity of ATE1 [Citation61] ( and S1E). Similar inhibition was observed with knockdown of ATE1 (Figure S1F and S1 G). These results suggest that under oxidative stress, the N-terminally exposed Cys is oxidized by ROS and arginylated by ATE1, generating RCOX on proteins associated with intracellular structures.
Figure 1. The Nt-Cys generates an autophagic degron via oxidation and arginylation for pexophagy. (A) Generation of antibodies that detect the RCOX motif. (B) Dot blot analysis of RCOX antibodies using 100 ng antigen peptides (red: strong signals, blue: weak signals). (C) HeLa cells treated with 200 µm sodium nitroprusside (SNP) were subjected to immunostaining with anti-RCOX antibody. Scale bar: 10 μm. (D and E) HeLa cells were treated with 400 nM bafilomycin A1 for 16 h and/or 1 mM N-acetyl-cysteine (NAC) (D) or 40 µm tannic acid (TA) (E) for 24 h, followed by immunostaining with anti-RCOX antibody. Scale bar: 10 μm. (F) HeLa cells treated with bafilomycin A1 were analyzed using immunostaining with anti-RCOX antibody. Scale bar: 10 μm. (G) HeLa cells treated with bafilomycin A1 were subjected to co-immunostaining using antibodies to RCOX proteins in comparison with ABCD3 (left panel). Scale bar: 10 μm. The colocalization was quantified using the Pearson’s correlation coefficient (middle panel) or the Manders’ colocalization coefficient (right panel) (n = 4, ***P < 0.001).
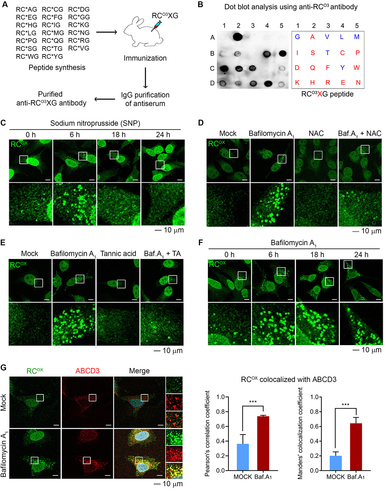
Next, we monitored the metabolic fates of RCOX proteins. Immunostaining analyses showed that RCOX puncta induced by various stressors peaked at 6 h and returned to the basal levels by 18 to 24 h (, S1A, S1B, and S1C). The degradative flux of these RCOX puncta was inhibited by the autophagy blockers such as bafilomycin A1 and hydroxychloroquine but not the proteasome inhibitor MG132 (, S2A and S2B). Thus, oxidation and arginylation of Nt-Cys2 induce autophagic proteolysis under oxidative stress.
The RCOX motif marks the site of pexophagy and acts as a degron essential for pexophagy.
To analyze the subcellular localizations of RCO3-carrying proteins, RCO3 antibodies were used for immunofluorescence analyses, which revealed a specific spatiotemporal distribution in various subcellular structures. Colocalization analyses using specific markers showed that RCOX proteins were associated with various subcellular structures such as peroxisomes (using ABCD3/PMP70 as a marker [Citation62]; ), mitochondria (using MT-CO2; Figure S3A), endosomes (using RAB7 [Citation63]; Figure S3B), lysosomes (using LAMP1 [Citation64]; Figure S3C), endocytic vesicles (using CLTC/clathrin [Citation65]; Figure S3D), and stress granules (using TIA1 [Citation66]; Figure S3E). Among these, the colocalization of RCOX proteins with ABCD3 was most prominent when autophagic flux was blocked using bafilomycin A1 (). These results suggest that RCOX proteins are associated with peroxisomes.
The peroxisome is a single membrane structure that plays diverse roles during oxidative stress and is damaged by ROS, necessitating pexophagy [Citation67]. We therefore tested a possible role for RCOX proteins in pexophagy. In contrast to the known function of Nt-Arg in Ub-dependent proteolysis, these RCOX structures were largely devoid of Ub as detected using FK2 antibody (Figure S4A), indicative of distinct functions in autophagic degradation. Consistently, co-immunostaining analyses under autophagic inhibition showed that 73–78% and 62–67% of RCOX signals colocalized with SQSTM1 and the autophagic membrane-associated protein GABARAP, respectively (Figure S4B and S4C). Approximately 30–35% of RCOX signals were also positive for LC3 under the same conditions (Figure S4D). The dynamic fluctuation of RCOX signals spatiotemporally correlated to those of SQSTM1 as well as GABARAP and LC3 in both normal conditions and under autophagic inhibition. These results suggest that RCOX proteins are recruited to peroxisomes during pexophagy.
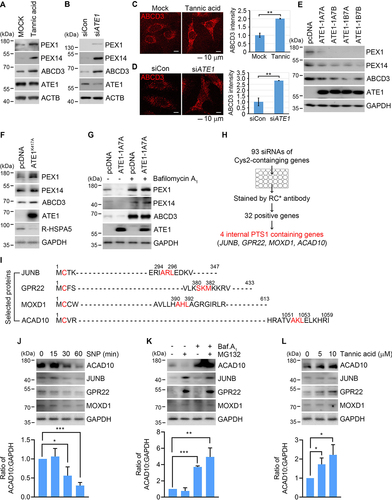
Next, we examined whether the RCOX motif acts as a degron essential for pexophagy. Pharmaceutical inhibition of ATE1 using tannic acid efficiently blocked pexophagy, leading to accumulation of peroxisome-associated proteins such as ABCD3, PEX1, and PEX14 (). Pexophagy was similarly inhibited by ATE1 knockdown using siRNA (). Consistently, immunostaining analyses revealed that peroxisomes were metabolically stabilized by tannic acid or ATE1 siRNA (). The turnover of peroxisomal proteins was accelerated by overexpressing any of R-transferase isoforms (ATE1-1A7A, ATE1-1A7B, ATE1-1B7A, and ATE1-1B7B) (). In contrast, ATE1K417A, a catalytic activity mutant, did not show such an efficacy (). Finally, ATE1-dependent turnover of peroxisomal proteins was blocked by bafilomycin A1 (), indicative of autophagic degradation. These results suggest that the RCOX motif exposed on peroxisome-associated protein(s) is a degradation determinant for pexophagy.
Figure 2. ACAD10 modulates pexophagy through oxidation and arginylation of its Nt-Cys2. (A and B) Immunoblotting of HeLa cells treated with tannic acid (A) or transfected with ATE1 siRNA for 48 h (B). (C and D) Immunostaining of HeLa cells treated with tannic acid (C) or transfected with ATE1 siRNA for 48 h (D). Scale bar: 10 μm. Quantification of ABCD3 intensity (n = 30, **P < 0.01). (E) HeLa cells overexpressing either of mouse ATE1 isoforms, ATE1-1A7A, ATE1-1A7B ATE1-1B7A, or ATE1-1B7B for 48 h were analyzed using immunoblotting. (F and G) Immunoblotting analyses of HeLa cells transiently expressing ATE1K417A mutant (F) or ATE1-1A7A for 48 h in the presence of bafilomycin A1 (G). (H) Schematic diagram of screening 350 Met-Cys proteins. Cells were transfected with 93 different siRNAs targeting Nt-Cys2 proteins, followed by immunostaining with RCOX antibody and confocal microscopy. (I) Sequences of JUNB, GPR22, MOXD1, and ACAD10. (J-L) Immunoblotting analyses of cells treated with SNP for indicated time (J), 20 μM MG132 and/or bafilomycin A1 for 6 h (K), or tannic acid for 24 h (L). Quantification of ACAD10 intensity (n = 4, *P < 0.05; **P < 0.01; ***P < 0.001).
ACAD10 is a substrate of oxidation and arginylation at the Nt-Cys2.
To identify the RCOX substrate responsible for pexophagy, we screened the Met-Cys proteome. Bioinformatics analysis showed that approximately 1% of human proteins exposes Cys2 at the N-termini, totaling approximately 350 proteins including splicing variant forms. These 350 Met-Cys proteins were narrowed down to 93 based on functional relevance to peroxisomal processes. RNA interference assays with 93 siRNAs showed that RCOX puncta on peroxisomes were downregulated in response to knockdown of 32 Met-Cys genes (). We next searched for PTS1 near or at the very C-termini. Among 32 proteins, four contained PTS1 near the C-termini region: JUNB, GPR22 (G protein-coupled receptor 22), MOXD1 (monooxygenase DBH like 1), and ACAD10 (). Immunoblotting analyses showed that the metabolic half-life of the corresponding 4 proteins was shortened when cells were exposed to oxidative stresses in a time-dependent manner (). However, JUNB, GPR22, and MOXD1 were metabolically stabilized by proteasomal inhibition, whereas only ACAD10 degradation was selectively inhibited by autophagic inhibition using bafilomycin A1 (), indicative of its autophagic flux. Finally, the autophagic turnover of ACAD10 was efficiently blocked when Nt-arginylation was inhibited by using tannic acid (). These results show that the Nt-Cys2 of ACAD10 is oxidized under oxidative stress and subsequently Nt-arginylated, generating the RCOX degron leading to autophagic degradation.
To elucidate the molecular mechanism underlying the oxidation of ACAD10 Nt-Cys2, we screened the enzymes known to be involved in Cys oxidation. RNA interference assays showed that the level and metabolic stability of ACAD10 were specifically increased by knockdown of ADO (). In contrast, no such activity was observed with CDO1 (cysteine dioxygenase type 1) that can also catalyze the oxidation of thiol group of l-cysteine to l-cysteine sulfinic acid using oxygen [Citation68] (). These results suggest that ADO is an O2 sensor that modulates pexophagy in normal conditions through Nt-Cys oxidation of ACAD10.
Figure 3. The Nt-Cys2 of ACAD10 is a sensor of O2 and ROS in pexophagy. (A) Immunoblotting analyses of HeLa cells transfected with ADO and CDO1 siRNA for 48 h. Quantification of band intensities (n = 4, *P < 0.05). (B) HeLa cells transfected with ADO siRNA in the presence of cycloheximide (CHX) were analyzed using immunoblotting. Shown below is the relative quantification of band intensities (n = 3, *P < 0.05). (C) HeLa cells transfected with ADO or CDO1 siRNA in the presence of SNP were subject to immunoblotting. Shown below is the relative quantification of band intensities (n = 3, **P < 0.01). (D) Immunoblotting analyses of HeLa cells treated with SNP for 1 h in the presence of NAC. (E and F) Immunoblotting analyses of cells treated with SNP for 1 h in the presence of tannic acid (E) or ATE1 siRNA (F). (G) Immunoblotting analyses of HeLa cells overexpressing either of mouse ATE1 isoforms, ATE1-1A7A, ATE1-1A7B, ATE1-1B7A, or ATE1-1B7B for 48 h in the presence of bafilomycin A1. (H and I) Immunoblotting analyses of HeLa cells treated with SNP for 1 h in the presence of bafilomycin A1 (H) or MG132 (I). (J-L) HeLa cells were transfected with wild type (WT) or ACAD10C2V in the presence of cycloheximide (CHX) (J), tannic acid (K), or bafilomycin A1 (L), followed by immunoblotting analyses. (M-O) Immunoblotting analyses of peroxisomal proteins in cells overexpressing ACAD10 for 48 h in the absence (M and N) or presence of 40 μM tannic acid (O) or 400 nM bafilomycin A1 (P). (Q) HeLa cells were transfected with two different siRNAs targeting ACAD10, followed by immunoblotting. (R and S) HeLa cells were transfected with pCMV14 empty vector, wild type ACAD10, or ACAD10C2V for 48 h in the presence of 40 μM tannic acid (R) or 400 nM bafilomycin A1 (S), followed by immunoblotting.
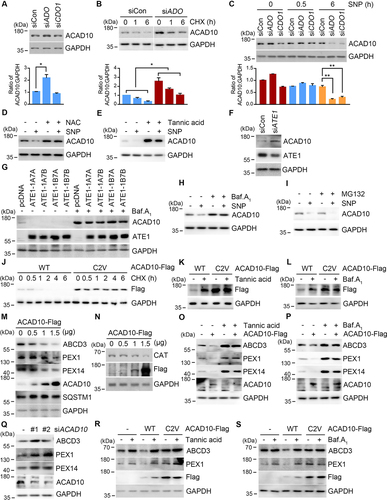
During these experiments, we also observed that ACAD10 was metabolically destabilized under oxidative stresses (). We therefore tested whether Nt-Cys of ACAD10 under oxidative stress is chemically oxidized by ROS to generate RCOX. Indeed, ACAD10 degradation was facilitated when cells were treated with oxidative stressors in an ADO-independent manner () and inhibited when ROS were chelated (). These results suggest that Nt-oxidation of ACAD10 is normally regulated by ADO but, under oxidative stress, can be chemically oxidized, functioning as a sensor of both O2 and ROS.
Next, we tested whether the Nt-Cys2 of ACAD10 is arginylated by ATE1. The normally short-lived ACAD10 became metabolically stabilized by chemical inhibition of R-transferases by using tannic acid (). Consistently, the turnover of ACAD10 was impaired by ATE1 knockdown () and accelerated by ATE1 overexpression (). To further characterize the role of RCOX as an N-degron, we monitored the proteolytic flux of ACAD10 via the UPS or autophagy. The proteolysis of ACAD10 was efficiently inhibited by bafilomycin A1 () but not by MG132 (), demonstrating that the RCOX is a critical N-degron for lysosomal degradation of ACAD10. To confirm that the oxidation and arginylation occurs on the Nt-Cys2 of ACAD10, cycloheximide degradation assays were employed using ACAD10C2V mutant. The half-life extended from 45 min to 6 h when Cys2 was changed to valine (Val) (). Moreover, the metabolically stabilized ACAD10C2V was no longer sensitive the inhibition of arginylation or autophagic flux (). Thus, ACAD10 is a substrate of oxidation and arginylation at the Nt-Cys2 residue and degraded by the autophagic N-degron pathway.
The R-COX of ACAD10 is a critical N-degron that mediates pexophagy.
We also determined the physiological importance of ACAD10 and its RCOX motif in pexophagy. Immunoblotting analyses showed that ACAD10 overexpression facilitated the degradation of peroxisomal membrane proteins, such as ABCD3, PEX1, and PEX14 () as well as the peroxisomal matrix protein CAT (catalase; ) in a dose-dependent manner. Whereas ACAD10-induced degradation of peroxisomal proteins was blocked by tannic acid or bafilomycin A1 (), ACAD10 knockdown disrupted the turnover of peroxisomal proteins (), suggesting that ACAD10 induces arginylation-dependent autophagic degradation of peroxisomes. In contrast to wild type ACAD10, however, ACAD10C2V overexpression did not affect the turnover of peroxisomal proteins and showed no differences in response to tannic acid or bafilomycin A1 treatment (). Thus, the RCOX of ACAD10 is a critical N-degron that modulates the turnover of damaged peroxisomal membranes and their contents in normal and stressed conditions via macroautophagy.
To test whether oxidative stress induces the dimerization of ACAD10 via its Cys residues, we performed non-reducing SDS-PAGE of HeLa cells to separate the dimers and oligomers from monomers of ACAD10 and its C2V mutant. Immunoblotting analyses revealed both monomers and 240-kDa dimers, with no significant differences in their relative levels for both wild type and ACAD10C2V (Figure S5A). Similar results were observed when the cells were treated with H2O2 (Figure S5A). These results suggest that the dimerization of ACAD10 may not be essential for pexophagy. Finally, we also examined whether ACAD10-induced pexophagy is secondary to PEX1 downregulation. ACAD10 overexpression not only normally induced pexophagy in PEX1 knockdown HeLa cells (Figure S5B) but also did not alter the interaction of PEX1 with PEX5 as assessed by co-immunoprecipitation (Figure S5C). These results suggest that ACAD10 induces pexophagy largely independent of the PEX1-PEX5 axis.
The RCOX induces the re-localization of ACAD10 to peroxisomes during oxidative stress.
To characterize the subcellular localization of ACAD10 under oxidative stress, we employed fractionation and immunofluorescence assays. In normal conditions, ACAD10 was detected in both cytosol and peroxisome, but was mainly found in the cytosol (). When cells were treated with SNP, a significant portion of ACAD10 relocated to peroxisomes, resulting in autophagic degradation, as evidenced by metabolic stabilization in response to autophagic inhibition (). Immunofluorescence analyses of cells treated with SNP revealed ACAD10 as punctate signals on peroxisomes, which colocalized with ABCD3 in the peroxisome membrane as well as ACAA1 (acetyl-coenzyme A acyltransferase 1) in the peroxisome matrix (). The colocalization of ACAD10 with these peroxisomal markers markedly increased under oxidative stress ().
Figure 4. The RCOX of ACAD10 is required for peroxisomal targeting during oxidative stress. (A) HeLa cells treated with SNP and bafilomycin A1 for 6 h were fractionated. Whole cell lysates (WCL) in comparison with membrane (including mitochondria), cytosolic, and peroxisomal fractions were analyzed by immunoblotting (upper panel). Quantification was shown (lower panel) (n = 3, **P < 0.01). (B) Immunostaining analyses of HeLa cells treated with SNP-treated HeLa cells (upper) or ACAA1 plasmid transfected cells (lower), followed by immunostaining. Scale bar: 10 μm. (C) Quantification of colocalization data shown in (B) using the Pearson’s correlation coefficient (left panel) or the Manders’ colocalization coefficient (right panel) (n = 40, **P < 0.01). (D) HeLa cells transfected with wild type ACAD10, ACAD10K1052 G or ACAD10C2V were fractionated. Whole cell lysates in comparison with membrane (including mitochondria), cytosolic, and peroxisomal fractions were analyzed by immunoblotting (upper panel). Quantification was shown (lower panel) (n = 3, **P < 0.01; ***P < 0.001). (E) Immunostaining analyses of HeLa cells were transfected with wild type or C2V mutant of ACAD10 in the presence of SNP. Scale bar: 10 μm. (F) Quantification of colocalization data shown in (E) using the Pearson’s correlation coefficient (left panel) or the Manders’ colocalization coefficient (right panel) (n = 40, **P < 0.01, ns, not significant).
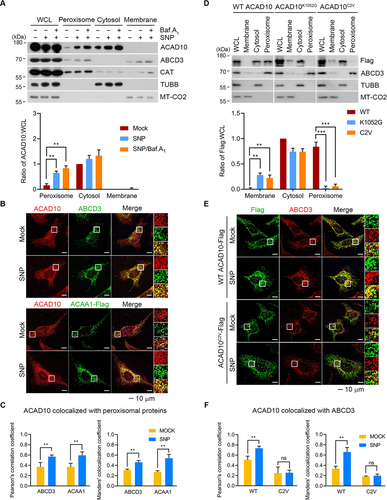
To determine the role of RCOX in peroxisomal targeting of ACAD10, we employed fractionation analyses using ACAD10C2V mutant in comparison with its PTS mutant containing a K1052G mutation in the PTS1 consensus sequence AKL (1051–1053). Wild type ACAD10 mainly localized in the cytosolic and peroxisomal fractions but not in membrane fractions (). However, ACAD10 mutant lacking the Nt-Cys2 or its PTS failed to be targeted to peroxisomes but, instead, was retrieved from the cytosolic and membrane fractions (). These results suggest that peroxisomal targeting of ACAD10 requires not only its PTS1 but also RCOX motif. Similarly, in contrast to wild type ACAD10, ACAD10C2V failed to relocate to peroxisomes in response to SNP treatment (). These results suggest that the RCOX is a determinant in the peroxisomal localization of ACAD10 under oxidative stress.
PEX5 binds the PTS1 motif and recruits PTS1-containing cytosolic proteins to the peroxisome membrane [Citation69]. To determine whether PEX5 binds the RCOX of ACAD10, we performed X-peptide affinity-isolation analyses using a set of 11-residue N-terminal ACAD10 fragments carrying different N-terminal residues (X = RCO3, CO3, C, and V). PEX5 preferentially bound RCO3 peptide as compared with CO3, C and V peptides (), suggesting that RCO3 is a binding motif for PEX5. Co-immunoprecipitation analyses confirmed the interaction of PEX5 with endogenous ACAD10, which was significantly enhanced by SNP and hydroxychloroquine treatment (). In addition, either the mutation of PTS1 domain in ACAD10 (K1052 G) or the deletion of TPR domain in PEX5 significantly weakened the binding of ACAD10 with PEX5 (). Together with the aforementioned results (), these data collectively suggest that both RCOX and PTS1 domain of ACAD10 synergistically contribute to peroxisomal targeting of ACAD10.
Figure 5. ACAD10 binds PEX5 via RCOX and PTS1 domain during oxidative stress. (A) HEK293 cell lysates were subjected to affinity-isolation assay with X-ACAD10 peptides (X = RCO3, CO3, C, or V), followed by immunoblotting (upper panel). Quantification of interacting PEX5 that binds to peptides for pull down (lower panel) (n = 3, **P < 0.01). (B) HeLa cells treated with 200 μM SNP or 10 μM hydroxychloroquine for 48 h, followed by immunoprecipitation with IgG or PEX5 antibody. Quantification was shown (lower panel) (n = 3, *P < 0.05; ***P < 0.001). (C) HeLa cells were transfected with wild type or K1052G mutant of ACAD10 for 48 h in the presence of SNP and hydroxychloroquine, followed by immunoprecipitation with Flag antibody. Quantification was shown (lower panel) (n = 3, **P < 0.01) (D) Schematic diagram of wild type (WT) PEX5 in comparison with TPR domain deleted mutant (∆TPR) PEX5. (E) HeLa cells were transfected with wild type or ∆TPR mutant of PEX5 for 48 h followed by immunoprecipitation with Flag or MYC antibody (left panel). Quantification of ACAD10-Flag bound to PEX5 (n = 3, *P < 0.05). (F) Peroxisomal fractions were subjected to protease protection assay, followed by immunoblotting with ACAD10 antibody detecting amino acid 1–85 at the N-terminal region. (G and H) Peroxisomal fractions of HeLa cells transfected with ACAD10-Flag for 48 h were subjected to protease protection assay (G) or alkaline sodium carbonate extraction assay (H), followed by immunoblotting. T, total; S, supernatant; P, pellet.
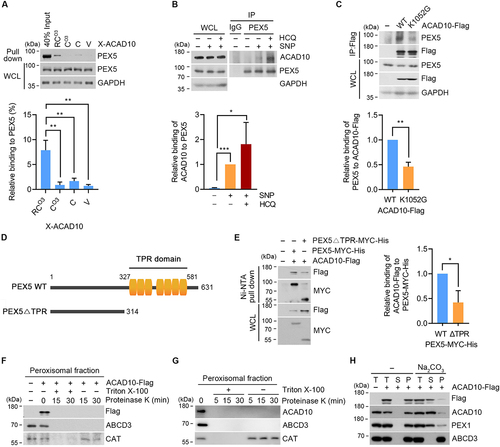
To determine whether ACAD10 is localized to the exterior (membrane) or interior (matrix) of peroxisome, peroxisomes were fractionated and subjected to proteinase K digestion in the presence or absence of the membrane-disrupting detergent Triton X-100. In contrast to CAT that localizes within the peroxisomal lumen, the N-terminal region of ACAD10 (as determined by antibody specific to residues 1–85) and the peroxisomal membrane protein ABCD3 were digested by proteinase K in both the presence and absence of Triton X-100 (). The C-terminal region of ACAD10-Flag was similarly digested by proteinase K when visualized using anti-Flag antibody (). These results indicate that both the N- and C-termini of ACAD10 are recruited to the cytosolic surface of peroxisomes under oxidative stress. To further characterize the topology of ACAD10 on the peroxisome, the peroxisomal fraction obtained under oxidative stress was subject to alkaline carbonate extraction, which disrupts protein-protein interactions without affecting the membrane integrity [Citation70–73]. ACAD10 was mostly retrieved in a supernatant fraction containing soluble and membrane-associated proteins rather than a pellet fraction containing integral membrane proteins (). We conclude that under oxidative stress, ACAD10 is peripherally recruited to the cytosolic surface of peroxisomes.
Upon binding to the RCOX of ACAD10, SQSTM1 is activated as a receptor for pexophagy
Our previous study has identified SQSTM1 as an N-recognin of the N-degron pathway, which can bind the Nt-Arg of arginylated HSPA5/BiP, an ER-residing molecular chaperone [Citation12]. We therefore speculated that SQSTM1 may be a receptor that binds the RCOX degron of ACAD10 during pexophagy. Indeed, degradation of ACAD10 as well as other peroxisomal proteins was inhibited by SQSTM1 knockdown (, S6A, and S6B). When examined using immunostaining analyses, ACAD10 and SQSTM1 normally showed a moderate degree of colocalization, which was drastically increased in cells treated with SNP and bafilomycin A1 (). Such a colocalization pattern was not observed with ACAD10C2V (). Moreover, co-immunoprecipitation assays showed that endogenous ACAD10 interacted with SQSTM1 and that their interaction was enhanced by H2O2 as well as bafilomycin A1 treatment, which was further confirmed using reverse immunoprecipitation (). To validate the importance of Nt-Cys2 in the interaction with SQSTM1, we also performed immunoprecipitation using overexpressed ACAD10 in comparison with ACAD10C2V. The interaction of recombinant ACAD10 with SQSTM1 was significantly increased by H2O2 and bafilomycin A1 treatment (). Strikingly, the mutation of the Nt-Cys2 to Val abolished the interaction between ACAD10 and SQSTM1, which was also confirmed using reverse immunoprecipitation (). These results suggest that the RCOX of ACAD10 on peroxisomal membranes recruits cytosolic SQSTM1 to the sites of pexophagy.
Figure 6. The Nt-Cys2 of ACAD10 is an activating ligand to SQSTM1 that induces SQSTM1 oligomerization to mark the sites of pexophagy. (A and B) HeLa cells were transfected with SQSTM1/p62 siRNA (A), and wild type or C2V mutant of ACAD10 in the presence of SNP and bafilomycin A1 (B). The cells were subjected to immunoblotting or immunostaining (left panel). Scale bar: 10 μm. Colocalization shown in immunostaining was quantified using the Pearson’s correlation coefficient (middle panel) or the Manders’ colocalization coefficient (right panel) (n = 40, **P < 0.01, ns, not significant). (C) HeLa cells were treated with H2O2 and bafilomycin A1, followed by immunoprecipitation with ACAD10 or SQSTM1 antibody. ACAD indicates ACAD10. (D) HeLa cells were transfected with wild type or C2V mutant of ACAD10 in the presence of H2O2 and bafilomycin A1, followed by immunoprecipitation with Flag or SQSTM1 antibody. CV indicates C2V mutant of ACAD10. (E) HEK293 cell lysates were subjected to an affinity-isolation assay with X-ACAD10 peptides (X = RCO3, CO3, C, or V), followed by immunoblotting (upper panel). Quantification of an affinity-isolation assay (lower panel) (n = 3, ***P < 0.001; ****P < 0.0001). (F-H) Hela cells expressing wild type, serially deleted SQSTM1 mutants (D1, D2, D3, or D4) (F), ZZ domain deletion mutant (△ZZ) (G), or ZZ domain point mutant (H) were subjected to affinity-isolation assay with RCO3-ACAD10 peptides, followed by immunoblotting. The asterisk indicates a band with unknown nature. (I) HEK293 cell lysates transiently expressing SQSTM1 were subjected to affinity-isolation assays with X-ACAD10 peptides (X = RCO3, CO3, C, or V), followed by immunoblotting.
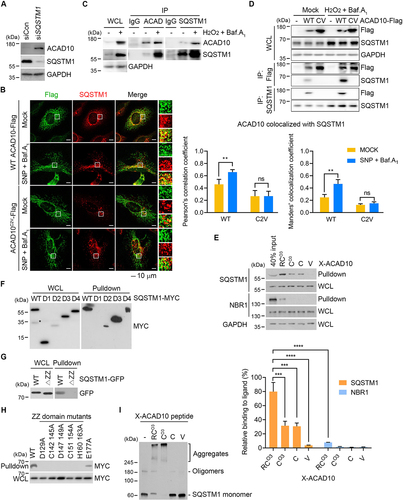
To understand the mode of action underlying ACAD10 interaction with SQSTM1, we performed X-peptide affinity-isolation analyses (X= RCO3, CO3, C, and V). SQSTM1 preferentially bound RCO3 peptide as compared with CO3 and C peptides (). In sharp contrast, V peptide showed no significant affinity to SQSTM1 (), suggesting that RCO3 is an N-degron for SQSTM1. Next, we determined the domain of SQSTM1 that interacts with the RCO3 degron using a series of truncation mutants (Figure S6C and S6D). Mapping analyses showed that the RCOX bound ZZ domain, which spans a 36-residue region (128–163) (). To determine whether RCO3 binds SQSTM1 ZZ domain through N-end rule interactions, we performed analogous assays using mutants carrying point mutations in the ZZ domain (D129A, C142A C145A, D147A D149A, C151A C154A, and H160A H163A) and outside of the ZZ domain (E177A) (Figure S6E). Indeed, the binding was abolished by mutations of any residues of the SQSTM1 ZZ domain that participate in recognition of N-degron substrates (). These results demonstrate that the RCO3 of ACAD10 activates SQSTM1 to trigger pexophagy.
To understand the molecular mechanism by which RCOX-bound SQSTM1 recruits autophagic membranes, we speculated that RCOX may induce self-oligomerization of SQSTM1 by using oligomerization assays. Cell extracts were mixed with a 12-mer RCO3-ACAD10 peptide, followed by non-reducing SDS-PAGE to separate covalent conjugates of SQSTM1 from monomeric SQSTM1. In contrast to V-ACAD10 peptide, RCO3-ACAD10 peptide specifically induced self-oligomerization of SQSTM1, leading to its high molecular species (). These results collectively suggest that the N-degron interaction of RCOX with SQSTM1 ZZ domain induces oligomerization of SQSTM1 in complex with ACAD10 to mark the sites of pexophagy.
Pexophagy is impaired in ate1−/− and sqstm1/p62−/− mice.
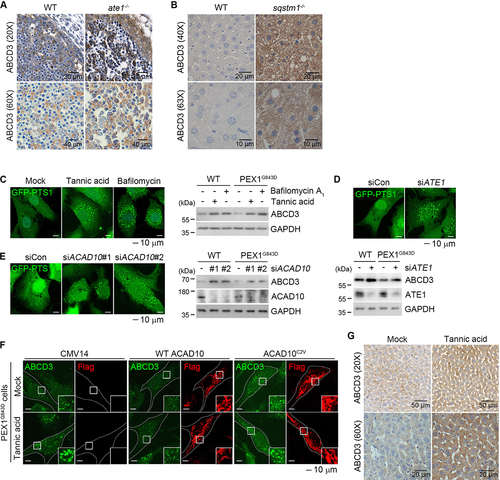
To validate the results from cultured cells, we characterized peroxisome biogenesis in ate1-/- mouse embryos [Citation10]. Wild type and ate1-/- embryos at embryonic day 12.5 (E12.5) were harvested and subjected to immunostaining analyses of peroxisomes. The levels of peroxisomes were indeed significantly increased in ate1-/- embryos relative to wild type embryos (). Given that SQSTM1 is an N-recognin in pexophagy, we also characterized pexophagy in sqstm1/p62-/- mice. Immunostaining analyses of tissues clearly demonstrated increased levels of peroxisomes in liver tissues (). These results demonstrate that the ATE1-SQSTM1 circuit modulates the turnover of peroxisomes in mouse tissues.
Figure 7. Inhibition of the RCOX-ACAD10-SQSTM1 pathway increase the levels of peroxisomes in PBDs cells and mice. (A and B) Immunohistochemical staining of E12.5 embryos from wild type or ate1−/− mice (A), and the livers of wild type or sqstm1/p62−/− mice (B). Scale bars: 20 µm and 40 µm (left panel) and 20 µm and 10 µm (right panel). (C) Wild type and PEX1G843D PBD fibroblast cells expressing GFP-PTS1 were treated with tannic acid or bafilomycin A1 for 24 h and analyzed using confocal microscopy (left) or immunoblotting (right). Scale bar: 10 μm. (D and E) Cells were transfected with siRNAs targeting ATE1 (D) or ACAD10 (E), followed by immunostaining or immunoblotting. Scale bar: 10 μm. (F) PBD cells were transfected with the pCMV14 vector in comparison with wild type or C2V mutant of ACAD10 in the presence of tannic acid, followed by immunostaining. Scale bar: 10 μm. (G) C57BL/6 mice were injected with 2 mg/kg tannic acid 3 times per week for one month. Livers were harvested and analyzed using immunohistochemical staining. Scale bars: 50 µm and 20 µm.
Identification of tannic acid as a drug candidate to treat Zellweger syndrome and other PBDs.
PBDs, including Zellweger syndrome, are autosomal recessive diseases that involve uncontrolled pexophagy, leading to peroxisomal loss [Citation45,Citation74]. The majority of PBD patients do not survive 10 years of age. We therefore asked whether chemical or genetic inhibition of the RCOX pathway would restore excessive pexophagy back to a normal level by using PBD patient-derived fibroblasts that express PEX1G843D. PEX1G843D mutation is a prominent cause of PBDs and leads to peroxisomal loss by increased pexophagy [Citation45,Citation74]. As expected, immunostaining analyses of the peroxisome marker GFP-PTS1 revealed diffusive signals throughout the cytosol, indicative of peroxisome loss (, left). Notably, when cells were treated with tannic acid, GFP-PTS1 was redistributed to peroxisomes, suggesting that peroxisome biogenesis has been restored (, left). Peroxisome biogenesis was similarly restored by bafilomycin A1 treatment (, left). Immunoblotting analyses also detected higher levels of peroxisomal proteins upon tannic acid treatment on not only normal human fibroblasts but also PBD patient-derived fibroblasts (, right). A similar recovery of peroxisomes was obtained with knockdown of ATE1 (). As an alternative way to recover peroxisome biogenesis, we also modulated ACAD10 in PBDs cells. Indeed, knockdown of ACAD10 increased the levels of peroxisomes in PBD cells (). In contrast, overexpressing ACAD10 accelerated the turnover of peroxisomes in PBD cells, which was also observed when PBD cells were treated with tannic acid (). However, the mutation of its Cys2 to Val abolished such a pexophagy-inducing efficacy in ACAD10 ().
To determine whether pexophagy can be pharmaceutically modulated in animal models, we injected tannic acid into 12-week-old male mice (n = 3) at 2 mg/kg. Mice were injected 3 times per week for 1 month. Immunostaining analyses of various tissues such as livers showed markedly increased levels of peroxisomes (). These results identify the RCOX pathway as a therapeutic target in PBDs.
Pexophagy is dually modulated by both RCOX–SQSTM1 and mono-Ub-NBR1 pathways on PEX5.
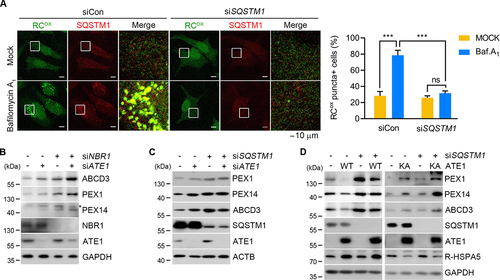
Studies have shown that pexophagy initiates when the autophagic receptor NBR1 recognizes mono-Ub on PEX5 to recruit LC3 on autophagic membranes [Citation75]. We therefore examined the relative functionality of SQSTM1 and NBR1 in pexophagy. In contrast to reported studies [Citation44], both immunoblotting and immunostaining analyses showed that pexophagy was significantly inhibited by either NBR1 or SQSTM1 knockdown (Figure S6A, S6B, S7A, and S7B). Notably, RCOX punctate signals on peroxisomes were abolished by SQSTM1 siRNA () but not by NBR1 siRNA (Figure S7C and S7D), indicating a functional role of SQSTM1 as a key cargo receptor for RCOX. Next, we determined the functional interaction of RCOX with SQSTM1 and NBR1 by using double knockdown analyses. Stronger inhibitory effects were observed with double knockdown of ATE1 and NBR1 () relative to ATE1 and SQSTM1 (), suggesting that the RCOX degron works with SQSTM1 but not NBR1. Consistently, accelerated pexophagy in ATE1-overexpressing cells was efficiently counteracted by SQSTM1 siRNA (, left), in contrast to ATE1K417A mutant (, right). Finally, RCOX-peptide pulled down SQSTM1 approximately 10-times more in the amount as compared with NBR1 (). There results demonstrate that the RCOX-SQSTM1 pathway plays a crucial role in pexophagy.
Figure 8. The ACAD10-SQSTM1 circuit is a predominant pathway underlying pexophagy. (A) HeLa cells were transfected with Sqstm1/p62 siRNA in the presence of bafilomycin A1, followed by immunostaining with anti-RCOX and anti-SQSTM1 antibodies (left panel). Scale bar: 10 μm. Quantification of colocalization data was shown (right panel) (n = 30, ***P < 0.001). (B and C) Immunoblotting analyses of HeLa cells treated with siRNA targeting ATE1 and/or NBR1 (B) or ATE1 and/or Sqstm1/p62 (C). The asterisk indicates a band with unknown nature. (D) HeLa cells were transfected with ATE1-1A7A or its K417A mutant (KA) in combination with Sqstm1/p62 siRNA, followed by immunoblotting.
Discussion
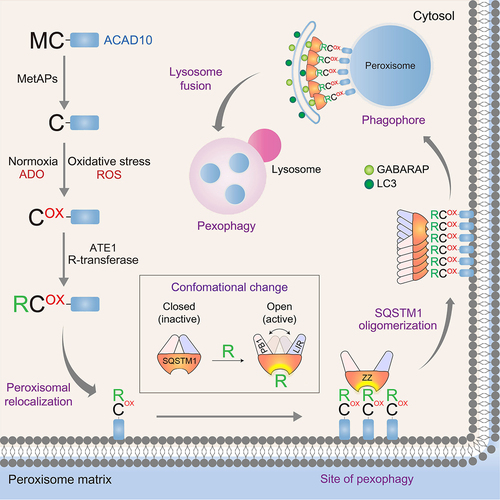
The N-degron pathway is a proteolytic system in which single N-terminal residues function as N-degrons for protein degradation. Previous studies showed that Nt-Asp and Nt-Glu can be arginylated to generate the N-degron Arg which, in turn, is recognized by UBR box-containing E3 ligases for ubiquitination and proteasomal degradation. In this study, we show that the Nt-Cys of ACAD10 acts as a sensor of O2 as well as oxidative stress through chemical or enzymatic oxidation by ROS or ADO associated with enzymatic arginylation by ATE1. In pexophagy, the RCOX degron facilitates ACAD10 translocation to damaged peroxisomes and subsequently binds the ZZ domain of SQSTM1. The binding of RCOX induces self-oligomerization of SQSTM1 in complex with ACAD10, which marks the sites of pexophagy to recruit GABARAP or LC3 on autophagic membranes for lysosomal degradation (). We demonstrate that tannic acid targeting the RCOX degron may be exploited as a therapeutic drug for PBD patients associated with peroxisomal loss. Our results suggest that the Met-Cys motif found in approximately 350 human proteins may generate the RCOX degron in diverse biological processes.
Figure 9. Modulation of pexophagy by N-terminal oxidation and arginylation of ACAD10. The Nt-Cys2 of ACAD10 in the cytosol is oxidized by ADO and, under oxidative stress, ROS as well. The oxidized Nt-Cys2 is arginylated by ATE1 R-transferases, generating the RCOX N-degron. The RCOX induces the translocalization of ACAD10 to the cytosolic surface of peroxisomes, on which the RCOX recruits SQSTM1, leading to lysosomal degradation. Unlike mitochondrial ACAD10, cytosolic ACAD10 exposes Nt-Cys and increases peroxisomal targeting by oxidative stress. Thus, the Nt-Cys2 of ACAD10 not only represents a sensor of both O2 and oxidative stress in pexophagy but also acts as a receptor that recruits autophagy membranes to the sites of pexophagy.
The functions of the Nt-Cys residues remain controversial and largely unclear, except for a number of isolated studies [Citation17,Citation22,Citation23,Citation28,Citation76]. Previous studies showed that model substrates carrying Nt-Cys are stabilized in S. cerevisiae but are destabilized in mammalian cells. Our earlier studies have identified a set of RGS proteins carrying the Met-Cys as an oxygen sensing system [Citation10,Citation17]. In normoxia, their Nt-Met residue is cleaved off, exposing Nt-Cys2, which in turn is oxidized by ADO [Citation18], followed by arginylation. The resulting RCOX degron is recognized by UBR boxes of UBR1 and UBR2, which facilitate ubiquitination and proteasomal degradation. The O2-dependent degradation suppresses these RGS proteins at the basal levels. Under hypoxia, however, the substrates are metabolically stabilized and migrate to the plasma membrane to downregulate G-protein signaling. Studies by others also showed that a number of plant proteins carrying the Met-Cys sequence are also degraded through oxidation and arginylation of the Nt-Cys2, such as ERFVIIs, VRN2, and ZPR2 [Citation22,Citation23,Citation28]. In normoxia, their Nt-Cys2 is oxidized by PCOs and arginylated by ATE1 [Citation24,Citation25]. The resulting RCOX degron is recognized by the N-recognin PRT6 for ubiquitination and proteasomal degradation [Citation26,Citation27]. However, the substrates are metabolically stabilized under low oxygen conditions such as submergence to induce hypoxia-responsive genes, leading to reprogramming from normoxia to hypoxic metabolism [Citation21–23,Citation28]. In this study, we show that the RCOX degron of ACAD10 plays a pleiotropic role in pexophagy as: (1) a sensor of both O2 and oxidative stress, (2) a peroxisomal trans-localization signal for ACAD10, (3) an activating ligand to the ZZ domain of SQSTM1, and (4) an autophagic cis-degron for ACAD10 and a trans-degron for peroxisomes and associated proteins (). It is notable that the RCOX degron generated through enzymatic oxidation by ADO or PCOs induces “acute” degradation via the UPS, whereas the same degron generated through chemical oxidation by ROS modulates non-proteolytic processes, leading to “chronic” degradation via autophagy [Citation20].
Macroautophagy mediates sequestration and degradation of various cytoplasmic constituents such as misfolded proteins and organelles [Citation59,Citation77]. Compared with mitophagy, as exemplified by the PINK1-PRKN/parkin pathway, the mechanisms underlying other types of organellophagy, such as pexophagy, remain largely murky. The peroxisome is the major organelle that produces and detoxifies ROS, only second to the mitochondrion, necessitating timely removal of damaged membranes and their contents. Studies have identified PEX5 to be a receptor in pexophagy, whose mono-ubiquitination at Cys11 brings the autophagic receptor NBR1, which in turn recruits LC3 on autophagic membranes [Citation78,Citation79]. Intriguingly, PEX5 is a cargo receptor for peroxisomal proteins and forms a complex with PEX14 to form pores, through which cargoes are transported into the peroxisome [Citation41,Citation79]. In addition, the activity of PEX5 is impaired under oxidative stress when its residues are oxidized, including Cys11 whose oxidation counteracts mono-ubiquitination and, thus, NBR1-dependent pexophagy [Citation78–80]. It has been controversial how PEX5 mediates pexophagy, given its pleiotropic functions and oxidation-sensitivity. Another enigma was the finding that the KD value of mono-ubiquitinated PEX5 with its autophagy receptor is 540 μM, raising a question on how receptor selectivity is achieved with such low affinity [Citation81]. Intriguingly, our earlier work showed that SQSTM1 binds Nt-Arg with KD of 44 nM [Citation14], suggesting that the N-end rule recognition of SQSTM1 ZZ domain to the RCOX degron may underlie the selectivity of pexophagy, to a more degree under oxidative stress. Our results collectively suggest that pexophagy is dually modulated by both the RCOX-SQSTM1 pathway and the mono-Ub-NBR1 pathway, among which the former plays a major role in oxidative stress.
The current study suggests the non-canonical interaction of PEX5 with ACAD10 containing internal PTS1 domain. Several previous studies reported a functional role of the internal PTS1 in peroxisomal targeting [Citation67,Citation82,Citation83]. For example, the PEX5 binds and localizes ATM (ataxia telangiectasia mutated) to the peroxisome through an internal PTS1 [Citation67]. Consistently, our results show that the RCOX as well as PTS1 domain of ACAD10 play a synergistic role for interaction with PEX5 and peroxisomal targeting of ACAD10. Consistent is proteinase K digestion assays that demonstrated the localization of ACAD10 to the cytosolic surface of peroxisome. The exact topology of ACAD10 on or in the peroxisome remains to be further investigated.
PBDs are metabolic disorders associated with the loss of peroxisomes, resulting from mutations in the PEX1, PEX6, PEX10, PEX12, and PEX26 genes [Citation84]. Among these, PEX1, PEX6, and PEX26 form the AAA+ ATPase complex that mediates the import of peroxisomal cargoes carrying PTS1 and PTS2 and the export of PEX5 from the peroxisome membrane to the cytosol [Citation45,Citation85]. Thus, this complex suppresses pexophagy by exporting mono-ubiquitinated PEX5. Consistently, the mutations in PEX1, PEX6, or PEX26 account for approximately 65% to 85% of PBD patients whose symptoms include excessive pexophagy [Citation45,Citation86]. For example, the interaction of PEX1G843D mutant with PEX6 is reduced to less than 70% as compared with wild type PEX1, resulting in excessive pexophagy and loss of peroxisome [Citation45,Citation87]. Extensive studies focused on pharmaceutical means to slow down pexophagy in PBDs [Citation45,Citation88]. In this study, we demonstrate that pexophagy can be efficiently inhibited by using tannic acid, resulting in significantly increased levels of peroxisomes ( and 7). Importantly, tannic acid efficiently restored peroxisomal homeostasis in PBD-derived cells to normal levels and in mice as well (). Tannic acid, a natural product from plant, is used to treat various symptoms such as cold sores, fever blisters, diaper rash, sore throat, diarrhea, and coughs. We suggest that reagents targeting the RCOX N-degron pathway such as tannic acid may be exploited to treat patients with PBDs including Zellweger syndrome, whose life spans are currently limited to less than 1 year without any drugs available.
Materials and methods
Plasmids, antibodies, and other reagents
The plasmid encoding mouse ATE1-1A7A, ATE1-1A7B, ATE1-1B7A, ATE1-1B7B was cloned into pcDNA3.1 (Thermofisher scientific, V80020) as described [Citation19]. Human ACAD10 was kindly provided by Dr. Jerry Vockley (University of Pittsburgh, USA) and subcloned into p3×Flag-CMV-14 vector (Sigma-Aldrich, E7908). ACAD10C2V mutant was generated by site-directed mutagenesis using the following primers (forward: ATT AAG CTT ATG GTT GTC AGG AGC TGT, reverse: ACA GCT CCT GAC AAC CAT AAG CTT AAT). ACAD10K1052G mutant was generated by site-directed mutagenesis using the following primers (forward: GCC ACG GTG GCC GGG CTA GAG CTG AAG CAC, reverse: GTG CTT CAG CTC TAG CCC GGC CAC CGT GGC). The plasmid containing full-length HsPEX5 (Clone ID: hMU000767) was purchased from Korea Human Gene Bank and subcloned into the p3×Flag-CMV-14 vector (Sigma-Aldrich, E7908), and then 3×Flag was replaced with MYC-His. Then PEX5∆TPR domain deletion mutant was created using following primers: forward: 5’-ATG GCA ATG WCGG GAG CTG GTG GAG-3’, reverse: 5’-ATC ACG CAA GGG GTT CTC CTC CTC AAA CTG-3’, which includes flanking BspE1 and NotI restriction enzyme sites, respectively. SQSTM1 and deletion mutants were cloned into pcDNA3.1-MYC (Thermo Fisher Scientific, V80020) or pEGFP-C1 (Clontech, 6084–1) vector as previously described [Citation12,Citation14]. Rabbit polyclonal antibodies specific to the RCO3 was raised using the peptide sequence RCO3XG (× = 20 kinds of amino acids) through a custom service in AbFrontier Inc. (Seoul, South Korea). Rabbit polyclonal ATE1 antibody and N-terminally arginylated form of HSPA5/BiP, R-HSPA5/BiP, were generated in AbFrontier Inc. as described [Citation12]. The following antibodies were also used: FK2 (Enzo, BML-PW8810), GAPDH (glyceraldehyde-3-phosphate dehydrogenase) (Abcam, ab9485), SQSTM1/p62 (Abcam, ab56416), ABCD3/PMP70 (Sigma-Aldrich, SAB4200181), PEX1 (Santa Cruz Biotechnology, sc-21957; LSBio, LS-C762901), PEX5 (LSBio, LS-C667597) PEX14 (Sigma-Aldrich, SAB4502176), ATE1 (Santa Cruz Biotechnology, sc -271219), NBR1 (Santa Cruz Biotechnology, sc-130380), LC3 (Sigma-Aldrich, L7543), GABARAP (Santa Cruz Biotechnology, sc-377300), ACTB/actin (Sigma-Aldrich, A1978), TUBB (Santa Cruz Biotechnology, sc-55529), MYC (Santa Cruz Biotechnology, sc-40), MOXD1 (Abcam, ab153807), GPR22 (Santa Cruz Biotechnology, sc-104287), JUNB (Santa Cruz Biotechnology, sc-8051), ACAD10 (Novus, NBP2–49511), MT-CO2 (Abcam, ab3298), RAB7 (Sigma-Aldrich, R8779), LAMP1 (Abcam, ab25630), CLTC/clathrin (Abcam, ab2731), or TIA1 (Abcam, ab170156).
Cell culture and transfection
HeLa cells were purchased from American Type Culture Collection (CCL-2). Wild type human fibroblast and patient-derived PBD cell lines (PEX1G843D-PTS1) were kindly provided by Dr. Peter K. Kim (University of Toronto, Canada). HeLa and PEX1G843D PBD patient cells were cultured in rich media (DMEM [Gibco, 11995–065], antibiotic, and 10% fetal bovine serum) in a standard 5% CO2 incubator. Cells were transfected with plasmids using Lipo2000 (Invitrogen, 11668027) according to the manufacturer’s instruction.
RNA interference analysis
Predesigned small interfering RNAs (siRNAs; 100 pmol) were transfected into HeLa cells using RNAiMAX reagent (Invitrogen, 13778075) according to the manufacturer’s instructions. The siRNAs used in this study are as follows: siATE1 (Bioneer, South Korea, 11101–1), siACAD10 (Bioneer, 80724–1, 80724–2), siSQSTM1/p62 (Bioneer, 8878–1), siNBR1 (Bioneer, 4077–1) siJUNB (Bioneer, 3726–1), siGPR22 (Bioneer, 2845–1), siMOXD1 (Bioneer, 26002–1), siADO (Bioneer, 84890–1), siCDO1 (Bioneer, 1036–1), and siPEX5 (Bioneer, 5830–1).
Western blot analysis
Cell lysates were prepared by sonication or boiling in RIPA buffer (50 mM Tris-HCl, pH 7.5, 150 mM NaCl, 1% Nonidet P-40, 1% sodium deoxycholate, and 0.1% SDS; Biosesang, RC2002). Cell lysates were subjected to SDS-PAGE, and transferred onto polyvinylidene difluoride (PVDF; Millipore, IPVH000) membrane. Blots were blocked with 3% (w:v) nonfat dry milk in PBS-T solution (20 mM Tris-HCl, pH 7.5, 150 mM NaCl, and 0.05% [v:v] Tween 20 [Bio-Rad, 170–6531]). After twice washing with PBS-T, blots were incubated with primary antibodies, followed by horseradish peroxidase-conjugated secondary antibodies, anti-rabbit IgG-HRP (Cell Signaling Technology, 7074) and anti-mouse IgG-HRP (Cell Signaling Technology, 7076). Immunoreactive bands were detected using ECL reagents (Thermo Fisher Scientific, 32106). To investigate the dimer formation of ACAD10, cell lysates were prepared using oligomerization assay buffer (50 mM HEPES, pH 7.4, 0.15 M KCl, 0.1% Nonidet P-40, 10% glycerol, protease inhibitors [Sigma-Aldrich, P8340]). Samples were then mixed with a non-reducing loading buffer containing 4% lithium dodecyl sulfate (Thermo Fisher Scientific, 84788), and subjected to the separation on 3% stacking and 10% separating SDS-PAGE.
Immunocytochemistry
Cells were cultured on poly-L-lysine-coated slides in 6-well plates. Cells were fixed in 4% paraformaldehyde in PBS for 10 min at room temperature. After washing twice with PBS, the cells were treated with blocking solution (5% FBS in PBS) for 1 h, followed by incubation with primary and, subsequently, secondary antibodies. For the confocal images, the LSM700 upright laser scanning confocal microscope (Zeiss) equipped with C-Apochromat 40x/NA1.2 water immersion lens was used. Images from the confocal microscope were analyzed using Zen Lite 2012 (Black edition, Version 1.1.13064.302, Zeiss). Colocalization analyses were performed using JACoP plugin from ImageJ with either the Manders’ colocalization coefficient or the Pearson’s correlation coefficient [Citation89,Citation90]. The thresholded Mander’s M values corresponding to each signal and the Pearson’s pixel-by-pixel covariance in the signal levels of two images were used to quantify the colocalization.
Cellular fractionation
Membrane, cytosol, peroxisome fractions were isolated using the Peroxisome Isolation Kit (Sigma-Aldrich, PEROX1) as the manufacturer’s instructions. Briefly, cells were homogenized in 1X peroxisome extraction buffer and incubated on ice for 1 h. The lysates were centrifuged at 500 × g for 10 min at 4°C for eliminating unbroken cells. The supernatant was centrifuged at 1,000 × g for 10 min at 4°C, again the supernatant was centrifuged at 2,000 g for 10 min at 4°C, and collected and further centrifuged at 20,000 × g for 1 h. The pellet was resuspended in 1X peroxisome extraction buffer, which was the crude peroxisomal fraction.
Protease protection assay
The crude peroxisomal fraction was isolated using the Peroxisome Isolation Kit as described above. The peroxisomal fraction was incubated with proteinase K (1 µg/ml; Roche, 3115836001) and/or 1% Triton X-100 (Sigma-Aldrich, 93443) on ice for 5, 15, and 30 min. The lysates were analyzed by western blot analysis.
Sodium carbonate extraction assay
The crude peroxisomal fraction isolated from HeLa cells was resuspended in 1X peroxisome extraction buffer, with or without 100 mM Na2CO3 (Sigma-Aldrich, S7795), pH 11.5 [Citation70,Citation73]. Half the volume of each solution were saved for a “Total” fraction. Then the remainders were incubated on ice for 30 min and ultracentrifuged at 100,000 × g for 1 h to generate “Supernatant” and “Pellet” fractions [Citation70,Citation73]. Each fraction was analyzed by western blot as indicated above.
X-Peptide affinity-isolation assay
In the X-peptide affinity-isolation assay, a set of 11-12-mer X-ACAD10 peptides (X-VRSCFQSPRK-biotin) bearing N-terminal RCO3, CO3, C, V residues were C-terminally biotin-conjugated by Dr. Jeong Kyu Bang (protein synthesizer, Korea Basic Science Institute). These peptides were cross-linked through C-terminal biotin to streptavidin agarose resin (Thermo Fisher Scientific, 20359; 0.4 mg peptide per ml settled resin). The X-peptide-biotin and streptavidin agarose resin were diluted in five volumes of PBS and incubated overnight at 4°C. The beads were centrifuged at 1,000 × g for 3 min and washed three times in three volumes of PBS. To prepare protein extracts, cells were lysed by freezing and thawing at least twenty times in Hypotonic Buffer (10 mM KCl, 1.5 mM MgCl2, and 10 mM HEPES, pH 7.9) with protease inhibitor mix, centrifuged at 13,000 × g at 4°C for 20 min, and supernatant were quantified using BCA assay (Thermo Fisher Scientific, 23225). Protein extracts (100 µg) were mixed in Binding buffer (0.05% Tween 20 [Sigma-Aldrich, P1379], 10% glycerol, 0.2 M KCl, and 20 mM HEPES, pH 7.9) with X-peptide-streptavidin-conjugated beads. The mixtures were incubated at 4°C for 2 h with gentle rotation. The beads were pelleted by centrifugation at 1,000 × g for 30 s and washed five times with 1 ml of Binding buffer. The beads were re-suspended in SDS sample buffer and heated at 95°C for 10 min. Samples were performed by SDS-PAGE and immunoblotting.
In vitro SQSTM1 aggregation assay
Cells were transiently transfected with a plasmid encoding SQSTM1/p62-Flag for 24 h. Cells were lysed by freezing and thawing at least twenty times in Lysis Buffer (50 mM HEPES, pH 7.4, 0.15 M KCl, 0.1% NP-40 Alternative [Millipore, 492016], 10% glycerol, and a mixture of protease and phosphatase inhibitor [Sigma-Aldrich, PPC1010]). Cell lysates were centrifuged at 13,000 × g at 4°C for 20 min and supernatant were quantified using BCA assay. Protein extracts (5 µg) were incubated in Lysis buffer with tetra or penta-peptide in the presence of 100 μM bestatin (Sigma-Aldrich, B8385) and 4-nitrophenyl phosphate di(tris) salt (Sigma-Aldrich, N3254) at room temperature for 2 h. Samples were mixed with LDS sample buffer and heated at 95°C for 10 min. Samples were performed by SDS-PAGE using 4–12% gradient gel and immunoblotting.
Mice
The C57BL/6 male mice aged 12 weeks were purchased from Samtako Bio Korea (Gyeonggi-do, Korea). Mice were maintained under specific pathogen-free conditions. All mice experiments and maintenance were done in accordance with guidelines set forth by the Institutional Animal Care and Use Committee, Seoul National University (SNU-191218-2-5) and the Korean Food and Drug Administration. To determine whether pexophagy can be pharmaceutically modulated in vivo, mice were intraperitoneally injected with tannic acid (2 mg/kg) 3 times per week for 1 month. ate1−/- and sqstm1/p62-/- mice were acquired as described previously [Citation10]. Wild type and ate1-/- embryos were harvested at embryonic day 12.5 (E12.5). The presence of a vaginal plug after overnight mating was regarded as E0.5. Liver was extracted from wild type and sqstm1/p62-/- male mice at 10 weeks age.
Immunohistochemistry
The liver tissues were fixed in 10% formaldehyde and embedded in paraffin. The paraffin-embedded liver tissues were cut into 5 μm thick sections, deparaffinized in xylene, and rehydrated with aqueous alcohol solutions. After the slide performed antigen retrieval in citrate buffer solution (0.01 M, pH 6.0) for 15 min at temperature of 100°C, it was immersed in fresh made 0.3% hydrogen peroxide for 15 min. The slides were incubated with blocking serum and primary antibody overnight. The slides were washed with PBS 3 times on a shaker for 5 min, added to horseradish peroxidase-conjugated secondary antibody solution, and incubated at room temperature for 1 h. The slides were washed with PBS 3 times, added to a fresh 3, 3’ diaminobenzidine staining buffer, and stopped the staining with water. The slides were incubated sequentially into 75% alcohol, 85% alcohol, anhydrous ethanol, anhydrous ethanol, and xylene for 10 min. After slides were dry, we used neutral gum to seal the slides. We used microscope to scan and validate the results.
Statistical analysis
Data are presented as mean ± SD of at least three independent experiments. Statistical significance was calculated using ANOVA or two-tailed student’s t-test performed with Prism 7 software (Graph Pad). Differences with P < 0.05 were considered statistically significant (***P < 0.001; **P < 0.01; *P < 0.05).
Supplemental Material
Download MS Word (3.1 MB)Acknowledgments
We thank Dr. Jerry Vockley (University of Pittsburgh, USA) for providing the plasmids expressing human ACAD10 and Dr. Peter. K. Kim (University of Toronto, Canada) for providing the human wild type fibroblast and PBD patient-derived PEX1-G843D GFP-PTS1 fibroblast cell lines. We also thank J.S. Choi who participated in the internship program for their experimental supports. This work was supported by National Research Foundation of Korea (NRF) grants funded by the Korean government, the Ministry of Science and ICT [MSIT] (NRF-2020R1A5A1019023 to M.J.L. and Y.T.K., NRF-2017R1A6A3A11032084 to S.M.S., NRF-2019R1F1A1057934 to J.W.P., and NRF-2021R1A2C2008023 to M.J.L.) and the Ministry of Education (NRF-2021R1A2B5B03002614 to Y.T.K.).
Disclosure statement
No potential conflict of interest was reported by the author(s).
Supplementary material
Supplemental data for this article can be accessed online at https://doi.org/10.1080/15548627.2022.2126617.
Additional information
Funding
References
- Chen B, Retzlaff M, Roos T, et al. Cellular strategies of protein quality control. Cold Spring Harb Perspect Biol. 2011 Aug 1; 3(8)a004374. DOI:10.1101/cshperspect.a004374
- Farré J-C, Mahalingam SS, Proietto M, et al. Peroxisome biogenesis, membrane contact sites, and quality control. EMBO Rep. 2019 Jan 01;20(1):e46864.
- Anding AL, Baehrecke EH. Cleaning house: selective autophagy of organelles. Dev Cell. 2017 Apr 10;41(1):10–22. DOI:10.1016/j.devcel.2017.02.016.
- Ji CH, Kim HY, Heo AJ, et al. The N-degron pathway mediates ER-phagy. Mol Cell. 2019 Sep 5; 75;(5)1058–1072 e9. DOI:10.1016/j.molcel.2019.06.028
- Ma K, Chen G, Li W, et al. Mitophagy, mitochondrial homeostasis, and cell fate. Front Cell Dev Biol. 2020 Jun 23;8:467. DOI:10.3389/fcell.2020.00467
- Pohl C, Dikic I. Cellular quality control by the ubiquitin-proteasome system and autophagy. Science. 2019 Nov 15;366(6467):818–822. DOI:10.1126/science.aax3769.
- Sriram SM, Kim BY, Kwon YT. The N-end rule pathway: emerging functions and molecular principles of substrate recognition. Nat Rev Mol Cell Biol. 2011 Oct 21;12(11):735–747. DOI:10.1038/nrm3217.
- Grigoryev S, Stewart AE, Kwon YT, et al. A mouse amidase specific for N-terminal asparagine. The gene, the enzyme, and their function in the N-end rule pathway. J Biol Chem. 1996 Nov 8; 271;(45)28521–28532. DOI:10.1074/jbc.271.45.28521
- Wang H, Piatkov KI, Brower CS, et al. Glutamine-Specific N-terminal amidase, a component of the N-end rule pathway. Mol Cell. 2009 Jun 26;34(6):686–695.
- Kwon YT, Kashina AS, Davydov IV, et al. An essential role of N-terminal arginylation in cardiovascular development. Science. 2002 Jul 5; 297;(5578)96–99. DOI:10.1126/science.1069531
- Varshavsky A. The N-end rule pathway and regulation by proteolysis. Protein Sci. 2011 Aug;20(8):1298–1345.
- Cha-Molstad H, Sung KS, Hwang J, et al. Amino-Terminal arginylation targets endoplasmic reticulum chaperone BiP for autophagy through p62 binding. Nat Cell Biol. 2015Jul;177:917–929
- Zhang Y, Mun SR, Linares JF, et al. ZZ-Dependent regulation of p62/sqstm1 in autophagy. Nat Commun. 2018 Oct 22; 9;(1)4373. DOI:10.1038/s41467-018-06878-8
- Cha-Molstad H, Yu JE, Feng Z, et al. P62/sqstm1/sequestosome-1 is an N-recognin of the N-end rule pathway which modulates autophagosome biogenesis. Nat Commun. 2017 Jul 24; 8;(1)102. DOI:10.1038/s41467-017-00085-7
- Tobias JW, Shrader TE, Rocap G, et al. The N-end rule in bacteria. Science. 1991 Nov 29;254(5036):1374–1377.
- Astuti RI, Nasuno R, Takagi H. Nitric oxide signaling in yeast. Appl Microbiol Biotechnol. 2016 Nov;100(22):9483–9497.
- Lee MJ, Tasaki T, Moroi K, et al. RGS4 and RGS5 are in vivo substrates of the N-end rule pathway. Proc Natl Acad Sci U S A. 2005 Oct 18; 102;(42)15030–15035. DOI:10.1073/pnas.0507533102
- Masson N, Keeley TP, Giuntoli B, et al. Conserved N-terminal cysteine dioxygenases transduce responses to hypoxia in animals and plants. Science. 2019 Jul 5;365(6448):65–69.
- Hu RG, Brower CS, Wang H, et al. Arginyltransferase, its specificity, putative substrates, bidirectional promoter, and splicing-derived isoforms. J Biol Chem. 2006 Oct 27; 281;(43)32559–32573. DOI:10.1074/jbc.M604355200
- Heo AJ, Kim SB, Ji CH, et al. The N-terminal cysteine is a dual sensor of oxygen and oxidative stress. Proc Nat Acad Sci. 2021;118(50):e2107993118. DOI:10.1073/pnas.2107993118
- Gibbs DJ, Tedds HM, Labandera AM, et al. Oxygen-Dependent proteolysis regulates the stability of angiosperm polycomb repressive complex 2 subunit VERNALIZATION 2. Nat Commun. 2018 Dec 21; 9;(1)5438. DOI:10.1038/s41467-018-07875-7
- Licausi F, Kosmacz M, Weits DA, et al. Oxygen sensing in plants is mediated by an N-end rule pathway for protein destabilization. Nature. 2011 Oct 23; 479;(7373)419–422. DOI:10.1038/nature10536
- Weits DA, Kunkowska AB, Kamps NCW, et al. An apical hypoxic niche sets the pace of shoot meristem activity. Nature. 2019 May;569(7758):714–717. DOI:10.1038/s41586-019-1203-6
- Weits DA, Giuntoli B, Kosmacz M, et al. Plant cysteine oxidases control the oxygen-dependent branch of the N-end-rule pathway. Nat Commun. 2014 Mar 6;5:3425. DOI:10.1038/ncomms4425
- White MD, Klecker M, Hopkinson RJ, et al. Plant cysteine oxidases are dioxygenases that directly enable arginyl transferase-catalysed arginylation of N-end rule targets. Nat Commun. 2017 Mar 23;8:14690. DOI:10.1038/ncomms14690
- Garzon M, Eifler K, Faust A, et al. Prt6/at5g02310 encodes an Arabidopsis ubiquitin ligase of the N-end rule pathway with arginine specificity and is not the CER3 locus. FEBS Lett. 2007 Jul 10; 581;(17)3189–3196. DOI:10.1016/j.febslet.2007.06.005
- Holdsworth MJ, Vicente J, Sharma G, et al. The plant N-degron pathways of ubiquitin-mediated proteolysis. J Integr Plant Biol. 2019 Oct 22;62 :70–89. DOI:10.1111/jipb.12882
- Vicente J, Mendiondo GM, Movahedi M, et al. The Cys-Arg/N-end rule pathway is a general sensor of abiotic stress in flowering plants. Curr Biol. 2017 Oct 23; 27;(20)3183–3190 e4. DOI:10.1016/j.cub.2017.09.006
- Wiese S, Gronemeyer T, Ofman R, et al. Proteomics characterization of mouse kidney peroxisomes by tandem mass spectrometry and protein correlation profiling. Mol Cell Proteomics. 2007 Dec;6(12):2045–2057. DOI:10.1074/mcp.M700169-MCP200
- Jo DS, Cho DH. Peroxisomal dysfunction in neurodegenerative diseases. Arch Pharm Res. 2019 Feb 9;42:393–406. DOI:10.1007/s12272-019-01131-2.
- Fransen M, Nordgren M, Wang B, et al. Role of peroxisomes in ROS/RNS-metabolism: implications for human disease. Biochim Biophys Acta (BBA) - Mol Basis Dis. 2012 Sep 01; 1822;(9)1363–1373. DOI:10.1016/j.bbadis.2011.12.001
- Fransen M, Nordgren M, Wang B, et al. Role of peroxisomes in ROS/RNS-metabolism: implications for human disease. Biochim Biophys Acta. 2012 Sep;1822(9):1363–1373. DOI:10.1016/j.bbadis.2011.12.001
- Foyer CH, Bloom AJ, Queval G, et al. Photorespiratory metabolism: genes, mutants, energetics, and redox signaling. Annu Rev Plant Biol. 2009;60:455–484.
- Del Rio LA, Lopez-Huertas E. ROS generation in peroxisomes and its role in cell signaling. Plant Cell Physiol. 2016 Jul;57(7):1364–1376.
- Holmstrom KM, Finkel T. Cellular mechanisms and physiological consequences of redox-dependent signalling. Nat Rev Mol Cell Biol. 2014 Jun;15(6):411–421.
- Farre JC, Mahalingam SS, Proietto M, et al. Peroxisome biogenesis, membrane contact sites, and quality control. EMBO Rep. 2019 Jan;20(1). DOI:10.15252/embr.201846864
- Yan M, Rayapuram N, Subramani S. The control of peroxisome number and size during division and proliferation. Curr Opin Cell Biol. 2005 Aug;17(4):376–383.
- Eberhart T, Kovacs WJ. Pexophagy in yeast and mammals: an update on mysteries. Histochem Cell Biol. 2018 Nov;150(5):473–488.
- Daskalaki I, Gkikas I, Tavernarakis N. Hypoxia and selective autophagy in cancer development and therapy. Front Cell Dev Biol. 2018;6:104.
- Park NY, Jo DS, Park SJ, et al. Depletion of HNRNPA1 induces peroxisomal autophagy by regulating PEX1 expression. Biochem Biophys Res Commun. 2021 March 19;545:69–74. DOI:10.1016/j.bbrc.2021.01.083
- Neuhaus A, Kooshapur H, Wolf J, et al. A novel Pex14 protein-interacting site of human Pex5 is critical for matrix protein import into peroxisomes. J Biol Chem. 2014 Jan 3; 289;(1)437–448. DOI:10.1074/jbc.M113.499707
- Okumoto K, Noda H, Fujiki Y. Distinct modes of ubiquitination of peroxisome-targeting signal type 1 (PTS1) receptor Pex5p regulate PTS1 protein import. J Biol Chem. 2014 May 16;289(20):14089–14108. DOI:10.1074/jbc.M113.527937.
- Platta HW, Magraoui FE, Bäumer BE, et al. Pex2 and Pex12 function as protein-ubiquitin ligases in peroxisomal protein import. Mol Cell Biol. 2009;29(20):5505–5516. DOI:10.1128/MCB.00388-09
- Deosaran E, Larsen KB, Hua R, et al. NBR1 acts as an autophagy receptor for peroxisomes. J Cell Sci. 2013 Feb 15; 126;(Pt 4)939–952. DOI:10.1242/jcs.114819
- Law KB, Bronte-Tinkew D, Di Pietro E, et al. The peroxisomal AAA ATPase complex prevents pexophagy and development of peroxisome biogenesis disorders. Autophagy. 2017 May 4; 13;(5)868–884. DOI:10.1080/15548627.2017.1291470
- Jo DS, Park SJ, Kim AK, et al. Loss of HSPA9 induces peroxisomal degradation by increasing pexophagy. Autophagy. 2020 Nov;16(11):1989–2003. DOI:10.1080/15548627.2020.1712812
- Swigonova Z, Mohsen AW, Vockley J. Acyl-CoA dehydrogenases: dynamic history of protein family evolution. J Mol Evol. 2009 Aug;69(2):176–193.
- Gregersen N, Andresen BS, Corydon MJ, et al. Mutation analysis in mitochondrial fatty acid oxidation defects: exemplified by acyl-CoA dehydrogenase deficiencies, with special focus on genotype-phenotype relationship. Hum Mutat. 2001 Sep;18(3):169–189. DOI:10.1002/humu.1174
- Bhala A, Willi SM, Rinaldo P, et al. Clinical and biochemical characterization of short-chain acyl-coenzyme a dehydrogenase deficiency. J Pediatr. 1995 Jun;126(6):910–915. DOI:10.1016/S0022-3476(95)70207-5
- Bloom K, Mohsen AW, Karunanidhi A, et al. Investigating the link of ACAD10 deficiency to type 2 diabetes mellitus. J Inherit Metab Dis. 2018 Jan;41(1):49–57. DOI:10.1007/s10545-017-0013-y
- He M, Pei Z, Mohsen AW, et al. Identification and characterization of new long chain acyl-CoA dehydrogenases. Mol Genet Metab. 2011 Apr;102(4):418–429. DOI:10.1016/j.ymgme.2010.12.005
- Bloom K, Karunanidhi A, Tobita K, et al. ACAD10 protein expression and neurobehavioral assessment of Acad10-deficient mice. PLoS One. 2020;15(12):e0242445. DOI:10.1371/journal.pone.0242445
- Bian L, Hanson RL, Muller YL, et al. Variants in ACAD10 are associated with type 2 diabetes, insulin resistance and lipid oxidation in Pima Indians. Diabetologia. 2010 Jul;53(7):1349–1353. DOI:10.1007/s00125-010-1695-y
- Wu L, Zhou B, Oshiro-Rapley N, et al. An ancient, unified mechanism for metformin growth inhibition in C. elegans and Cancer. Cell. 2016 Dec 15; 167;(7)1705–1718 e13. DOI:10.1016/j.cell.2016.11.055
- Kaushik S, Cuervo AM. Chaperone-Mediated autophagy: a unique way to enter the lysosome world. Trends Cell Biol. 2012 Aug;22(8):407–417.
- Mizushima N, Komatsu M. Autophagy: renovation of cells and tissues. Cell. 2011 Nov 11;147(4):728–741. DOI:10.1016/j.cell.2011.10.026.
- Deng Z, Purtell K, Lachance V, et al. Autophagy receptors and neurodegenerative diseases. Trends Cell Biol. 2017 Jul;27(7):491–504. DOI:10.1016/j.tcb.2017.01.001
- Lamark T, Perander M, Outzen H, et al. Interaction codes within the family of mammalian Phox and Bem1p domain-containing proteins. J Biol Chem. 2003 Sep 5; 278;(36)34568–34581. DOI:10.1074/jbc.M303221200
- Okamoto K. Organellophagy: eliminating cellular building blocks via selective autophagy. J Cell Biol. 2014 May 26;205(4):435–445. DOI:10.1083/jcb.201402054.
- Farre JC, Subramani S. Mechanistic insights into selective autophagy pathways: lessons from yeast. Nat Rev Mol Cell Biol. 2016 Sep;17(9):537–552.
- Saha S, Wang J, Buckley B, et al. Small molecule inhibitors of arginyltransferase regulate arginylation-dependent protein degradation, cell motility, and angiogenesis. Biochem Pharmacol. 2012 Apr 1; 83;(7)866–873. DOI:10.1016/j.bcp.2012.01.012
- Kamijo K, Taketani S, Yokota S, et al. The 70-kDa peroxisomal membrane protein is a member of the Mdr (P-glycoprotein)-related ATP-binding protein superfamily. J Biol Chem. 1990 Mar 15; 265;(8)4534–4540. DOI:10.1016/S0021-9258(19)39595-X
- Langemeyer L, Frohlich F, Ungermann C. Rab GTPase function in endosome and lysosome biogenesis. Trends Cell Biol. 2018 Nov;28(11):957–970.
- Alessandrini F, Pezze L, Ciribilli Y. Lamps: shedding light on cancer biology. Semin Oncol. 2017 Aug;44(4):239–253.
- Brodsky FM. Living with clathrin: its role in intracellular membrane traffic. Science. 1988 Dec 9;242(4884):1396–1402. DOI:10.1126/science.2904698.
- Kedersha NL, Gupta M, Li W, et al. RNA-Binding proteins TIA-1 and TIAR link the phosphorylation of eIF-2 alpha to the assembly of mammalian stress granules. J Cell Biol. 1999 Dec 27; 147;(7)1431–1442. DOI:10.1083/jcb.147.7.1431
- Zhang J, Tripathi DN, Jing J, et al. ATM functions at the peroxisome to induce pexophagy in response to ROS. Nat Cell Biol. 2015 Oct;17(10):1259–1269. DOI:10.1038/ncb3230
- Tariq M, Ozbek P, Moin ST. Hydration modulates oxygen channel residues for oxygenation of cysteine dioxygenase: perspectives from molecular dynamics simulations. J Mol Graph Model. 2022 Jan;110:108060.
- Germain K, Pk K. Pexophagy: a model for selective autophagy. Int J Mol Sci. 2020 Jan 16;21(2):578. DOI:10.3390/ijms21020578.
- Robinson DRL, Hock DH, Muellner-Wong L, et al. Applying sodium carbonate extraction mass spectrometry to investigate defects in the mitochondrial respiratory chain. Front Cell Dev Biol. 2022;10:786268.
- Fujiki Y, Fowler S, Shio H, et al. Polypeptide and phospholipid composition of the membrane of rat liver peroxisomes: comparison with endoplasmic reticulum and mitochondrial membranes. J Cell Biol. 1982;93(1):103–110. DOI:10.1083/jcb.93.1.103
- Fujiki Y, Hubbard AL, Fowler S, et al. Isolation of intracellular membranes by means of sodium carbonate treatment: application to endoplasmic reticulum. J Cell Biol. 1982;93(1):97–102. DOI:10.1083/jcb.93.1.97
- Chen Y, Pieuchot L, Loh RA, et al. Hydrophobic handoff for direct delivery of peroxisome tail-anchored proteins. Nat Commun. 2014 Dec 17;5:5790. DOI:10.1038/ncomms6790
- Reuber BE, Germain-Lee E, Collins CS, et al. Mutations in PEX1 are the most common cause of peroxisome biogenesis disorders. Nat Genet. 1997 Dec;17(4):445–448. DOI:10.1038/ng1297-445
- Zientara-Rytter K, Subramani S. Autophagic degradation of peroxisomes in mammals. Biochem Soc Trans. 2016 Apr 15;44(2):431–440. DOI:10.1042/BST20150268.
- Hu RG, Sheng J, Qi X, et al. The N-end rule pathway as a nitric oxide sensor controlling the levels of multiple regulators. Nature. 2005 Oct 13; 437;(7061)981–986. DOI:10.1038/nature04027
- Kaur J, Debnath J. Autophagy at the crossroads of catabolism and anabolism. Nat Rev Mol Cell Biol. 2015 Aug;16(8):461–472.
- Apanasets O, Grou CP, Van Veldhoven PP, et al. PEX5, the shuttling import receptor for peroxisomal matrix proteins, is a redox-sensitive protein. Traffic. 2014 Jan;15(1):94–103. DOI:10.1111/tra.12129
- Wang W, Subramani S. Role of PEX5 ubiquitination in maintaining peroxisome dynamics and homeostasis. Cell Cycle. 2017;16(21):2037–2045.
- Terlecky SR, Koepke JI, Walton PA. Peroxisomes and aging. Biochim Biophys Acta. 2006 Dec;1763(12):1749–1754.
- Long J, Gallagher TR, Cavey JR, et al. Ubiquitin recognition by the ubiquitin-associated domain of p62 involves a novel conformational switch. J Biol Chem. 2008 Feb 29; 283;(9)5427–5440. DOI:10.1074/jbc.M704973200
- Kamigaki A, Mano S, Terauchi K, et al. Identification of peroxisomal targeting signal of pumpkin catalase and the binding analysis with PTS1 receptor. Plant J. 2003;33(1):161–175. DOI:10.1046/j.0960-7412.2003.001605.x
- Kragler F, Langeder A, Raupachova J, et al. Two independent peroxisomal targeting signals in catalase a of Saccharomyces cerevisiae. J Cell Biol. 1993;120(3):665–673. DOI:10.1083/jcb.120.3.665
- Fujiki Y. Peroxisome biogenesis and human peroxisome-deficiency disorders. Proc Jpn Acad Ser B Phys Biol Sci. 2016;92(10):463–477.
- Gardner BM, Castanzo DT, Chowdhury S, et al. The peroxisomal AAA-ATPase Pex1/Pex6 unfolds substrates by processive threading. Nat Commun. 2018 Jan 10; 9;(1)135. DOI:10.1038/s41467-017-02474-4
- Nazarko TY. Pexophagy is responsible for 65% of cases of peroxisome biogenesis disorders. Autophagy. 2017 May 4;13(5):991–994. DOI:10.1080/15548627.2017.1291480.
- Geisbrecht BV, Collins CS, Reuber BE, et al. Disruption of a PEX1-PEX6 interaction is the most common cause of the neurologic disorders Zellweger syndrome, neonatal adrenoleukodystrophy, and infantile Refsum disease. Proc Natl Acad Sci U S A. 1998 Jul 21; 95;(15)8630–8635. DOI:10.1073/pnas.95.15.8630
- Marcassa E, Kallinos A, Jardine J, et al. Dual role of USP30 in controlling basal pexophagy and mitophagy. EMBO Rep. 2018 Jul;19(7). DOI:10.15252/embr.201745595
- Dunn KW, Kamocka MM, McDonald JH. A practical guide to evaluating colocalization in biological microscopy. Am J Physiol Cell Physiol. 2011 Apr;300(4):C723–42.
- Bolte S, Cordelières FP. A guided tour into subcellular colocalization analysis in light microscopy. J Microsc. 2006;224(3):213–232.