
ABSTRACT
Much of our understanding of the intracellular regulation of macroautophagy/autophagy comes from in vitro studies. However, there remains a paucity of knowledge about how this process is regulated within different tissues during development, aging and disease in vivo. Because upregulation of autophagy is considered a promising therapeutic strategy for the treatment of diverse disorders, it is vital that we understand how this pathway functions in different tissues and this is best done by in vivo analysis. Similarly, to understand the role of autophagy in the pathogenesis of disease, it is important to study this process in the whole animal to investigate how tissue-specific changes in flux and cell-autonomous versus non-cell-autonomous effects alter disease progression. To this end, we have developed an inducible expression system to up- or downregulate autophagy in vivo, in zebrafish. We have used a modified version of the Gal4-UAS expression system to allow inducible expression of autophagy up- or downregulating transgenes by addition of tamoxifen. Using this inducible expression system, we have tested which transgenes robustly up- or downregulate autophagy and have validated these tools using Lc3-II blots and puncta analysis and disease rescue in a zebrafish model of neurodegeneration. These tools allow the temporal control of autophagy via the administration of tamoxifen and spatial control via tissue or cell-specific ERT2-Gal4 driver lines and will enable the investigation of how cell- or tissue-specific changes in autophagic flux affect processes such as aging, inflammation and neurodegeneration in vivo.
Abbreviations: ANOVA: analysis of variance; Atg: autophagy related; Bcl2l11/Bim: BCL2 like 11; d.p.f.: days post-fertilization; Cryaa: crystallin, alpha a: DMSO: dimethyl sulfoxide; Elavl3: ELAV like neuron-specific RNA binding protein 3; ER: estrogen receptor; ERT2: modified ligand-binding domain of human ESR1/estrogen receptor α; Gal4: galactose-responsive transcription factor 4; GFP: green fluorescent protein; h.p.f.: hours post-fertilization; HSP: heat-shock protein; Map1lc3/Lc3: microtubule-associated protein 1 light chain 3; RFP: red fluorescent protein; SD: standard deviation; SEM: standard error of the mean; UAS: upstream activating sequence; Ubb: ubiquitin b
Introduction
From in vitro studies, we have a detailed understanding of the intracellular regulation of autophagy. However, there remains a paucity of knowledge about how this process is regulated in vivo, particularly how changes in autophagic flux within different tissues affect the processes of development, aging and disease and whether non-cell autonomous effects play a role in these processes. Because upregulation of autophagy is a promising therapeutic strategy for the treatment of diverse disorders, including certain neurodegenerative and infectious diseases [Citation1,Citation2], it is vital that we understand how this pathway functions in different tissues in the context of the whole organism. Similarly, to understand the role of autophagy in the pathogenesis of disease, it is important to study this process in the whole animal to investigate how tissue-specific changes in flux and cell-autonomous versus non-cell-autonomous effects alter disease progression.
Typically, studies have used pharmacological upregulators or blocking agents to investigate how autophagy affects disease states in vivo. However, one limitation of this approach is the inability to manipulate autophagic flux with tissue- or cell-type specificity. Although up- or downregulation could be achieved by genetic means with the use of promoters to confer tissue specificity, these approaches typically lack the temporal control that is afforded by pharmacological agents. To overcome this, we have developed an inducible expression system to up- or downregulate autophagy in vivo, in zebrafish. We have used a modified version of the Gal4-UAS expression system to allow inducible expression of autophagy up- or downregulating transgenes. Gal4 is a transcriptional activator protein found in yeast which binds to its specific DNA recognition sequence upstream of the gene of interest, the upstream activation system (UAS). This two-component expression system was first established and is widely used in Drosophila [Citation3] and has become a well-established technology in zebrafish [Citation4]. We have developed our inducible system using a modified form of Gal4, namely ERT2-Gal4. ERT2-Gal4 comprises a modified ligand-binding domain (LBD) of human ESR1/estrogen receptor α fused to the Gal4 transcriptional activator. When no ligand is present, ESR (estrogen receptor) is bound and held in the cytoplasm by heat-shock proteins (HSPs), hence the Gal4 is also retained in the cytoplasm and cannot activate transcription. Ligand binding causes HSP-ER dissociation, thereby permitting nuclear translocation and transcriptional activity of the ER and with it, translocation of Gal4. This approach has previously been used for the temporal control of Cre recombinase (reviewed in ref [Citation5].) and for temporal control of transcription factors [Citation6]. Importantly, the synthetic ligand 4-hydroxy-tamoxifen (4-OHT, hereafter called tamoxifen) but not endogenous estrogens bind to the modified ERT2 [Citation7]. Furthermore, tamoxifen does not cause toxicity in zebrafish embryos or larvae at the concentrations required to dissociate HSP/ER binding.
Using this inducible expression system, we have tested a panel of transgenes to find those that robustly up- or downregulate autophagy. Atg5 was considered as a candidate to upregulate autophagy. In mammalian cell cells, ATG5 conjugates with ATG12 and forms a complex with ATG16L1 that promotes the lipid conjugation of MAP1LC3/LC3 to form LC3-II, which is important for autophagic flux [Citation8]. Overexpression of atg5 in larvae of a zebrafish Parkinson disease model leads to upregulation of autophagy and protected dopaminergic neurons [Citation9] and also upregulated Lc3-II levels and ameliorated pathology in a zebrafish model of tauopathy [Citation10]. In mice, Atg5 overexpression also increases autophagy [Citation11]. Two candidates were selected as candidates to downregulate autophagy; mutant forms of atg4b and bcl2l11/bim. In yeast, the cysteine protease Atg4 is essential for cleaving the C terminus of Atg8, which is required for subsequent Atg8 – phosphatidylethanolamine (PE) conjugation [Citation12]. In mammalian cells, expression of an inactive form of ATG4B with mutation in the catalytic domain (ATG4BC74A) inhibits LC3 lipidation, preventing closure of autophagic structures and impairing autophagic degradation [Citation13]. BCL2L11 (BCL2 like 11) plays an important role in both apoptosis induction and autophagy inhibition [Citation14]. Mutation of L152 and F159 in the BH3 domain of BCL2L11 (BCL2L11[EE]/BIM_EE), results in a protein which cannot bind to BCL2 (and hence does not affect apoptosis) but is still able to bind to BECN1 (beclin 1). Overexpression of BCL2L11[EE] in cultured cells results in downregulation of autophagy with no effect on cell death [Citation15].
Using this inducible expression system, we have tested which transgenes robustly up- or downregulate autophagy and have validated these tools using Lc3-II blots, puncta analysis and disease rescue in a zebrafish model of neurodegeneration.
Results
Inducible expression of autophagy-related genes alters autophagy in zebrafish
Inducible expression was achieved by crossing ubb:ERT2-Gal4 fish with transgenic lines harboring different UAS-driven transgenes (see ) and treating offspring with tamoxifen (). The ubb:ERT2-Gal4 transgene carries the cryaa:RFP selection marker, therefore offspring which carry the transgene can be identified by RFP expression in lenses. All UAS-driven transgenes were generated with the myl7:EGFP selection marker therefore transgene-positive larvae can be identified by GFP expression in the heart. Crosses of ubb:ERT2-Gal4 fish to UAS:mRFP-GFP-lc3 fish were used determine that there was not “leaky” expression in the absence of tamoxifen (). In agreement with the results reported by Gerety et al. (2013), we observed that treatment with 1 µM tamoxifen from 8 h.p.f. was sufficient to drive strong ubiquitous transgene expression (GFP and RFP fluorescence, ) and no transgene expression was observed in DMSO treatment groups [Citation7]. To quantify the induction of expression achieved with 1 µM tamoxifen, we crossed ubb:ERT2-Gal4 with UAS:GFP fish and treated offspring with either DMSO or 1 µM tamoxifen from 8 h.p.f. to 96 h.p.f. Larvae treated with DMSO had no detectable GFP expression (as determined by western blot and fluorescent imaging) whereas those with treated with tamoxifen had strong GFP expression (). In addition, we confirmed that treatment with 1 µM tamoxifen from 8 h.p.f. to 96 h.p.f. resulted in robust expression of GFP but did not affect Lc3-II levels compared to DMSO treated controls, either in basal or NH4Cl-treated conditions ().
Figure 1. Regulation of transgene expression in ERT2-Gal4 and UAS transgenic lines using tamoxifen. (a) Schematic diagram of crosses from ERT2-Gal4 and UAS transgenic zebrafish. The ERT2:Gal4 transgenes carry a cryaa:RFP cassette therefore transgenic fish can be identified by red fluorescence in the lens. The UAS transgenes carry a myl7:EGFP cassette which drives in GFP expression in the heart. This allows identification of transgenic carriers regardless of UAS expression. From crosses of UAS and Gal4 transgenic fish, 25% of offspring will inherit both transgenes. (b) Tamoxifen induces UAS-driven transgene expression in double transgenic larvae. Offspring of ubb:ERT2-Gal4 and UAS:mRFP-GFP-lc3 were either treated with DMSO or 1 µM tamoxifen. In control (DMSO) conditions, ERT2-Gal4 is inactive as it is retained in the cytoplasm. Therefore, there is no UAS-driven expression in double transgenic zebrafish (red fluorescence in the lens and green fluorescence in the heart demonstrates that the larva carries both transgenes). Upon tamoxifen treatment, ERT2-Gal4 translocates to the nucleus, binds to UAS and activates transgene expression and both green and red fluorescence are seen throughout the body. (c) Tamoxifen treatment does not affect autophagic flux. Lc3-II levels were measured in double transgenic larvae carrying ubb:ERT2-Gal4 and UAS:EGFP transgenes. In control conditions, GFP is not expressed. Treatment with 1 µM tamoxifen induces strong GFP expression but has no effect on Lc3-II levels in either basal or NH4Cl-treated conditions. A nonspecific band (red arrowhead) is present in all lanes and runs just below the level of GFP. This band is obscured by the GFP-positive band in lanes 2 and 4.
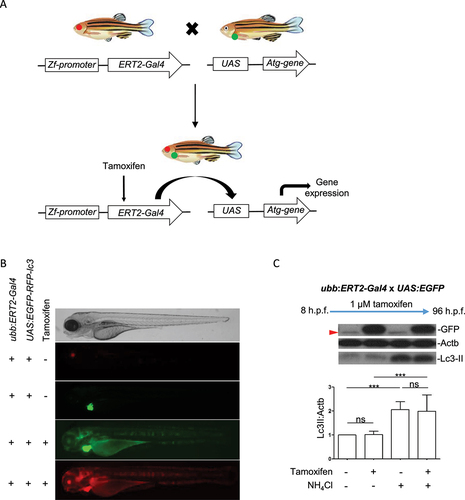
Table 2. Zebrafish lines.
For all subsequent experiments, all offspring were treated with tamoxifen at a range of concentrations (0.1–3.0 µM) from 6–8 h.p.f. to 72 or 96 h.p.f. All concentrations were found to induce expression of the Dendra2 fluorescent protein in offspring from crosses of ubb:ERT2-Gal4 and UAS:Dendra fish and did not cause any overt morphological defects or toxicity (Fig. S1A). These concentrations were also tested in wild-type fish and did not affect autophagic flux (Fig. S1B). To examine whether overexpression of Atg5, Atg4b_C74A and Bcl2l11[EE] were sufficient to up- or downregulate autophagy, we crossed the UAS-driven autophagy modulator lines with ubb:ERT2-Gal4 lines. Embryos from these crosses were treated with 1 µM tamoxifen treatment from 6–8 h.p.f. to 96 h.p.f. with daily replenishment of embryo medium and tamoxifen. Four hours prior to tissue collection, half the larvae were treated with ammonium chloride. Ammonium chloride raises the lumenal pH of the lysosome and hence prevents the degradation of Lc3-II/autophagosomes, like bafilomycin A1 and chloroquine. As these agents essentially clamp Lc3-II degradation, changes in its levels in the presence of these compounds can thus be ascribed to altered formation (autophagosome biosynthesis), and is an approach that is widely used in tissue culture, which has been adopted in in vivo models too [Citation16].
At the end of the treatment period, larvae were selected for the presence or absence of Gal4 and UAS transgenes using cryaa:mRFP (red fluorescent lens) and myl7:GFP (green heart) selection markers for Gal4 and UAS transgenes, respectively. Larvae that were positive for only a single transgene or neither transgene were used as controls. Endogenous Atg5 expression could be detected in all offspring with robust transgene expression detected in Gal4/UAS-positive offspring with tamoxifen treatment (). Atg5 overexpression resulted in an increase of Lc3-II levels compared to control (non-expressing) siblings and a further increase of Lc3-II levels was observed upon NH4Cl treatment, indicative of autophagy induction (). Overexpression of Atg4bC74A was induced by tamoxifen treatment as detected by western blotting for the Flag-tag (). Lc3-II levels were increased in Atg4bC74A expressing fish in basal conditions with no further increase observed when lysosome acidification was blocked with NH4Cl treatment, indicative of an autophagy flux-blocking effect (). Robust induction of Bcl2l11[EE] expression was observed in tamoxifen-treated transgenic larvae, as detected by western blotting for the His-tag. Bcl2l11[EE] overexpression resulted in a reduction of Lc3-II levels in basal conditions, indicative of a block in autophagosome synthesis and this reduction was also seen upon NH4Cl treatment, confirming the autophagy-blocking effect (). Although transgene-induced Atg5 expression does not appear to be as strong as that of Atg4bC74A or Bcl2l11[EE], this likely reflects the affinity of the antibodies used. Atg5 was detected using an antibody against a synthetic peptide matched to the human and mouse protein sequence whereas Atg4bC74A and Bcl2l11[EE] transgenes were tagged with Flag and His tags respectively. These antibody tags have the exact peptide sequence as that to which the antibody was raised and will therefore have greater affinity for the expressed protein and hence may appear to be expressed more strongly.
Figure 2. Regulation of transgene expression using ERT2-Gal4 and UAS transgenic lines to control autophagic flux. (a) Induction of Atg5 expression results in upregulation of autophagy. All larvae from crosses of ubb:ERT2-Gal4 and UAS:atg5 were treated with 1 µM tamoxifen from 8 h.p.f. to 96 h.p.f. Endogenous Atg5 expression is detected in larvae which do not carry the transgenes. A significant increase in expression of Atg5 is observed in double transgenic larvae (resulting from UAS-transgene expression) and this correlates with increased Lc3-II. NH4Cl treatment is used to block lysosome acidification and therefore block autophagic flux. The increase in Lc3-II observed in Atg5 expressing larvae with NH4Cl treatment reflects the accumulation of autophagosomes which cannot be degraded. (b) Induction of Atg4bC74A expression results in a block in autophagic flux. All larvae from crosses of ubb:ERT2-Gal4 and UAS:FLAG-atg4b_C74A were treated with 1 µM tamoxifen from 8 h.p.f. to 96 h.p.f. Expression of the FLAG-tagged Atg4bC74A transgene is observed in double transgenic larvae and this correlates with an increase Lc3-II. Lc3-II levels do not increase further in NH4Cl treatment conditions indicating that Atg4bC74A expression causes a block in autophagic flux. Nonspecific bands were observed above the FLAG band in all treatment groups and genotypes. (c) Induction of Bcl2l11[EE] expression results in a downregulation of autophagy. All larvae from crosses of ubb:ERT2-Gal4 and UAS:His-bcl2l11[EE] were treated with 1 µM tamoxifen from 8 h.p.f. to 96 h.p.f. Expression of His-tagged Bcl2l11[EE] is observed in double transgenic larvae and this correlates with a decrease in Lc3-II. Lc3-II levels increase in NH4Cl treatment conditions in both non-expressing and Bcl2l11[EE] expressing larvae as autophagosomes cannot be degraded. However, in Bcl2l11[EE] expressing larvae, Lc3-II levels remain significantly lower than non-transgenic siblings indicating a downregulation in autophagy. In all panels, graphs show mean values (± SEM) of densitometry of Lc3-II normalized to Actb (loading control) from >3 independent experiments. All graphs are normalized to the control (no transgene; no NH4Cl treatment) condition. Statistical analysis was performed using paired t-tests; ns – not significant; *p < 0.05; **p < 0.01; ***p < 0.001.
![Figure 2. Regulation of transgene expression using ERT2-Gal4 and UAS transgenic lines to control autophagic flux. (a) Induction of Atg5 expression results in upregulation of autophagy. All larvae from crosses of ubb:ERT2-Gal4 and UAS:atg5 were treated with 1 µM tamoxifen from 8 h.p.f. to 96 h.p.f. Endogenous Atg5 expression is detected in larvae which do not carry the transgenes. A significant increase in expression of Atg5 is observed in double transgenic larvae (resulting from UAS-transgene expression) and this correlates with increased Lc3-II. NH4Cl treatment is used to block lysosome acidification and therefore block autophagic flux. The increase in Lc3-II observed in Atg5 expressing larvae with NH4Cl treatment reflects the accumulation of autophagosomes which cannot be degraded. (b) Induction of Atg4bC74A expression results in a block in autophagic flux. All larvae from crosses of ubb:ERT2-Gal4 and UAS:FLAG-atg4b_C74A were treated with 1 µM tamoxifen from 8 h.p.f. to 96 h.p.f. Expression of the FLAG-tagged Atg4bC74A transgene is observed in double transgenic larvae and this correlates with an increase Lc3-II. Lc3-II levels do not increase further in NH4Cl treatment conditions indicating that Atg4bC74A expression causes a block in autophagic flux. Nonspecific bands were observed above the FLAG band in all treatment groups and genotypes. (c) Induction of Bcl2l11[EE] expression results in a downregulation of autophagy. All larvae from crosses of ubb:ERT2-Gal4 and UAS:His-bcl2l11[EE] were treated with 1 µM tamoxifen from 8 h.p.f. to 96 h.p.f. Expression of His-tagged Bcl2l11[EE] is observed in double transgenic larvae and this correlates with a decrease in Lc3-II. Lc3-II levels increase in NH4Cl treatment conditions in both non-expressing and Bcl2l11[EE] expressing larvae as autophagosomes cannot be degraded. However, in Bcl2l11[EE] expressing larvae, Lc3-II levels remain significantly lower than non-transgenic siblings indicating a downregulation in autophagy. In all panels, graphs show mean values (± SEM) of densitometry of Lc3-II normalized to Actb (loading control) from >3 independent experiments. All graphs are normalized to the control (no transgene; no NH4Cl treatment) condition. Statistical analysis was performed using paired t-tests; ns – not significant; *p < 0.05; **p < 0.01; ***p < 0.001.](/cms/asset/1077b06f-dd4b-4ed4-b44f-41710780a273/kaup_a_2135824_f0002_oc.jpg)
We next examined the range of concentrations of tamoxifen able to induce robust expression of the transgenes. Atg4bC74A expression was strongly induced by 0.5 µM tamoxifen from 8 h.p.f to 96 h.p.f. and caused a significant block in autophagy flux (measured by Lc3-II levels, Figure S2A), whereas no obvious Atg4bC74A expression and an inconsistent effect on Lc3-II were observed with 0.1 µM tamoxifen treatment for the same exposure duration (Figure S2B). Similarly, the use of 0.5 µM tamoxifen resulted in strong Atg5 expression and a significant increase in Lc3-II levels in basal and ammonium chloride treatment conditions, indicating an increase in autophagic flux (Figure S2c), whereas 0.1 µM tamoxifen treatment did not induce Atg5 expression (Figure S2d,e) and had no effect on Lc3-II levels in either basal or ammonium chloride treatment conditions (Figure S2d,f).
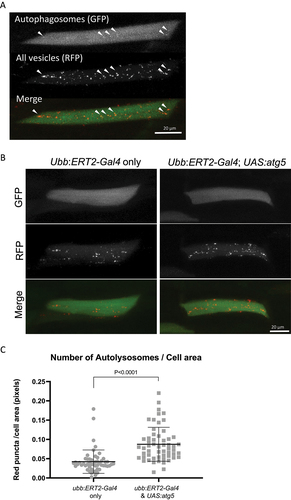
In addition to western blot analysis, we determined the number of autophagosomes and autolysosomes as a quantitative readout of autophagic flux in zebrafish. The tandem fluorescent mRFP-GFP-LC3 probe has been widely used in cell culture and also in vivo to measure the number of autophagosomes and autolysosomes [Citation17]. Lc3 associates with pre-autophagosomal structures, mature autophagosomes and also autolysosomes. The mRFP-GFP-lc3 transgene can be used to label and therefore count the number of vesicles and to discriminate between autophagosomes and autolysosomes, since the GFP signal becomes quenched in the acidic lysosomal environment. We used DNA injections of UAS:mRFP-GFP-lc3 into offspring of crosses of ubb:ERT2-Gal4 with UAS:atg5 fish. DNA injections result in mosaic expression and therefore, when expression is induced by tamoxifen, allows the analysis of expression in individual cells (n.b. tamoxifen treatment induces the expression of both UAS:mRFP-GFP-lc3 and UAS:atg5). Confocal images of the red and green signal of individual muscle cells were used to analyze the green and red puncta. Autophagosomes were visualized as green puncta colocalizing with red puncta whereas autolysosomes were identified as red only puncta (). This analysis allows the quantification of the number of autophagic vesicles, and can be used to identify changes in the autophagic flux. A significant increase in RFP-only positive vesicles was observed in larvae when Atg5 was overexpressed compared to ubb:ERT2-Gal4 only siblings (), indicating an increase in the numbers of autolysosomes. The area of each individual red puncta was measured in every cell using ImageJ. A total of 2838 vesicles were counted in the control group (n = 53 cells; average of 54 vesicles per cell) versus a total of 5988 vesicles in Atg5 overexpressing larvae (n = 57 cells; average of 105 vesicles per cell), corroborating the increase in autophagic vesicles counted manually. The size of autophagic vesicles was not influenced by Atg5-induced autophagy induction (Fig. S3A). The majority of puncta observed were red-only () supporting the idea that autophagosomes rapidly fused with lysosomes. However, the proportion of cells containing autophagosomes was greater in Atg5 overexpressing larvae compared to their respective controls, indicating that Atg5 expression does increase the abundance of autophagosomes (Fig. S3B). Despite this, no significant changes were found in the total numbers of autophagosomes per cell between the two experimental groups (Fig S3C).
Figure 3. Expression of Atg5 increases autophagic flux in muscle cells. Eggs from a ubb:ERT2-Gal4 x UAS:atg5 cross were injected with the UAS:mRFP-GFP-lc3 reporter and treated with 1 µM tamoxifen from 8 h.p.f. The numbers of autophagosomes and autolysosomes were quantified in individual muscle cells of larvae at 96 h.p.f. (a) Representative images of a muscle cell expressing mRFP-GFP-lc3, a dual-fluorescent reporter for the quantification of autophagic flux. Autophagosomes are visualized as bright puncta evident in both green and red channels (white arrowheads). Red puncta without any green signal correspond to autolysosomes, since the GFP signal has been quenched by the low pH following lysosome fusion. Very few autophagosomes (yellow puncta) are observed compared to autolysosomes (red only puncta) with this reporter construct suggesting autophagosomes rapidly fuse with the lysosome. Images shown are the maximum intensity projections of the green and red channel z-stacks. Scale bar: 20 μm. (b) Representative images of muscle cells expressing mRFP-GFP-lc3 in larvae overexpressing Atg5 and their corresponding non-expressing siblings from a cross of ubb:ERT2-Gal4 x UAS:atg5 fish. Red vesicles (autolysosomes) were more abundant in Atg5-expressing larvae. Few cells were found with yellow vesicles (autophagosomes) in either experimental group. Scale bar: 20 μm. (c) Quantification of autolysosomes per cell area calculated from maximum intensity projection of the red channel of individual muscle cells. Overexpression of Atg5 resulted in a statistically significant increase in autolysosomes. Graph represents the numbers of red puncta normalized to the area of the cell (in pixels) (N = 53 control muscle cells; N = 57 atg5-expressing muscle cells; P < 0.0001).
Temporal and spatial control of autophagy-related gene expression
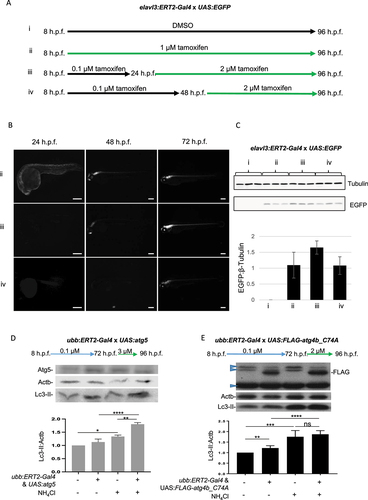
To investigate tissue-specific control of transgene expression, we used the elavl3:ERT2-Gal4 driver line and investigated the strength and localization of GFP expression compared to Ubb:ERT2-Gal4 driven expression. Treatment with 1 µM tamoxifen from 8 h.p.f. resulted in robust, ubiquitous transgene expression at 24 h.p.f. and this remained strong at 48 h.p.f. In larvae from crosses using the elavl3:ERT2-Gal4 driver treated with 1 µM tamoxifen, transgene expression was observed at 24 h.p.f. in the developing nervous system and became more evident and localized to the CNS 48 h.p.f. (Fig. S4A). We next tested whether this system could be used for temporal control of transgene expression, by altering the timepoints of tamoxifen treatment. We found that adding tamoxifen at 1, 2 or 3 µM from 24 h.p.f. and later time points did not induce expression (data not shown). We hypothesized that low concentrations of tamoxifen might be used to “prime” transgene expression, followed by later higher tamoxifen exposure to drive strong overexpression. We previously observed that 0.1 µM tamoxifen induced weak expression in Ubb:ERT2-Gal4; UAS:Dendra2 fish (Fig. S1A) but did not induce transgene expression in UAS-driven autophagy lines (). We used this concentration from 8 h.p.f., followed by a later, higher concentration of tamoxifen to optimize late transgene induction. We found that treatment of elavl3:ERT2-Gal4 x UAS:EGFP fish with 0.1 µM tamoxifen from 8–24 h.p.f., then 1 µM tamoxifen for a further 72 h did not induce strong EGFP expression (data not shown). However, treatment with 0.1 µM tamoxifen from 8–24 h.p.f., then with 2 µM tamoxifen from 24 or 48 h.p.f. onwards resulted in robust GFP expression (), localized only to the CNS. Similarly, we found that treatment of Ubb:ERT2-Gal4 x UAS:atg5 or UAS:FLAG-atg4b_C74A larvae with 0.1 µM tamoxifen from 6–72 h.p.f., then 1 µM tamoxifen for 24 h did not induce strong enough transgene expression to alter autophagic flux (data not shown). However, treatment of Ubb:ERT2-Gal4 x UAS:atg5 larvae with 0.1 µM tamoxifen from 8–72 h.p.f., then 3 µM tamoxifen for 24 h resulted in induction of Atg5 expression (Fig S4B). Although this resulted in only a modest increase in Lc3-II levels in basal conditions, a significant increase in Lc3-II was observed in NH4Cl conditions, demonstrating that autophagy was induced in older larvae with this protocol (). Using a similar protocol in Ubb:ERT2-Gal4 x UAS:FLAG-atg4b_C74A larvae, treatment with 0.1 µM tamoxifen from 8–72 h.p.f., then 2 µM tamoxifen for 24 h resulted in robust Atg4bC74A transgene expression, with an increase in Lc3-II levels observed in Atg4bC74A expressing larvae in basal conditions and no difference between control and Atg4bC74A expressing larvae in NH4Cl treatment, indicating a block in autophagic flux ().
Figure 4. Temporal control of transgene expression to regulate autophagic flux. (a-c) Larvae from crosses of elavl3:ERT2-Gal4 and UAS:EGFP were used to optimize the timing and concentration of tamoxifen treatment for temporal control of transgene expression. (a) Schematic diagram of different treatment conditions. (b) Treatment of larvae from 8 h.p.f. to 96 h.p.f. with 1 µM tamoxifen (condition ii) resulted in transgene expression which was evident from 24 h.p.f. and strongly expressed in the CNS from 48 h.p.f. onwards. Representative images taken using GFP filter (excitation 395–455 nm; emission 480 nm). (b and c) Treatment with 2 µM tamoxifen was required to induce GFP expression at later time points, from 24 or 48 h.p.f. onwards (conditions iii and iv, respectively). (c) Western blot and quantification of EGFP protein levels (samples run from 3 independent experiments on single gel). (d) Temporal induction of Atg5 expression results in upregulation of autophagy. All larvae from crosses of ubb:ERT2-Gal4 and UAS:atg5 were treated with 0.1 µM tamoxifen from 8 h.p.f. to 72 h.p.f. to prime transgene expression and then with 3 µM tamoxifen from 72 h.p.f. to 96 h.p.f. Atg5 expression was induced, although not as strongly as when treatment was initiated early (quantified in Fig. S1B). Although no increase in Lc3-II was observed in basal conditions, the strong increase in Lc3-II observed in Atg5 expressing larvae with NH4Cl treatment, which is much greater than that observed in non-transgenic siblings with NH4Cl treatment, demonstrates that late induction was able to induce autophagic flux. (e) Temporal induction of Atg4bC74A expression results in a block in autophagic flux. All larvae from crosses of ubb:ERT2-Gal4 and UAS:FLAG-atg4b_C74A were treated with 0.1 µM tamoxifen from 8 h.p.f. to 72 h.p.f. to prime transgene expression and then with 2 µM tamoxifen from 72 h.p.f. to 96 h.p.f. Strong induction of FLAG-tagged Atg4bC74A was observed in double transgenic larvae with this late induction protocol which correlated with an increase Lc3-II expression. Lc3-II levels did not increase in controls versus Atg4bC47A expressing siblings in NH4Cl treatment conditions indicating that Atg4bC74A expression causes a block in autophagic flux. Nonspecific bands (blue arrowheads) were observed in all treatment groups and genotypes. (d and e). Graphs show mean values (± SEM) of densitometry of Lc3-II normalized to Actb (loading control) from at least 3 independent experiments. All graphs are normalized to the control (no treatment) condition. Statistical analysis was performed using paired t-tests: ns – not significant; *p < 0.05; **p < 0.01; ***p < 0.001, ****p < 0.0001.
Autophagy upregulation by induction of Atg5 expression ameliorates tau pathology in the zebrafish retina
We and others have previously shown that small changes in autophagic flux, as measured by changes in Lc3-II and Lc3-positive puncta, can have a marked effect on the clearance of autophagy substrates [Citation18], hence this may be a more physiologically relevant method to measure the impact of altering autophagic flux. To investigate whether modulation of autophagy through our inducible system was sufficient to affect disease pathology caused by the accumulation of an aggregate-prone autophagy substrate, we crossed the UAS:atg5 transgenic line to a zebrafish model of tauopathy. In this model, GFP-tagged human wild-type MAPT/tau is expressed in the rod photoreceptors in the retina and results in increasing photoreceptor degeneration over time [Citation19]. The rho:GFP-MAPT/tau; UAS:atg5 double transgenic fish were crossed to ubb:ERT2-Gal4 transgenic fish () and all offspring treated with 1 µM tamoxifen from 8 h.p.f. to 9 d.p.f. Photoreceptor degeneration was assessed by quantifying the number of GFP-positive photoreceptors present in sections through the central retina (). Striking degeneration was observed in rho:GFP-MAPT/tau fish which were negative for Gal4 and UAS transgenes, whereas significant rescue of photoreceptors was observed in offspring expressing Atg5 (). This effect was confirmed to be caused by the expression overexpression of Atg5, since tamoxifen treatment in rho:GFP-MAPT/tau fish (i.e. without the UAS:atg5 transgene) had no effect (Fig. S5).
Figure 5. Autophagy upregulation by induction of Atg5 expression ameliorates pathology in a zebrafish model of tauopathy. (a) Schematic diagram of crosses to generate triple transgenic zebrafish. Photoreceptor degeneration is observed in the zebrafish transgenic line expressing the GFP-tagged human MAPT gene under the control of the rhodopsin promoter (rho:GFP-MAPT/tau transgene). This degeneration has previously been shown to be ameliorated by pharmacological upregulation of autophagy [Citation19]. The rho:GFP-MAPT/tau line was crossed to the UAS:atg5 transgenic line and double transgenic fish were identified as those with GFP expression in the retina and in the heart. These double transgenic fish were crossed with ubb:ERT2-Gal4 transgenic fish. From the final cross, 12.5% of offspring will inherit all 3 transgenes (GFP in retina and heart; RFP in the lens). All offspring were treated with 1 µM tamoxifen from 8 h.p.f. to 9 d.p.f. At the end of the treatment period, larvae were sorted for expression by GFP and RFP expression to identify those expressing only the rho:GFP-MAPT/tau transgene and those expressing all three transgenes. (b) Photoreceptor degeneration analysis. (I) Cryosections through the central retina (plane of section shown by blue line) were imaged and quantified to determine the photoreceptor number and distribution. (ii) Hematoxylin and eosin-stained histological section to demonstrate the photoreceptor layer (arrowheads). L marks position of lens. (c and d) By 9 d.p.f., almost all photoreceptors have degenerated in rho:GFP-MAPT/tau fish (upper panel) with just a few GFP-positive cells (arrowheads) remaining at the ciliary marginal zone. In triple transgenic zebrafish (overexpressing Atg5), there is a significant rescue of photoreceptor degeneration. Representative images taken using GFP filter (excitation 395–455 nm; emission 480 nm). Quantification of photoreceptors is shown in (d), (n ≥ 55 eyes analyzed per group; unpaired t-test, **p < 0.01). Scale bar: 50 µm.
![Figure 5. Autophagy upregulation by induction of Atg5 expression ameliorates pathology in a zebrafish model of tauopathy. (a) Schematic diagram of crosses to generate triple transgenic zebrafish. Photoreceptor degeneration is observed in the zebrafish transgenic line expressing the GFP-tagged human MAPT gene under the control of the rhodopsin promoter (rho:GFP-MAPT/tau transgene). This degeneration has previously been shown to be ameliorated by pharmacological upregulation of autophagy [Citation19]. The rho:GFP-MAPT/tau line was crossed to the UAS:atg5 transgenic line and double transgenic fish were identified as those with GFP expression in the retina and in the heart. These double transgenic fish were crossed with ubb:ERT2-Gal4 transgenic fish. From the final cross, 12.5% of offspring will inherit all 3 transgenes (GFP in retina and heart; RFP in the lens). All offspring were treated with 1 µM tamoxifen from 8 h.p.f. to 9 d.p.f. At the end of the treatment period, larvae were sorted for expression by GFP and RFP expression to identify those expressing only the rho:GFP-MAPT/tau transgene and those expressing all three transgenes. (b) Photoreceptor degeneration analysis. (I) Cryosections through the central retina (plane of section shown by blue line) were imaged and quantified to determine the photoreceptor number and distribution. (ii) Hematoxylin and eosin-stained histological section to demonstrate the photoreceptor layer (arrowheads). L marks position of lens. (c and d) By 9 d.p.f., almost all photoreceptors have degenerated in rho:GFP-MAPT/tau fish (upper panel) with just a few GFP-positive cells (arrowheads) remaining at the ciliary marginal zone. In triple transgenic zebrafish (overexpressing Atg5), there is a significant rescue of photoreceptor degeneration. Representative images taken using GFP filter (excitation 395–455 nm; emission 480 nm). Quantification of photoreceptors is shown in (d), (n ≥ 55 eyes analyzed per group; unpaired t-test, **p < 0.01). Scale bar: 50 µm.](/cms/asset/bfaa529b-b662-456b-9ce3-d93040e0bf48/kaup_a_2135824_f0005_oc.jpg)
Discussion
Until recently, one of the limitations of using zebrafish to study biological processes or disease progression was the lack of tools to temporally control and manipulate gene expression. Transient overexpression and knock-down can be achieved by injections of in vitro synthesized mRNA for overexpression of a specific protein, or with morpholino oligonucleotides (MOs) for reducing translation, respectively [Citation20]. Overexpression can also be achieved by injection of DNA constructs, although this usually results in mosaic expression [Citation21]. However, with such approaches, there are significant limitations to the use of these techniques to control gene expression. Constructs are typically injected into the 1 cell stage embryo and results in transient alterations in gene expression, depending on the speed of mRNA or DNA degradation and the rate at which the MO is bound to local mRNA. Furthermore, since embryos are injected at the one cell stage, the injected mRNA, DNA or MO is transmitted to all cells during development, hence there is no spatial or temporal control of knockdown or overexpression; after delivery, the knockdown or overexpression nucleotide is permanently “on”. If protein overexpression or knockdown at early embryonic stages causes lethality or early developmental defects, this precludes any observations on later larval stages. Delivery of either overexpression constructs or MOs can be achieved at later larval stages via electroporation which give localized but not tissue-specific delivery and again, is limited by the degradation rate of the overexpressed or knockdown nucleotides.
As an improved alternative method to these transient approaches, an inducible system for control of transgene expression has been developed in zebrafish [Citation7,Citation22]. In addition to demonstrating temporal expression of fluorescent proteins (e.g. for cell lineage tracing studies), they further showed that the inducible system was able to drive gain-of-function expression using a dominant-negative caspase9 construct to block drug-induced apoptosis [Citation7] or to induce tissue-specific Notch activation [Citation22]. This technology has since been used for temporal control of ascl1b expression to confirm the biological target responsible for valproic acid-induced changes in 5-HT neuronal differentiation [Citation23] and of apoa1bp2 (Aibp2) to investigate cholesterol synthesis [Citation24]. In addition, several studies have used tissue-specific ERT2-Gal4 expression to achieve spatial and temporal control: for example, constitutively active Rho expression and EphA4a expression to investigate the role actinomyosin cables in embryonic hindbrain boundary formation [Citation25]; to drive vSrc and dominant-negative Rab5 expression in epithelial cells to investigate their apical elimination following transformation [Citation26]; and to drive expression of nuclear-localized Srebp2 in an Aibp2-deficient background to rescue haematopoetic stem cells (HSC) and thereby confirm that that Srebp2 acts downstream of Aibp2 to orchestrate HSC specification [Citation24]. In addition, spatial control can be achieved by using “caged” tamoxifen analogues which are only active upon photoactivation [Citation27–29].
One potential drawback of using the ERT2-Gal4/UAS transgene system is that some UAS-driven transgenes have been reported to become silenced in successive generations. Goll et al. demonstrated that the UAS binding site contains CpG motifs that can become methylated and the presence of this methylation is thought to prevent Gal4 binding and therefore lead to silencing [Citation30]. They found that Gal4 binding to the UAS sites was sufficient to prevent methylation and this may provide an explanation for the need to “prime” with a low concentration of tamoxifen to achieve later expression of the UAS-driven transgenes. However, we have maintained the UAS-driven transgenic lines reported here for at least four generations without silencing.
Here, we have validated a suite of tools for temporal autophagy up- and downregulation in vivo. Our work is particularly focussed on the role of autophagy in neurodegeneration and we have demonstrated the utility of these tools for manipulating autophagy in the context of neurodegenerative disease. In future studies, this technology will allow us to manipulate autophagy in particular cell types. Drivers for tissue-specific expression of GAL4-ERT2 have already been described for neurons (HuC:ERT2-Gal4 [Citation7]), epithelial cells (krt18a.1:KALTA4-ERT2 and krt5:Gal4-ERT-VP16 [Citation22,Citation26],) and endothelial cells (kdrl:Gal4-ERT2 [Citation24]) and others can be easily generated using with cloning techniques such as Gateway recombination and Gibson assembly [Citation31,Citation32]. In addition, our autophagy regulation system can also be used in conjunction with conventional Gal4 driver lines, of which 3,759 fish stocks are currently listed containing Gal4 transgenes on the ZFIN database (https://zfin.org/). Although there are numerous duplicate entries of the same Gal4 lines (for example, on different transgenic or mutant backgrounds), this is likely an underestimation of the number of available lines, given the output of enhancer trap screens, such as zTrap [Citation33] and tissue-specific screens [Citation34,Citation35]. Additionally, temporal control could be achieved without generating ERT2-Gal4 lines by using Hsp70:Gal4, with temporal control by immersion in 39°C embryo medium buffer [Citation36] or localized expression using laser warming [Citation37,Citation38].
We believe these tools will be useful across a wide range of fields including development, cancer biology, inflammation and liver disease, for which tissue-specific Gal4 driver lines already exist. In addition, the recent developments demonstrating CRISPR-Cas9 knock-in of transgenes at an existing transgene locus (e.g. GFP reporter) or to endogenous genes, suggests that it would be similarly possible to knock-in Gal4-ERT2 transgenes [Citation39,Citation40], which would further increase the utility of this technology.
Materials and methods
Maintenance of stocks and collection of embryos
All zebrafish procedures were performed in accordance with the UK Animals (Scientific Procedures) Act with appropriate Home Office Project and Personal animal licenses and with local Ethics Committee approval. Studies were performed in accordance with PREPARE and ARRIVE guidelines. Zebrafish were kept and grown up on a 14-h light:10-h dark cycle under standard conditions. Embryos were collected from natural spawnings, staged according to established criteria [Citation41] and reared in embryo medium (5 mM NaCl, 0.17 mM KCl, 0.33 mMCaCl2, 0.33 mM Mg2SO4, 5 mM HEPES, pH 7.2) at 28.5°C in the dark.
Generation of transgenic constructs
Transgenic constructs were generated via Gateway recombination using components of the zebrafish Tol2kit [Citation42]. A zebrafish atg5 cDNA clone (Source Bioscience, MGC 100934, IMAGE:7145909) served as a template for add-on PCR of a 5’ attL1 site and Kozak sequence and 3’ attL2 site making the product compatible with Multisite Gateway® cloning technology (ThermoFisher). Recombination of the PCR product and the pDONR221 vector clone was performed according to the manufacturer’s instructions, thereby creating the pME_atg5 middle entry clone. Sequence alignment and analysis was performed to identify the equivalent amino acids in zebrafish Bcl2l11 and Atg4b to those in the mammalian sequence for mutagenesis. Zebrafish Bcl2l11L128E is equivalent to mammalian L152E and zebrafish Bcl2l11L135E is equivalent to mammalian F159E; residues in Atg4b are at the same position in the zebrafish and mammalian peptide sequence. For creation of pME_FLAG-atg4b_C74A and pME_His-bcl2l11_L128E_F135E constructs, RNA was isolated from 5 days post-fertilization (d.p.f.) wild-type larvae using RNeasy mini kit (Qiagen, 74,134). Following DNase treatment (Invitrogen, 18,068,015), 1 µg of RNA was reverse transcribed using the High Capacity cDNA reverse transcription kit (Applied Biosystems, 4,368,814). Atg4b and Bcl2l11 cDNA were amplified by PCR and the products cloned into pCR-TOPO using the TOPO TA cloning kit (ThermoFisher, K460001) following the manufacturer’s instructions. The resulting pCRII_atg4b plasmid was used for site-directed mutagenesis creating atg4b_C74A followed by add on PCR of a 5’ attL1 site, Kozak sequence and FLAG-tag and a 3’ attL2 site on atg4b_C74A using a M13F site for primer binding. TOPO cloning-derived pCRII_Bcl2l11 was used as a template for two-step site-directed mutagenesis. Sequence analysis identified the L128 and F135 sites in zebrafish Bcl2l11, to be equivalent to L152 and F159 in mammalian BCL2L11. Two-step site-directed mutagenesis was performed to generate Bcl2l11L128E,F135E (hereafter called Bcl2l11[EE]) followed by add on PCR of a 5’ attL1 site, Kozak sequence, His-tag and a 3’ attL2 site using M13F. All PCR products were processed as described above for atg5, generating pME_FLAG-atg4b_C74A and pME_His-bcl2l11[EE] clones. In pilot experiments using both wild-type zebrafish and embryos injected with zebrafish cDNA constructs, zebrafish Atg5 protein could be detected using antibodies raised against a synthetic peptide of ATG5 (Abcam, ab108327) whereas Bcl2l11[EE] and Atg4b proteins could not be detected with commercially available antibodies (raised against mouse or human forms of these proteins), hence the bcl2l11[EE] and atg4b_C74A constructs were tagged with His and Flag tags, respectively. mRFP-GFP-LC3 (a gift from T. Yoshimori, Osaka University, Japan) was excised from the original plasmid (described in [Citation43]) using NheI and SacII and cloned into the pME-MCS vector [Citation42] at SpeI and SacII sites. Zebrafish map1lc3b (hereafter called lc3) was amplified from cDNA using sequence-specific primers with additional BspeI and SacI sites and these sites were used to replace rat LC3 in the pME-mRFP-GFP-LC3 construct to create pME-mRFP-GFP-lc3. Dendra2 was excised from pDendra2 plasmid (Evrogen, FP821) and subcloned into the pME-MCS vector at Nhe1 and Sac1 sites to create pME-Dendra2. All primers used in construct generation are provided in Table S1.
The transgenic constructs pTol2 _UAS:atg5-polyA, pTol2 _UAS:FLAG-atg4b_C74A-polyA, pTol2 _UAS: His-bcl2l11[EE]-polyA, pTol2_UAS:mRFP-GFP-lc3-polyA and pTol2_UAS:Dendra2-polyA were generated via Gateway recombination using the pME vectors described above together with p5E-UAS and p3E-polyA components of the Tol2 kit within a destination vector (pDestTol2CG2) [Citation42] according to the manufacturer’s procedures. All of the above transgenic constructs contain reporter comprising the myosin light chain 7 promoter driving EGFP (myl7:EGFP) as a selection marker to allow the identification of UAS-transgene-positive offspring. The ubiquitin enhancer construct driving ERT2-Gal4-VP16 (ubb:ERT2-Gal4-VP16) and the neuronal (HuC) enhancer/promoter construct driving ERT2-Gal4-VP16 (elavl3:ERT2-Gal4-VP16) containing a miniTol2 backbone and an alpha-crystallin:RFP (cryaa:RFP) cassette as selection marker were kindly provided by Sebastian S. Gerety (Wellcome Sanger Institute, UK) [Citation7]. The UAS:EGFP line was a gift from Kate Lewis (Syracuse University, NY), generated using components of the Tol2kit by Gustavo Cerda (University of Cambridge, UK). A list of the transgenic constructs generated is provided in .
Table 1. Injected plasmids.
Plasmid injections and generation of transgenic fish
On the day of injection, the DNA constructs and Tol2 transposase mRNA were prepared at a final concentration of 80 ng/µl of DNA and 25 ng/µl of RNA in Danieau’s solution (58 mM NaCl, 0.7 mM KCl, 0.4 mM MgSO4.7H2O, 0.6 mM Ca[NO3]2, 5 mM HEPES, pH 7.6) containing 20% phenol red as previously described [Citation10]. The DNA/mRNA mixture was injected into the cell of 1 cell-stage embryos of wild-type zebrafish. At 3 d.p.f., embryos were selected based on the expression of selection markers (cryaa:RFP results in red fluorescent protein expression in the lenses in the ERT2-Gal4 lines and myl7:EGFP results in green fluorescent hearts in the UAS lines). Embryos with positive signal, observed using mRFP and EGFP filter sets on an Olympus SZX12 stereo fluorescence microscope, were raised to adulthood. Adult G0 were outcrossed to TL or AB wild-type fish and the F0 generation was screened to identify embryos with green hearts or red lenses. These embryos were raised to establish transgenic heterozygous lines which have subsequently been bred for at least 3 generations. A list of the zebrafish lines generated in this study is provided in .
Experimental crosses
Offspring of crosses of ubb:ERT2-Gal4 or elavl3:ERT2-Gal4 with UAS:EGFP, UAS:Dendra2 or UAS:mRFP-GFP-lc3 were used to optimize tamoxifen treatments. Embryos and larvae for autophagy regulation experiments were generated from crosses of ubb:ERT2-Gal4 fish with each of the UAS-driven autophagy modulator lines (ubb:ERT2-Gal4 x UAS:FLAG-atg4b_C74A, ubb:ERT2-Gal4 x UAS:atg5, ubb:ERT2-Gal4 x UAS:His-bcl2l11[EE]). From experimental crosses, fish were screened for GFP expression in hearts (selection marker for UAS-lines) and RFP expression in lenses (selection marker for ubb:ERT2-Gal4 and elavl3:ERT2-Gal4 positive fish) and selected and sorted into groups for subsequent analysis (negative for one or both transgenes vs both GFP positive and RFP positive). To image and analyze autophagic vesicles upon Atg5 overexpression, offspring from ubb:ERT2-Gal4 x UAS:atg5 cross were injected with 40 ng/µL of pTol2_UAS:mRFP-GFP-lc3-polyA DNA and 25 ng/µl of transposase RNA in Danieau’s solution containing 20% phenol red. Larvae were reared in EM and treated with 0.003% phenylthiourea from 24 h post-fertilization (h.p.f.) to prevent pigmentation. Activation of the Gal4-UAS system was induced by the addition of 0.1–3 μM tamoxifen at 6 h.p.f. – 8 h.p.f. with daily replenishment of EM and tamoxifen at same concentration until 96 h.p.f., prior collection for imaging. For puncta analysis, larvae with mosaic fluorescent expression of the mRFP-GFP-lc3 reporter were screened and selected under a fluorescent microscope with EGFP and RFP filters. All larvae with mosaic expression of the mRFP-GFP-lc3 construct were positive for GAL4 (red lenses). Atg5 overexpressing larvae were identified by their bright and homogeneous fluorescent green heart, whereas controls (with no Atg5 expression but with mRFP-GFP-lc3 signal) were distinguished by mosaic cardiac GFP expression resulting from mRFP-GFP-lc3 reporter DNA injection. At 96 h.p.f., larvae were anaesthetized by immersion in 0.2 mg/ml 3-amino benzoic acid ethylester (MS222, also known as tricaine), fixed in 4% PFA for 2 h at room temperature and washed in PBS. Larvae were kept in PBS at 4°C and were imaged within 24 h of fixation.
Confocal microscopy
Analysis of mRFP-EGFP-lc3 puncta was performed on fixed transgenic larvae at 96 h.p.f. mounted in 0.75% low melting point agarose in embryo medium in a confocal imaging chamber. Muscle cells were imaged using a Leica SP8 confocal with a 40x oil-immersion objective and an optical magnification of x2 using the 488 nm excitation laser to image the GFP signal and 552 nm excitation laser for RFP. Green and red emission signals were detected and collected in the ranges of 491 nm-564 nm and 565 nm-750 nm, respectively, and imaged sequentially to avoid crosstalk. 1-micron-step z-stacks were taken of whole muscle cells. A minimum of 53 muscle cells in 25 larvae were imaged per group. Confocal images were analyzed using FIJI software (ImageJ). Each z-stack was converted to a maximum intensity projection image and the numbers of red and green puncta were counted manually. The area of the cell was measured by creating a region of interest (ROI) delimiting the cell shape and confirming the boundary in images from both channels. To analyze the size of the autophagic vesicles, maximum intensity projections were converted to binary images. The size of all vesicles within each cell was measured using the “analyze particles” tool in ImageJ.
Western blotting
Western blots were performed as previously described [Citation10] with minor modifications. 10 larvae were collected per sample and each experiment was performed in triplicate. Total protein for each lysate was determined using a BCA assay (Sigma). 30 µg of protein was loaded per lane. Immunoreactive bands were then detected using Enhanced Chemiluminescent substrate (GE Healthcare Bioscience) then either mounted in cassettes for exposure with Amersham Hyperfilm and processed using a Fuji FPM 100A and scanned using an A4 flatbed scanner for analysis on the computer or membranes were imaged using a LI-COR Odyssey-Fc, model 2800, and Image Studio Version 5.2 software. Densitometry was performed using Fiji. Background was subtracted from images and the image is inverted to obtain a black background and white bands. A rectangular region of interest (ROI) around the biggest band was drawn then copied to the other bands. Integrated Density was measured within the ROIs. The ratio of Integrated Density of the bands corresponding to a specific antibody and its respective loading control was used for the normalization. All antibodies were tested with a range of protein concentrations to ensure that experimental samples were analyzed within the linear detection range. The following antibodies were used: mouse anti-ACTB/β-actin antibody (Sigma), dilution 1:1000; mouse anti-His antibody (Qiagen), dilution 1:1000; rabbit anti-ATG5 antibody (Abcam), dilution at either 1:250 or 1:1000; rabbit anti-LC3B (Novus Biologicals), dilution 1:1000; rabbit anti-GFP antibody (Abcam) dilution 1:1000; mouse anti-FLAG (Sigma), dilution 1:1000. Further details of antibodies used in this study are provided in .
Table 3. Antibodies.
Tamoxifen treatment
A 100 mM stock of 4-OH-tamoxifen (Sigma) in dimethyl sulfoxide (DMSO) was prepared and stored at −20°C. To induce gene expression in experimental crosses, varying concentrations of tamoxifen were added to the embryo medium at different timepoints, from 6–8 h.p.f. onwards. Embryos were left in their chorions until autonomous hatching as pilot experiments demonstrated that gene expression could be induced without chorion removal. Final concentrations used in this study ranged from 0.1 µM to a maximum of 3 µM. Initial treatment was followed by daily exchange of half of the volume of embryo medium with replenishment of 50% of the initial tamoxifen concentration as a standard procedure.
Ammonium chloride treatment
Ammonium chloride was dissolved in EM and used at a final concentration of 10 mM. Ammonium chloride (NH4Cl) treatment is used to block lysosome acidification and therefore block autophagic flux. Treatment was for 4 h immediately prior to the collection of larvae for western blotting.
Analysis of rod photoreceptor degeneration
Photoreceptor analysis was performed as described [Citation19], with the following modifications. Photoreceptor counting was performed using the Fiji software (ImageJ). Briefly, the fluorescent photoreceptors were measured by selecting regions of interest after conversion to binary images. The total GFP-positive photoreceptor area measurement was used as a surrogate for total photoreceptor number.
Statistical analysis
Data were analyzed using GraphPad 7.04 software. Multiple comparisons were calculated for statistical significance using one-way-ANOVA test followed by Tukey’s multiple comparisons test. Comparison of two conditions was performed using paired and unpaired t-tests, as appropriate. Data are presented as mean ± standard error the mean (SEM) or standard deviation (SD). P < 0.05 was considered significant.
Supplemental Material
Download MS Word (375 KB)Acknowledgments
We are grateful for funding from the UK Dementia Research Institute (funded by the MRC, Alzheimer’s Research UK and the Alzheimer’s Society), the Tau Consortium, Alzheimer’s Research UK and a Postdoctoral Fellowship from the Basque Government (EJ-GV. POS_2018_1_0019) in Achucarro Basque Center for Neuroscience awarded to Gentzane Sanchez-Elexpuru. Lars Schlotawa was supported by the German Research Foundation (DFG, grant SCHL 2078/1-1). Sylwia Tyrkalska was supported by the European Union’s Horizon 2020 research and innovation program under the Marie Skłodowska-Curie Grant (grant number 746509) and the Guarantors of Brain Non-Clinical Post-Doctoral Fellowship. We thank S. Gerety and T. Yoshimori for sharing constructs and Kate Lewis for use of the UAS:EGFP zebrafish line.
Disclosure statement
No potential conflict of interest was reported by the author(s).
Supplementary material
Supplemental data for this article can be accessed online at https://doi.org/10.1080/15548627.2022.2135824
Additional information
Funding
References
- Rubinsztein DC, Bento CF, Deretic V. Therapeutic targeting of autophagy in neurodegenerative and infectious diseases. J Exp Med. 2015;212(7):979–990.
- Dikic I, Elazar Z. Mechanism and medical implications of mammalian autophagy. Nat Rev Mol Cell Biol. 2018;19(6):349–364.
- Brand AH, Perrimon N. Targeted gene expression as a means of altering cell fates and generating dominant phenotypes. Development. 1993;118(2):401–415.
- Kawakami K, Asakawa K, Hibi M, et al. Gal4 driver transgenic zebrafish: powerful tools to study developmental biology, organogenesis, and neuroscience. Adv Genet. 2016;95:65–87.
- Branda CS, Dymecki SM. Talking about a revolution: the impact of site-specific recombinases on genetic analyses in mice. Dev Cell. 2004;6(1):7–28.
- Braun SM, Machado RA, Jessberger S. Temporal control of retroviral transgene expression in newborn cells in the adult brain. Stem Cell Reports. 2013;1(2):114–122.
- Gerety SS, Breau MA, Sasai N, et al. An inducible transgene expression system for zebrafish and chick. Development. 2013;140(10):2235–2243.
- Mizushima N. The ATG conjugation systems in autophagy. Curr Opin Cell Biol. 2020;63:1–10.
- Hu ZY, Chen B, Zhang JP, et al. Up-regulation of autophagy-related gene 5 (%B. J Biol Chem. 2017;292(44):18062–18074.
- Lopez A, Lee SE, Wojta K, et al. A152T tau allele causes neurodegeneration that can be ameliorated in a zebrafish model by autophagy induction. Brain. 2017;140(4):1128–1146.
- Pyo JO, Yoo SM, Ahn HH, et al. Overexpression of Atg5 in mice activates autophagy and extends lifespan. Nat Commun. 2013;4(1):2300.
- Nakatogawa H, Ishii J, Asai E, et al. Atg4 recycles inappropriately lipidated Atg8 to promote autophagosome biogenesis. Autophagy. 2012;8(2):177–186.
- Fujita N, Hayashi-Nishino M, Fukumoto H, et al. An Atg4B mutant hampers the lipidation of LC3 paralogues and causes defects in autophagosome closure. Mol Biol Cell. 2008;19(11):4651–4659.
- Luo S, Rubinsztein DC. BCL2L11/BIM: a novel molecular link between autophagy and apoptosis. Autophagy. 2013;9(1):104–105.
- Luo S, Garcia-Arencibia M, Zhao R, et al. Bim inhibits autophagy by recruiting Beclin 1 to microtubules. Mol Cell. 2012;47(3):359–370.
- Klionsky DJ, Abdel-Aziz AK, Abdelfatah S, et al. Guidelines for the use and interpretation of assays for monitoring autophagy (4th edition)(1). Autophagy. 2021;17:1–382.
- Lopez A, Fleming A, Rubinsztein DC. Seeing is believing: methods to monitor vertebrate autophagy. Open Biol. 2018;8(10):180106.
- Siddiqi FH, Menzies FM, Lopez A, et al. Felodipine induces autophagy in mouse brains with pharmacokinetics amenable to repurposing. Nat Commun. 2019;10(1):1817.
- Moreau K, Fleming A, Imarisio S, et al. PICALM modulates autophagy activity and tau accumulation. Nat Commun. 2014;5(1):4998.
- Bill BR, Petzold AM, Clark KJ, et al. A primer for morpholino use in zebrafish. Zebrafish. 2009;6(1):69–77.
- Sassen WAK R. A molecular toolbox for genetic manipulation of zebrafish. Adv Genom Genet. 2015;5:151–163.
- Akerberg AA, Stewart S, Stankunas K. Spatial and temporal control of transgene expression in zebrafish. PLoS One. 2014;9(3):e92217.
- Jacob J, Ribes V, Moore S, et al. Valproic acid silencing of ascl1b/Ascl1 results in the failure of serotonergic differentiation in a zebrafish model of fetal valproate syndrome. Dis Model Mech. 2014;7(1):107–117.
- Gu Q, Yang X, Lv J, et al. AIBP-mediated cholesterol efflux instructs hematopoietic stem and progenitor cell fate. Science. 2019;363(6431):1085–1088.
- Calzolari S, Terriente J, Pujades C. Cell segregation in the vertebrate hindbrain relies on actomyosin cables located at the interhombomeric boundaries. EMBO J. 2014;33(7):686–701.
- Saitoh S, Maruyama T, Yako Y, et al. Rab5-regulated endocytosis plays a crucial role in apical extrusion of transformed cells. Proc Natl Acad Sci U S A. 2017;114(12):E2327–E36.
- Sinha DK, Neveu P, Gagey N, et al. Photocontrol of protein activity in cultured cells and zebrafish with one- and two-photon illumination. Chembiochem. 2010;11(5):653–663.
- Lu X, Agasti SS, Vinegoni C, et al. Optochemogenetics (OCG) allows more precise control of genetic engineering in mice with CreER regulators. Bioconjug Chem. 2012;23(9):1945–1951.
- Feng Z, Nam S, Hamouri F, et al. Optical control of tumor induction in the Zebrafish. Sci Rep. 2017;7(1):9195.
- Goll MG, Anderson R, Stainier DY, et al. Transcriptional silencing and reactivation in transgenic zebrafish. Genetics. 2009;182(3):747–755.
- Rafferty SA, Quinn TA. A beginner’s guide to understanding and implementing the genetic modification of zebrafish. Prog Biophys Mol Biol. 2018;138:3–19.
- De Paoli HC, Tuskan GA, Yang X. An innovative platform for quick and flexible joining of assorted DNA fragments. Sci Rep. 2016;6(1):19278.
- Kawakami K, Abe G, Asada T, et al. zTrap: zebrafish gene trap and enhancer trap database. BMC Dev Biol. 2010;10(1):105.
- Scott EK, Baier H. The cellular architecture of the larval zebrafish tectum, as revealed by gal4 enhancer trap lines. Front Neural Circuits. 2009;3:13.
- Tabor KM, Marquart GD, Hurt C, et al. Brain-wide cellular resolution imaging of Cre transgenic zebrafish lines for functional circuit-mapping. Elife. 2019;8(8):e42687.
- Aizawa H, Goto M, Sato T, et al. Temporally regulated asymmetric neurogenesis causes left-right difference in the zebrafish habenular structures. Dev Cell. 2007;12(1):87–98.
- Venero Galanternik M, Nikaido M, Yu Z, et al. Localized Gene Induction by Infrared-Mediated Heat Shock. Zebrafish. 2016;13(6):537–540.
- Shoji W, Sato-Maeda M. Application of heat shock promoter in transgenic zebrafish. Dev Growth Differ. 2008;50(6):401–406.
- Auer TO, Duroure K, Concordet JP, et al. CRISPR/Cas9-mediated conversion of eGFP- into Gal4-transgenic lines in zebrafish. Nat Protoc. 2014;9(12):2823–2840.
- Kimura Y, Hisano Y, Kawahara A, et al. Efficient generation of knock-in transgenic zebrafish carrying reporter/driver genes by CRISPR/Cas9-mediated genome engineering. Sci Rep. 2014;4(1):6545.
- Kimmel CB, Ballard WW, Kimmel SR, et al. Stages of embryonic development of the zebrafish. Dev Dyn. 1995;203(3):253–310.
- Kwan KM, Fujimoto E, Grabher C, et al. The Tol2kit: a multisite gateway-based construction kit for Tol2 transposon transgenesis constructs. Dev Dyn. 2007;236(11):3088–3099.
- Kimura S, Noda T, Yoshimori T. Dissection of the autophagosome maturation process by a novel reporter protein, tandem fluorescent-tagged LC3. Autophagy. 2007;3(9):452–460.