
ABSTRACT
Ischemia-induced angiogenesis is critical for blood flow restoration and tissue regeneration, but the underlying molecular mechanism is not fully understood. ATG7 (autophagy related 7) is essential for classical degradative macroautophagy/autophagy and cell cycle regulation. However, whether and how ATG7 influences endothelial cell (EC) function and regulates post-ischemic angiogenesis remain unknown. Here, we showed that in mice subjected to femoral artery ligation, EC-specific deletion of Atg7 significantly impaired angiogenesis, delayed the recovery of blood flow reperfusion, and displayed reduction in HIF1A (hypoxia inducible factor 1 subunit alpha) expression. In addition, in cultured human umbilical vein endothelial cells (HUVECs), overexpression of HIF1A prevented ATG7 deficiency-reduced tube formation. Mechanistically, we identified STAT1 (signal transducer and activator of transcription 1) as a transcription suppressor of HIF1A and demonstrated that ablation of Atg7 upregulated STAT1 in an autophagy independent pathway, increased STAT1 binding to HIF1A promoter, and suppressed HIF1A expression. Moreover, lack of ATG7 in the cytoplasm disrupted the association between ATG7 and the transcription factor ZNF148/ZFP148/ZBP-89 (zinc finger protein 148) that is required for STAT1 constitutive expression, increased the binding between ZNF148/ZFP148/ZBP-89 and KPNB1 (karyopherin subunit beta 1), which promoted ZNF148/ZFP148/ZBP-89 nuclear translocation, and increased STAT1 expression. Finally, inhibition of STAT1 by fludarabine prevented the inhibition of HIF1A expression, angiogenesis, and blood flow recovery in atg7 KO mice. Our work reveals that lack of ATG7 inhibits angiogenesis by suppression of HIF1A expression through upregulation of STAT1 independently of autophagy under ischemic conditions, and suggest new therapeutic strategies for cancer and cardiovascular diseases.
Abbreviations: ATG5: autophagy related 5; ATG7: autophagy related 7; atg7 KO: endothelial cell-specific atg7 knockout; BECN1: beclin 1; ChIP: chromatin immunoprecipitation; CQ: chloroquine; ECs: endothelial cells; EP300: E1A binding protein p300; HEK293: human embryonic kidney 293 cells; HIF1A: hypoxia inducible factor 1 subunit alpha; HUVECs: human umbilical vein endothelial cells; IFNG/IFN-γ: Interferon gamma; IRF9: interferon regulatory factor 9; KPNB1: karyopherin subunit beta 1; MAP1LC3A: microtubule associated protein 1 light chain 3 alpha; MEFs: mouse embryonic fibroblasts; MLECs: mouse lung endothelial cells; NAC: N-acetyl-l-cysteine; NFKB1/NFκB: nuclear factor kappa B subunit 1; PECAM1/CD31: platelet and endothelial cell adhesion molecule 1; RELA/p65: RELA proto-oncogene, NF-kB subunit; ROS: reactive oxygen species; SP1: Sp1 transcription factor; SQSTM1/p62: sequestosome 1; STAT1: signal transducer and activator of transcription 1; ULK1: unc-51 like autophagy activating kinase 1; ulk1 KO: endothelial cell-specific ulk1 knockout; VSMCs: mouse aortic smooth muscle cells; WT: wild type; ZNF148/ZFP148/ZBP-89: zinc finger protein 148.
Introduction
Angiogenesis, the growth and proliferation of blood vessels from an existing vascular network, is essential for many physiological processes, such as embryogenesis, tissue repair, and organ regeneration [Citation1]. This process needs to be finely balanced, because excessive or insufficient angiogenesis contributes to a number of pathologies, including myocardial infarction, diabetic retinopathy, rheumatoid arthritis, cancer, etc [Citation2,Citation3]. The mechanisms that control angiogenesis are regulated by several pro- and anti-angiogenic factors that are mainly stimulated by oxygen deficiency, including VEGF (vascular endothelial growth factor) and EPO (erythropoietin) [Citation4,Citation5]. Most transcriptional responses to oxygen deficiency are mediated by HIFs (hypoxia inducible factors) that control the expression of numerous angiogenic, metabolic, and cell cycle genes [Citation6,Citation7]. Accordingly, the HIF pathway is currently considered as a master regulator of angiogenesis. It is essential to gain an accurate and deep understanding of HIF transcriptional machineries related to angiogenesis in vascular disorders such as peripheral arterial disease, cerebral ischemia, and heart attack.
Autophagy is an intracellular degradation system that delivers cytoplasmic constituents to the lysosome for degradation [Citation8,Citation9]. Autophagy has been implicated in many pathophysiological processes, including cancer, metabolic disorders, neurodegenerative diseases, and cardiovascular diseases [Citation10]. Moreover, increasing evidence suggests a controversial correlation between angiogenesis and autophagy. For example, Kringle 5 of human plasminogen, a potent inhibitor of endothelial cell growth, induces autophagy and concurrently inhibits angiogenesis in absence of nutritional stress or hypoxia [Citation11]. Mice deficient in the autophagic protein BECN1/ Beclin1 display a[Citation12] pro-angiogenic phenotype. Inhibition of autophagy by 3-methyladenine (3-MA) or siRNA against Atg5 (autophagy related 5) reduces angiogenesis while induction of autophagy by overexpression of Atg5 promotes angiogenesis [Citation13]. In the myocardium, activation of autophagy during ischemia is essential for cell survival [Citation14–16]. However, the precise role of autophagy in angiogenesis requires more detailed research.
The molecular machinery of autophagy has been identified in both yeast and mammals, and a number of genes encoding components of autophagy machinery, named ATG (autophagy related), have been characterized [Citation17,Citation18]. Among these proteins, several core proteins, including ATG5 and ATG7, have long been believed to be essential for autophagy [Citation19]. The absence of ATG5 leads to functional inhibition of the autophagy. Previous work has shown that endothelial-specific deficiency of ATG5 attenuates pathological hypoxia-reoxygenation-related neovascularization through suppression of autophagy [Citation20]. ATG7 is required for the conjugation of ATG12 to ATG5 as an E1-like enzyme, and is specifically involved in autophagosome formation [Citation21]. Deletion of ATG7 severely impairs autophagy, leading to mitochondrial dysfunction, endoplasmic reticulum stress, reactive oxygen species overproduction, and inhibition of protein secretion [Citation22–27]. In addition, several autophagy-independent functions of ATG7 have been described. Upon starvation, ATG7 interacts with TP53/p53 to inhibit the expression of pro-apoptotic genes. Accordingly, Atg7 deletion increases DNA damage and promotes apoptotic cell death [Citation28]. Another study also shows that ATG7 represses the pro-apoptotic properties of caspase 9 [Citation29]. This E1 enzymatic independent function of ATG7 might be implicated in other pathological conditions [Citation30,Citation31]. It is reported that under normoxic conditions, vascular density in skeletal muscle is indistinguishable between wild-type (WT) and EC-specific atg7 knockout (atg7 KO) mice, but brain microvessel density of atg7 KO mice is significantly decreased [Citation26,Citation32], which is accompanied by inhibiting nuclear translocation of NFKB subunit RELA/p65 that reduces IL6 (interleukin 6) production [Citation32]. However, it is not clear whether the regulation of RELA/p65 nuclear translocation by ATG7 is dependent or independent of autophagy. Since ATG7 is induced by hypoxia [Citation33], induction of endothelial cell apoptosis may limit unwanted neovascularization of tumors, and prevention of endothelial cell apoptosis may improve angiogenesis and vasculogenesis in patients with ischemia [Citation34], it is important to understand whether and how the autophagy-independent functions of ATG7 influence endothelial cell function and regulate post-ischemic angiogenesis.
In the current study, using a mouse hindlimb ischemia model, we show inhibition of angiogenesis and impairment of blood flow recovery after hindlimb ischemia in EC-specific atg7 KO mice. The loss of Atg7 reduces HIF1A expression by upregulating Stat1 in an autophagy-independent manner. Our findings uncover a novel direct link between ATG7 and post-ischemic angiogenesis and may lead to novel therapeutic strategies in the treatment of cancer or ischemic cardiovascular disorders.
Results
Angiogenesis is inhibited in endothelial-specific atg7 knockout mice subjected to femoral artery ligation
To determine the role of ATG7 in angiogenesis, we generated endothelial atg7-specific knockout mice by mating female Atg7flox/flox mice with male Cdh5-Cre mice, and the offspring was genotyped by PCR [Citation21]. The mice with genotype Atg7flox/flox/Cdh5-Cre+ were referred as to atg7 KO, and the littermates with genotype Atg7flox/flox/Cdh5-Cre− were used as wild-type (WT) control (). We examined ATG7 protein expression in isolated mouse lung endothelial cells (MLECs) and mouse aortic smooth muscle cells (VSMCs) by western blotting and found that endothelial ATG7 protein expression was abolished in atg7 KO mice. However, deletion of endothelial Atg7 gene did not affect ATG7 protein expression in VSMCs isolated from atg7 KO mouse aortas, confirming specific knockout of Atg7 in endothelial cells (). To determine the effects of endothelial Atg7 deletion on angiogenesis in vivo, we performed femoral artery ligation in WT and atg7 KO mice at the age of 8 to 10 weeks and monitored blood flow restoration on 1, 3, 7, 14, 21, and 28 day after surgery by Laser Doppler Imaging (). Four weeks post-surgery, the blood flow ratio returned to 1.04 ± 0.14 in WT mice, however, the blood flow ratio only recovered to 0.70 ± 0.11 in atg7 KO mice (), indicating an obvious impairment in perfusion recovery in atg7 KO mice.
Figure 1. Endothelial Atg7 deletion impairs blood perfusion recovery and angiogenesis in mouse ischemic hind limbs. (a) Genotyping of WT (wild-type, Atg f/f/cdh5−) and atg7 KO (atg7 endothelial cell specific knockout, Atg7 f/f/cdh5+) mice. (b) Western blot analysis of ATG7 in mouse lung endothelial cells (MLECs) and arterial smooth muscle cells (VSMCs) isolated from WT and atg7 KO mice. (c and d) Femoral artery ligation was performed on 8- to 10-week-old WT and atg7 KO mice. Representative images showing blood flow reperfusion assessed by Doppler laser ultrasound after ischemic injury (c). Blood flow was detected by laser Doppler at the indicated time points. The ratio of ischemic:non-ischemic perfusion, N = 7 for each group. * P < 0.05, ** p < 0.01; *** p< 0.001 (d). (e) Representative images of immunostaining for PECAM1/CD31 in gastrocnemius muscles of mice subjected to femoral artery ligation. Scale bar: 50 µm. (f) Quantification of immunohistochemistry staining for PECAM1/CD31. N = 6 for each group, *** p< 0.001. (g) Representative images of immunostaining for ATG7 in gastrocnemius muscles of mice subjected to femoral artery ligation. Scale bar: 50 µm. (h) Quantification of immunohistochemistry staining for ATG7. N = 7 for each group, * p < 0.05, *** p< 0.001. (i) Representative images of immunostaining for SQSTM1/p62 in gastrocnemius muscles of mice subjected to femoral artery ligation. Scale bar: 20 µm. (j) Quantification of immunohistochemistry staining for SQSTM1/p62. N = 5–6 for each group, ** p < 0.01, ns, not significant.
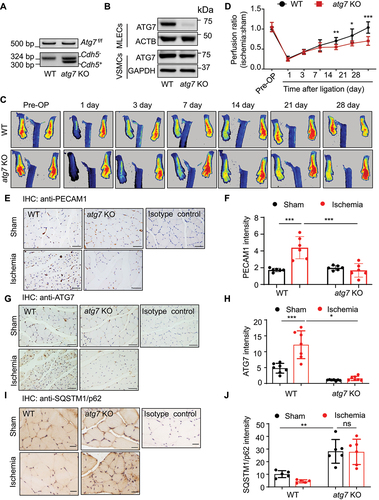
We further assessed angiogenesis by immunostaining of PECAM1/CD31 (platelet and endothelial cell adhesion molecule 1) in ischemic tissues. There was no obvious difference in the number of PECAM1/CD31-positive capillaries surrounding the gastrocnemius muscle fibers between atg7 KO mice and their WT littermates in sham-operated condition (). Four weeks post ischemic insult, there was a significant increase in the number of PECAM1/CD31-positive capillaries in WT mice. However, the increase in the PECAM1/CD31-positive capillary was attenuated in atg7 KO mice (). Thus, Atg7 deficiency delayed the ischemia-induced angiogenesis in vivo.
We also determined the effect of ischemia on autophagy activity. In WT mice, femoral artery ligation significantly increased the immunostaining intensity of ATG7 compared with sham surgery. Deletion of Atg7 prevented femoral artery ligation-increased ATG7 protein expression (). Concomitantly, in WT mice, protein level of SQSTM1/p62 (sequestosome 1), an autophagic flux marker, was significantly lower (P < 0.05) in the femoral artery ligation group than that in the sham-operated group. Lack of Atg7 enhanced SQSTM1/p62 in sham-operated mice and prevented femoral artery ligation-reduced SQSTM1/p62 protein expression (), suggesting that femoral artery ligation increases autophagic flux. Similarly, in cultured HUVECs, compared with normoxic treatment, hypoxia upregulated ATG7 protein expression and activated autophagy, as indicated by increased MAP1LC3A/LC3 (microtubule associated protein 1 light chain 3 alpha)-II:LC3-I ratio and decreased SQSTM1/p62 protein level (Figure S1a,b).
Next, we assessed the effects of Atg7 deficiency on ECs migration in vitro. Wound healing assay showed that HUVECs transfected with ATG7 siRNA exhibited impaired cell migration compared with the HUVECs transfected with control siRNA (Figure S1c,d). In addition, spheroid-sprouting assay revealed a reduction in sprout length in ATG7-deficient endothelial cells (Figure S1e,f), suggesting that ATG7 deficiency inhibits EC migration. Given that pericytes are critically involved in angiogenic response [Citation35], we determined whether deletion of Atg7 affects pericyte function by immunofluorescence staining of pericyte markers, DES (desmin) and NG2 proteoglycan, in WT and atg7 KO retinas. The staining of both DES (Figure S1g,h) and NG2 proteoglycan (Figure S1lj) was comparable between WT and atg7 KO retinas, suggesting lack of Atg7 has no effect on pericyte coverage.
To determine whether suppression of endothelial autophagy regulates angiogenesis in vivo, we knocked out endothelial Ulk1 (unc-51 like autophagy activating kinase), an important molecule in regulating autophagy initiation [Citation36], to generate ulk1 endothelial cell-specific knockout (ulk1 KO) mice. Western blot analysis of ULK1 protein expression in MLECs demonstrated that endothelial ULK1 protein expression was abolished in ulk1 KO mice, indicating knockout of Ulk1 in endothelial cells (Figure S2a). To determine the effect of Ulk1 deletion on autophagy, we detected protein level of SQSTM1/p62 and MAP1LC3A/LC3-II:LC3-I ratio. In ulk1 KO MLECs, SQSTM1/p62 protein level was significantly (P< 0.05) increased whereas LC3-II:LC3-I ratio was reduced (Figure S2b,c), indicating autophagic flux suppression. We then determined the effect of autophagy suppression on angiogenesis by performing femoral artery ligation in WT and ulk1 KO mice at the age of 8 to 10 weeks, and monitored blood flow restoration on 1, 3, 7, 14, 21, and 28 days after surgery by Laser Doppler Imaging (Figure S2e). Four weeks post-surgery, the blood flow ratios were comparable between WT and ulk1 KO mice (Figure S2d), indicating that suppression of autophagy by Ulk1 deletion had no significant effect on perfusion recovery.
Lack of ATG7 inhibits HIF1A expression and tube formation
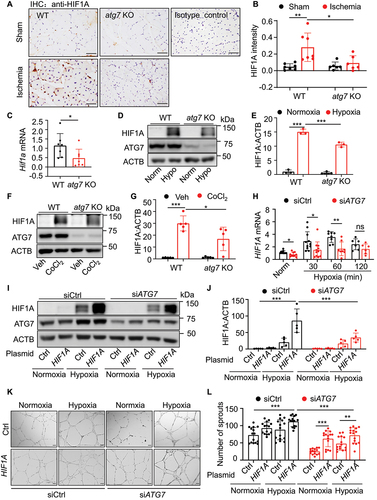
Given that HIF1A is a key modulator of the transcriptional response to hypoxic stress and plays a critical protective role in ischemic cardiovascular diseases by regulating angiogenesis and vascular remodeling [Citation37], we detected HIF1A expression using immunohistochemistry in gastrocnemius muscles of WT and atg7 KO mice subjected to femoral artery ligation (). The result showed that the ligation significantly increased HIF1A expression in ischemic limbs of WT mice, while the ligation failed to upregulate HIF1A expression in atg7 KO mice (), suggesting that Atg7-deficiency inhibits ischemia-induced HIF1A expression. We further investigated whether hypoxia regulates HIF1A expression in MLECs isolated from WT and atg7 KO mice. Deletion of Atg7 significantly reduced Hif1a mRNA expression (), and hypoxia increased HIF1A protein level in WT MLECs, whereas the hypoxia-induced HIF1A expression was attenuated in atg7 KO MLECs (). Similarly, treatment of MLECs with cobalt chloride (CoCl2), a well-known hypoxia mimetic mediator [Citation38,Citation39], increased HIF1A expression in WT MLECs, and deletion of Atg7 lessened the CoCl2-upregulated HIF1A expression (). Similar results were observed in HUVECs transfected with control siRNA (siCtrl) or ATG7 siRNA (siATG7; Figure S3a–d). However, overexpression of ATG7 did not influence HIF1A expression in both normoxic and hypoxic conditions (Figure S3e,f). Notably, ATG7 deficiency did not prevent hypoxia-upregulated HIF2A protein expression (Figure S3g,h). Since HIF1A is an early response gene [Citation40], we examined HIF1A mRNA expression in HUVECs transfected with siCtrl or siATG7 at 30, 60, and 120 min after exposure to hypoxia. The results showed that ATG7 deficiency depressed hypoxia-induced HIF1A mRNA expression at these time points (). To determine whether reduction in HIF1A mediates ATG7-deficiency-inhibited angiogenesis, we analyzed tube formation in HUVECs co-transfected with HIF1A plasmid and ATG7 siRNA. As depicted in , hypoxia upregulated HIF1A expression in siCtrl-treated cells. The transfection of HIF1A plasmid increased HIF1A in normoxic condition and induced a further increase in HIF1A in hypoxic condition. However, in the cells transfected with siATG7, HIF1A expression was significantly suppressed in both normoxic and hypoxic conditions. In line with the expression of HIF1A, silencing ATG7 reduced tube formation in both normoxic and hypoxic conditions. By contrast, overexpression of HIF1A in ATG7-silenced cells attenuated the reduction in tube formation under both normoxic and hypoxic conditions (). These data suggest that ATG7 deficiency downregulates HIF1A expression at the transcriptional level and inhibits angiogenesis in vitro.
Figure 2. Lack of ATG7 inhibits hypoxia-induced HIF1A expression. (a) Representative images of immunostaining for HIF1A in gastrocnemius muscles of mice subjected to 4-week femoral artery ligation. Scale bar: 50 µm. (b) Quantification of the HIF1A staining area in gastrocnemius muscle. N = 6–7, * p < 0.05, ** p< 0.01. (c) Hif1a mRNA level was determined by RT-PCR. N = 7, * p< 0.05. (d and e) MLECs were cultured in hypoxic chamber (1% O2, 5% CO2, 94% N2) for 24 h, HIF1A protein expression was determined by western blot (d) and densitometry (e). N = 3, *** p< 0.001. (f and g) MLECs were treated with CoCl2 for 24 h. HIF1A protein expression was determined by western blot (f) and densitometry (g). N = 5, * p < 0.05, *** p < 0.001. (h) HIF1A mRNA level in HUVECs transfected with siRNA (siCtrl) or ATG7 siRNA (siATG7) was determined by RT-PCR at indicated time points. N = 6–11, * p< 0.05, ** p< 0.01; ns, not significant. (i and j) HUVECs were transfected with siCtrl, siATG7 and MYC-control (Ctrl) or MYC-HIF1A (HIF1A) plasmid for 24 h and then incubated in hypoxia chamber for another 16 h. HIF1A protein expression was analyzed by western blotting (I) and densitometry (j). N = 5, *** p< 0.001. (k) Representative images of tube formation assay from three independent experiments. Scale bar: 500 μm. (l) Quantitative analysis of the number of sprouts. N = 15 fields, ** p < 0.01, *** p < 0.001.
Upregulation of STAT1 inhibits HIF1A expression in ATG7-deficient conditions
Increasing evidence shows that HIF1A expression can be regulated at the mRNA level by transcription factors under hypoxic conditions [Citation41]. Transcription factors, such as the ISGF3 (interferon stimulated gene factor 3) complex, which is composed of STAT1, STAT2, IRF9 (interferon regulatory factor 9), STAT3, NFKB1/NFκB (nuclear factor kappa B subunit 1), NRF1 (nuclear respiratory factor 1), and BCLAF1 (BCL2 associated transcription factor 1), can bind to the HIF1A gene promoter to regulate HIF1A transcription [Citation42–46]. Therefore, we identified the potential transcriptional factors that mediate the inhibition of HIF1A expression in ATG7-deficient condition by analyzing the expression of the six transcriptional factor genes using RT-PCR. In siATG7-transfected HUVECs, STAT1 mRNA had the highest expression with an increase of 13.3 folds, and that was followed by the increase in IRF9 gene expression (4.8 folds). However, silencing ATG7 did not affect the expression of STAT3, NFKB1/NFκB, NRF1, and BCLAF1 genes ().
Figure 3. Upregulation of STAT1 inhibits HIF1A expression in ATG7-deficient conditions. (a) Expression of genes related to HIF1A expression, including STAT1, STAT3, NFKB1/NFκB, IRF9, NRF1, BCALF1 was determined by RT-PCR in control and ATG7-deficient HUVECs, N = 5, *** p< 0.001. (b) HUVECs were transfected with siCtrl, siATG7, STAT1 siRNA (siSTAT1), or siATG7 and siSTAT1 for 48 h, HIF1A mRNA expression was determined by RT-PCR. N = 8, * p < 0.05, *** p < 0.001. (c) HUVECs were transfected with siCtrl, siATG7, siSTAT1, or siATG7 and siSTAT1 for 24 h, and then incubated in hypoxic chamber for another 16 h. HIF1A protein level was measured by western blot. (d) Densitometric analysis of the western blots. N = 4, ** p < 0.01, ns, not significant. (e) HUVECs were transfected with Flag-control (Ctrl) or Flag-STAT1 (STAT1) plasmid for 24 h, and then incubated in hypoxia chamber for another 16 h. Protein levels of STAT1 and HIF1A were determined by western blot. (f) Quantitative analysis of HIF1A protein levels. N = 6, * p< 0.05, *** p < 0.001. (g) HUVECs were transfected with STAT1 or Ctrl plasmid for 24 h, HIF1A mRNA was determined by RT-PCR. N = 4, * p < 0.05. (h and i) HUVECs were transfected with siCtrl or siATG7 for 48 h and followed by hypoxia stimulation for 1 h. ChIP analysis was performed to determine the association of STAT1 and HIF1A promoter region. (h) RT-PCR products were analyzed by ethidium bromide-stained gel analysis. (I) RT-PCR quantitative analysis. N = 4, * p< 0.05, ** p < 0.01.
To determine whether STAT1 engages in ATG7-deficiency-inhibited HIF1A expression, we first silenced both ATG7 and STAT1 in HUVECs and assessed HIF1A mRNA expression in normoxic condition. We found that silencing ATG7 reduced HIF1A mRNA expression, and STAT1 knockdown enhanced HIF1A mRNA expression as compared with siCtrl and prevented the reduction in HIF1A mRNA expression in siATG7-transfected HUVECs (). We further assessed the effect of STAT1 on ATG7 deficiency-reduced HIF1A expression in normoxic and hypoxic conditions. The results demonstrated that hypoxia increased HIF1A protein expression, silencing ATG7 attenuated hypoxia-enhanced HIF1A protein level, and ATG7 deficiency-induced HIF1A reduction was prevented by silencing STAT1 (). Conversely, transfecting a plasmid encoding STAT1 significantly suppressed HIF1A mRNA expression and attenuated hypoxia-upregulated HIF1A protein expression (). Similarly, treatment of HUVECs with CoCl2 to induce hypoxia increased HIF1A protein level in the cells treated with control plasmid, and the increase in HIF1A protein expression was attenuated by overexpression of STAT1 (Figure S3l,j).
To determine that STAT1 mediates the transcriptional regulation of HIF1A by ATG7, we tested whether ATG7 affects STAT1 binding to the HIF1A gene promoter in HUVECs. Chromatin immunoprecipitation (ChIP) assay showed that silencing ATG7 significantly increased STAT1 binding to the HIF1A promotor in both normoxic and hypoxic conditions (). Taken together, upregulation of STAT1 mediates the negative regulation of HIF1A in ATG7-deficient endothelial cells.
Loss of ATG7 increases STAT1 expression and inhibits tube formation
As silencing STAT1 significantly mitigated the reduction of HIF1A expression in ATG7-deficient condition, we explored the mechanism by which ATG7 modulates STAT1 expression. As demonstrated in , deletion of Atg7 increased SQSTM1/p62 protein level and reduced the conversion of MAP1LC3A/LC3-I to MAP1LC3A/LC3-II in MLECs. Similar results were also found in HUVECs transfected with siATG7 (Figure S4a–c). In addition, treating MLECs with chloroquine (CQ) to inhibit lysosomal enzyme activity significantly increased MAP1LC3A/LC3-II:LC3-I level in WT MLECs but the effect was prevented in atg7 KO MLECs, suggesting that lack of Atg7 completely blocked the conversion of MAP1LC3A/LC3-I to MAP1LC3A/LC3-II (). The deletion of Atg7 also significantly upregulated Stat1 mRNA (), increased STAT1 protein level, and enhanced phosphorylation of STAT1 at tyrosine 701 (Y701; p-STAT1) (), but did not affect the protein levels of p-STAT6, p-STAT3, and p-STAT5 (). Also, silencing ATG7 in HUVECs upregulated STAT1 mRNA expression (Figure S4d), and increased STAT1 and p-STAT1 protein levels (Figure S4e–h), but had no effect on protein expression of STAT3, p-STAT3, STAT5, p-STAT5, and STAT6 (Figure S4i). To determine whether the regulatory effect of ATG7 on STAT1 is dependent on its role in regulating autophagy, we silenced ULK1, a key initiator of mammalian autophagy [Citation36], and observed a significant suppression of autophagy, as indicted by increased SQSTM1/p62 and reduced the ratio of MAP1LC3A/LC3-II:LC3-I (). However, suppression of autophagy by silencing ULK1 did not increase protein levels of STAT1 and p-STAT1 (). Similarly, inhibition of autophagy by either silencing SQSTM1/p62 (Figure S5a,b) or administrating CQ had no effect on STAT1 and p-STAT1 expression (Figure S5e,f). Further, inhibition of autophagy by knockout of atg5 (atg5−/−) did not upregulate Stat1 mRNA in atg5−/− mouse embryonic fibroblasts (MEFs; Figure S5g). Notably, silencing Atg7 in ulk1 KO MLECs significantly upregulated STAT1 and p-STAT1 levels (Figure S5h,i). Likewise, knocking down of ATG7 in HUVECs-transfected with ULK1 siRNA increased STAT1 and p-STAT1 protein expression (Figure S5j,k). These results suggest that ATG7 deficiency upregulates STAT1 independently of autophagy activity.
Figure 4. Deletion of Atg7 increases STAT1 expression but reduces tube formation. (a) The protein levels of SQSTM1/p62 and MAP1LC3A/LC3-II:LC3-I were determined by western blot in MLECs isolated from WT and atg7 KO mice. (b) Densitometric analysis of the blots. N = 3, ** p < 0.01; *** p < 0.001. (c and d) WT and atg7 KO MLECs were treated with or without chloroquine (CQ, 3 µM) for 24 h, MAP1LC3A/LC3-II:LC3-I protein level was detected by western blot. Densitometric analysis of the blots. N = 3, ** p < 0.01, *** p < 0.001. (e) Stat1 mRNA expression was detected by RT-PCR in MLECs isolated from WT and atg7 KO mice. N = 4, ** p < 0.01. (f) STAT1 and phospho-STAT1 (Y701) protein levels were measured by western blot. (g) Quantitative analysis of STAT1 and phosphorylated STAT1 at tyrosine 701 (Y701; p-STAT1) protein expression, N = 3–6, ** p < 0.01, *** p < 0.001. (h) Western blot analysis of phosphorylated STAT3 at serine 727 (S727; p-STAT3), phosphorylated STAT5 at tyrosine 694 (Y694; p-STAT5), and phosphorylated STAT6 at tyrosine 641 (Y641; p-STAT6) in MLECs from WT and atg7 KO mice. (i) Densitometric analysis of the blots. (j) HUVECs were transfected with siCtrl, siATG7, or ULK1 siRNA (siULK1) for 48 h, SQSTM1/p62 and MAP1LC3A/LC3-II:LC3-I protein levels were analyzed by western blot. (k) Quantitative analysis of the blots. N = 4–11, ** p < 0.01. (l) HUVECs were transfected with siCtrl, siATG7, or siULK1 for 48 h, levels of total STAT1 and p-STAT1 (Y701) were measured by western blot. (m) Quantitative analysis of STAT1 and p-STAT1 (Y701) protein expression. N = 4–9, ns, not significant. (n) HUVECs were transfected with control and STAT1 plasmid for 24 h, protein levels of STAT1 and p-STAT1 (Y701) were detected by western blot. (o and p) HUVECs were transfected with siCtrl or siATG7 for 48 h, and the cells were treated with vehicle or N-acetyl-l-cysteine (NAC, 1 mM) for additional 1 h. p-STAT1 (Y701) protein expression was measured by western blot. N = 3, *** p < 0.001, ns, not significant. (q) Tube formation assay was performed in MLECs isolated from WT and atg7 KO mice. Representative images selected from 4 independent experiments. Scale bar: 1 mm. (r) Quantitative analysis of the number of sprouts. N = 12 fields, * p < 0.05.

Given that ATG7 deficiency upregulated STAT1 protein expression, accompanied by higher level of phosphorylated STAT1, we reasoned that overexpression of STAT1 could increases phosphorylated STAT1. Indeed, transfection of HUVECs with STAT1 plasmid significantly enhanced STAT1 protein level, concurrent with increased phosphorylation of STAT1 ( N). Moreover, H2O2 and/or derived reactive oxygen species (ROS) directly activate STAT1 in cultured astrocytes [Citation47], glia [Citation48] and in vascular smooth muscle cells [Citation49], and the absence of autophagy leads to accumulation of ROS [Citation50], we further examined whether inhibition of ROS prevents STAT1 phosphorylation in ATG7-deficent condition using N-acetyl-l-cysteine (NAC), a well-known inhibitor of ROS (). The result showed that NAC had no significant effect on STAT1 phosphorylation in ATG7-deficient HUVECs.
ATG7 regulates brain angiogenesis via RELA/p65-dependent IL6 production [Citation32], suggesting that RELA/p65 could be a link between ATG7 and STAT1, we therefore determined whether RELA/p65 mediates ATG7 deficiency-enhanced STAT1 expression. Silencing ATG7 did not affect NFKB1/NFκB mRNA expression () and failed to increase the binding between RELA/p65 and HIF1A promoter (Figure S6a). In addition, silencing Rela/p65 did not reduce protein levels of STAT1 and p-STAT1 in WT MLECs and could not prevent the enhancement of STAT1 and p-STAT1 protein levels in atg7 KO MLECs (Figure S6b–d). Taken together, RELA/p65 is not involved in the upregulation of STAT1 in ATG7-deficient conditions.
To verify the inhibitory effect of ATG7 deficiency on angiogenesis in vitro, we examined whether Atg7 deficiency inhibits tube formation in cultured endothelial cells. Indeed, the tube formation was inhibited in atg7 KO MLECs () and siATG7-transfected HUVECs (Figure S4j,k), as indicated by reducing the number of sprouts. To determine whether ATG7 deficiency inhibits angiogenesis independently of autophagy, we examined the effect of autophagy inhibition on tube formation in HUVECs using SQSTM1/p62 siRNA, and found that silencing SQSTM1/p62 did not have any effect on tube formation (Figure S5c,d). Also, suppression of autophagy by silencing ULK1 did not influence tube formation in HUVECs either. However, silencing of ATG7 inhibited tube formation in HUVECs transfected with either siCtrl or siULK1 (Figure S5l,m). These data suggest that ATG7 deficiency inhibits angiogenesis in an autophagy-independent manner.
Overexpression of ATG7 has no effects on STAT1 expression and tube formation
Next, we determined the effects of ATG7 overexpression on STAT1 expression. Overexpression of ATG7 by transfecting a plasmid encoding MYC-ATG7 (ATG7) increased MAP1LC3A/LC3-II:LC3-I ratio and reduced SQSTM1/p62 protein level, indicating autophagy activation (). However, overexpression of ATG7 did not affect STAT1 and p-STAT1 (Y701) protein expression (). Moreover, RT-PCR assay demonstrated that STAT1 mRNA level in the HUVECs transfected with ATG7 plasmid was comparable with that of the HUVECs transfected with MYC-Control plasmid (Ctrl; ). Correspondingly, no obvious differences were observed in tube formation between control and ATG7-overexpressed HUVECs, as indicated by the comparable number of sprouts (). These data indicate that overexpression of ATG7 does not affect STAT1 expression although it activates autophagy, supporting that regulatory effect of ATG7 deficiency on STAT1 is independent of autophagic process.
Figure 5. Overexpression of ATG7 does not affect STAT1 protein expression and tube formation. (a) HUVECs were transfected with MYC-control (Ctrl) or MYC-ATG7 (ATG7) plasmid for 24 h. (b and c) SQSTM1/p62 and MAP1LC3A/LC3-II:LC3-I protein expression was measured by western blot. Densitometric analysis of the blots, N = 4–5, ** P < 0.01. (d) STAT1 and phospho-STAT1 (Y701) protein levels were analyzed by western blot. (e and f) Densitometric analysis of the blots, N = 7, ns, not significant. (g) STAT1 mRNA level was determined in by RT-PCR. N = 4, ns, not significant. (h) Tube formation assay was performed 24 h after transfection of Ctrl or ATG7 plasmid, three independent experiments. (i) Quantitative analysis of sprout number, N = 28 fields, ns, not significant. Scale bar: 1 mm.
Suppression of STAT1 recovers the angiogenic potential in ATG7-deficient cells
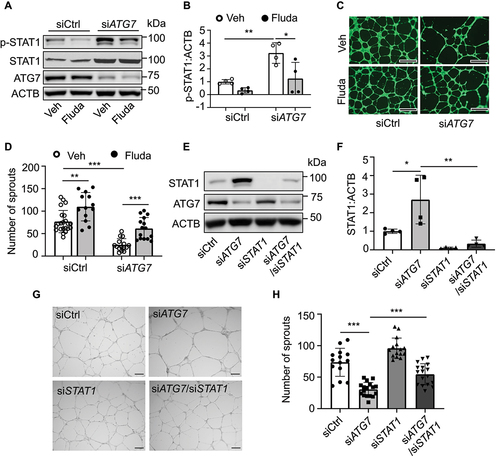
Since ATG7 deficiency significantly elevated STAT1 expression and inhibited angiogenesis, we tested if inhibition of STAT1 counteracts the inhibitory effects of ATG7 deficiency on angiogenesis. To this end, we administrated fludarabine, a STAT1 inhibitor (50 µM, 16 h), in siCtrl- and siATG7-treated HUVECs, and determined the phosphorylation of STAT1 by western blot. The result indicated that fludarabine significantly suppressed phosphorylation of STAT1 at tyrosine 701 (). Next, we examined the effects of fludarabine on tube formation in HUVECs transfected with siCtrl or siATG7, and found that silencing ATG7 reduced the number of sprouts, and the reduction in tube formation was attenuated by fludarabine treatment (). We further determined whether inhibition of STAT1 attenuates the inhibitory effect of ATG7 deficiency on tube formation by co-transfecting HUVECs with ATG7 and STAT1 siRNAs (). We observed that the co-transfection of STAT1 siRNA and ATG7 siRNA restored tube formation as compared with the transfection of siATG7 (). The results suggest that STAT1 upregulation may mediate the inhibitory effect of ATG7-deficiency on angiogenesis in vitro.
Figure 6. Suppression of STAT1 recovers the potential of tube formation in HUVECs. (a-d) HUVECs were transfected with siCtrl or siATG7 and treated with STAT1 inhibitor, fludarabine phosphate (Fluda, 50 μM) for 24 h. (a) Total STAT1 and p-STAT1 (Y701) protein levels were measured by western blot. (b) Densitometric analysis of p-STAT1 (Y701), N = 4, * p < 0.05, ** p < 0.01. (c) Tube formation assay was performed after the treatment. Scale bar: 1 mm. (d) Quantification of the number of sprouts. Three independent experiments. N = 13–22 fields, ** p< 0.01, *** p< 0.001. (e-h) HUVECs were transfected with siCtrl, siATG7, siSTAT1, or siATG7 and siSTAT1. (e) Protein levels of ATG7 and STAT1 were determined by western blot. (f) The quantification analysis of the blots. N = 4, * p < 0.05, ** p < 0.01. (g) Tube formation assay was performed after the treatment. Scale bar: 1 mm. (h) Quantification of the number of sprouts. Three independent experiments. N = 14–16 fields, *** p< 0.001.
ATG7 deficiency promotes ZNF148/ZBP-89 nuclear translocation, increasing STAT1 expression
Given that ZNF148/ZBP-89 (zinc finger protein 148) is required for constitutive STAT1 expression [Citation51], we determined whether ZNF148/ZBP-89 is involved in ATG7 regulating STAT1 expression by detecting STAT1 expression in HUVECs transfected with control siRNA (siCtrl) or ZNF148 siRNA (siZNF148). Transfection of ZNF148 siRNA downregulated STAT1 mRNA expression, and reduced STAT1 and p-STAT1 protein levels ().
Figure 7. Lack of ATG7 increases ZNF148/ZFP148/ZBP-89 nuclear translocation and STAT1 expression. (a) Western blot analysis of STAT1, p-STAT1 (Y701), and ZNF148/ZBP-89 in HUVECs transfected with siCtrl or ZNF148 siRNA (siZNF148). (b) STAT1 mRNA level was analyzed by RT-PCR. N = 3, *** p < 0.001. (c and d) Representative images of immunofluorescence staining of ZFP148/ZNF148 (C). Quantitative analysis of immunofluorescence intensity of ZFP148/ZNF148. Four independent experiments. N = 37–39 cells, *** p < 0.001 (D). (e) ZFP148/ZNF148 protein expression was measured by western blot in whole cell lysates (W), cytosol (C), and nuclear (N) fractions in MLECs isolated form WT and atg7 KO mice. (f and g) Quantitative analysis of nuclear ZFP148/ZNF148 protein levels in cell fractions, N = 4, * p < 0.05. (h) Zfp148 mRNA level was detected by RT-PCT in WT and atg7 KO MLECs. N = 5; ns, not significant. (i and j) The interaction between ATG7 and ZNF148/ZBP-89 was detected by immunoprecipitation (IP) and western blot (IB). N = 3. (k) HUVECs were transfected with siCtrl, siATG7, siZNF148, or siATG7 and siZNF148 for 48 h. STAT1 mRNA level was measured by RT-PCR. N = 4, *** p < 0.001.
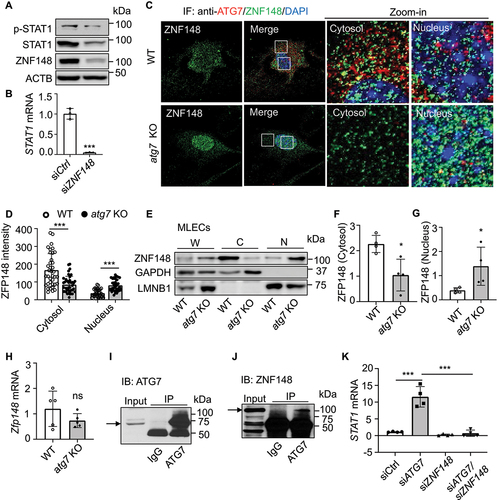
To address whether ATG7 interacts with ZNF148/ZBP-89 to regulate STAT1 expression, we examined the subcellular distribution of ATG7 and ZFP148/ZNF148 in WT and atg7 KO MLECs by immunofluorescence staining. In WT MLECs, ATG7 and ZFP148/ZNF148 were mainly present in the cytosol, in which some ATG7 staining was colocalized with ZFP148/ZNF148 staining. However, no colocalization of ATG7 and ZFP148/ZNF148 staining was observed in the nucleus. The immunofluorescence intensity of ZFP148/ZNF148 in the cytosol was significantly lower in atg7 KO MLECs relative to that of WT MLECs. However, nuclear ZFP148/ZNF148 immunofluorescence intensity was higher in atg7 KO MLECs than that in WT MLECs (). Consistently, western blot analysis of ZFP148/ZNF148 level in subcellular fractions verified that ZFP148/ZNF148 protein level in the cytosol fraction was higher in WT MLECs relative to that of atg7 KO MLECs, while nuclear ZFP148/ZNF148 protein level in WT MLECs was lower than that in atg7 KO MLECs (), suggesting that lack of ATG7 promotes ZFP148/ZNF148 nuclear translocation. Similar result was also observed in HUVECs transfected with siCtrl and siATG7 (Figure S7a,b). However, deletion of Atg7 had no effect on Zfp148 mRNA expression in MLECs (). We reasoned that ATG7-deficiency reduces the association of ATG7 and ZNF148/ZBP-89, which promotes ZNF148/ZBP-89 nuclear translocation and upregulates STAT1 expression. Thus, we investigated whether ATG7 directly associates with ZNF148/ZBP-89. Immunoprecipitation of ATG7 followed by western blotting of ZNF148/ZBP-89 showed that ATG7 indeed physically associated with ZNF148/ZBP-89 (). We further examined the effect of silencing ZNF148 on STAT1 mRNA expression in HUVECs transfected with either siCtrl or siATG7. In ATG7-deficient HUVECs, silencing ATG7 significantly increased STAT1 mRNA expression, and the increase in STAT1 mRNA was abolished by silencing ZNF148 ().
By contrast, overexpression of ATG7 did not alter ZNF148/ZBP-89 nuclear translocation manifested by immunofluorescence staining and western blot analysis of subcellular fractions in HUVECs (Figure S7c–g). Taken together, these data reveal that lack of ATG7 reduces its association with ZNF148/ZBP-89, increases ZNF148/ZBP-89 nuclear translocation, and upregulates STAT1 expression.
Identification of binding domain between ATG7 and ZNF148/ZBP-89
Since ZNF148/ZBP-89 is reported to regulate target genes by interacting with TP53/p53 [Citation52], SP1 (Sp1 transcription factor), EP300 (E1A binding protein p300) [Citation53], and STAT3 [Citation54], we determined whether ATG7 interacts with these proteins in HUVECs. The immunoprecipitation and western blot demonstrated that ATG7 did not interact with these proteins in HUVECs (), and there was no interaction between ZNF148/ZBP-89 and TP53/p53 (). To identify the region of ZNF148/ZBP-89 interacting with ATG7, we generated ZNF148 truncations fused with GST (glutathione S-transferase) (Figure S7h), overexpressed the truncations in human embryonic kidney 293 (HEK293) cells, and co-transfected the cells with MYC-ATG7 plasmid. ZNF148 truncations fused with GST were pulled down by glutathione-sepharose beads. The efficiency of overexpressing ZNF148/ZBP-89 fragments and the association between ATG7 and ZNF148/ZBP-89 were determined by blotting GST and ATG7, respectively (). The ATG7 protein interacted with full-length ZNF148/ZBP-89 and GST- ZNF148/ZBP-89 (amino acids 169–281), but did not interacted with the N-terminal (amino acids 1–168), C-terminal (amino acids 553–794), and GST- ZNF148/ZBP-89 (amino acids 282–552; ). The results indicate that ZNF148/ZBP-89 (amino acids 169–281) is required for ZNF148/ZBP-89 interacting with ATG7.
Figure 8. Lack of ATG7 increases the binding between ZNF148/ZFP148/ZBP-89 and KPNB1. (a and b) Determine the potential interacting proteins with ATG7 in HUVECs. ATG7 was immunoprecipitated by ATG7 antibody, and EP300, SP1, and STAT3 were determined by western blotting. (c) Cell lysates were prepared from cultured HUVECs, TP53 was immunoprecipitated, and ZNF148/ZBP-89 was detected by western blot. N = 3. (d and e) HEK 293 T cells were transfected with MYC-ATG7 plasmid and GST-control (GST) or GST fused with ZNF148/ZBP-89 full length or ZNF148/ZBP-89 truncations (amino acids 1–168, 169–281, 282–552, 553–794), respectively. Binding region of ZNF148/ZBP-89 on ATG7 was determined by GST immunoprecipitation. N = 4. (f) HEK 293 T cells were transfected with siCtrl or siATG7 for 48 h, the interaction of ZNF148/ZBP-89 and KPNB1 was determined by immunoprecipitation and western blot. N = 3. (g) The interaction of ZFP148/ZNF148 and KPNB1 in MLECs isolated from WT and atg7 KO mice was determined by immunoprecipitation and western blot. N = 3.
ATG7 deficiency enhances the binding between ZNF148/ZBP-89 and KPNB1
Given that the transport of molecules into and out of the nucleus is mediated by the KPNB1 superfamily [Citation55], we determined whether ATG7 deficiency affects the association of ZNF148/ZBP-89 and KPNB1 in HEK293 cells transfected with control siRNA (siCtrl) or ATG7 siRNA (siATG7). Immunoprecipitation and western blot revealed that there was rarely interaction between ZNF148/ZBP-89 and KPNB1 in HEK293 transfected with control siRNA, but the association of ZNF148/ZBP-89 and KPNB1 was significantly increased in HEK293 cells transfected with ATG7 siRNA (). Similarly, no association between ZFP148/ZNF148 and KPNB1 was observed in WT MLECs, whereas the interaction of ZFP148/ZNF148 and KPNB1 was significantly higher in atg7 KO MLECs than that in WT MLECs (), suggesting that ATG7 deficiency enhances association between ZFP148/ZNF148 and KPNB1, which promotes ZFP148/ZNF148 nuclear translocation.
Inhibition of STAT1 by fludarabine recovers blood perfusion in ischemic limbs of atg7 KO mice
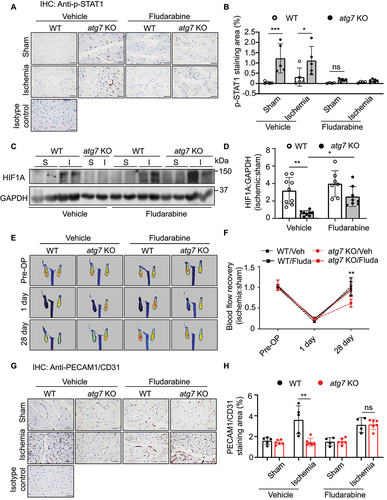
To verify that upregulation of STAT1 inhibits HIF1A-mediated angiogenesis in Atg7-deficient condition in vivo, we examined whether administration of fludarabine (100 mg/kg, i.p., once every other day) in WT and atg7 KO mice can improve angiogenesis in mouse hind limb ischemic model. Deletion of Atg7 led to an increase in p-STAT1 (Y701) protein level in both sham-operated and ischemic groups, the increase in STAT1 phosphorylation was significantly mitigated by fludarabine treatment (). At the same time, downregulation of HIF1A in atg7 KO mice was attenuated by administration of fludarabine (). In agreement with the alteration of HIF1A, Laser Doppler Imaging revealed that blood flow restoration in atg7 KO mice was significantly improved as compared with saline-treated atg7 KO mice (). In addition, reduction in PECAM1/CD31 staining in ischemic atg7 KO mice was abolished by administration of fludarabine (). To validate these results, we further determined whether silencing of Stat1 attenuates the inhibitory effect of ATG7 deficiency on angiogenesis by transfecting WT and atg7 KO aortic rings with control siRNA or Stat1 siRNA. Lack of Atg7 reduced sprout number and length in aortic rings. Transfection of Stat1 siRNA prevented the reduction of sprout number and shortening of the sprout length in atg7 KO aortic rings (Figure S8a–c), confirming that STAT1 upregulation mediates the inhibitory effect of ATG7-deficiency on angiogenesis. Taken together, inhibition of STAT1 restores HIF1A expression and angiogenesis in Atg7-deficient conditions.
Figure 9. Inhibition of STAT1 by fludarabine recovers blood flow in ischemic hind limbs of atg7 KO mice. Femoral artery ligation was performed in 8- to 10-week-old WT and atg7 KO mice. Fludarabine phosphate was administrated 1 week post ligation (100 mg/kg, i.p., once every other day). Blood flow was detected by Laser Doppler Imaging at the indicated time points. (a) Immunohistochemical staining of p-STAT1 (Y701) in the gastrocnemius muscular tissue. (b) Quantification of p-STAT1 (Y701)-positive staining area. N = 4–6, * p < 0.05, *** p < 0.001, ns, not significant. (c) Western blot analysis was used to determine HIF1A protein expression in gastrocnemius muscular tissue in WT and atg7 KO mice. (d) Densitometry analysis quantification of western blot, the ratio of ischemic limb to sham-surgery limb, N = 7–9, * p< 0.05, ** p< 0.01. S: Sham, I: Ischemia. (e) Representative images showing blood flow reperfusion assessed by Doppler laser ultrasound after ischemic injury. (f) The ratio of ischemic:non-ischemic perfusion, N = 4–7, ** p < 0.01. (g) Immunohistochemical staining of PECAM1/CD31 in the gastrocnemius muscular tissue. (h) Quantitative analysis of the ratio of PECAM1/CD31-positive staining area to muscular area, N = 4–6, ** p < 0.01; ns, not significant.
Discussion
ATG7 has been demonstrated to be essential for autophagosome biogenesis, but its role in vascular biology remains largely unknown. In the present study, using EC-specific atg7 KO mice, we found that lack of ATG7 in the cytoplasm disrupted the association between ATG7 and transcription factor ZNF148/ZBP-89 that is required for STAT1 constitutive expression [Citation51], increased the binding between ZNF148/ZBP-89 and KPNB1, which promoted ZNF148/ZBP-89 nuclear translocation, and increased STAT1 expression. STAT1 bond to HIF1A promotor and suppressed HIF1A mRNA expression, thereby preventing ischemia-induced angiogenesis. Our results demonstrate that ATG7 deficiency is a novel suppressor of ischemia-induced angiogenesis.
Our understanding about the role of autophagy in vascular biology is relatively limited. It seems that this process acts as a two-edged sword against various cellular insults in ECs. For example, laminar flow promotes autophagic response in ECs, which suppresses oxidant-induced endothelial cell death [Citation56]. Activation of autophagy protects against senescence and apoptosis in high-glucose-induced endothelial cells [Citation57]. In addition, oxidized LDL-inhibited autophagy mediates endothelial apoptosis [Citation58], loss of Atg7 promotes endothelial-to-mesenchymal transition and up-regulates key genes involved in TGFB signaling and fibrosis [Citation59]. However, autophagy has also been recognized as a cell death pathway in mammalian systems. Therefore, further researches are needed for comprehensively understanding the role of autophagy in endothelial biology and angiogenesis. Previous studies have shown that inhibition of autophagy by 3-methyladenine or silencing ATG5 suppresses angiogenesis in aortic endothelial cells [Citation13]. Deletion of endothelial Atg7 results in lower microvessel density in the brain [Citation32], but does not affect the vascular density in skeletal muscle and retina [Citation26]. In addition, endothelial Atg7 deficiency promotes cutaneous wound healing, but does not affect angiogenesis in the injured skin [Citation60,Citation61]. These data suggest that Atg7 deficiency may have less impact on angiogenesis in physiological and some pathological conditions. Nevertheless, it is reported that endothelial Atg7 deletion attenuates ischemia/reperfusion-induced acute cerebral injury and inflammatory response by inhibiting pro-inflammatory cytokines through RELA/p65-dependent transcriptional regulation [Citation60,Citation61]. Although decreased microvessel density in atg7−/− mouse brain is associated with reducing IL6 production through inhibiting RELA/p65 nuclear translocation [Citation32], it is not clear if RELA/p65 mediates ATG7 deficiency-enhanced STAT1 expression and whether ATG7 regulating RELA/p65 nuclear translocation is dependent or independent of autophagy. Our study provided compelling evidence demonstrating that Atg7 deficiency significantly inhibited ischemia-induced angiogenesis by activating STAT1-inhibited HIF1A expression that initiated angiogenesis by sensing environmental oxygen concentration and promoting growth factor transcription: 1) Atg7 deficiency delayed blood perfusion recovery and impaired ischemia-induced angiogenesis in hind limb ischemic model. 2) Deletion of Atg7 promoted STAT1 expression and negatively regulated tube formation. 3) Lack of Atg7 upregulated STAT1 that inhibited HIF1A expression. 4) Silencing STAT1 recovered the tube formation in cultured Atg7-deficient ECs. 5) Consistent with the observation that fludarabine attenuates cerebral ischemic injury by reducing cell apoptosis [Citation62], inhibition of STAT1 by fludarabine prevented Atg7-ablation-inhibited HIF1A expression, and promoted blood perfusion recovery and angiogenesis in hind limb ischemic model. Our results demonstrate that RELA/p65 is not involved in ATG7 deficiency-upregulated STAT1, and uncovers three previously undescribed regulatory mechanisms linked to inhibition of ischemic angiogenesis in ATG7-deficient conditions – that is, STAT1 is a transcriptional inhibitor of HIF1A, loss of ATG7 reduces HIF1A expression by upregulating STAT1, and ATG7 regulates STAT1 protein expression in an autophagy-independent manner: lack of ATG7 in the cytoplasm disrupts the association between ATG7 and transcription factor ZNF148/ZBP-89, increases the binding between ZNF148/ZBP-89 and KPNB1, which promotes ZNF148/ZBP-89 nuclear translocation, and increases STAT1 expression. Together, these findings establish a previously undescribed mechanism that lack of ATG7 inhibits angiogenesis by suppression of HIF1A expression through upregulation of STAT1 independently of autophagy under ischemic conditions.
HIF1A is not only regulated at the protein level by post-translational modifications and degradation, but also regulated at transcriptional level by transcription factors [Citation41–46]. By screening six reported HIF1A transcription factors, we found that the most significantly increased gene was STAT1 in ATG7-deficient cells. Currently, the precise role of STAT1 in regulating HIF1A expression remains controversial in the literature. For example, in human aortic valve interstitial cells, the combination of IFNG/IFN-γ (interferon gamma) and lipopolysaccharide (LPS) promotes HIF1A induction, and silencing Stat1 inhibits HIF1A protein induction [Citation63], indicating that STAT1 is the upstream signaling required for HIF1A expression. By contrast, in human glioblastoma cell lines, IFNG/IFN-γ suppresses the HIF1A-dependent gene transcription and silencing Stat1 abolishes the inhibitory effect of IFNG/IFN-γ on hypoxia-induced reporter gene activity [Citation64], suggesting that IFNG/IFN-γ-activated STAT1 functions as a negative transcriptional regulator of HIF1A. Our study showed that silencing Stat1 mitigated Atg7 deficiency-inhibited HIF1A expression at both mRNA and protein levels, and silencing ATG7 significantly increased STAT1 binding to the HIF1A promotor and inhibited HIF1A transcription, indicating that loss of ATG7 reduces HIF1A expression by upregulating STAT1.
Another finding of this study is that ATG7 regulated STAT1 expression in an autophagy-independent manner. We found that ATG7 deficiency enhanced Stat1 mRNA and protein expression, concurrent with autophagy suppression. However, suppression of autophagy by silencing ULK1, knock down of SQSTM1, or administration of CQ failed to increase STAT1 expression. Moreover, silencing Atg7 in Ulk1-deficient ECs, in which autophagic flux was inhibited, significantly upregulated STAT1 level. Overexpression of ATG7 to promote autophagy had no obvious impact on STAT1 expression, indicating that inactivation of autophagy does not upregulate STAT1 expression, and ATG7 deficiency enhances STAT1 expression in autophagy-defective cells. Similar to our finding, Atg5 or Atg7 depletion is reported to increase total and phosphorylated STAT1 by downregulating ATF3 (activating transcription factor 3) [Citation65]. On the contrary, another group reports that STAT1 expression is lower in atg5 KO MEFs and the Atg5 deficiency inhibits IFNG/IFN-γ-induced STAT1 phosphorylation, suggesting that IFNG/IFN-γ autophagy-dependently induces STAT1 activation [Citation66]. Moreover, the regulatory effects of ATG7 on STAT1 may vary in diverse cell types. For example, in murine alveolar macrophage cell line, ATG7 deficiency impairs STAT1 activation as P. aeruginosa stimulation, but does not affect STAT1 protein expression [Citation67]. In Michigan Cancer Foundation-7 (MCF7) cells, ATG7 deficiency upregulates STAT1 protein expression [Citation68,Citation69]. However, these reports do not investigate the mechanisms by which ATG7 regulates STAT1 expression. To bridge this gap, our study reveals a new mechanism by which ATG7 deficiency upregulates STAT1 expression at transcriptional level via an autophagy independent pathway.
Interestingly, we observed that loss of ATG7 reduced angiogenesis in vivo, and inhibited tube formation in cultured ECs. However, overexpression of ATG7 had no significant impact on the tube formation. This may be explained by the facts that STAT1 is a transcription factor that suppresses HIF1A expression, and the interaction of ZNF148/ZBP-89 with ATG7 and KPNB1 regulates the nuclear translocation of ZNF148/ZBP-89. Our study showed that ZNF148/ZBP-89 contained a binding region of ATG7, which was required for ATG7 physically associating with ZNF148/ZBP-89. Under basal conditions, there was rarely association between ZNF148/ZBP-89 and KPNB1, but the interaction of ZNF148/ZBP-89 and KPNB1 was significantly increased in ATG7-deficient conditions. In MLECs, both ATG7 and ZNF148/ZBP-89 was present in the cytoplasm, and the association of ATG7 and ZNF148/ZBP-89 was observed in the cytoplasm but not in the nucleus. In atg7 KO MLECs, cytosolic ZNF148/ZBP-89 was significantly reduced, while nuclear ZNF148/ZBP-89 was dramatically increased, which was concurrent with the upregulation of STAT1. By contrast, overexpression of ATG7 did not alter ZNF148/ZBP-89 nuclear translocation and STAT1 expression. These data suggest that under basic conditions, most ZNF148/ZBP-89 is anchored in the cytoplasm due to its binding to ATG7, which dissociates ZNF148/ZBP-89 from KPNB1, thus only small amount of ZNF148/ZBP-89 is able to enter the nucleus to maintain basic STAT1 expression. Although overexpression of ATG7 increases ATG7 expression, it does not significantly increase the association of ZNF148/ZBP-89 and ATG7, thus failing to reduce the nuclear translocation of ZNF148/ZBP-89 and STAT1 expression. However, under ATG7-deficient conditions, lack of ATG7 disrupts the association of ATG7 and ZNF148/ZBP-89. ZNF148/ZBP-89 is released from the ATG7-ZNF148/ZBP-89 complex and binds to KPNB1 that transports ZNF148/ZBP-89 from the cytoplasm to the nucleus, where ZNF148/ZBP-89 binds to STAT1 gene promoter and upregulates STAT1 expression, leading to inhibition of HIF1A expression and angiogenesis.
Our findings may lead to improvements for the clinical cares of patients with tumor or ischemic cardiovascular diseases. Since angiogenesis has been characterized as an essential process for tumor cell proliferation and viability, our results that deletion of ATG7 can suppress angiogenesis suggest that inactivation of ATG7 is sufficient to inhibit tumor angiogenesis and suggest new clinical strategies to block tumor growth. Additionally, we find that inhibition of STAT1 by genetic or pharmacological means prevents inhibitory effects of ATG7 deficiency on ischemia-induced angiogenesis. This finding suggests that STAT1 inhibition may be a potential therapeutic target for the treatment of ischemic cardiovascular diseases.
In conclusion, Atg7 deficiency impairs angiogenesis and delays blood flow reperfusion under ischemic conditions. Lack of Atg7 upregulates STAT1 that transcriptionally inhibits HIF1A expression, thus impairing post-ischemic angiogenesis. Our studies uncover a new molecular mechanism for the negative effect of Atg7 deficiency on angiogenesis and demonstrate that lack of ATG7 inhibits angiogenesis by suppression of HIF1A expression through upregulation of STAT1 independently of autophagy under ischemic conditions. Our findings may suggest new therapeutic strategies for cancer and cardiovascular disorders.
Materials and methods
Reagents
Antibodies and reagents were purchased from the indicated companies. ATG7 (Cell Signaling Technology 8558), APG7 (B-9; Santa Cruz Biotechnology, sc-376,212), MAP1LC3A/B (Cell Signaling Technology, 4108), EP300 (Cell Signaling Technology, 54062S), SQSTM1/p62 (Abcam, 56,416), STAT1 (Cell Signaling Technology, 9172), p-STAT1 (Y701; Cell Signaling Technology, 9167), STAT3 (Cell Signaling Technology, 9139), p-STAT3 (S727; Cell Signaling Technology, 9136), STAT5 (Cell Signaling Technology, 9363), p-STAT5 (Y694; Cell Signaling Technology, 9359), STAT6 (Cell Signaling Technology, 5397), p-STAT6 (Y641; Cell Signaling Technology, 9361), HIF1A (Cell Signaling Technology, 36,169), HIF1A (Santa Cruz Biotechnology, sc-13,515), HIF2A (Cell Signaling Technology, 7096), ULK1 (Cell Signaling Technology, 8054), PECAM1/CD31 (Cell Signaling Technology, 77,699), ZNF148/ZBP-89 (Santa Cruz Biotechnology, sc-137,171), ZNF148/ZBP-89 (GeneTex, GTX104894), ACTB/β-actin (Santa Cruz Biotechnology, sc-47,778), GAPDH (Santa Cruz Biotechnology, sc-32,233), TUBA/α-Tubulin (Cell Signaling Technology, 3873), LMNA/lamin A/C (Cell Signaling Technology, 4777), LMNB1/lamin b1 (Cell Signaling Technology, 12,586). SP1 (Santa Cruz Biotechnology, sc-59TRITC), TP53/p53 (Cell Signaling Technology, 2527S), GST (Cell Signaling Technology, 2624S), KPNB1/Importin β (proteintech, 10,077-1-AP), SQSTM1 (proteintech, 18,420-1-AP), NFκB RELA/p65 (Cell Signaling Technology, 4764S), mouse secondary antibody (Cell Signaling Technology, 7076), rabbit secondary antibody (Cell Signaling Technology, 7074), donkey anti-mouse IgG conjugated to Alexa Fluor 488 green (ThermoFisher Scientific, 21,202), donkey anti-rabbit IgG conjugated to Alexa Fluor 488 green (ThermoFisher Scientific, 21,206), goat anti-mouse IgG conjugated to Alexa Fluor 555 red (ThermoFisher Scientific, 21,422), goat anti-rabbit IgG conjugated to Alexa Fluor 555 red (ThermoFisher Scientific, 21,428). EnVision® + Dual Link System-HRP (DAB+; Dako Cytomation, 3468). ATG7 siRNA (Cell Signaling Technology, 6604), ATG7 siRNA (Thermo Fisher Scientific, 135,754), STAT1 siRNA (Cell Signaling Technology, 6331), STAT1 siRNA (Thermo Fisher Scientific, VHS40871), Stat1 siRNA (Thermo Fisher Scientific, 151,007), ZNF148/ZBP-89 siRNA (Santa Cruz Biotechnology, sc-38,639), SQSTM1 siRNA (human; Santa Cruz Biotechnology, sc-29,679), Nfκb Rela/p65 siRNA (mouse; Santa Cruz Biotechnology, sc-29,411), Atg7 siRNA (Santa Cruz Biotechnology, sc-41,448). ULK1 siRNA (Santa Cruz Biotechnology, sc-44,182) for ex vivo transfection. The siRNA delivery reagent Lipofectamine RNAiMAX (ThermoFisher Scientific, 13,778–150), Lipofectamine® 2000 (ThermoFisher Scientific, 11,668–019). Matrigel (Corning, 356,237), fludarabine phosphate (Sigma-Aldrich, 1,272,204), chloroquine diphosphate salt (Sigma-Aldrich, C-6628), Pierce™ ECL Western Blotting Substrate (ThermoFisher Scientific, 32,106). Stat1 alpha Flag pRc/CMV was a gift from Jim Darnell (Addgene, 8691); pCAG-HIF1 alpha was a gift from Connie Cepko (Addgene, 21,101); ATG7 plasmid was obtained as a gift from Dr. Zhixue Liu (Georgia State University), ZNF148 plasmid (GenScript, OHu09001).
Mouse model of hind limb ischemia
Wild-type (WT, C57BL/6 J, stock number 000664), Ulk1flox/flox (Stock number 017916), and vascular endothelial Cdh5 (cadherin 5)-Cre mice (006137) were obtained from the Jackson Laboratory. Atg7flox/flox mice were purchased from RIKEN BioResource Research Center (RBRC02759). We generated atg7-EC-specific knockout mice (atg7 KO, Atg7flox/flox/Cdh5-Cre+) by mating female Atg7flox/flox mice with male Cdh5-Cre mice to generate heterozygous mice (atg7/f/WT:Cre/WT mice). Next, we assigned heterozygous breeding pairs to obtain homozygous mice. We PCR genotyped offspring using DNA from tail-snip biopsies. The mouse genotypes were determined using following primers: Atg7 forward primer: TGGCTGCTACTTCTGCAATGATGT, reverse primer: CAGGACAGAGACCATCAGCTCCAC. Cdh5 transgene forward: AGGCAGCTCACAAAGGAACAAT; transgene reverse: TCGTTGCATCGACCGGTAA; internal positive control forward, CTAGGCCACAGAATTGAAAGATCT; internal positive control reverse, GTAGGTGGAAATTCTAGCATCATCC. We selected two groups of mice for this study: (a) EC atg7 KO (atg7 KO) mice with genotype Atg7flox/flox/Cdh5-Cre+ and (b) littermate control mice (WT) with genotype Atg7flox/flox/Cdh5-Cre−. We used 8 to 10-week-old male mice for the experiment. Mice were housed in temperature-controlled cages under a 12-h light-dark cycle and given free access to water and normal chow.
Mouse hind limb ischemia was induced as described previously [Citation70]. Briefly, the left femoral artery was exposed under a dissection microscope. The left common iliac and femoral arteries were ligated with 6–0 sutures. A sham procedure, in which the arteries were isolated but not ligated, was performed on the contralateral leg [Citation71]. Blood flow was measured by Laser Doppler Imaging (Moor Instruments, Devon, UK). Ischemic and non-ischemic limb perfusion was measured before and directly after surgery, and then at 7, 14, 21, and 28 days after surgery. Image analysis software (PimSoft; Moor Instruments, Devon, UK) was used to calculate the limb mean flux units, and the final blood flow values were expressed as the ratio of ischemic to non-ischemic hind limb perfusion.
To examine the effect of STAT1-specific inhibitor, fludarabine phosphate, on Atg7-deficiency- induced inhibition of angiogenesis, one-week post-surgery, we treated atg7 KO and WT mice with fludarabine phosphate (100 mg/kg, i.p.) or vehicle once every other day as described previously [Citation72]. After treatment, blood flow of hind limbs was measured by Laser Doppler Imaging. The animal protocol was approved by the Institutional Animal Care and Use Committee at Georgia State University. All experiment were carried out in compliance with IACUC.
Cell culture
HUVECs were obtained from the American Type Culture Collection (PCS-100–013) and grown in EBM medium (Lonza Bioscience, CC-3121), which was supplemented with endothelial cell growth supplement (Lonza Bioscience, CC-4133) and 5% fetal bovine serum (Sigma-Aldrich, 12,303) in total. All culture media were supplemented with penicillin (100 Units/ml) and streptomycin (100 µg/ml; ThermoFisher Scientific, 15,140–122). HUVECs were used between passage four to six. For pharmacological inhibition of STAT1, HUVECs were treated with fludarabine phosphate (50 nM) for 16 h.
Mouse lung endothelial cells isolation
Mouse lung endothelial cells (MLECs) were isolated as previously described [Citation73]. Briefly, mouse lung was excised and minced with scissors. The tissue was digested by type II collagenase (Worthington Biochemical, LS004177) at 37°C for 45 min, and followed by aspirating the tissue into a 20 ml syringe with 14 g cannula to get single cell suspension. Pulmonary endothelial cells were purified by anti-PECAM1/CD31 antibody (BD Biosciences, 553,369) conjugated magnetic beads (ThermoFisher Scientific, 11,041) and anti-ICAM2 antibody (BD Biosciences, 553,325) conjugated magnetic beads, sequentially. MLECs were grown and maintained in EBM medium (Lonza Bioscience, CC-3121) supplemented with endothelial cell growth supplement (Lonza Bioscience, CC-4133) and 20% fetal bovine serum (Sigma-Aldrich, 12,303). MLECs were used between passage two to four. Cultured cells were incubated under standard cell culture conditions (37°C, 20% O2, 5% CO2). To observe the effect of hypoxia, the cells were cultured under the condition of 37°C, 1% O2, 5% CO2, 94% N2.
Aortic ring assay
The procedure was performed as previous described [Citation74]. Briefly, WT and atg7 KO mice were euthanized at 3 months of age. The aortas were isolated, the fat tissue was cleaned, and aortas were cut into 0.5 mm aortic rings. WT and atg7 KO aortic rings were subjected to transfection of control siRNA or Stat1 siRNA overnight. Then aortic rings were embedded into Matrigel (Corning, 356,230) and cultured in 2.5% FBS Opti-MEM containing VEGF (vascular endothelial growth factor) (30 ng/ml; ThermoFisher Scientific, PHC9394). Images were taken 6 days after implantation.
Retina staining
Retinas were isolated from WT and atg7 KO mice on postnatal day 8. Endothelial cells were stained with isolectin GS-IB4 (1:100; ThermoFisher Scientific, I21413) and pericytes were co-stained by either NG2 (1:100; Millipore Sigma, AB5320) or DES/desmin (1:200; Cell Signaling Technology, 5332S).
Wound healing assay
HUVECs were transfected with control siRNA or ATG7 siRNA for 48 h and the cells were scratched with 200 µl tips, and images were taken at indicated time points (0 and 6 h) using an inverted microscope. The images were analyzed with the ImageJ.
Spheroid sprouting angiogenesis assay
The spheroid sprouting angiogenesis assay was performed following established protocol [Citation75]. Briefly, methyl cellulose stock solution was prepared by dissolving methyl cellulose (6 g; Sigma-Aldrich, 9004–67-5) in EBM basal medium (500 ml; Lonza, CC-3121). HUVECs (2000 cells) were suspend in 1 ml 20% methyl cellulose, 5% FBS EBM with EGM supplements (Lonza, CC-3124). 25 µl drops of cell suspension were pipetted on a 15-cm Petri dish using an 8-channel pipette and kept upside-down in the cell culture incubator (37°C, 5% CO2) for 24 h. The spheroids were collected, spun down, and re-suspend in 0.5 ml methyl cellulose (containing 20% FBS). The same amount of collagen (2 mg/ml; ThermoFisher Scientific, A1048301) was added to the solution of spheroids, and the mixed solution was transferred into 24-well plate and kept in cell culture incubator for 30 min to allow the collagen gel to polymerize. Finally, 200 µl cell culture medium was added to the mix solution and cultured for another 24 h in cell culture incubator (37°C, 5% CO2). The spheroids were fixed by 10% formalin and pictures were taken by inverted microscope.
Constructs of truncations of ZNF148
Truncations of ZNF148 were generated by PCR using the corresponding primers. ZNF148 (1–168 bp): Forward 5’-GTGTCGACCATGAACATTGACGACAAACTGGAAG-3’, Reverse 5’-ATGCGGCCGCTTAAGGGGTTTTCAAACCAAGTGATC-3’, ZNF148 (169–281): Forward 5’- GTGTCGACCATGAAATCTCACGTTTGTGAGCACTG-3’, Reverse 5’-ATGCGGCCGCTTAGTCATGATTTTCATGGCACATACG-3’, ZNF148 (282–552): Forward 5’- GTGTCGACCATGAAAAAACTAAATAGATGTGCCATCAAAG-3’, Reverse 5’- ATGCGGCCGCTTAAGCTTTGTGGGAATAATGATCC-3’, ZNF148 (553–794): Forward 5’- GTGTCGACCATGAATGGACAGCATGAGATATCCTTC-3’, Reverse 5’- ATGCGGCCGCTTAGCCAAAAGTCTGGCCAG-3’. The fragments of ZNF148 were constructed into PRK5-GST plasmid with Sal-I and Not-I restriction enzyme. All the constructs were confirmed by DNA sequencing.
Plasmid and siRNA transfection
To overexpress ATG7, STAT1, or HIF1A, HUVECs were transfected with ATG7 plasmid (MYC-ATG7), STAT1 plasmid (Flag-STAT1), HIF1A plasmid (MYC-HIF1A), or empty plasmid (Ctrl) in OPTI-MEM reduced-serum media (ThermoFisher Scientific, 31,985) by using Lipofectamine 2000 (ThermoFisher Scientific, 11,668,019) for 24 h. To silence ATG7, STAT1, ULK1 or ZNF148/Zfp148/ZBP-89, HUVECs or MLECs were transfected with Atg7 siRNA, Stat1 siRNA, ZNF148/Zfp148/ZBP-89 siRNA, or control siRNA in OPTI-MEM reduced-serum media using Lipofectamine RNAiMax transfection reagent (ThermoFisher Scientific, 13,778,150) for 48 h. The transfection efficiencies of the siRNAs and plasmids were determined by western blot analysis of target protein expression.
Immunohistochemistry and immunofluorescence staining
Skeletal muscle was isolated, fixed in 4% paraformaldehyde, embedded in paraffin, and cut into 4 µm sections. The sections were deparaffinized, rehydrated, and heated in citrate buffer to unmask the antigens. Muscular sections were incubated with primary antibodies against PECAM1/CD31, p-STAT1 (Y701), ATG7, SQSTM1/p62 or HIF1A overnight at 4°C, respectively. After rinsing in PBS (Millipore Sigma, D5652-50 L) 3 times, sections were incubated with a horseradish peroxidase-labeled polymer detection system (DAKO EnvisionCDual link, K4061) and stained with DAB chromogen (DAKO, K3468).
HUVECs or MLECs were fixed with −20°C methanol (Fisher Scientific, 67–56-1) and permeabilized using 0.2% Triton X-100 (Sigma-Aldrich, T8787). Cells were blocked by goat serum (Fisher Scientific, HK112-9 K) for 30 min at room temperature and incubated with corresponding primary antibody at 4°C, overnight. The cells were washed with 0.5% Tween-20 (Sigma-Aldrich, P1379) in PBS 3 times, then incubated with fluorescent secondary antibody for 1 h at room temperature, and mounted with DAPI (Sigma-Aldrich, D9564). Images were recorded using an Olympus fluorescence microscope (Olympus BX53, Tokyo, Japan) and quantified using Image-Pro Plus 6.0 (Media Cybernetics, Rockville, MD).
Immunoprecipitation and western blot analysis
Proteins were extracted from skeletal muscles, HUVECs, and MLECs using RIPA lysis buffer (Santa Cruz Biotechnology, sc-24948A). Protein content was determined using the bicinchoninic acid protein (BCA) assay reagent (ThermoFisher Scientific, 23,223, 23,224). For immunoprecipitation, proteins (500 μg for each sample) were incubated with anti-ATG7 antibody, or anti-TP53/p53 or rabbit IgG overnight at 4°C, in another case was used anti-ZNF148 or mouse IgG. Protein A sepharose beads (Sigma Aldrich, GE 17–0780-01) were added and rotated at 4°C for 3 h. The sepharose beads were washed 5 times with lysis buffer and subjected to western blot analysis. For western blot analysis, 30 mg of protein were resolved by SDS-PAGE, transferred to nitrocellulose membranes (Bio-Rad Laboratories, 1,620,112), and probed with specific antibodies. The signals were visualized using the ECL (ThermoFisher Scientific, 32,106) detection system. The intensity of individual bands was measured by ImageJ and the background was subtracted from the calculated area.
To determine the location of ATG7 binding domain on ZNF148, HEK 293 T cell were transfected with glutathione S-transferase (GST)-tagged ZNF148 truncations or GST-control plasmid, and co-transfected with MYC-ATG7 plasmid. Cell lysates were obtained 24 h after transfection. GST was pulled down by glutathione-sepharose beads (Sigma-Aldrich, GE17-0756-01), and the overexpression efficacy and the interaction of ZNF148/ZBP-89 and ATG7 were determined by blotting GST and ATG7 antibody, respectively.
RNA Extraction and quantitative Real-Time (qRT)-PCR analysis
Total mRNA was extracted from cultured cells with Trizol reagent (ThermoFisher Scientific, 15,596,018). For reverse transcription, 1 µg of the total mRNA was converted to first strand complementary DNA in a 20 µL reaction volume using a cDNA synthesis Kit (Bio-Rad Laboratories, 1,708,891). PCR primers used for amplification of genes were as follows:
Stat1 (mouse): forward 5’-GCTGCCTATGATGTCTCGTTT −3’, reverse 5’-TGCTTTTCCGTATGTTGTGCT-3’; STAT1 (human): forward 5’-AGGAAAAGCAAGCGTAATCTTCA-3’; reverse 5’-TATTCCCCGACTGAGCCTGAT-3’; GAPDH (human): forward 5’-CATCAATGGAAATCCCAT-3’; reverse 5’-TTCTCCATGGTGGTGAAGAC-3’; HIF1A (human): forward 5’-TCCAAGAAGCCCTAACGTGT-3’; reverse 5’-TTTCGCTTTCTCTGAGCATTCTG-3’; NEAT1 (human): forward 5’-GTTCCGTGCTTCCTCTTCTG-3’; reverse 5’-GTGTCCTCCGACTTTACCAG-3’; IRF9 (human): forward 5’-GCCCTACAAGGTGTATCAGTTG-3’; reverse 5’-TGCTGTCGCTTTGATGGTACT-3’; BCLAF1 (human): forward 5’-CCGCGATTCGGCGTGTCAGG-3’; reverse 5’-GACCCATTTCTTTTCTCCTTGGTT-3’; NRF1 (human): forward 5’-AGGAACACGGAGTGACCCAA-3’; 5’-TATGCTCGGTGTAAGTAGCCA-3’; Hif1a (mouse): forward 5’-CCTGCACTGAATCAAGAGGTTGC-3’; reverse 5’-CCATCAGAAGGACTTGCTGGCT-3’; Zfp148 (mouse): forward 5’-GAGATTTCCTTCAGCGTTTAC-3’; reverse 5’-TTTGGAAGGGTCTGGTTGTC-3’; β-actin (mouse): forward 5’-GGCTGTATTCCCCTCCATCG-3’; reverse 5’-CCAGTTGGTAACAATGCCATGT-3’. All samples were run in duplicate and underwent initial denaturation at 95°C for 5 min, followed by 40 rounds of amplification (95°C for 30s, 60°C for 30s) using iQTM SYBR® Green Supermix (Bio-Rad Laboratories, 1,708,884) and the CFX96TM Real-Time System (Bio-Rad Laboratories). All data were analyzed using the 2−ΔΔCT method and normalized with GADPH or Actb as described previously [Citation76].
Chromatin immunoprecipitation (ChIP) assays
The ChIP assay were performed using SimpleChIP® Enzymatic Chromatin IP Kit (Cell Signaling Technology, 9003s) according to the manufacture’s instruction. 4 × 10⁶ HUVECs were used for each immunoprecipitation. Protein was crossed-linked to DNA by addition of 1% of formaldehyde, and the cross-linking process was terminated by glycine. Chromatin was sonicated to 100 to 500 bp fragments. To determine the interaction between STAT1 and HIF1A promoter, the DNA fragments were immunoprecipitated with antibodies against STAT1 (dilution 1:50) or normal rabbit IgG (Cell Signaling Technology, 2729) overnight at 4°C. All DNA samples were purified, and PCR was conducted to measure the relative amount of interaction between STAT1 and HIF1A promoter. The following primers were used for the amplification: forward: 5’-CACATCTGAGCAACGAGACCAAAGG-3’, reverse: 5’-GCGCTGCTGAGAAGGGATTTC-3’. The enrichment of HIF1A gene DNA fragments was normalized to the input of total genomic DNA for each sample. To determine the interaction between RELA/p65 and HIF1A promoter, the DNA fragments were immunoprecipitated with antibodies against RELA/p65 (dilution 1:50; Cell Signaling Technology, 6956S) or normal mouse IgG (Vector Laboratories, I-2000) overnight at 4°C. All DNA samples were purified, and PCR was conducted to measure the relative amount of interaction between RELA/p65 and HIF1A promoter. The following primers were used for the amplification: forward: 5’-GAGTTCCCCTGTGCTCCGTG-3’, reverse: 5’-TTCTCCTCGGCCTCAGTGCT-3’. The enrichment of HIF1A gene DNA fragments was normalized to the input of total genomic DNA for each sample.
Cytosol and nuclear fractionation
HUVECs or MLECs were washed with ice-cold PBS (pH7.4) twice and collected into 1.5 ml micro-centrifuge tube. The cells were lysed by adding 600 µl RIPA containing protease cocktail. 200 ul of the lysate was collected as “whole cell lysate”. The remained 400-µl lysates were centrifuged for 10s at the maximum speed of Eppendorf (Sigma Aldrich, Eppendorf Centrifuge 5418 R). 200 µl of the supernatant was collected as “cytosolic fraction”. The pellet was resuspended by 1 ml RIPA buffer and centrifuged for 10s at the maximum speed of the Eppendorf. The pellet resuspended by adding 200 µl RIPA buffer and used as “nuclear fraction”.
Tube formation assay
The experiment was performed as manufacture’s instruction (Corning, 356,237). HUVECs were used less than passage 5. Passage 2 of MLECs were used in this experiment. Twenty-four-well culture plates were coated with Matrigel (280 µl/ well) according to the manufacturer’s instructions. HUVECs were transfected with siRNA or plasmid for 24 h, and then seeded on coated plates at 5 × 10⁴ cells/well in EBM containing 10% FBS and incubated at 37°C for another 16 h under normoxic or hypoxic conditions. Tube formation was observed using an inverted fluorescence microscope (Olympus IX73, Tokyo, Japan). Images were captured with a video graphic system (CellSens Software, Tokyo, Japan). The degree of tube formation was quantified by measuring the number of sprouts in three randomly chosen low-power fields from each well using the NIH Image Program. Each experiment was repeated at least three times.
Statistical analysis
Data were expressed as mean ± standard deviation (SD). One- or two-way ANOVA was used to determine the differences among three or more groups, followed by Bonferroni post-hoc analysis using GraphPad Prism 9 software (GraphPad Software, Inc., La Jolla, CA). Comparisons between 2 groups of values were assessed using the Student’s t test. P < 0.05 was considered statistically significant.
Supplemental Material
Download MS Word (1.3 MB)Disclosure statement
No potential conflict of interest was reported by the author(s).
Supplementary material
Supplemental data for this article can be accessed online at https://doi.org/10.1080/15548627.2022.2139920
Additional information
Funding
References
- Potente M, Gerhardt H, Carmeliet P. Basic and therapeutic aspects of angiogenesis. Cell. 2011 Sep 16; 146(6):873–887.
- Folkman J. Angiogenesis in cancer, vascular, rheumatoid and other disease. Nat Med. 1995 Jan;1(1):27–31.
- Inampudi C, Akintoye E, Ando T, et al. Angiogenesis in peripheral arterial disease. Curr Opin Pharmacol. 2018 Apr;39:60–67.
- Melincovici CS, Bosca AB, Susman S, et al. Vascular endothelial growth factor (VEGF) - key factor in normal and pathological angiogenesis. Rom J Morphol Embryol. 2018;59(2):455–467.
- Zhu HF, Wan D, Luo Y, et al. Catalpol increases brain angiogenesis and up-regulates VEGF and EPO in the rat after permanent middle cerebral artery occlusion. Int J Biol Sci. 2010 Aug 20;6(5):443–453.
- Ke Q, Costa M. Hypoxia-inducible factor-1 (HIF-1). Mol Pharmacol. 2006 Nov;70(5):1469–1480.
- Pugh CW, Ratcliffe PJ. Regulation of angiogenesis by hypoxia: role of the HIF system. Nat Med. 2003 Jun;9(6):677–684.
- Rabinowitz JD, White E. Autophagy and metabolism. Science. 2010 Dec 3; 330(6009):1344–1348.
- Xie Z, He C, Zou MH. AMP-activated protein kinase modulates cardiac autophagy in diabetic cardiomyopathy. Autophagy. 2011 Oct;7(10):1254–1255.
- Cheng Y, Ren X, Hait WN, et al. Therapeutic targeting of autophagy in disease: biology and pharmacology. Pharmacol Rev. 2013;65(4):1162–1197.
- Cho CF, Chen PK, Chang PC, et al. Human plasminogen kringle 1-5 inhibits angiogenesis and induces thrombomodulin degradation in a protein kinase A-dependent manner. J Mol Cell Cardiol. 2013 Oct;63:79–88.
- Lee S, Kim H, Jin Y, et al. Beclin 1 deficiency is associated with increased hypoxia-induced angiogenesis. Autophagy. 2011;7(8):829–39.
- Du J, Teng RJ, Guan T, et al. Role of autophagy in angiogenesis in aortic endothelial cells. Am J Physiol Cell Physiol. 2012 Jan 15;302(2):C383–391.
- Ma S, Wang Y, Chen Y, et al. The role of the autophagy in myocardial ischemia/reperfusion injury. Biochim Biophys Acta. 2015 Feb;1852(2):271–276.
- Matsui Y, Kyoi S, Takagi H, et al. Molecular mechanisms and physiological significance of autophagy during myocardial ischemia and reperfusion. Autophagy. 2008 May;4(4):409–415.
- Hamacher-Brady A, Brady NR, Logue SE, et al. Response to myocardial ischemia/reperfusion injury involves Bnip3 and autophagy. Cell Death Differ. 2007 Jan;14(1):146–157.
- Yin Z, Pascual C, Klionsky DJ. Autophagy: machinery and regulation. Microb Cell. 2016 Dec 1; 3(12):588–596.
- Mizushima N. The ATG conjugation systems in autophagy. Curr Opin Cell Biol. 2020 Apr;63:1–10.
- Glick D, Barth S, Macleod KF. Autophagy: cellular and molecular mechanisms. J Pathol. 2010 May;221(1):3–12.
- Sprott D, Poitz DM, Korovina I, et al. Endothelial-specific deficiency of ATG5 (autophagy protein 5) attenuates ischemia-related angiogenesis. Arterioscler Thromb Vasc Biol. 2019 Jun;39(6):1137–1148.
- Komatsu M, Waguri S, Ueno T, et al. Impairment of starvation-induced and constitutive autophagy in Atg7-deficient mice. J Cell Biol. 2005 May 9;169(3):425–434.
- Mortensen M, Ferguson DJ, Edelmann M, et al. Loss of autophagy in erythroid cells leads to defective removal of mitochondria and severe anemia in vivo. Proc Natl Acad Sci U S A. 2010 Jan 12;107(2):832–837.
- Antonucci L, Fagman JB, Kim JY, et al. Basal autophagy maintains pancreatic acinar cell homeostasis and protein synthesis and prevents ER stress. Proc Natl Acad Sci U S A. 2015 Nov 10;112(45):E6166–6174.
- Zhuang Y, Li Y, Li X, et al. Atg7 knockdown augments concanavalin A-induced acute hepatitis through an ROS-mediated p38/MAPK pathway. PLoS One. 2016;11(3):e0149754.
- Qiao Z, Xu Z, Xiao Q, et al. Dysfunction of ATG7-dependent autophagy dysregulates the antioxidant response and contributes to oxidative stress-induced biological impairments in human epidermal melanocytes. Cell Death Discov. 2020;6(1):31.
- Torisu T, Torisu K, Lee IH, et al. Autophagy regulates endothelial cell processing, maturation and secretion of von Willebrand factor. Nat Med. 2013 Oct;19(10):1281–1287.
- Heinitz S, Gebhardt C, Piaggi P, et al. Atg7 knockdown reduces chemerin secretion in murine adipocytes. J Clin Endocrinol Metab. 2019 Nov 1;104(11):5715–5728.
- Lee IH, Kawai Y, Fergusson MM, et al. Atg7 modulates p53 activity to regulate cell cycle and survival during metabolic stress. Science. 2012 Apr 13;336(6078):225–228.
- Han J, Hou W, Goldstein LA, et al. A complex between Atg7 and Caspase-9: a NOVEL MECHANISM OF CROSS-REGULATION BETWEEN AUTOPHAGY AND APOPTOSIS. J Biol Chem. 2014 Mar 7;289(10):6485–6497.
- Rosenfeldt MT, O’Prey J, Morton JP, et al. p53 status determines the role of autophagy in pancreatic tumour development. Nature. 2013 Dec 12;504(7479):296–300.
- Mauthe M, Reggiori F. ATG proteins: are we always looking at autophagy? Autophagy. 2016 Dec;12(12):2502–2503.
- Zhuang SF, Liu DX, Wang HJ, et al. Atg7 regulates brain angiogenesis via NF-kappaB-dependent IL-6 production. Int J Mol Sci. 2017 May 3;18(5):968.
- Wu J, Lei Z, Yu J. Hypoxia induces autophagy in human vascular endothelial cells in a hypoxia-inducible factor 1dependent manner. Mol Med Rep. 2015 Apr;11(4):2677–2682.
- Dimmeler S, Zeiher AM. Endothelial cell apoptosis in angiogenesis and vessel regression. Circ Res. 2000 Sep 15; 87(6):434–439.
- Kang TY, Bocci F, Jolly MK, et al. Pericytes enable effective angiogenesis in the presence of proinflammatory signals. Proc Natl Acad Sci U S A. 2019 Nov 19;116(47):23551–23561.
- Egan D, Kim J, Shaw RJ, et al. The autophagy initiating kinase ULK1 is regulated via opposing phosphorylation by AMPK and mTOR. Autophagy. 2011 Jun;7(6):643–644.
- Semenza GL. Hypoxia-inducible factor 1 and cardiovascular disease. Annu Rev Physiol. 2014;76(1):39–56.
- Ciafre SA, Niola F, Giorda E, et al. CoCl(2)-simulated hypoxia in skeletal muscle cell lines: role of free radicals in gene up-regulation and induction of apoptosis. Free Radic Res. 2007 Apr;41(4):391–401.
- Dai M, Cui P, Yu M, et al. Melatonin modulates the expression of VEGF and HIF-1 alpha induced by CoCl2 in cultured cancer cells. J Pineal Res. 2008 Mar;44(2):121–126.
- Bartoszewska S, Kochan K, Piotrowski A, et al. The hypoxia-inducible miR-429 regulates hypoxia-inducible factor-1alpha expression in human endothelial cells through a negative feedback loop. FASEB J. 2015 Apr;29(4):1467–1479.
- Galban S, Gorospe M. Factors interacting with HIF-1alpha mRNA: novel therapeutic targets. Curr Pharm Des. 2009;15(33):3853–3860.
- Gerber SA, Pober JS. IFN-alpha induces transcription of hypoxia-inducible factor-1alpha to inhibit proliferation of human endothelial cells. J Immunol. 2008 Jul 15; 181(2):1052–1062.
- Park EJ, Lee YM, Oh TI, et al. Vanillin suppresses cell motility by inhibiting STAT3-mediated HIF-1alpha mRNA expression in malignant melanoma cells. Int J Mol Sci. 2017 Mar 1;18(3):532.
- Rius J, Guma M, Schachtrup C, et al. NF-kappaB links innate immunity to the hypoxic response through transcriptional regulation of HIF-1alpha. Nature. 2008 Jun 5;453(7196):807–811.
- Koyasu S, Kobayashi M, Goto Y, et al. Regulatory mechanisms of hypoxia-inducible factor 1 activity: two decades of knowledge. Cancer Sci. 2018 Mar;109(3):560–571.
- Wen Y, Zhou X, Lu M, et al. Bclaf1 promotes angiogenesis by regulating HIF-1alpha transcription in hepatocellular carcinoma. Oncogene. 2019 Mar;38(11):1845–1859.
- Gorina R, Petegnief V, Chamorro A, et al. AG490 prevents cell death after exposure of rat astrocytes to hydrogen peroxide or proinflammatory cytokines: involvement of the Jak2/STAT pathway. J Neurochem. 2005 Feb;92(3):505–518.
- Gorina R, Sanfeliu C, Galito A, et al. Exposure of glia to pro-oxidant agents revealed selective Stat1 activation by H2O2 and Jak2-independent antioxidant features of the Jak2 inhibitor AG490. Glia. 2007 Oct;55(13):1313–1324.
- Madamanchi NR, Li S, Patterson C, et al. Reactive oxygen species regulate heat-shock protein 70 via the JAK/STAT pathway. Arterioscler Thromb Vasc Biol. 2001 Mar;21(3):321–326.
- Tal MC, Sasai M, Lee HK, et al. Absence of autophagy results in reactive oxygen species-dependent amplification of RLR signaling. Proc Natl Acad Sci U S A. 2009 Feb 24;106(8):2770–2775.
- Bai L, Merchant JL. Transcription factor ZBP-89 is required for STAT1 constitutive expression. Nucleic Acids Res. 2003 Dec 15; 31(24):7264–7270.
- Bai L, Merchant JL. ZBP-89 promotes growth arrest through stabilization of p53. Mol Cell Biol. 2001 Jul;21(14):4670–4683.
- Merchant JL, Bai L, Okada M. ZBP-89 mediates butyrate regulation of gene expression. J Nutr. 2003 Jul;133(7 Suppl):2456S–2460S.
- Wu Y, Diab I, Zhang X, et al. Stat3 enhances vimentin gene expression by binding to the antisilencer element and interacting with the repressor protein, ZBP-89. Oncogene. 2004 Jan 8;23(1):168–178.
- Lee SJ, Sekimoto T, Yamashita E, et al. The structure of importin-beta bound to SREBP-2: nuclear import of a transcription factor. Science. 2003 Nov 28;302(5650):1571–1575.
- Liu J, Bi X, Chen T, et al. Shear stress regulates endothelial cell autophagy via redox regulation and Sirt1 expression. Cell Death Dis. 2015 Jul 16;6(7):e1827.
- Chen F, Chen B, Xiao FQ, et al. Autophagy protects against senescence and apoptosis via the RAS-mitochondria in high-glucose-induced endothelial cells. Cell Physiol Biochem. 2014;33(4):1058–1074.
- Zheng J, Lu C. Oxidized LDL causes endothelial apoptosis by inhibiting mitochondrial fusion and mitochondria autophagy. Front Cell Dev Biol. 2020;8:600950.
- Singh KK, Lovren F, Pan Y, et al. The essential autophagy gene ATG7 modulates organ fibrosis via regulation of endothelial-to-mesenchymal transition. J Biol Chem. 2015 Jan 30;290(5):2547–2559.
- Li KC, Wang CH, Zou JJ, et al. Loss of Atg7 in endothelial cells enhanced cutaneous wound healing in a mouse model. J Surg Res. 2020 May;249:145–155.
- Wang HJ, Wei JY, Liu DX, et al. Endothelial Atg7 deficiency ameliorates acute cerebral injury induced by ischemia/reperfusion. Front Neurol. 2018;9:998.
- Xu Q, Jiang C, Rong Y, et al. The effects of fludarabine on rat cerebral ischemia. J Mol Neurosci. 2015 Feb;55(2):289–296.
- Parra-Izquierdo I, Castanos-Mollor I, Lopez J, et al. Lipopolysaccharide and interferon-gamma team up to activate HIF-1alpha via STAT1 in normoxia and exhibit sex differences in human aortic valve interstitial cells. Biochim Biophys Acta Mol Basis Dis. 2019 Sep 1;1865(9):2168–2179.
- Hiroi M, Mori K, Sakaeda Y, et al. STAT1 represses hypoxia-inducible factor-1-mediated transcription. Biochem Biophys Res Commun. 2009 Oct 2;387(4):806–810.
- Kong E, Kim HD, Kim J. Deleting key autophagy elongation proteins induces acquirement of tumor-associated phenotypes via ISG15. Cell Death Differ. 2020 Aug;27(8):2517–2530.
- Chang YP, Tsai CC, Huang WC, et al. Autophagy facilitates IFN-gamma-induced Jak2-STAT1 activation and cellular inflammation. J Biol Chem. 2010 Sep 10;285(37):28715–28722.
- Li X, Ye Y, Zhou X, et al. Atg7 enhances host defense against infection via downregulation of superoxide but upregulation of nitric oxide. J Immunol. 2015 Feb 1;194(3):1112–1121.
- Ambjorn M, Ejlerskov P, Liu Y, et al. IFNB1/interferon-beta-induced autophagy in MCF-7 breast cancer cells counteracts its proapoptotic function. Autophagy. 2013 Mar;9(3):287–302.
- Schwartz-Roberts JL, Cook KL, Chen C, et al. Interferon regulatory factor-1 signaling regulates the switch between autophagy and apoptosis to determine breast cancer cell fate. Cancer Res. 2015 Mar 15;75(6):1046–1055.
- Niiyama H, Huang NF, Rollins MD, et al. Murine model of hindlimb ischemia. J Vis Exp. 2009 Jan;21(23):e1035.
- Lu Q, Xie Z, Yan C, et al. SNRK (sucrose nonfermenting 1-related kinase) promotes angiogenesis in vivo. Arterioscler Thromb Vasc Biol. 2018 Feb;38(2):373–385.
- He C, Li H, Viollet B, et al. AMPK suppresses vascular inflammation in vivo by inhibiting signal transducer and activator of transcription-1. Diabetes. 2015 Dec;64(12):4285–4297.
- Sobczak M, Dargatz J, Chrzanowska-Wodnicka M. Isolation and culture of pulmonary endothelial cells from neonatal mice. J Vis Exp. 2010 Dec;14(46):e2316.
- Baker M, Robinson SD, Lechertier T, et al. Use of the mouse aortic ring assay to study angiogenesis. Nat Protoc. 2011 Dec 22;7(1):89–104.
- Tetzlaff F, Fischer A. Human endothelial cell spheroid-based sprouting angiogenesis assay in collagen. Biol Protoc. 2018 Sep 5; 8(17):e2995.
- Mu J, Zhang D, Tian Y, et al. BRD4 inhibition by JQ1 prevents high-fat diet-induced diabetic cardiomyopathy by activating PINK1/Parkin-mediated mitophagy in vivo. J Mol Cell Cardiol. 2020 Dec;149:1–14.