
ABSTRACT
Peroxisomes are rapidly degraded during amino acid and oxygen deprivation by a type of selective autophagy called pexophagy. However, how damaged peroxisomes are detected and removed from the cell is poorly understood. Recent studies suggest that the peroxisomal matrix protein import machinery may serve double duty as a quality control machinery, where they are directly involved in activating pexophagy. Here, we explored whether any matrix import factors are required to prevent pexophagy, such that their loss designates peroxisomes for degradation. Using gene editing and quantitative fluorescence microscopy on culture cells and a zebrafish model system, we found that PEX13, a component of the peroxisomal matrix import system, is required to prevent the degradation of otherwise healthy peroxisomes. The loss of PEX13 caused an accumulation of ubiquitinated PEX5 on peroxisomes and an increase in peroxisome-dependent reactive oxygen species that coalesce to induce pexophagy. We also found that PEX13 protein level is downregulated to aid in the induction of pexophagy during amino acid starvation. Together, our study points to PEX13 as a novel pexophagy regulator that is modulated to maintain peroxisome homeostasis.
Abbreviations: AAA ATPases: ATPases associated with diverse cellular activities; ABCD3: ATP binding cassette subfamily D member; 3ACOX1: acyl-CoA oxidase; 1ACTA1: actin alpha 1, skeletal muscle; ACTB: actin beta; ATG5: autophagy related 5; ATG7: autophagy related 7; ATG12: autophagy related 12; ATG16L1: autophagy related 16 like 1; CAT: catalase; CQ: chloroquine; Dpf: days post fertilization: FBS: fetal bovine serum; GAPDH: glyceraldehyde-3-phosphate dehydrogenase; GFP: green fluorescent protein; H2O2: hydrogen peroxide; HA – human influenza hemagglutinin; HBSS: Hanks’ Balanced Salt Solution; HCQ; hydroxychloroquine; KANL: lysine alanine asparagine leucine; KO: knockout; MAP1LC3B: microtubule associated protein 1 light chain 3 beta; MEF: mouse embryonic fibroblast; MTOR: mechanistic target of rapamycin kinase; MTORC1: mechanistic target of rapamycin kinase complex 1; MTORC2: mechanistic target of rapamycin kinase complex 2; MYC: MYC proto-oncogene, bHLH transcription factor; MZ: maternal and zygotic; NAC: N-acetyl cysteine; NBR1 – NBR1 autophagy cargo receptor; PBD: peroxisome biogenesis disorder; PBS: phosphate-buffered saline; PEX: peroxisomal biogenesis factor; PTS1: peroxisome targeting sequence 1; RFP: red fluorescent protein; ROS: reactive oxygen speciess; iRNA: short interfering RNA; SKL: serine lysine leucine; SLC25A17/PMP34: solute carrier family 25 member 17; Ub: ubiquitin; USP30: ubiquitin specific peptidase 30.
Introduction
Peroxisomes are small punctate metabolic organelles required for synthesizing and metabolizing reactive oxygen species and unique lipids that are critical for multi-cellular eukaryotes [Citation1–4]. As such, peroxisomes are crucial organelles in human development, as their loss due to mutation of peroxins (PEX) genes result in a group of multisystemic genetic disorders called Zellweger’s spectrum disorder (ZSD) [Citation5]. Although mutation of most peroxins causes a defect in peroxisome biogenesis, the loss of PEX1 function, corresponding to the most commonly mutated PEX gene in ZSD cases, results in the upregulation of peroxisome degradation, suggesting that some peroxins may be involved in peroxisome quality control [Citation6].
Peroxisome abundance can be rapidly reduced by degradation through a selective macroautophagic process called pexophagy [Citation7]. Selective macroautophagy/autophagy is the process in which specific cellular components are designated and targeted for degradation in lysosomes [Citation8,Citation9]. The designation of a cytosolic substrate for selective autophagy is most often signaled by ubiquitination of a protein component, which allows for the recruitment of ubiquitin-binding autophagy receptors [Citation10,Citation11]. The autophagy receptor acts as the interface between the substrate and the phagophore by binding to the Atg8 family of proteins [Citation10,Citation12]. Pexophagy is induced by a number of cellular stresses, including hypoxia [Citation13] (though this may be dependent on lipid content in growth media [Citation14]), amino acid starvation [Citation15], and treatment with exogenous ROS [Citation16]. Pexophagy induced by these stresses relies on a mechanism that promotes the ubiquitination of proteins localized on the peroxisomal membrane, which are recognized by the autophagy receptors SQSTM1/p62 and NBR1 [Citation17–19].
Although progress has been made in identifying genes involved in pexophagy, less is known about the mechanism by which aged or dysfunctional peroxisomes are recognized and subsequently degraded [Citation11,Citation20,Citation21]. Unlike the mitochondria, peroxisomes do not have a potential gradient, where their disruption signals degradation. However, recent studies on pexophagy point to the possibility that the peroxisomal matrix import machinery may have a role in peroxisome quality control [Citation11]. The importance of the matrix protein import system is underlined by the fact that most of the enzymatic peroxisome functions occur in the matrix (lumen) of peroxisomes, and thus any defect in matrix importer genes will result in dysfunctional peroxisomes [Citation5]. Therefore, it would reason that a peroxisome quality control system likely includes a mechanism to detect import-incompetent peroxisomes.
The matrix peroxisome protein import system has several hallmarks of the mammalian selective autophagy system, one of which is the ubiquitination of membrane-bound PEX5, a key component for the import of matrix proteins. Peroxisome matrix (lumen) proteins are synthesized on free ribosomes in the cytosol and are post-translationally targeted to peroxisomes by the cytosolic receptor protein PEX5, which cycles between the cytosol and peroxisome membrane [Citation22]. Cargo-bound PEX5 is recruited to the peroxisomal membrane by a docking complex consisting of PEX13 and PEX14, where together they form a transient pore on the peroxisome membrane that allows for the import of fully folded proteins across the membrane [Citation23]. After cargo release, PEX5 is then recycled back to the cytosol by a mechanism that involves its ubiquitination by a complex of peroxisomal E3 ubiquitin ligases; PEX2, PEX10 and PEX12 [Citation24], followed by its removal from the peroxisomal membrane by the peroxisomal AAA-ATPase complex consisting of PEX1, PEX6 and PEX26 and freed to the cytosol [Citation25–27].
The inability to remove PEX5 from the peroxisomal membrane results in a defect in matrix protein import [Citation28], and overexpressing constructs of PEX5 that cannot be removed from the membrane were shown to be ubiquitinated and signal peroxisome degradation [Citation28]. The accumulation of ubiquitinated PEX5 on the peroxisomal membrane has also been shown to occur in a number of cellular conditions that result in the induction of pexophagy, including hypoxia [Citation13], oxidative stress [Citation16], and amino acid starvation [Citation15]. Recently, PEX2, one of the E3 ubiquitin ligases that ubiquitinate PEX5, was found to be upregulated during amino acid starvation to induce pexophagy [Citation15], and in basal condition, the deubiquitinating enzyme USP30 appears to be required to prevent pexophagy [Citation29,Citation30] by counteracting PEX2 [Citation29]. These studies suggest that a disruption of ubiquitinated PEX5 homeostasis on peroxisomes may signal pexophagy. This is further supported by studies that showed the loss of PEX1 or PEX26 expression – two components of the peroxisomal AAA-ATPase that is involved in removing PEX5 from the peroxisome membrane – results in the accumulation of ubiquitinated PEX5 that induces pexophagy [Citation31–33]. However, it is not known whether USP30 and the peroxisomal AAA-ATPase are directly regulated to induce pexophagy. Finally, PEX14 was also shown to be involved in pexophagy, where a decrease in PEX5 binding to PEX14 at peroxisomes has been shown to allow for direct PEX14-MAP1LC3 interaction to target peroxisomes for degradation. However, whether PEX14 is required for ubiquitin-dependent pexophagy is not known [Citation34,Citation35].
Based on the number of peroxisome matrix import proteins implicated in pexophagy, we hypothesized the matrix import system acts as a sensor for functional peroxisomes, and its components regulate pexophagy. A corollary to this hypothesis is that specific peroxin(s) of the import machinery is regulated to prevent the degradation of a healthy peroxisome. To test whether any of the components of the matrix import system are regulated to prevent pexophagy – where their absence results in peroxisome degradation – we performed a siRNA screen of the components of the import system. In this study, using both cultured cells and zebrafish models, we found the absence of PEX13 induces pexophagy by accumulating ubiquitinated PEX5 on peroxisomes and upregulating autophagosome formation via peroxisomal ROS. Further, we found that PEX13 levels are downregulated during the early stages of starvation-induced pexophagy, further supporting a role for PEX13 in regulating pexophagy.
Results
PEX13 depletion reduces peroxisome abundance
To test the hypothesis that matrix import machinery is regulated for the induction of pexophagy, we asked whether any peroxin involved in protein import was required for peroxisome homeostasis. To date, there are nine known mammalian peroxins required for the import of proteins possessing a peroxisome targeting signal 1 (PTS1). These are PEX1, PEX2, PEX5, PEX6, PEX10, PEX12, PEX13, PEX14 and PEX26 [Citation36]. To address whether any of these import factors are required to prevent pexophagy, we depleted their expression using siRNA (Fig. S1A-J, M, O) and quantified peroxisome abundance (). We also tested two essential peroxisome biogenesis factors, PEX3 and PEX19, to control for peroxisome loss caused by defects in biogenesis. PEX3 and PEX19 are the membranes and cytosolic receptors, respectively, for the import of peroxisomal membrane protein and thus are essential for peroxisome biogenesis [Citation2]. To compare the changes in peroxisome numbers within each condition, we quantified peroxisome density from Z-stack confocal images of the entire cells, which is the number of peroxisomes within a cell normalized to the cell volume ().
Figure 1. Depletion of PEX13 results in decreased peroxisome numbers. (A) HeLa cells were transfected with siRNA against PEX1, PEX2, PEX3, PEX5, PEX6, PEX10, PEX12, PEX13, PEX14, PEX19, PEX26 as well as a non-targeting control siRNA (siCTRL). Cells were fixed and immunostained for endogenous peroxisome marker ABCD3. Scale bar: 25 μm (B) Graph of ABCD3 density of images in (A). (n = 3; 30 cells/trial). Error bars represent standard deviation. (C) HeLa cells treated with siCTRL or siPEX13, overexpression WT PEX13-MYC, W313G or I326T, stained anti-MYC and anti-ABCD3. Scale bar: 10 μm. (D) Quantification of images in (C) (n = 3; >30 cells/trial). Error bars represent standard deviation. Asterisks denote p-values compared to siCTRL: *p < 0.05, **p < 0.01.
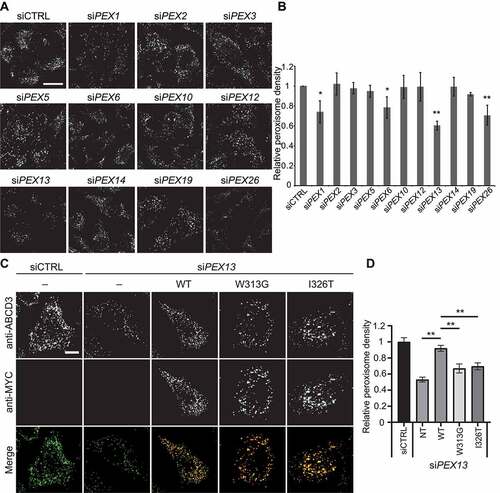
Consistent with our previous work [Citation31], the depletion of PEX1 and PEX26, two members of the peroxisomal AAA-ATPase complex, significantly decreased peroxisome density when compared to the non-targeting control siRNA (siCTRL) (). Under similar conditions, the acute depletion of the peroxisome biogenesis genes PEX3 or PEX19 did not result in a significant decrease in peroxisome numbers () due to the long half-life of peroxisomes [Citation37,Citation38]. The depletion of other matrix-import peroxins did not result in a decrease in peroxisome density, except for peroxins PEX6 and PEX13. Because PEX6 is the other half of the peroxisomal AAA-ATPase with PEX1 [Citation39], it was not surprising that its loss resulted in the loss of peroxisomes. PEX13, conversely, is reported to be a membrane docking protein with PEX14 for PEX5-cargo recruitment to peroxisomes [Citation40], yet only the depletion of PEX13 and not PEX14 resulted in a reduction in peroxisome abundance. To ensure that the peroxisome loss or the lack thereof was not due to an off-target effect of the siRNA, we depleted PEX13 and PEX14 with multiple other siRNAs and found all siRNA against PEX13 effectively depleted PEX13 levels and caused a loss in peroxisome density (Fig. S1L-M), whereas the depletion of PEX14 did not result in a significant loss of peroxisomes (Fig. S1N-O). Further, complementation studies showed that exogenous expression of the MYC-tagged wild-type PEX13, but not the disease-associated PEX13 mutants, W313 G [Citation41] and I326T [Citation42], prevented peroxisomes loss in siPEX13-treated cells (). Nor was the loss of peroxisomes in these cells caused by a decrease in cell viability (Fig. S1K). Finally, under normal conditions, expressing either of the PEX13 functional mutants induced peroxisome loss, whereas no significant difference was observed in cells expressing the wild-type PEX13-MYC (Fig. S2 A, B). Together, these studies suggest that functional PEX13 is required to prevent peroxisome loss.
Peroxisome loss in PEX13-depleted cells is mediated by autophagy
The lack of a significant loss of peroxisomes in cells depleted of either PEX3 or PEX19 suggests the loss of peroxisomes in PEX13-depleted cells is unlikely due to a defect in biogenesis. Since peroxisomes are degraded by autophagy, we examined whether autophagy was responsible for the observed loss of peroxisomes in PEX13 siRNA-treated cells by depleting PEX13 in autophagy-deficient atg5−/− mouse embryonic fibroblasts (MEFs). ATG5 is a major component of the autophagy process that conjugates with ATG12 and forms a complex with ATG16L1 to allow for the expansion and growth of phagophores, the precursors to autophagosomes [Citation43]. The depletion of PEX13 in wild-type MEFs showed a significant decrease in peroxisome abundance compared to siCTRL, however, no significant difference was observed in the atg5−/− MEFs (). Similar results were observed in ATG5 and ATG7 CRISPR-cas9 knockout HeLa cell lines (). Additionally, we pharmaceutically inhibited autophagy with the use of the lysosomotropic autophagy inhibitor hydroxychloroquine (HCQ) and found that it was able to prevent peroxisome loss in PEX13-depleted cells (Fig. S2C, D). Together, these data show that the observed loss of peroxisome in PEX13-depleted cells is mediated by autophagy.
Figure 2. PEX13-mediated peroxisome loss is an autophagic process. (A) Wild type and atg5−/− mouse embryonic fibroblasts (MEFs), transfected with control siRNA (siCTRL) or siPEX13, fixed and immunostained for endogenous ABCD3. (B) Graph of ABCD3 density from images in (A) (n = 3; 30 cells/trial). Error bars represent standard deviation. (C) Wild type, ATG5 knockout and ATG7 knockout HeLa cells stained for endogenous ABCD3. (D) Immunoblot analysis of wild type and ATG5 knockout HeLa cells treated with either siCTRL or siPEX13, probed for the indicated proteins. (E) HeLa cells transfected with non-targeting siRNA (siCTRL) or siPEX13 alone, or siPEX13 co-treated with siATG12, siNBR1, siPEX2 or siPEX5, fixed and immunostained for endogenous ABCD3. (F) Graph of ABCD3 density from images in (E) (n = 3; 30 cells/trial). Error bars represent standard deviation. Asterisks denote p-values: *p < 0.05, **p < 0.01. Scale bars: 25 μm (A and E), 10 μm (C).
PEX13 depletion induces pexophagy
To determine whether the autophagic loss of peroxisomes in PEX13-deficient cells was a selective process, we co-depleted HeLa cells of both PEX13 and one of three critical pexophagy proteins: NBR1 – the autophagy receptor responsible for recognizing ubiquitinated peroxisomes and linking them to a growing phagophore [Citation18]; PEX2 – the peroxisomal E3 ubiquitin ligase responsible for ubiquitinating peroxisomal proteins during pexophagy induction [Citation15]; and PEX5 – a known ubiquitination target during pexophagy [Citation15,Citation31,Citation44]. As a positive control, we co-depleted cells of ATG12 with PEX13. We reasoned that if the loss of peroxisomes in PEX13-depleted cells was due to pexophagy, the co-depletion of pexophagy factors should prevent peroxisome loss. As expected, the co-depletion of PEX13 and ATG12 prevented peroxisome loss. Similarly, co-depletion of pexophagy factors with PEX13 prevented the loss of peroxisomes compared to the depletion of PEX13 alone (; Fig. S1P), suggesting that the loss of PEX13 leads to the activation of pexophagy and the subsequent loss of peroxisomes.
PEX13 depletion accumulates membrane-bound ubiquitinated PEX5
Ubiquitinated PEX5 acts as a signal for several forms of pexophagy, including-ROS induced pexophagy [Citation44,Citation45] and starvation-induced pexophagy [Citation15]. In both cases, the accumulation of ubiquitinated PEX5 on the peroxisomal membrane promotes pexophagy. Similarly, the loss of peroxisomal AAA-ATPase function either by genetic mutation or RNAi depletion caused the accumulation of ubiquitinated PEX5 that signals pexophagy [Citation31]. As co-depletion of PEX5 and PEX13 prevented pexophagy (), we hypothesized that ubiquitination of peroxisome-bound PEX5 may mediate pexophagy in these PEX13-deficient cells. A corollary to this hypothesis is that the loss of PEX13 results in an accumulation of ubiquitinated PEX5 on peroxisomes that signals pexophagy. To examine this hypothesis, we first investigated for possible accumulation of PEX5 on peroxisomes in PEX13 depleted cells compared to control (). As control, we depleted PEX1 as it was previously shown to result in an increase in PEX5 on peroxisomes due to the loss of the AAA-ATPase function to remove PEX5 from peroxisomes [Citation31]. For these experiments, HeLa cells were treated with HCQ to prevent loss of peroxisomes and membrane permeabilizer digitonin prior to fixation to remove cytosolic PEX5. When PEX5 subcellular localization was assessed by immunofluorescence microscopy, we found increased PEX5 colocalization with ABCD3 in cells depleted of PEX1 and PEX13 (). To assess the amount of PEX5 on peroxisomes, we also quantified the mean intensity of PEX5 within ABCD3 structures of the immunofluorescent images. We found there was a significant increase in PEX5 signal in ABCD3 positive structures in both PEX13 and PEX1 depleted cells compared to control siRNA cells (), suggesting that loss of PEX13 resulted in an accumulation of peroxisome-bound PEX5. The depletion of PEX14, conversely, resulted in a decreased PEX5 signal on ABCD3 structures compared to control (), likely due to PEX14 role as the PEX5 membrane docking protein [Citation46].
Figure 3. PEX13 depletion increases membrane localization and ubiquitination of PEX5. (A) HeLa cells transfected with siCTRL, siPEX1, siPEX13, or siPEX14, fixed and stained for endogenous PEX5 (red) and ABCD3 (green). Prior to fixation cells were treated with 0.025% digitonin for 10 seconds to permeabilize the plasma membrane and washed with PBS. (B) Quantification of images in (A). Pearson’s correlation coefficient between PEX5 and ABCD3 was calculated (n = 3; 30 cells/trial). Error bars represent standard deviation. (C) Quantification of PEX5 on peroxisomes (A). Normalized mean fluorescent intensity of PEX5 within ABCD3 structures was calculated (n = 3; 30 cells/trial). Error bars represent standard deviation. (D) Flp-In T-Rex HEK293 cells stably expressing HA-tagged ubiquitin were transfected with siCTRL, siPEX13 or siPEX14 and treated with HCQ (10 μM) and doxycycline (1 μM) for 24 h. 3 h prior to lysis cells were treated with MG132 (10 μM). Immunoprecipitation (IP) with an antibody against the HA epitope tag was performed. Lysates and IP samples were separated by SDS-PAGE and probed for PEX5. (E) Immunofluorescent images of HeLa cells transfected with siCTRL or siPEX13 and co-transfected with USP30-Flag, fixed and stained for ABCD3 (red) and Flag (green). (F) Graph of ABCD3 density from images in (E) (n = 3; 30 cells/trial). Error bars represent standard deviation. (G) Immunoprecipitation of HA-ubiquitin in cells treated with the indicated siRNA as in D, however IP samples were treated with or without 5 mM BME and assessed on non-reducing SDS-PAGE. Full immunoblot of anti-PEX5 is presented in Figure S3B. Scale bars: 25 μm (A), 20 μm (F). Asterisks denote p-values; *p < 0.05, **p < 0.01.
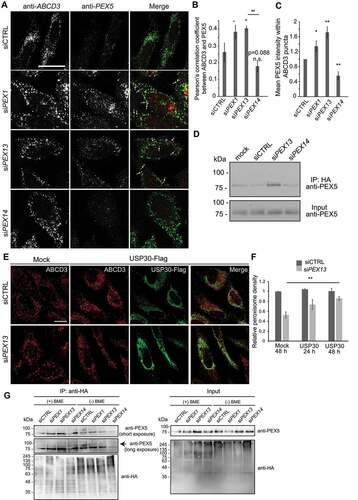
Next, we addressed whether PEX13 depletion results in an increase in ubiquitinated PEX5 by performing immunoprecipitation in Flp-in T-REx HEK293 cells stably expressing HA tagged-ubiquitin (HA-Ub) induced with doxycycline. To ensure our IP was specific and no PEX5 signal was from nonspecific binding to the protein-G agarose beads, we performed the HA immunoprecipitation in cells with and without HA-Ub expression, after which the IP samples were probed for PEX5. We found that only in cells expressing HA-Ub was PEX5 detectable, ensuring the PEX5 signal from IP samples was specific (Fig. S3A). After treatment with siRNA, the cells were treated with doxycycline to induce HA-Ub expression, as well as HCQ and proteasome inhibitor MG132 to block the degradation of ubiquitinated peroxisomal proteins [Citation47–49]. Following immunoprecipitation of HA-Ub, we observed enhanced PEX5 signal in PEX13-depleted cells compared to siCTRL or PEX14 (), suggesting that PEX13 depletion resulted in an increase in PEX5 ubiquitination. To further demonstrate the role of ubiquitination in pexophagy induced by PEX13-depleted cells, we over-expressed the deubiquitinase protein USP30. USP30 was recently shown to regulate pexophagy by deubiquitinating PEX5 on the peroxisomal membrane [Citation29,Citation30]. Overexpression of USP30 after the knockdown of PEX13 was sufficient to increase peroxisome abundance compared to PEX13 knockdown alone, most significantly after 48 h of USP30 expression (). Together, these results suggest that an accumulation of ubiquitinated PEX5 on peroxisomes signals pexophagy in cells depleted of PEX13.
PEX5 can be ubiquitinated on both cysteine and lysine residues on peroxisomes [Citation16,Citation49,Citation50]. To assess whether PEX13 depletion results in cysteine or lysine ubiquitinated PEX5 or both, we again probed for ubiquitinated PEX5 in HA-immunoprecipitated lysates from HEK293 cells stably expressing HA-tagged ubiquitin. To distinguish between lysine and cysteine ubiquitination, we treated the IP samples with or without the reducing agent β-mercaptoethanol (BME). When the IP elutes were analyzed on non-reducing SDS-PAGE, bands corresponding to a single mono-ubiquitinated PEX5 were observed in the IP samples in both +BME and -BME conditions, suggesting PEX5 is ubiquitinated at a lysine residue (). Interestingly, we also observed higher molecular smeared bands in the non-reducing conditions above the primary PEX5 band (, Fig. S3B) that largely disappeared in the BME-treated IP lysates. These bands may result from cysteine ubiquitination, suggesting that PEX5 may be multi-mono-ubiquitinated at both lysine and cysteine-linked ubiquitin.
Inactivation of pex13 results in larval mortality in zebrafish
pex13 knockout (KO) mice show decreased peroxisome numbers and exhibit neonatal death due to phenotypes similar to patients with a severe form of peroxisome biogenesis disorders [Citation51]. Thus the loss of peroxisomes in the pex13 KO mice was concluded to be the result of a defect in peroxisome biogenesis [Citation51]. To test the possibility that the observed loss of peroxisomes in vivo is also due to an increase in pexophagy as observed in culture cells, we generated a pex13 KO zebrafish using the CRISPR-Cas9 system. Initially, heterozygous KO zebrafish harboring a 7 base pair deletion in the exon 1 of the pex13 gene was identified and used to generate homozygous pex13 KO animals (Fig. S4A). To our surprise, homozygous pex13 KO zebrafish obtained from the cross of heterozygous KO animals survived to reach adulthood. However, a maternal and zygotic pex13 KO (MZpex13) zebrafish generated by the cross between homozygous pex13 KO parents died during the larval period, suggesting an indispensable role of Pex13 during early animal development. Over 400 zebrafish observed from multiple crosses, approximately 90–95% of MZpex13 zebrafish died during the larval stages between 9 to 11 days post fertilization (dpf) and most had a dark-liver phenotype due to lipid accumulation in the livers (Fig. S4B). To confirm the dark-liver phenotype being induced specifically by the loss of Pex13, we performed a rescue experiment by expressing human PEX13-GFP (HsPEX13-GFP) in the MZpex13 zebrafish. When expressed in the developing wild type (WT) zebrafish embryos, HsPEX13-GFP was localized to peroxisomes (Fig. S4C). In addition, microinjection of human PEX13-GFP mRNA into the MZpex13 zebrafish partially rescued the dark-liver phenotype (Fig. S4D), indicating a critical role of pex13 in preventing the accumulation of liver lipids in zebrafish.
Chloroquine rescues peroxisome numbers but not liver phenotype in pex13 KO zebrafish
To verify the in vivo role of PEX13 in regulating peroxisome abundance, we used Tg(eef1a/EF1a:RFP-SKL), a transgenic zebrafish that expresses red fluorescent protein (RFP) tagged with a peroxisome matrix targeting sequence 1 (RFP-SKL), to facilitate detection of peroxisomes by fluorescent signals [Citation52]. We found that the RFP-SKL signal appeared as punctate structures that colocalized with peroxisomal membrane protein Abcd3 in WT zebrafish, indicating RFP-SKL being imported in the peroxisomes (). In contrast, we found almost no RFP-SKL colocalized with Abcd3 in the MZpex13 zebrafish, supporting a previously defined role of PEX13 in the matrix import pathway [Citation51]. Moreover, we observed a significant decrease in the number of Abcd3-positive structures in the MZpex13 zebrafish compared to WT zebrafish (), confirming our observation of peroxisome loss upon pex13 depletion both in vivo and in vitro.
Figure 4. Peroxisome number is reduced in the pex13 mutant zebrafish liver and is partially rescued by chloroquine treatment. (A) Peroxisomes detected in wild type (WT) or pex13 mutant (pex13−/−) liver sections either stained with endogenous Abcd3 (upper row) or obtained from a transgenic zebrafish expressing RFP-SKL (lower row), at 5 dpf with and without CQ treatment for 24 h. (B) Quantification of images in (A). Relative abundance and colocalization of RFP-SKL-positive particles or Abcd3-positive particles in livers of WT and pex13−/− with and without CQ treatment were compared (n = 8; approximately 30–40 cells per liver section). Error bars represent standard deviation. (C) Representative images and their quantification from the liver sections of WT or pex13−/− with and without CQ treatment after staining with Oil red-O (ORO). Asterisks denote p-values; *p < 0.05. Scale bar: 10 μm (A), 40 μm (C).
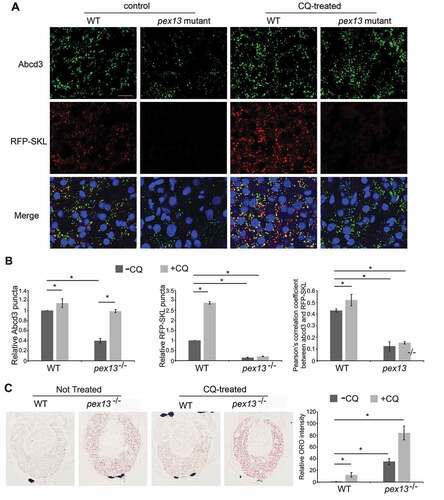
The observation that the MZpex13 zebrafish contained Abcd3-positive peroxisomes suggests that peroxisome biogenesis in these animals might be functionally intact. To test whether the loss of peroxisomes in the MZpex13 animals was mediated by pexophagy and not by defective biogenesis of peroxisomes, we treated the 5 dpf zebrafish with chloroquine (CQ) for 24 h and examined peroxisome abundance. We found that there was a significant increase in Abcd3-positive structures in the liver of both the CQ-treated WT and MZpex13 zebrafish compared to their untreated counterpart (). We also found that the levels of Abcd3 structures in the CQ-treated MZpex13 were not significantly different from the untreated WT animals, suggesting that the loss of peroxisomes in the Pex13-deficient zebrafish was meditated by autophagy. To determine whether the increase in peroxisomes in the Pex13-deficient animals were capable of matrix protein import, we also quantified for RFP-SKL levels. While CQ treatment significantly increased RFP-SKL punctate structures in the liver of the WT zebrafish, there was no change in the RFP-SKL punctate structures in the CQ-treated MZpex13 (), suggesting the Abcd3 structures were not capable of matrix protein import. Colocalization analysis between Abcd3 and RFP-SKL signals further verified our observation that peroxisomes in the MZpex13 zebrafish were deficient in matrix protein import (). Furthermore, CQ treatment did not rescue the accumulation of liver lipids in the MZpex13 zebrafish (). Instead, we observed an increase in liver lipids in both the WT and knockout animals upon CQ-treatment, suggesting that autophagy may be required for lipid droplet turnover in the liver of 5 dpf zebrafish. Together, these results support the culture cell data that the loss of peroxisomes observed in the MZpex13 zebrafish results from enhanced pexophagy but not from defective peroxisome formation.
Loss of PEX13 induces autophagosome formation
Previously, we have shown that PEX1-deficient cells promote pexophagy by upregulating autophagosome formation [Citation31], therefore, we explored whether PEX13 deficiency may also induce autophagy. We examined lipidation of MAP1LC3B by immunoblot analysis and found that the depletion of PEX13 in HeLa cells showed an increase in the autophagosome marker MAP1LC3B-II suggesting an increase in autophagosome formation (, Fig. S2E, F). To ensure that the increase in MAP1LC3B-II represented an increase in autophagosome formation, we quantified the number of GFP-MAP1LC3B puncta in HeLa cells transiently expressing GFP-MAP1LC3B (). Increases in GFP-MAP1LC3B punctate structures were visible in both the PEX1- and PEX13-depleted cells compared to cells treated with non-targeting siRNA or against PEX14 treated (). Quantification of the punctuate structures confirmed the increase seen in the fluorescent images ().
Figure 5. PEX1 and PEX13 depletion induces autophagy, decreases CAT localization to peroxisomes and increases cellular ROS. (A) HeLa cells over-expressing GFP-MAP1LC3B, transfected with siCTRL, siPEX1, siPEX13, siPEX14 alone, or co-transfected with siNBR1. (B) Quantification of images in (A). The number of cells with more than 10 GFP-MAP1LC3B puncta were compared between the siRNA treatments (n = 3; 30 cells/trial). Error bars representing standard deviation. (C) Immunofluorescent images of HeLa cells treated with the indicated siRNAs stained for endogenous catalase (red) and ABCD3 (green). (D) Quantification of mean catalase intensity within ABCD3 structures of images in (A) (n = 3; 30 cells/trial). Error bars represent standard deviation. (E) Membrane fractionation of HEK293 cells treated with indicated siRNA, probed for catalase and ABCD3. Cyto denotes cytosolic fraction, Meb denotes membrane fraction. (F) Live cell images of HeLa cells treated with indicated siRNA and ROS probe OxyBURST. (G) Quantification of mean fluorescent intensity of images in (F) (n = 3; 30 cells/trial). Error bars representing standard deviation. Asterisks denote p-values; *p < 0.05, **p < 0.01. Scale bars: 10 μm (A), 25 μm (C), 50 μm (F).
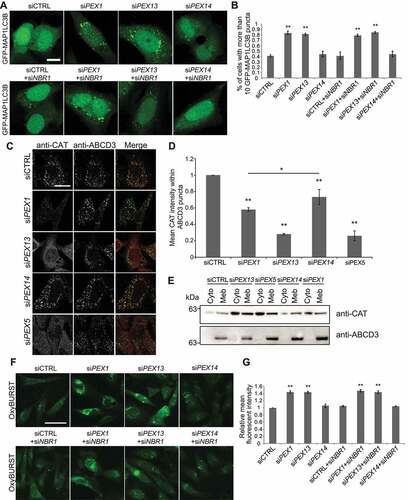
Since the depletion of either PEX1 or PEX13 resulted in peroxisome loss, we next investigated whether the upregulation of autophagy was due to a decrease in peroxisome numbers. To address this question, we prevented pexophagy specifically by co-depleting cells of pexophagy receptor NBR1 [Citation18,Citation19]. Co-depleting NBR1 with either PEX1 or PEX13 (knockdown confirmation Fig. S1Q) did not prevent the induction of autophagosome formation, suggesting that the loss of peroxisome numbers was not a signal for inducing autophagy in PEX1- or PEX13-depleted cells (). These experiments suggest that, like PEX1-depleted cells, the loss of PEX13 function and not the loss of peroxisome numbers upregulates autophagy.
Depletion of PEX13 or PEX1 results in increased catalase localization to the cytosol
In pex13 knockout zebrafish, we found that increasing peroxisome structures by inhibiting autophagy was not sufficient to rescue the Pex13 depletion-associated liver phenotype, suggesting that those peroxisomes were not functional. As most peroxisome enzymes are matrix proteins, we examined the subcellular localization of CAT (catalase), the most abundant peroxisomal matrix protein. We first assessed the effect of depleting the matrix protein import components PEX1, PEX13, PEX14 and PEX5 on CAT subcellular localization by immunofluorescent imaging of cells stained for endogenous ABCD3 and CAT (). We found that depleting the cells of PEX13, PEX5, PEX1, and PEX14 all showed a decreased amount of CAT in peroxisomes and increased cytosolic localization, with siPEX13 and siPEX5 showing the greatest CAT pool in the cytosol (). The decrease in peroxisome localization of CAT was best seen when measuring the mean CAT fluorescent intensity within ABCD3-positive structures, which confirmed PEX13 and PEX5 showing the least amount of CAT followed by PEX1, which was slightly less than PEX14 ().
To validate the change in the subcellular localization of CAT, we compared the membrane fractionation of cells depleted of PEX13, PEX5, PEX14 and PEX1 to the cytosolic fraction. Similar to our immunofluorescence analysis, PEX13 and PEX5 depletion resulted in the most cytosolic CAT compared to the control (). PEX1 and PEX14 depletion showed moderate cytosolic CAT localization, although PEX1 depletion appears to show more CAT in the cytosol than PEX14 ().
PEX1 or PEX13 depletion increases cellular ROS levels
Increases in cellular hydrogen peroxide (H2O2) induce autophagy [Citation53,Citation54], and given that CAT is the major peroxisomal antioxidant [Citation55], we examined whether the loss of either PEX13 or PEX1 induces oxidative stress. To determine whether PEX13 or PEX1 depletion elevated cellular ROS levels, we quantified cellular ROS in live cells using the ROS probe OxyBURST® Green H2DCFDA. The mean OxyBURST® cell intensity was measured in HeLa cells depleted of PEX1, PEX13 or PEX14 and compared to cells treated with siCTRL. We found that the depletion of PEX1 or PEX13 showed increased cellular ROS levels compared to cells treated with siCTRL and siPEX14 (). However, the increase in ROS was not due to decreased peroxisome abundance, as inhibiting peroxisome loss by co-depleting cells of NBR1 did not prevent an increase in cellular ROS (). Together, these results suggest that the loss of PEX13 or PEX1 expression induces oxidative stress that is independent of decreased peroxisome abundance.
PEX1 and PEX13 depletion-mediated ROS upregulates autophagy
Next, we examined whether the increase in cellular ROS in cells depleted of either PEX1 or PEX13 was sufficient to upregulate autophagy by measuring autophagosome formation in HenLe cells stably expressing GFP-MAP1LC3B in the presence or absence of the antioxidant N-acetyl cysteine (NAC) (). Cells were immunostained for ABCD3 and imaged to quantify peroxisome and GFP-MAP1LC3B density. In cells depleted of PEX1 or PEX13, we found GFP-MAP1LC3B density was increased, while peroxisome density was decreased compared to siCTRL or siPEX14 treatment (). However, siPEX1 or siPEX13 cells treated with NAC showed reduced GFP-MAP1LC3B density in comparison to untreated cells, as well as prevented the loss of peroxisomes (), suggesting that the rise in ROS levels due to either PEX1 or PEX13 depletion was responsible for the upregulation in autophagy and hence the increase in pexophagy.
Figure 6. N-acetyl cysteine treatment to PEX1 and PEX13 depleted cells decreases GFP-MAP1LC3B puncta and increases peroxisome abundance but does not change ubiquitination of PEX5. (A) Immunofluorescent images of HenLe cells stably expressing GFP-MAP1LC3B treated with the indicated siRNA and NAC (10 μM) where indicated. Cells were fixed and immunostained for ABCD3 (red). (B) Quantification of GFP-MAP1LC3B density of (A). (n = 3; 30 cells/trial). Error bars represent standard deviation. (C) Quantification of ABCD3 density of (A). (n = 3; 30 cells/trial). Error bars represent standard deviation. (D) Live cell images of HeLa cells treated with the indicated siRNA and ROS probe OxyBURST. (E) Quantification of mean fluorescent intensity of images in (D) (n = 3; 30 cells/trial). Error bars represent standard deviation. (F) IP analysis of HEK293 cells stably expressing HA-ubiquitin. Cells were treated with the indicated siRNA and NAC where indicated. Asterisks denote p-values; *p < 0.05, **p < 0.01. Scale bars: 25 μm (A), 50 μm (D).
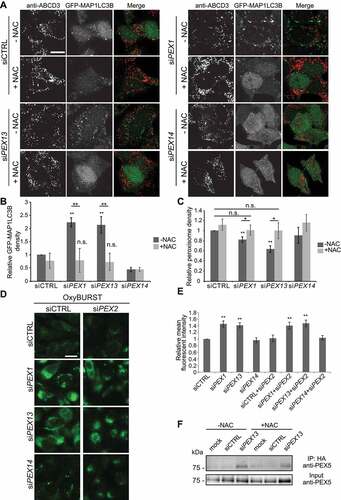
ROS increase and PEX5 ubiquitination are independent events
As the induction of pexophagy in PEX1 and PEX13 depleted cells appears to be dependent on both an increase in ubiquitinated PEX5 () and an increase in cellular ROS (, we investigated whether these processes were dependent on each other. First, we tested whether PEX5 ubiquitination was required to induce ROS upregulation by depleting the cells of the E3 ubiquitin ligase PEX2, which ubiquitinates PEX5 for pexophagy [Citation15], and is required for PEX13-dependent pexophagy (). Co-depleting PEX2 with either PEX1 or PEX13 did not prevent the increase in cellular oxidative stress (), suggesting that increase in ROS in the PEX1- and PEX13-depleted cells were not induced by PEX5 ubiquitination. Next, we examined whether ROS is required to ubiquitinate PEX5 by assessing PEX5 ubiquitination with siPEX13 after NAC treatment. Using HEK293 cells stably expressing HA-Ub, HA-Ub was immunoprecipitated from siRNA transfected cells treated with or without NAC. We found that NAC treatment did not prevent the accumulation of ubiquitinated PEX5- in PEX13-depleted cells (), suggesting that the ubiquitination of PEX5 is not dependent on oxidative stress. Together, these experiments suggest that the increase in ROS and ubiquitination of PEX5 observed with siPEX13 treatment are independent events and not the consequences of each other.
Peroxisomal localized CAT prevents PEX1 and PEX13 depletion induced ROS
Next, we asked whether the induction of cellular oxidative stress was a function of CAT loss from peroxisomes. Although the depletion of PEX1, PEX13 and PEX14 all resulted in an increase in the cytosolic localization of CAT, they differed in the amount of CAT in the cytosol, with PEX13 showing the most and PEX14 the least, suggesting that the absence of CAT in peroxisomes may be responsible for an increase in oxidative stress. To test this hypothesis, we examined cellular ROS levels in cells depleted of PEX5 and found these cells to also show an increase in cellular ROS levels compared to the control (Fig. S5A, B). Importantly, treatment with NAC reduced OxyBURST fluorescent intensity, validating the probe was measuring ROS. To ensure that the oxidative stress observed in the PEX5-depleted cells was not due to a defect in biogenesis, we also examined cells depleted of the peroxisome membrane biogenesis protein PEX16, which has no established role in peroxisome matrix protein import [Citation56]. We found that its depletion did not affect CAT localization (Fig. S5C, D) nor changed the cellular ROS levels (Fig. S5A, B). These results suggest that the loss of CAT from peroxisome may induce oxidative stress.
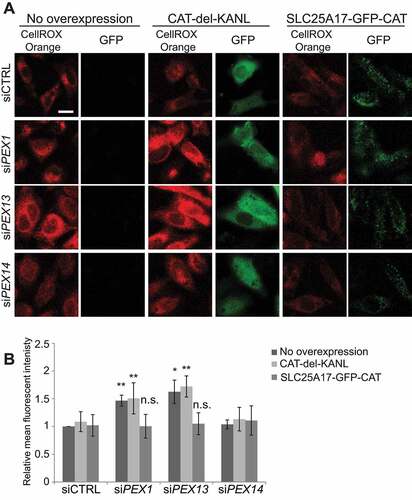
The correlation between loss of CAT from peroxisomes and an increase in oxidative stress suggest that CAT may be required to be at peroxisomes to regulate cellular redox homeostasis. To test whether the loss of CAT from peroxisomes is inducing oxidative stress in the PEX1- and PEX13-depleted cells, we targeted CAT to peroxisomes by fusing it to the peroxisome membrane protein SLC25A17/PMP34 (SLC25A17-GFP-CAT) and compared it to CAT made exclusively cytosolic by the deletion of its peroxisome targeting sequence (GFP-CAT-del-KANL). Although the SLC25A17-GFP-CAT places CAT on the cytosolic side of the peroxisome membrane, we reasoned that if elevated cellular ROS in PEX1- and PEX13-depleted cells was of peroxisomal origin, then expressing SLC25A17-GFP-Catalase would abrogate the increase of cellular ROS in these cells. Due to the spectral similarities between GFP and OxyBURST, CellRox Orange was used for this experiment. As previously shown, ROS levels in PEX1- or PEX13-depleted cells were elevated (). This increase in ROS levels did not change when the cytosolic GFP-CAT-del-KANL was expressed (). However, when peroxisome membrane targeting SLC25A17-GFP-CAT was expressed, ROS levels in both PEX1- and PEX13-depleted cells were decreased to levels similar to siCTRL treatment (). This result not only suggests that CAT needs to be in or near peroxisomes to prevent an increase in cellular ROS levels but also that CAT regulates cellular redox homeostasis from peroxisomes.
Figure 7. Peroxisome targeted catalase diminishes ROS observed with PEX1 and PEX13 depletion. (A) Live cell images of HeLa cells treated with the indicated siRNA and expressing the indicated CAT constructs and visualized with ROS probe CellROX Orange. (B) Quantification of mean fluorescent intensity of (D) (n = 3; 30 cells/trial). Error bars represent standard deviation. Asterisks denote p-values; *p < 0.05, *p < 0.01. Scale bar: 50 μm.
PEX13 is degraded by the proteasome during MTORC1 inhibition to induce pexophagy
Building on the findings that PEX13 loss induced pexophagy, we sought to determine if cellular conditions where pexophagy is activated involved the modulation of PEX13 protein levels as a mechanism for inducing pexophagy. Inhibiting MTORC1 either by rapamycin treatment or amino acid starvation induces pexophagy by increasing ubiquitinated PEX5, which signals peroxisome degradation [Citation15,Citation57]. To test whether PEX13 stability was regulated by MTORC1, we treated cells with rapamycin for 0 to 4 h (Fig. S6A, B) or deprived cells of amino acids by incubating the cells in HBSS () and assessed PEX13 protein levels by immunoblotting. In comparison to peroxisome membrane marker ABCD3 or peroxisome matrix marker ACOX1, we found PEX13 levels were significantly decreased during both amino acid starvation () and rapamycin treatment (Fig. S6A, B). In both experimental conditions, MTORC1 was inhibited (Fig. S6C, D), suggesting that MTORC1 inhibition results in the destabilization of PEX13. A similar decrease in PEX13 levels was also observed in cells treated with torin1 [Citation58] a highly selective inhibitor of MTORC1 and MTORC2 (Fig. S6E-I). However, peroxisome numbers and PEX13 protein levels were not affected when cells were depleted of MTORC2 subunit RICTOR (Fig. S7), suggesting that the MTORC1 and not MTORC2 pathway may be more directly involved in regulating PEX13 stability.
Figure 8. PEX13 protein levels are proteasomally regulated during MTORC1 inhibited pexophagy. (A) Immunoblot analysis of HEK293 cells grown in HBSS for the indicated time, probed for PEX13, ACOX1 and ACTB/β-actin. Asterisks indicate residual ACOX1 band. (B) Quantification of relative protein levels of PEX13 and ACOX1 from (A) (n = 3). (C) Immunoblot analysis of HEK293 cells treated with HBSS and MG132 (10 μM) for 4 h as indicated, and probed for PEX13, ACOX1 and ACTB/β-actin. (D) Quantification of relative protein levels of PEX13 and ACOX1 from (C) (n = 4). (E) Immunoblot analysis of HEK293 cells treated with siCTRL and siPEX2, and HBSS as indicated and probed for PEX13 and VCL/vinculin. (F) Quantification of the relative protein levels of PEX13 in (E). (G) Immunofluorescent images of HeLa cells overexpressing the indicated PEX13-MYC constructs (green) and stained for endogenous ABCD3 (red), treated with HBSS for 24 h as indicated. (H) Quantification of peroxisome density in (G) (n = 3; >30 cells/trial). Error bars represent standard deviation. Asterisks denote p-values; **p < 0.01, ns p > 0.05. Scale bar: 10 μm.
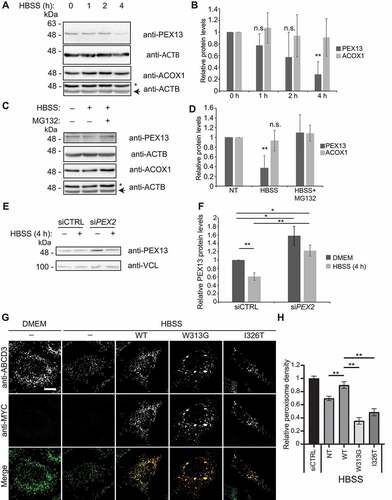
Recently, the Hansenula polymorpha homolog, Pex13, was shown to be degraded by proteasomes [Citation59]. Consistent with proteasome-mediated degradation, treatment with the proteasome inhibitor MG132 prevented the loss of PEX13 levels during HBSS conditions (), suggesting that PEX13 is actively degraded by the proteasome during starvation (). Given that PEX13 levels were decreased by ubiquitination, we next assessed whether peroxisomal E3 ligase PEX2 was involved in regulating PEX13 protein levels. We assessed PEX13 levels in cells depleted of PEX2 and found at basal levels, PEX13 levels were increased with PEX2 depletion (), and when PEX2 depleted cells were treated with HBSS, PEX13 levels were no longer decreased (). These results suggest that PEX2 is involved in the regulation of PEX13 protein levels.
To determine whether the loss of PEX13 was necessary for starvation-induced pexophagy, we performed a rescue experiment by transfecting starved cells with PEX13-MYC. In these experiments, we transfected HeLa cells with PEX13-MYC, 24 h before starving the cells of amino acids. We found that cells expressing PEX13-MYC (WT) did not show a decrease in peroxisome numbers during 24 h of HBSS (). However, the two PEX13 mutants, PEX13W313G [Citation41] and PEX13I326T [Citation42] did not prevent the loss of peroxisome during amino acid starvation. Altogether, these results suggest that PEX13 protein levels may be regulated to enhance pexophagy during amino acid starvation through the inhibition of MTORC1.
Discussion
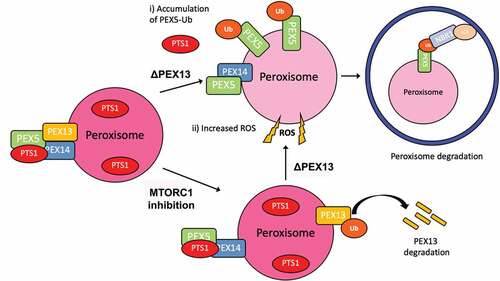
The proper import of peroxisomal matrix proteins into peroxisomes is essential for peroxisomal function as their matrix proteins perform most of the enzymatic activities of peroxisomes. Thus, the importance of the peroxisomal matrix import system to organelle function may underline its involvement in peroxisome quality control. A number of its components have been implicated in the induction of pexophagy, including PEX2, PEX5, and PEX14 [Citation11,Citation20]. On the other hand, genetic mutations in any of the components of the peroxisomal AAA-ATPase that results in the loss of its function result in the accumulation of ubiquitinated PEX5 to signal pexophagy [Citation31]. However, it is not known whether the peroxisomal AAA-ATPase is directly regulated for the induction of pexophagy. Here we identified another matrix protein import peroxin, PEX13, that is required to prevent pexophagy. We found the loss of PEX13 expression induces pexophagy, and PEX13 protein levels are downregulated during the early stages of amino acid starvation to aid in the induction of pexophagy. Mechanistically, we show that the reduction of PEX13 expression results in the (i) accumulation of ubiquitinated PEX5 on peroxisomes and (ii) induction of cellular oxidative stress that upregulates autophagosome formation. These two cellular consequences of PEX13 loss cooperatively promote the degradation of peroxisomes by autophagy (). Our results also show that PEX13 levels are modulated by the MTORC1 signaling pathway suggesting that PEX13 is regulated as part of the cellular response for the induction of pexophagy during MTORC1 inhibition (). Together, our findings support PEX13 as a novel regulator of pexophagy.
Figure 9. Model of PEX13 induction of pexophagy. In this model, we propose that the loss of PEX13 3 (∆PEX13) promotes pexophagy by i) the accumulation of ubiquitinated PEX5 on the peroxisomal membrane that recruits autophagy receptors and ii) increasing cellular ROS levels to upregulate autophagosome formation. PEX13-dependent pexophagy can be observed during amino acid starvation or when MTORC1 is pharmaceutically inhibited.
Regulation of PEX13 protein levels during pexophagy
Our study suggests that PEX13 protein levels may be regulated for the induction of pexophagy during amino acid starvation. We observed that PEX13 protein levels rapidly decreased within the first hour of amino acid starvation or MTORC1 inhibition (, Fig. S6). The ubiquitin-proteasome system mediated this rapid loss of PEX13 as MG132 treatment prevents its loss (). However, it is unlikely that the ubiquitination of PEX13 serves as a signal for pexophagy as exogenously expressing of wild-type PEX13, but not its mutants rescued the loss of peroxisomes during amino acid starvation (), suggesting that a functional PEX13 is required to prevent pexophagy.
How PEX13 levels are regulated for pexophagy was not explored in detail in this study. Given the rapid loss of PEX13, we speculate that it may be a substrate of the peroxisomal E3 ubiquitin ligase PEX2, as PEX2 is rapidly stabilized within the first hour of amino acid starvation [Citation15], and PEX2 depletion prevented PEX13 degradation at basal levels and during HBSS treatment (). However, a detailed mechanism of PEX13 regulation by PEX2 was not addressed in this work. Additionally, during the preparation of this manuscript, the mitochondrial E3 ubiquitin ligase MARCH5 was also shown to target peroxisomes where it acts to induce pexophagy during amino acid starvation by ubiquitinating ABCD3 [Citation60]. Future work needs to be done to determine whether the two E3 ubiquitin ligases, MARCH5 and PEX2, act cooperatively or independently to regulate PEX13 levels and in the induction of pexophagy. Furthermore, we only assessed the ubiquitination status of PEX5 with PEX13 depletion, but it has been demonstrated other PMPs, specifically ABCD3, are ubiquitinated during other forms of pexophagy [Citation15,Citation29,Citation60]. Therefore, it remains possible other, currently, un-identified PMPs are ubiquitinated during PEX13 depletion.
PEX13 and PEX14 in matrix protein import
Our study of PEX13 and PEX14 depleted cells provides new insight into a function of these two proteins in matrix protein import. PEX13 and PEX14 are largely believed to interact together to form the docking complex for the cargo-bound PEX5, where PEX14 interacting with PEX5 to form a pore-like structure allows the import of folded proteins [Citation61,Citation62]. The function of PEX13 interaction with PEX5 is not known, but it has been proposed that PEX13 either aids PEX5 to release its cargo into the matrix or the interaction is required for the release of PEX5 back into the cytosol [Citation63]. In support of PEX14 as the initial PEX5 binding protein, we found that the depletion of PEX14 resulted in a significant decrease in PEX5 on the peroxisomal membrane compared to the control (). However, the depletion of PEX13 resulted in an accumulation of PEX5 on peroxisome membranes which supports the model where PEX13 is involved in the removal of PEX5 from the membrane. Although we did not explore the mechanism by which PEX13 aids in PEX5 recycling, given that membrane-bound PEX5 was ubiquitinated, we speculate that PEX13 may act in dissembling the pore to allow ubiquitinated PEX5 to be removed by the peroxisomal AAA-ATPase. More work examining matrix protein import is required to elucidate the precise function of PEX13.
Our RNAi studies also suggest that PEX14 may not be continuously required for matrix protein import into peroxisomes. Based on the model of PEX14 as the initial receptor for PEX5, we expected the depletion of PEX14 would result in a similar phenotype as cells depleted of PEX5, whereas the depletion of PEX13 may only minimally affect matrix protein import. However, we observed the opposite results, where the depletion of PEX14 only minimally affected matrix protein import compared to PEX5 depletion, whereas the depletion of PEX13 resulted in almost a complete cytosolic localization of CAT similar to PEX5 depleted cells (). This observation was quite surprising given that PEX14 and PEX5 have been proposed to form the main components of the peroxisomal pore [Citation23]. It is possible that even with ~90% knockdown of PEX14 (Fig. S1O), some functional PEX14 may remain and can support matrix protein import. However, given that the depletion of PEX14 does result in a decrease in PEX5 on the peroxisomal membrane, we speculate that PEX14 may not be required for matrix protein import in cells with preexisting PEX5 on the membrane and that these PEX5 molecules are sufficient to form the transient pore independent of PEX14. In support of PEX14 independent import, overexpressing Pex5p in PEX14 null H. polymorpha yeast was shown to compensate matrix import [Citation64], and complementation by the expression of a Pex13 and Pex14 binding mutant of Pex5 in pex5 null Saccharomyces cerevisiae cells was shown to rescue import [Citation65]. It may be possible that PEX13 or even membrane-bound PEX5 may act to recruit cargo-bound PEX5 in the PEX14 knockdown cells. However, further work is required to test this hypothesis.
PEX13, matrix protein import dysfunction and cellular ROS
Recently, the inhibition of CAT was shown to induce pexophagy through the upregulation of cellular ROS levels [Citation45]. Here we demonstrate that the depletion of PEX1 and PEX13 increases ROS levels due to the loss of CAT from peroxisomes and that the oxidative stress induces autophagy to target peroxisomes for autophagic degradation. This induction of oxidative stress was not due to a loss in peroxisome numbers in the PEX1- and PEX13-depleted cells, as preventing pexophagy by silencing the pexophagy receptor NBR1 [Citation18] did not relieve the increase in ROS levels (). Instead, our results suggest that the increase in cellular oxidative stress was caused by the loss of CAT from peroxisomes. However, simply losing peroxisomal CAT was not sufficient to induce pexophagy, as depleting PEX5 caused a cytosolic localization of CAT and oxidative stress without any loss of peroxisomes ( and Fig. S5). This is most likely due to ubiquitinated PEX5 being required to signal pexophagy [Citation15,Citation16,Citation31]. Instead, our results show the loss of PEX13 causes the convergence of two signaling pathways to promote the rapid degradation of peroxisomes: the accumulation of ubiquitinated PEX5 and the upregulation of autophagosome formation through oxidative stress. Similar results were found with PEX1 depletion. Although PEX14 depletion showed some increases in cytosolic CAT, it was less than that observed upon the depletion of PEX13 or PEX1 and thus was not able to induce cellular oxidative stress (), suggesting an existence of a threshold of CAT required in peroxisomes. Although we cannot rule out the possibility that cytosolic localized peroxisomal oxidase may also contribute to the oxidative stress, our finding that targeting CAT to the peroxisomal membrane in the PEX1 and PEX13 depleted cells alleviates the increase in cellular ROS levels suggest that antioxidants localized in peroxisomes are critical for the maintenance of cellular redox homeostasis.
In conclusion, our findings demonstrate PEX13 as a regulated factor in peroxisome quality control. We uncover a novel function for PEX13 in the intricately choreographed matrix import pathway, where PEX13 is required for the removal of PEX5 from the peroxisomal membrane. The loss of PEX13 causes the accumulation of ubiquitinated PEX5 on peroxisomes and a defect in CAT localization. The absence of CAT in peroxisomes causes cellular oxidative stress that upregulates autophagosome formation. Together, these two consequences of the loss of PEX13 function act in synergy to upregulate pexophagy. Finally, we have uncovered PEX13 as a new regulatory factor in the induction of pexophagy during amino acid starvation, where PEX13 levels are rapidly degraded to aid in the activation of pexophagy. Thus, our work suggests that diminishing PEX13 protein levels is an effective and intrinsic way to induce pexophagy. Our finding of PEX13 as a new factor in regulating pexophagy provides further evidence that peroxisome matrix import machinery are regulated to mediate peroxisome homeostasis.
Materials and methods
Plasmids, siRNA and antibodies
CAT-del-KANL construct is a kind gift from Dr. Marc Fransen (KU Leuven, Leuven, Belgium). GFP-CAT-del-KANL was generated by excising the CAT-del-KANL ORF via digestion with SalI and BglII and ligating into equivalent sites in the EGFP-C1 vector. SLC25A17-GFP ORF (as described here [Citation56]) was excised by digestion with NheI and BsrGI and ligated into the equivalent sites in GFP-CAT(delKANL), yielding SLC25A17-GFP-CAT(delKANL). SLC25A17-GFP construct was described here [Citation56]. A human PEX13 expression plasmid was obtained from Origene (RG209140) and then subcloned into pcDNA 3.1/MYC vector (Invitrogen, V85520).
PEX13 genetic variants (WT, W313G and I326T), which are resistant to PEX13 siRNA were generated using the primers listed in by a Site-directed Mutagenesis kit (Intron Biotechnology, 15,071). The siRNA sequences used in this manuscript are listed on . All antibodies used are shown in .
Table 1. List of the oligonucleotide primers used.
Table 2. List of the forward sequences of siRNA used in the study.
Table 3. List of the antibodies used in the study.
Cell culture
HeLa cells were purchased from American Type Culture Collection (CCL-2). Wild-type and atg5−/− MEFs were a gift from Dr. Noboru Mizushima (Tokyo Medical and Dental University). ATG5 and ATG7 KO cells were a gift from Dr. Tomotake Kanki (Niigata University. Japan). HEK-293 T-REx cells stably expressing HA-Ub were a gift from Dr. Brian Raught (University of Toronto). HenLe GFP-MAP1LC3B cells were a gift from Dr. John Brumell (University of Toronto). All cells were grown in Dulbecco’s modified Eagle’s medium (Fisher, 53,695) supplemented with 10% fetal bovine serum (Wisent, 08–150) and 0.1% 200 mM L-glutamine (Fisher, SH3003401) and were cultured at 5% CO2 in a 37°C incubator. Cells were routinely tested for mycoplasma (FroggaBio, 25,235).
Cell transfection
For immunofluorescence imaging, cells were grown on #1 glass coverslips (VWR, CA-89015725) and for live-cell imaging cells were grown on 4-well Lab-tek CVG chambers (Thermo, 155,383). Plasmids and siRNA were transfected using Optimem (Life Technologies, 31,985,070) and Lipofectamine-2000 (Life Technologies, 11,668,019) according to the manufacturer’s instructions. For simultaneous siRNA knockdown and plasmid overexpression, siRNA alone was transfected on the first day, and siRNA and plasmids (0.5 mg DNA per 500 mL) were co-transfected on the second day. For most imaging or biochemical analyses, siRNA treated cells were analyzed 48 h after plasmid/siRNA transfection, unless otherwise indicated. Where indicated, cells were treated with a final concentration of 10 μM NAC (Sigma-Aldrich, A7250), 10 μM rapamycin (Bioshop, RAP004), or 1 μM torin1 (Sigma-Aldrich, 475,991) for 1–24 h before analysis.
Microscope image processing and acquisition
For immunofluorescence, cells grown on coverslips and fixed using 3.7% paraformaldehyde (Cedarlane, 15,710) in phosphate-buffered saline (PBS; Bio Basic Inc., PD8117) for 15 min and washed three times with warm PBS. Cells were permeabilized using 0.1% Triton X-100 (BioShop, TRX506.500) in PBS for 20 min. Cells were then incubated in blocking buffer (10% fetal calf serum in PBS) for 1 h and incubated with the appropriate primary and secondary antibodies in blocking buffer, each for 1-h incubations at room temperature. For experiments where cells were treated with digitonin (Sigma-Aldrich, D141) before fixation (), the 0.0025% digitonin was used for all conditions. Coverslips were mounted onto microscope slides (Fisher, 22,037,247) using Dako Fluorescent Mounting Medium (Dako Canada, 34,538) and dried overnight at room temperature.
Laser-scanning confocal microscopy was performed on a Zeiss LSM710 (NA: 0.55, WD: 26 mm) with a 63x/1.4 Plan- Apochromat oil immersion objective at 37°C (Hospital for Sick Children, Toronto, Ontario, Canada). The microscope has 6 laser lines (405, 458, 488, 514, 561, 633 nm) and 3 channels. For the quantification of ABCD3 structures, images were acquired in Z-sections of 0.5–1.0 mm thickness using ZEN 2009 (Zeiss Enhanced Navigation) acquisition software.
For each experiment set, all images were taken with the same acquisition setting and on the same day. This method allows for direct comparison between the different conditions. All images were acquired with a setting for optimal signal-to-noise ratio and minimal pixel saturation. The brightness/contrast of images was adjusted using Adobe Photoshop merely for presentation purposes, and all images of the same data set were adjusted to the same degree. Images on the figures are representative images that best demonstrate the quantified results.
Image quantification
Images were analyzed using Volocity software (Perkin Elmer, versions 6.0–6.3). At least 30 cells were quantified for each trial (n = 3), averaged and normalized against the control when necessary. For the quantification of peroxisome density, the number of peroxisomal structures (ABCD3) and the volume of the cell were quantified using the “find object” algorithm in Volocity in cells of interest from a Z-stack image. The density of peroxisomes was calculated by dividing the number of peroxisomal structures by the volume of each cell (μm3). Pearson’s correlation co-efficient was measured using Volocity, where the degree of colocalization between two channels was determined in individual cells. At least 30 cells were quantified for each trial (n = 3), averaged, and normalized against the control.
To measure the mean intensity of other fluorescent signals within ABCD3 structures, ABCD3 puncta were identified using the “find object” algorithm in Volocity, and the mean fluorescent intensity of the channel of interest was recorded. The background was subtracted using the mean fluorescent intensity of the channel of interest measured in four different regions outside the ABCD3 structures. At least 30 cells were quantified per trial (n = 3), averaged, and normalized against the control.
Statistical analysis
Statistics were performed on data that had been generated in triplicate using an unpaired Student-t Test. For all experiments, a p-value ≥ 0.05 was considered not significant (ns); 0.01–0.05 was considered significant (*), and < 0.01 was considered very significant (**). All statistics and error bars (representing standard deviation, SD) shown are representative of independent experiments. All statistical analyses were performed on all available data for each experiment.
Immunoblotting
Cells were washed twice with PBS and lysed with lysis buffer (100 mM Tris-HCl [ThermoFisher, BP1521], pH 9, buffer containing 1% SDS [Bio- Rad, 161–0416]) supplemented with 1X protease inhibitor cocktail (BioShop, PIC002.1), and the lysate was heated at 95°C for 15 min, then centrifuged at 13,000 x g for 15 min. The protein concentration in the supernatant was determined by BCA assay (VWR, CA82601–004), equivalent sample amounts (10–20 μg) were made using Laemmli sample buffer (2% SDS, 10% glycerol, 60 mM Tris-Cl, pH 6.8, 100 mM DTT and 0.01% bromophenol blue) were subjected to 10–15% SDS- PAGE and protein was transferred to 0.45-mm PVDF membrane (Bio-Rad, 1,620,177). Membranes were blocked in 5% skim milk (BioShop, SK1400.1) in PBST (1x PBS, 0.05% Tween-20 [BioShop, 1M23298]). Membranes were probed with the appropriate primary, and HRP-conjugated secondary antibodies in 5% skim milk. Proteins were visualized using either Amersham ECL Prime Western Blot Detection Reagent (VWR, CA89168–782) or EZ-ECL (FroggaBio, EZ-ECL-500). Protein density was measured using the imaging processing and analysis software ImageJ and was normalized to the density of the respective loading control.
Membrane fractionation
Cells were washed with cold 1X PBS and lysed using subcellular fractionation buffer (250 mM sucrose [BiShop, SUC507], 20 mM HEPES, pH 7.4, 10 mM KCl [Sigma-Aldrich, 94,505], 1.5 mM MgCl2 [BioShop, MAG516.100] 1 mM EDTA [ThermoFisher, SS412-1], 1 mM EGTA [Sigma-Aldrich, E3889]) with added 1 mM dithiothreitol (Fisher Scientific, R0861) and 1X protease inhibitor cocktail before use. Lysates homogenized using a Dounce homogenizer (50 strokes; Thomas Scientific, 3431E04), left on ice for 5 min, and spun at 3000 x g for 5 min at 4°C. A fraction was taken for the whole cell lysate, and the remaining supernatant was then spun using an ultracentrifuge at 105,000 x g for 30 min at 4°C. The pellet (membrane fraction) was resuspended in lysis buffer (100 mM Tris, pH 9, buffer containing 1% SDS) and the supernatant (cytosol fraction) was transferred to a fresh microcentrifuge tube.
Immunoprecipitation
Flp-In™ T-Rex™ HEK293 (ThermoFisher, R78007) cells stably expressing 3xHA-Ubiquitin were grown in 10 cm dishes treated as described in the main body. Cells were treated with 1 μM α-6-deoxy-5-hydroxytetracycline (doxycycline; Sigma-Aldrich, D5207) and 10 μM hydroxychloroquine sulfate (Sigma-Aldrich, H0915) 24 h prior to lysis, and 10 μM MG132 (Cedarlane, BML-PI102-0025) 3 h prior to lysis. Cells were washed once in PBS and lysed in 1 mL of immunoprecipitation lysis buffer (50 mM HEPES, pH 7.5, 150 mM NaCl, 1% Triton X-100, 10% glycerol, 1.5 mM MgCl2, 1.0 mM EGTA) supplemented with protease inhibitor cocktail. After lysis, protein concentration was determined, and 1 mg of lysate was incubated with 20 uL of protein G agarose beads (BioShop, PRA286) and 1 μg of primary anti-HA antibody overnight at 4°C. Samples were then washed 3 times with lysis buffer and protein was eluted by boiling in SDS-containing sample buffer for 5 min. For the reducing IP conditions, 5 mM BME (Bio-Rad, 1,610,710) was added to SDS-containing sample buffer used in the final boiling step. All samples were run on non-reducing SDS-PAGE.
OxyBURST and cellrox ROS measurements
HeLa cells were grown in Lab-Tek chambers and treated with the indicated siRNA as above. Before imaging the cells were treated with 1 μM OxyBURST Green H2DCFDA (Invitrogen, D2935) diluted in DMEM supplemented with 10% FBS for 20 min, or with 5 μM CellROX Orange (Invitrogen, C10443) diluted in DMEM supplemented with 10% FBS for 30 min. Cells were then washed three times with warm PBS and imaged live in CO2-independent media (Gibco: 18,045,088). Images were taken using a 40x oil immersion objective lens at 37°C with the pinhole open. Images were quantified by measuring the mean fluorescent intensity of individual cells using Volocity. For CellRox experiments, where a GFP-tagged construct had been overexpressed, all cells expressing GFP were quantified. Experiments were performed in triplicate, and at least 30 cells were quantified per trial.
Zebrafish maintenance
All zebrafish lines were maintained at 28.5°C. The embryos were collected, developed in E3 medium (5 mM NaCl, 0.17 mM KCl, 0.33 mM CaCl2, 0.33 mM MgSO4) and staged according to age and morphology based on a standard protocol [Citation66]. The experimental protocol was approved by the Committee for Ethics in Animal Experiments of the Wonkwang University (WKU15-150) and carried out under the guidelines for animal experiments.
Generation of pex13 mutant zebrafish and use of transgenic line
pex13 mutant zebrafish were generated using the CRISPR-Cas9 system as previously described [Citation67]. For making a guide RNA target vector, two complementary 18-bp oligonucleotides were designed corresponding to pex13 target sequence and annealed using the following procedure: 5-min denaturing step at 95°C followed by cooling to 50°C at −0.1°C per second, keeping at 50°C for 10 min and cooling to 4°C at −1°C per second. Then 1 µl of the annealed oligonucleotides are mixed with 400 ng of the pT7-guide RNA (gRNA) cloning vector, 3 restriction enzymes (Esp3I, BglII and SalI; 0.5 µl each), T4 DNA ligase 0.5 µl, 1 µl 10× NEB buffer 3, 1 µl 10× T4 ligase buffer and water to make total 20 µl. Digestion and ligation are performed in a single step in a thermal cycler with the following program: 3 cycles of 20 min at 37°C, 15 min at 16°C, followed by 10 min at 37°C and 15 min at 55°C. A total of 2 µl of the reaction was then used for transformation. The correct gRNA vector (Oligo annealed gRNA vector) was selected by digesting the vector with Esp3I. For making nCas9n RNA, pCS2-Cas9 vector was linearized by digesting with NotI restriction enzyme and purified using a QIAprep column (QIAGEN, 27,106). Then nCas9n RNA was synthesized using mMESSAGE mMACHINE SP6 kit (Invitrogen) and purified using RNeasy Mini kit (QIAGEN, 74,104).
For making gRNA, template DNA (pex13 target oligo annealed gRNA vector) was linearized by digestion with BamHI restriction enzyme and purified using a QIAprep column. Then gRNA was synthesized by in vitro transcription using MEGAshortscript T7 kit (Invitrogen, AM1354) and purified using mirVana™ miRNA Isolation Kit, with phenol (Invitrogen, AM1560). To generate pex13 founder (F0) zebrafish, the mixture of gRNA 20 ng and nCas9n RNA 200 ng was directly injected into one cell stage embryos derived from wild-type cross. F0 fish was crossed with wild-type zebrafish to generate the first generation pex13 heterozygous mutants. Sequencing of genomic DNA confirmed pex13 mutation in the genome, and genomic PCR using adult fin was performed for the identification of pex13 heterozygous and homozygous mutants. Briefly, embryos were anesthetized using 1x tricaine, and a piece of tail cut with a sterile razor blade was transferred to a tube containing 50 µl DNA digestion buffer (10 mM Tris, pH 8, 50 mM EDTA, 200 mM NaCl, 0.5% SDS, 0.5 mg/ml proteinase K [Sigma, P2308-100 MG] in water) and incubated overnight at 55°C. One µl of the sample diluted with 49 µl nucleotide-free water was used for genomic PCR using the forward primer 5’ CTGGCGAATGGGATACTGTACGTGTTA 3’ and the reverse primer 5’ GCGTTGCTACATTTGTAAATACTGGGC3’ that were designed to amplify the region that covers deleted base pair of pex13 gene. AccuPower Taq PCR PreMix (Bioneer, K-2602) was used for PCR reaction, and the reaction was performed according to the manufacturer’s instructions. Tg(Xla.Eef1a1:RFP-SKL) transgenic zebrafish were previously reported [Citation52]. Zebrafish of a Tg(Xla.Eef1a1:RFP-SKL) transgenic line harboring the pex13 mutation were obtained by crossing the two lines of zebrafish.
Whole mount oil red-O staining of zebrafish
Whole mount Oil red-O staining was performed as previously described [Citation68]. Oil red-O was purchased from Sigma-Aldrich (Sigma-Aldrich, O0625-25 G). Stained embryos were processed for cryosection to obtain a 50-µm thick section. Liver tissue sections were captured using a Leica M165 FC microscope equipped with Leica DFC500. For quantification, the entire liver area was selected from each image and staining intensity was measured using ImageJ (NIH, USA). Average intensity was presented with standard deviation. Statistical significance (p < 0.05) was determined using an unpaired Student-t Test.
Cryosection of zebrafish larvae
Embryos at desired stages were fixed in AB fix (8% paraformaldehyde + 2x fix) solution overnight at 4°C (2x fix solution = sucrose 8 g, 1 M CaCl2 [30 µl], 20x PBS [5 ml], water to make total 100 mL) and washed with PBST. Embryos were then embedded in the embedding solution (1.5% agarose [USB corporation, 9012–36-6], 5% sucrose) at 65°C in the inverted position, and the agarose was allowed to solidify at room temperature. The agarose-embedded embryos were soaked in 30% sucrose solution overnight at 4°C. The sample was then frozen by placing it on top of methyl butane dipped in liquid nitrogen by using plastic cryomold and stored at −80°C until used. The samples were then embedded in OCT compound (VWR, 25,608–930) and cryosectioned using cryomicrotome HX525 NX (Thermo Fisher Scientific, Waltham, MA, USA) at the desired thickness. The sectioned samples were attached to super frost microscopic slides and dried for 1–3 h, and processed as per specific experiments.
Immunofluorescence staining of zebrafish larvae
Slides were dried for 1–3 h and washed with PBS three times for 5 min. Tissue samples were then incubated in a blocking solution (0.5 ml sheep serum [Gibco, 16,070,096], 0.5 ml 100 mg/ml BSA [Merck, A8806], 1x PBS to make a total of 20 ml) for 1 h at room temperature. Samples were then treated with primary anti-ABCD3 antibody (1:500; Abcam) diluted in a blocking solution at 4°C overnight and washed with PBS. Samples were incubated with secondary Alexa Fluor-conjugated anti-rabbit antibody (1:1000; Life Technologies) diluted in blocking buffer at room temperature for 2 h, washed, and incubated with DAPI (1:1000 in 1x PBS) for 10 min in the dark followed by PBS washing. Tissue samples were then mounted with a cover slip and mounting solution, and images were taken using confocal microscopy (Olympus IX81, Fluoview FV1000) at the Core Facility for Supporting Analysis & Imaging of Biomedical Materials at Wonkwang University supported by National Research Facilities and Equipment Center.
Light and fluorescence microscopy of zebrafish embryos and larvae
For whole-mount images of zebrafish embryos, embryos were anaesthetized using 1x tricaine and positioned using a 1.5% agarose plate and images were taken using a Leica M165 FC microscope equipped with Leica DFC500. Images for cryo-sectioned Oil Red-O stained samples were taken using an Olympus IX71 fluorescence microscope. Other fluorescent images after antibody staining or from a transgenic zebrafish were captured using confocal microscope.
Drug treatment and statistical analyses of fluorescence images of zebrafish
To test the effect of autophagy blockage on peroxisome number, the wild-type or pex13 mutants were treated with 250 µM CQ (Sigma-Aldrich, C6628) for 24 h in E3 medium starting from 5 dpf. Medium with the drug was changed daily. Each image contained approximately 30–40 liver cells, and the entire field was used to determine abundance and colocalization. For quantification of puncta positive for RFP-SKL or Abcd3, particle analyses of fluorescent images from sectioned livers were performed using ImageJ (NIH, USA). Similarly, colocalization analysis to calculate Pearson’s correlation coefficient was performed using ImageJ. For relative abundance, the value of WT control was set to 1, and the rest were adjusted and presented accordingly. Statistical significance (p < 0.05) of the samples between non-treated and chloroquine-treated samples was determined using an unpaired Student t-Test.
Rescue experiment of zebrafish
Human PEX13 cDNA fused to GFP (HsPEX13-GFP) from this vector (Origene, RG209140) was subcloned into the pCS2+ vector (described in ref [Citation69].). HsPEX13-GFP mRNA (500 pg) synthesized in vitro using the mMESSAGE mMACHINE kit (Invitrogen, AM1340) was microinjected into pex13 mutant zebrafish at the one cell stage and the number of larvae with normal or fatty liver was manually counted at 5 dpf.
Supplemental Material
Download MS Word (2.7 MB)Acknowledgments
This work was supported by operating grants from the Canadian Institutes of Health Research (PJT#156196) to P.K.K.; NRF-2019R1I1A3A01061491 and NRF-2021R1A5A8029876 to S.-K.C. and NRF-2020R1A2C2003523 to DHC and NRF of Ministry of Education 2020R1I1A1A01073696 to DSJ. N.D.D and V.R. are recipients of a Restracomp Fellowship from the Hospital for Sick Children.
Disclosure statement
The authors declare no conflicts of interest.
Supplementary material
Supplemental data for this article can be accessed online at https://doi.org/10.1080/15548627.2022.2160566
Additional information
Funding
References
- Wanders RJA, Waterham HR. Biochemistry of mammalian peroxisomes revisited. Annu Rev Biochem. 2006;75(1):295–332. http://www.annualreviews.org/doi/10.1146/annurev.biochem.74.082803.133329
- Farré J, Mahalingam SS, Proietto M, et al. Peroxisome biogenesis, membrane contact sites, and quality control. EMBO Rep. [Internet]. 2018;e46864. http://embor.embopress.org/lookup/doi/10.15252/embr.201846864
- Fidaleo M. Peroxisomes and peroxisomal disorders: the main facts.Exp Toxicol Pathol.2010;62(6):615–625.
- Boveris A, Oshino N, Chance B. The cellular production of hydrogen peroxide. Biochem J. Internet]. 1972;128:617–630. http://www.ncbi.nlm.nih.gov/pubmed/4404507%0Ahttp://www.pubmedcentral.nih.gov/articlerender.fcgi?artid=PMC1173814
- Waterham HR, Ferdinandusse S, Wanders RJA. Human disorders of peroxisome metabolism and biogenesis.Biochim Biophys Acta Mol Cell Res.2016;1863(5):922–933.
- Nazarko TY. Pexophagy is responsible for 65% of cases of peroxisome biogenesis disorders.Autophagy.2017;13(5):991–994.
- Eberhart T, Kovacs WJ. Pexophagy in yeast and mammals: an update on mysteries.Histochem Cell Biol.2018;150(5):473–488.
- Klionsky DJ, Klionsky DJ, Abdelmohsen K, et al. Guidelines for the use and interpretation of assays for monitoring autophagy. Autophagy. 3rd. 2016;12:1–222. http://www.tandfonline.com/doi/pdf/10.1080/15548627.2015.1100356?needAccess=true
- Kirkin V. History of the selective autophagy research: how did it begin and where does it stand today?J Mol Biol.2020;432(1):3–27.
- Gatica D, Lahiri V, Klionsky DJ. Cargo recognition and degradation by selective autophagy.Nat Cell Biol.2018;20(3):233–242.
- Germain K, Kim PK. Pexophagy: a model for selective autophagy. Int J Mol Sci. 2020;21(2):1–27.
- Johansen T, Lamark T. Selective autophagy: ATG8 family proteins, LIR motifs and cargo receptors.J Mol Biol.2020;432(1):80–103.
- Walter KM, Schönenberger MJ, Trötzmüller M, et al. Hif-2α Promotes degradation of mammalian peroxisomes by selective autophagy. Cell Metab. 2014;20(5):882–897.
- Markhard AL, Skinner OS, To T, et al. Genetic screen for cell fitness in high or low oxygen highlights mitochondrial and lipid resource genetic screen for cell fitness in high or low oxygen highlights mitochondrial and lipid metabolism. Cell. 2020:1–12. 10.1016/j.cell.2020.03.029
- Sargent G, van ZT, Shatseva T, et al. PEX2 is the E3 ubiquitin ligase required for pexophagy during starvation. J Cell Biol. 2016;214(6):677–690.
- Zhang J, Tripathi DN, Jing J, et al. ATM functions at the peroxisome to induce pexophagy in response to ROS. Nat Cell Biol. 2015;17(10):1259–1269.
- Kim PK, Hailey DW, Mullen RT, et al. Ubiquitin signals autophagic degradation of cytosolic proteins and peroxisomes. Proc Natl Acad Sci U S A. 2008;105:20567–20574. http://www.ncbi.nlm.nih.gov/pubmed/19074260%5Cnhttp://www.pubmedcentral.nih.gov/articlerender.fcgi?artid=PMC2602605
- Deosaran E, Larsen KB, Hua R, et al. NBR1 acts as an autophagy receptor for peroxisomes. J Cell Sci. [Internet]. 2013;126:939–952. http://www.ncbi.nlm.nih.gov/pubmed/23239026
- Ichi YS, Abe K, Tatemichi Y, et al. The membrane peroxin PEX3 induces peroxisome-ubiquitination-linked pexophagy. Autophagy. 2014;10(9):1549–1564.
- Li J, Wang W. Mechanisms and functions of pexophagy in mammalian cells. Cells. 2021;10(5):1094.
- Mahalingam SS, Shukla N, Farré JC, et al. Balancing the opposing principles that govern peroxisome homeostasis. Trends Biochem Sci. 2021;46(3):200–212.
- Dammai V, Subramani S. The human peroxisomal targeting signal receptor, Pex5p, Is translocated into the peroxisomal matrix and recycled to the cytosol. Cell. 2001;105(2):187–196.
- Meinecke M, Cizmowski C, Schliebs W, et al. The peroxisomal importomer constitutes a large and highly dynamic pore. Nat Cell Biol. 2010;12(3):273–277.
- Platta HW, El Magraoui F, Bäumer BE, et al. Pex2 and pex12 function as protein-ubiquitin ligases in peroxisomal protein import. Mol Cell Biol Internet]. 2009;29(20):5505–5516. http://www.pubmedcentral.nih.gov/articlerender.fcgi?artid=2756880&tool=pmcentrez&rendertype=abstract
- Platta HW, Grunau S, Rosenkranz K, et al. Functional role of the AAA peroxins in dislocation of the cycling PTS1 receptor back to the cytosol. Nat Cell Biol. 2005;7(8):817–822.
- Gardner BM, Castanzo DT, Chowdhury S, et al. The peroxisomal AAA-ATPase Pex1/Pex6 unfolds substrates by processive threading. Nat Commun. [Internet]. 2018;9:135. Available from http://www.nature.com/articles/s41467-017-02474-4.
- Hagmann V, Sommer S, Fabian P, et al. Chemically monoubiquitinated PEX5 binds to the components of the peroxisomal docking and export machinery. Sci Rep. 2018;8:1–13.
- Nordgren M, Francisco T, Lismont C, et al. Export-deficient monoubiquitinated PEX5 triggers peroxisome removal in SV40 large T antigen-transformed mouse embryonic fibroblasts. Autophagy. 2015;11(8):1326–1340.
- Riccio V, Demers N, Hua R, et al. Deubiquitinating enzyme USP30 maintains basal peroxisome abundance by regulating pexophagy. J Cell Biol. 2019;218(3):798–807.
- Marcassa E, Kallinos A, Jardine J, et al. Dual role of USP 30 in controlling basal pexophagy and mitophagy. EMBO Rep. [Internet]. 2018;19:e45595.
- Law KB, Bronte-Tinkew D, Di Pietro E, et al. The peroxisomal AAA ATPase complex prevents pexophagy and development of peroxisome biogenesis disorders. Autophagy. 2017;13(5):868–884.
- Dahabieh MS, Huang F, Goncalves C, et al. Silencing PEX26 as an unconventional mode to kill drug-resistant cancer cells and forestall drug resistance. Autophagy. 2021;18(3):540–558.
- Park NY, Jo DS, Park SJ, et al. Depletion of HNRNPA1 induces peroxisomal autophagy by regulating PEX1 expression. Biochem Biophys Res Commun. 2021;545:69–74.
- Hara-Kuge S, Fujiki Y. The peroxin Pex14p is involved in LC3-dependent degradation of mammalian peroxisomes.Exp Cell Res.2008;314(19):3531–3541.
- Jiang L, Hara-Kuge S, Yamashita SI, et al. Peroxin Pex14p is the key component for coordinated autophagic degradation of mammalian peroxisomes by direct binding to LC3-II. Genes Cells. 2015;20(1):36–49.
- Wang W, Subramani S. Role of PEX5 ubiquitination in maintaining peroxisome dynamics and homeostasis. Cell Cycle. 2017;4101:1–9.
- Fang Y, Morrell JC, Jones JM, et al. PEX3 functions as a PEX19 docking factor in the import of class I peroxisomal membrane proteins. J Cell Biol. 2004;164(6):863–875.
- Huybrechts SJ, Van Veldhoven PP, Brees C, et al. Peroxisome dynamics in cultured mammalian cells. Traffic. 2009;10(11):1722–1733.
- Pedrosa AG, Francisco T, Ferreira MJ, et al. A mechanistic perspective on pex1 and pex6, two aaa+ proteins of the peroxisomal protein import machinery. Int J Mol Sci. 2019;20(21):1–17.
- Baker A, Hogg TL, Warriner SL. Peroxisome protein import a complex journey. Biochem Soc Trans. 2016;44:783–789.
- Krause C, Rosewich H, Woehler A, et al. Functional analysis of PEX13 mutation in a Zellweger syndrome spectrum patient reveals novel homooligomerization of PEX13 and its role in human peroxisome biogenesis. Hum Mol Genet. 2013;22(19):3844–3857.
- Shimozawa N, Suzuki Y, Zhang Z, et al. Nonsense and temperature-sensitive mutations in PEX13 are the cause of complementation group H of peroxisome biogenesis disorders. Hum Mol Genet. 1999;8:1077–1083.
- Mizushima N, Yamamoto A, Hatano M, et al. Dissection of autophagosome formation using apg5-deficient mouse embryonic stem cells. J Cell Biol. 2001;152:(4):657–668.
- Zhang J, Tripathi DN, Jing J, et al. ATM functions at the peroxisome to induce pexophagy in response to ROS. Nat Cell Biol. 2015;17(10):1259–1269.
- Lee JN, Dutta RK, Maharjan Y, et al. Catalase inhibition induces pexophagy through ROS accumulation. Biochem Biophys Res Commun. [Internet]. 2018;501:696–702.
- Albertini M, Rehling P, Erdmann R, et al. Pex14p, a peroxisomal membrane protein binding both receptors of the two PTS-dependent import pathways. Cell. 1997;89(1):83–92.
- Kiel JAKW, Emmrich K, Meyer HE, et al. Ubiquitination of the peroxisomal targeting signal type 1 receptor, Pex5p, suggests the presence of a quality control mechanism during peroxisomal matrix protein import. J Biol Chem. 2005;280(3):1921–1930.
- Platta HW, Girzalsky W, Erdmann R. Ubiquitination of the peroxisomal import receptor Pex5p. Biochem J. 2004;384(1):37–45.
- Wang W, Xia ZJ, Farré JC, et al. TRIM37, a novel E3 ligase for PEX5-mediated peroxisomal matrix protein import. J Cell Biol. 2017;216(9):2843–2858.
- Platta HW, El Magraoui F, Schlee D, et al. Ubiquitination of the peroxisomal import receptor Pex5p is required for its recycling. J Cell Biol. 2007;177(2):197–204.
- Maxwell M, Bjorkman J, Nguyen T, et al. Pex13 inactivation in the mouse disrupts peroxisome biogenesis and leads to a zellweger syndrome phenotype. Mol Cell Biol Internet]. 2003;23:5947–5957.)
- Kim D, Song J, Kang Y, et al. Fis1 depletion in osteoarthritis impairs chondrocyte survival and peroxisomal and lysosomal function. J Mol Med. 2016;1373–1384. 10.1007/s00109-016-1445-9.
- Scherz-Shouval R, Shvets E, Fass E, et al. Reactive oxygen species are essential for autophagy and specifically regulate the activity of Atg4. EMBO J. 2007;26(7):1749–1760.
- Scherz-Shouval R, Elazar Z. Regulation of autophagy by ROS: physiology and pathology. Trends Biochem Sci.2011;36(1):30–38.
- Fransen M, Lismont C. Redox signaling from and to peroxisomes: progress, challenges, and prospects. Antioxid Redox Signal. 2019;30(1):95–112.
- Kim PK, Mullen RT, Schumann U, et al. The origin and maintenance of mammalian peroxisomes involves a de novo PEX16-dependent pathway from the ER. J Cell Biol. 2006;173:521–532.
- van Zutphen T, Ciapaite J, Bloks VW, et al. Malnutrition-associated liver steatosis and ATP depletion is caused by peroxisomal and mitochondrial dysfunction. J Hepatol. 2016;65(6):1198–1208.
- Chen Y, Zhou X. Research progress of mTOR inhibitors. Eur J Med Chem. 2020;208:112820.
- Chen X, Devarajan S, Danda N, et al. Insights into the role of the peroxisomal ubiquitination machinery in Pex13p degradation in the yeast hansenula polymorpha. J Mol Biol. 2018;430:1545–1558. https://www.sciencedirect.com/science/article/pii/S0022283618302018?via%3Dihub.
- Zheng J, Chen X, Liu Q, et al. Ubiquitin ligase MARCH5 localizes to peroxisomes to regulate pexophagy. J Cell Biol. 2022;221:e202103156. http://www.ncbi.nlm.nih.gov/pubmed/34747980
- Barros-Barbosa A, Ferreira MJ, Rodrigues TA, et al. Membrane topologies of PEX13 and PEX14 provide new insights on the mechanism of protein import into peroxisomes.FEBS J. 2018;286:205–222.
- Walter T, Erdmann R. Current Advances in Protein Import into Peroxisomes. Protein J.2019;38(3):351–362.
- Williams C, Distel B. Pex13p: docking or cargo handling protein? Biochim Biophys Acta Mol Cell Res. 2006;1763(12):1585–1591.
- Salomons FA, Kiel JAKW, Faber KN, et al. Overproduction of Pex5p stimulates import of alcohol oxidase and dihydroxyacetone synthase in a Hansenula polymorpha pex14 null mutant. J Biol Chem. 2000;275(17):12603–12611.
- Kerssen D, Hambruch E, Klaas W, et al. Membrane association of the cycling peroxisome import receptor Pex5p. J Biol Chem. 2006;281(37):27003–27015.
- Kimmel CB, Ballard WW, Kimmel SR, et al. Stages of embryonic development of the zebrafish. Dev Dyn. 1995;203(3):253–310
- Jao L, Wente SR, Chen W. Efficient multiplex biallelic zebrafish genome editing using a CRISPR nuclease system. Proc Natl Acad Sci U S A. Internet]. 2013;110:13904–13909.
- Van Der Velden YU, Wang L, Zevenhoven J, et al. The serine-threonine kinase LKB1 is essential for survival under energetic stress in zebrafish. Proc Natl Acad Sci U S A. 2011;108(11):4358–4363.
- Vlachakis N, Choe SK, Sagerström CG. Meis3 synergizes with Pbx4 and Hoxb1b in promoting hindbrain fates in the zebrafish. Development. 2001;128(8):1299–1312.