
ABSTRACT
The contribution of mitochondria to the metabolic function of hypoxic NP cells has been overlooked. We have shown that NP cells contain networked mitochondria and that mitochondrial translocation of BNIP3 mediates hypoxia-induced mitophagy. However, whether BNIP3 also plays a role in governing mitochondrial function and metabolism in hypoxic NP cells is not known. BNIP3 knockdown altered mitochondrial morphology, and number, and increased mitophagy. Interestingly, BNIP3 deficiency in NP cells reduced glycolytic capacity reflected by lower production of lactate/H+ and lower ATP production rate. Widely targeted metabolic profiling and flux analysis using 1-2-13C-glucose showed that the BNIP3 loss resulted in redirection of glycolytic flux into pentose phosphate and hexosamine biosynthesis as well as pyruvate resulting in increased TCA flux. An overall reduction in one-carbon metabolism was noted suggesting reduced biosynthesis. U13C-glutamine flux analysis showed preservation of glutamine utilization to maintain TCA intermediates. The transcriptomic analysis of the BNIP3-deficient cells showed dysregulation of cellular functions including membrane and cytoskeletal integrity, ECM-growth factor signaling, and protein quality control with an overall increase in themes related to angiogenesis and innate immune response. Importantly, we observed strong thematic similarities with the transcriptome of a subset of human degenerative samples. Last, we noted increased autophagic flux, decreased disc height index and aberrant COL10A1/collagen X expression, signs of early disc degeneration in young adult bnip3 knockout mice. These results suggested that in addition to mitophagy regulation, BNIP3 plays a role in maintaining mitochondrial function and metabolism, and dysregulation of mitochondrial homeostasis could promote disc degeneration.
Abbreviations: ECAR extracellular acidification rate; HIF hypoxia inducible factor; MFA metabolic flux analysis; NP nucleus pulposus; OCR oxygen consumption rate; ShBnip3 short-hairpin Bnip3
Introduction
The most prevalent cause of disability worldwide is chronic low-back pain, which is strongly associated with intervertebral disc degeneration [Citation1,Citation2]. As an extracellular matrix (ECM)-rich tissue, the disc provides flexibility to the spinal column by absorbing mechanical loads. Altered ECM synthesis, catabolic processes, increased apoptosis, and senescence are hallmarks of aging and degeneration of the disc [Citation3–5]. One of the commonly dysregulated pathways during disc degeneration is autophagy and several studies have suggested a complex relationship between autophagy, cell survival, and apoptosis [Citation6]. The disc is the largest avascular tissue in mammals, and nucleus pulposus (NP) cells at the center of the disc experience a hypoxic environment. These cells receive oxygen and nutrients through diffusion across the cartilaginous endplates and robustly express transcription factor HIF1A/HIF1α (hypoxia inducible factor 1, alpha subunit), which is critical for survival and metabolic adaptation to this specialized niche. Since NP cells primarily rely on glycolysis for energy production [Citation7–9] it gave rise to the notion that they possess few functional mitochondria [Citation10]. Contrasting this hypothesis, we recently showed that NP cells possess functional mitochondrial network and allows active mitophagic flux to adjust mitochondrial number to match the metabolic demand [Citation11].
Although mitochondria are known as the powerhouse of the cell, they contribute to the regulation of cellular calcium levels, proliferation, apoptosis, biosynthetic pathways, and most importantly cellular quality control. Due to these important functions, it is critical to maintain a healthy and functional pool of mitochondria. It has been shown that mitochondrial morphology and dynamics are altered in several degenerative and metabolic diseases [Citation12–16]. As highly dynamic organelles, mitochondrial number and mass are regulated through continuous fusion and fission events [Citation17,Citation18]. Fission is associated with mitophagy which plays a critical role in the degradation and recycling of defective and old mitochondria. There are two major mitophagy pathways to remove dysfunctional mitochondria and maintain cell homeostasis: the non-receptor-mediated, canonical PINK-PRKN/PARKIN pathway [Citation19–21] and the receptor-mediated noncanonical pathway. The known outer mitochondrial membrane mitophagy receptors are BCL2 family proteins BNIP3 (BCL2/adenovirus E1B interacting protein 3), BNIP3L/NIX (BCL2/adenovirus E1B interacting protein 3-like), BCL2L13 (BCL2-like 13 (apoptosis facilitator); a functional mammalian homolog of yeast Atg32), and the first novel hypoxia inducible receptor FUNDC1 (FUN14 domain containing 1) [Citation22,Citation23], serving as inducible receptors in response to various stimuli. These receptors possess MAP1LC3/LC3 (microtubule-associated protein 1 light chain 3)-interacting regions (LIRs), which bind directly to LC3 proteins within autophagosomes to initiate mitophagy [Citation24].
Recently we showed that hypoxia and HIF1A control mitochondrial number and morphology and that hypoxia-induced mitophagy in NP cells occurs through the mitochondrial translocation of BNIP3 [Citation11]. BNIP3 was initially recognized as a pro-apoptotic protein, with an atypical BH3 domain that localizes to the mitochondrial outer membrane. Its induction triggers the insertion and activation of BAK1 (BCL2-antagonist/killer 1) and apoptosis regulator BAX (BCL2-associated X protein) to the mitochondria and permeabilization of the mitochondrial membrane with subsequent release of CYCS (cytochrome c, somatic) to initiate the apoptosis [Citation25]. However, due to its role as a mitophagy receptor, BNIP3 also serves as a pro-survival protein [Citation11]. The bidirectional function of BNIP3 in apoptosis and mitophagy suggests that BNIP3 is a key regulator of cell fate.
Several studies have highlighted that inefficient mitophagy causes the accumulation of dysfunctional mitochondria in age-related pathologies and metabolic diseases [Citation26,Citation27]. Of interest, dysregulation of autophagy and mitochondrial function are linked to disc degeneration [Citation6]. A genome-wide association meta-analysis showed that a single nucleotide polymorphism (SNP) in the PRKN/PARK2 gene thought to decrease PRKN expression is associated with human lumbar disc degeneration [Citation28]. PRKN, an E3 ubiquitin ligase involved in mitophagy, promotes the degradation of uncoupled and damaged mitochondria. It is therefore likely that dysregulation of mitophagy which is critical in clearing damaged mitochondria triggers a degenerative cascade in disc cells. Previously we have shown that in hypoxic NP cells HIF1A promotes recruitment of BNIP3 to mitochondria and induces mitophagy [Citation11]. Herein we investigate the contribution of BNIP3 in mitophagy and mitochondrial function in NP cells. Our results show that the loss of BNIP3 in NP cells resulted in mitochondrial dysfunction causing altered metabolism, cellular bioenergetics, and meta-inflammation and the exhibition of early signs of disc degeneration in young adult mice.
Results
BNIP3 loss causes alterations in mitochondrial number and morphology
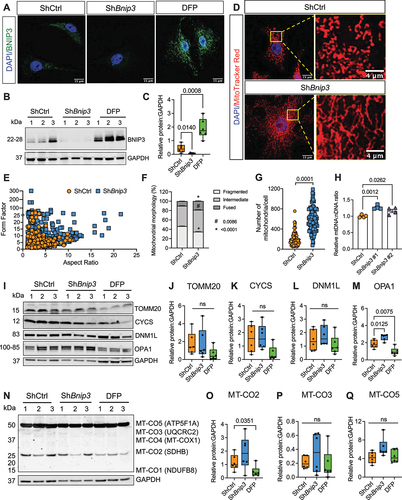
Previously we have shown that hypoxia and HIF1A control mitochondrial number and morphology in NP cells and that hypoxia-induced mitophagy occurs through the mitochondrial translocation of BNIP3. We therefore investigated the role of BNIP3 in mitochondrial function using a loss-function approach. BNIP3 knockdown in NP cells cultured in hypoxia using two lentivirally delivered ShRNAs was confirmed by confocal imaging and western blot analysis (, Fig. S1A, 1 H). BNIP3-deficient cells were stained with MitoTracker Red to visualize mitochondrial morphology and evidenced increased length and branching as demonstrated by higher aspect ratio and form factor. Quantification of mitochondrial morphology in BNIP3 knockdown cells showed that the percentage of fragmented mitochondria significantly decreased whereas intermediate and fused mitochondria percentage increased significantly (, Fig. S1B-D). Moreover, BNIP3-deficient cells showed an increase in mitochondria number compared to control cells (, Fig. S1E). Supporting increased mitochondrial number, the BNIP3 knockdown cells showed a higher mtDNA:nDNA than control cells (). In addition to the effect on mitochondria, we noted an increased content of cis- and trans-Golgi in ShBnip3-transduced cells (Fig. S2). Since both the Bnip3 ShRNA sequences showed similar effects on NP cells, ShRNA clone #1 was used for further studies. While the levels of TOMM20, a mitochondrial outer membrane protein, CYCS, an inner mitochondrial membrane protein, and dynamin protein DNM1L/DRP1 were unaffected, the level of fusion protein OPA1 was significantly increased in BNIP3-deficient cells. Deferiprone (DFP), an iron chelator that depolarizes mitochondria and induces mitophagy was used as a positive control and showed a significant decrease in the level of OPA1, a decreasing trend in TOMM20, CYCS levels without significantly affecting DNM1L (). Silencing BNIP3 did not alter ETC complex II and III and complex V levels. Whereas DFP treatment only affected complex II level (). Together, these results suggested that silencing BNIP3 affects the mitochondrial number, morphology, and dynamics.
Figure 1. BNIP3 loss in NP cells affects mitochondria number and morphology. (A) Immunofluorescence staining for BNIP3 in ShCtrl- and ShBnip3 #1-transduced cells and 24-h DFP-treated cells. (B, C) Western blot of BNIP3 and corresponding densitometric analysis of multiple blots shown in NP cells after transduction with Bnip3 shRNA #1. (D) NP cells transduced with ShBnip3 showed tubular and well-networked mitochondria compared to ShCtrl. Scale bar: 15 and 4 μm. (E, F) Mitochondrial morphology and network analysis showed increased length and branching complexity of mitochondria in BNIP3-deficient NP cells. (G, H) Increase in mitochondrial number and mitoDNA content in BNIP3-deficient cells; 50 cells quantified from two independent experiments for data shown in G. (I-M) Immunoblot and quantification of mitochondrial outer membrane translocase TOMM20, inner membrane protein CYCS, fission protein DNM1L and fusion protein OPA1. (N-Q) Western blot and corresponding densitometry analysis of ETC proteins. Data represent six independent experiments. Statistical significance was determined using t-test (F, G) or One-way ANOVA (I-L, N-P) with Sidaks’s post hoc test as appropriate.
BNIP3 loss induces mitophagy through other mitophagy receptors
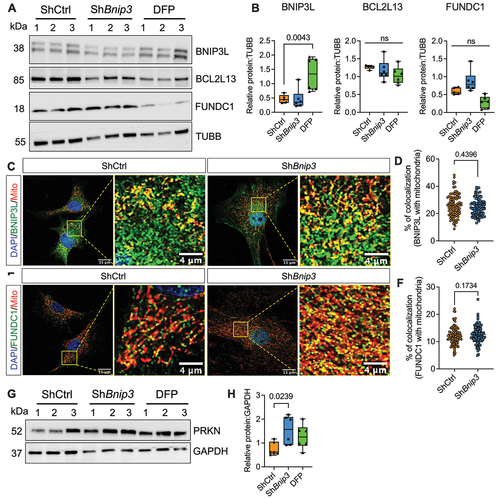
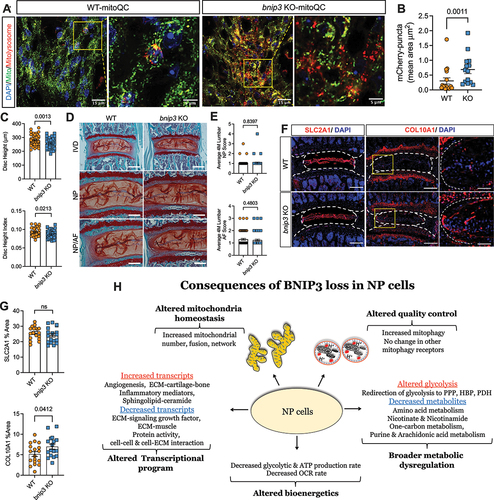
BNIP3 knockdown and control cells were cultured under hypoxia, and mitochondrial colocalization with LC3-positive autophagosomes (, Fig. S1F-G) and LAMP1-positive lysosomes () was assessed. Silencing BNIP3 showed an increase in mitochondrial colocalization with LC3-positive puncta (, Fig. S1G) as well as LAMP1-positive lysosomes () suggesting increased mitophagy. Moreover, Western blot analysis showed higher LC3-II protein levels without changes in LAMP1 levels in BNIP3-deficient cells suggesting increased rate of autophagic degradation (. Fig. S1H-I). Autophagy inhibitor bafilomycin A1 treatment further increased the accumulation of LC3-II protein in ShBnip3 group compared to ShCtrl which corroborates the active autophagic flux (). To confirm that the alterations in mitochondrial homeostasis are specific to ShRNA-mediated knockdown of BNIP3, we isolated NP cells from adult bnip3 KO-mitoQC reporter mice to visualize mitochondria and monitor mitophagy [Citation11]. In mitoQC reporter mice, outer mitochondrial membrane protein FIS1 (fission, mitochondrial 1) is genetically tagged with a pH-sensitive fluorescent reporter mCherry-EGFP allowing monitoring of mitochondria and mitophagic flux (). A clear induction of mitophagy in bnip3 KO-mitoQC was noted as evident from significantly increased mitolysosmes compared to BNIP3 WT-mitoQC (). To understand the mechanisms responsible for increased mitophagy in BNIP3-deficient cells, we analyzed levels of other mitophagy receptors. We did not observe any change in the levels of BNIP3L, BCL2L13, and FUNDC1 in BNIP3-deficient cells compared to controls (). We also investigated whether enhanced colocalization of BNIP3L or FUNDC1 with mitochondria contributed to increased mitophagy and found comparable colocalization between the groups (). Since only a small fraction of BNIP3L and FUNDC1 was colocalized with mitochondria, we confirmed that prominent levels of these outer mitochondrial membrane proteins were present in the cytosolic fraction of hypoxic NP cells (Fig. S3A). We then explored the contribution of the non-receptor mediated canonical PINK1-PRKN pathway to increased mitophagy incidence in the absence of BNIP3. PINK1 localizes to depolarized mitochondria and recruits PRKN to initiate classical non-receptor-mediated mitophagy. We analyzed levels of PRKN and found them to be increased in BNIP3-deficient cells () but did not observe any differences in phospho-ubiquitin (pUb) levels in ShBnip3 cells compared to ShCtrl (Fig. S3B). We, therefore, investigate whether PRKN drives mitophagy induced by BNIP3-loss. Surprisingly, primary NP cells isolated from prkn null rats evidenced undetectable levels of BNIP3, and yet evidenced higher levels of LC3-II compared to WT cells. Furthermore, prkn null NP cells treated with bafilomycin A1 showed further accumulation of LC3-II, suggesting elevated and active autophagic flux (Fig. S3C, D). Together these findings show that mitophagy receptors other than PINK1-PRKN are sufficient to eliminate functionally deficient mitochondria resulting from BNIP3 loss.
Figure 2. Loss of BNIP3 induces NP cell mitophagy. Immunofluorescence staining for (A, B) LC3 and comparable colocalization of LC3 puncta with mitochondria. (C, D) Immunofluorescence staining for LAMP1 and comparable colocalization of LAMP1 with mitochondria in ShBnip3 #1 and ShCtrl transduced cells. Z-stack images of 50 cells per group. Scale bar: 15 and 4 μm. (E) Western blot and densitometric quantification (F, G) of LC3 and LAMP1 in ShBnip3 #1, ShCtrl transduced NP cells and DFP treated cells. (H, I) Western blot analysis of ShCtrl and ShBnip3 transduced cells cultured under hypoxia with or without bafilomycin A1. (J) Schematic of mCherry-GFP-FIS1 knockin mitoQC mouse. The knockin was achieved by using a neomycin resistant CAG (cytomegalovirus early enhancer-chicken ACTB) promoter that included hGHpA (human growth hormone poly A). (K, L) Representative confocal images and quantification of mCherry-positive mitolysosmes of WT-mitoQC and bnip3-KO-mitoQC mouse NP cells. DAPI stained nuclei are shown in blue. Z-stack images of 30 cells per group. Scale bar: 15 and 4 μm. Western blot data represent 4–6 independent experiments. Statistical significance was determined using t-test (B, D) or Mann-Whitney test (L) or One-way ANOVA (F, G, I) with Sidaks’s post hoc test as appropriate.
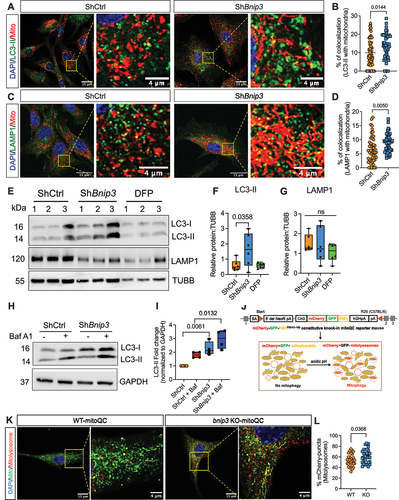
Figure 3. BNIP3 loss does not result in a compensatory increase in levels and colocalization of other mitophagy receptors. (A, B) Western blot and densitometric quantification of mitophagy receptors BNIP3L, BCL2L13, and FUNDC1 in ShCtrl, ShBnip3 #1, and DFP-treated NP cells. (C, D) Immunofluorescence staining BNIP3L and quantification of BNIP3L colocalizing with mitochondria, and (E, F) Immunofluorescence staining FUNDC1 and quantification of FUNDC1 colocalizing with mitochondria. (G, H) Western blot and densitometric quantification of canonical mitophagy pathway protein PRKN in ShCtrl, ShBnip3, and DFP-treated NP cells. Western blot data represent six independent experiments. Colocalization BNIP3L and FUNDC1 with mitochondria was measured from Z-stack images of 100 cells per group. Scale bar: 15 and 4 μm. Statistical significance was determined using a t-test (D, F) or One-way ANOVA (B, H) with Sidaks’s post hoc test as appropriate.
BNIP3 is required to maintain glycolytic capacity and ATP production rate in NP cells
We then determined whether BNIP3 plays a role in NP cell energy metabolism. Since NP cells rely on glycolysis for energy production, we used an updated protocol from Mookerjee et al. [Citation29,Citation30] to determine the maximum glycolytic capacity by measuring the extracellular acidification rate (ECAR). There are two main routes for H+ production stemming from glucose catabolism that contribute to ECAR levels. First, the conversion of glucose to pyruvate and then to lactate/H+ is referred to as the proton production rate from glycolysis (PPRglyc). Second, the conversion of glucose to pyruvate and then to bicarbonate/H+ is referred to as the proton production rate from respiration (PPRresp). In BNIP3 knockdown and controls, we measured the basal glycolytic rate, maximum glycolytic capacity, and glycolytic reserve using Seahorse XFe Flux Analyzer. The raw traces showed ECAR and OCR at basal levels (no substrate) and after sequential addition of glucose, rotenone+myxothiazol, and monensin+FCCP ().
Figure 4. BNIP3-loss dysregulates glycolytic capacity and ATP production rate in NP cells. (A, B) NP cells were transduced with ShCtrl and ShBnip3 and measured raw traces of extracellular acidification rate (ECAR) and oxygen consumption rate (OCR) in absence of exogenous glucose, after sequential addition of 10 mM glucose followed by rotenone plus myxothiazol and then monensin plus FCCP. (C) Calculation of proton production rate (PPR) of the A and B. (D) Raw traces of ECAR and OCR in absence of exogenous glucose, after sequential addition of 10 mM glucose followed by oligomycin and then rotenone plus myxothiazol and (F) ATP production rate of glycolytic and oxidative was calculated from graph D and E. Data represent four independent experiments each with four technical replicates/group. Statistical significance was determined using a One-way ANOVA with Sidaks’s post hoc test as appropriate.
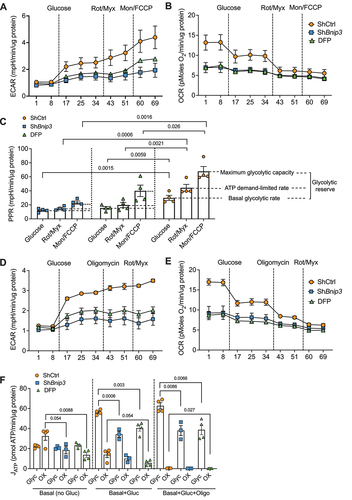
The BNIP3-silenced cells show a prominent decrease in both ECAR and OCR profiles (). Moreover, in knockdown cells, basal glycolytic rate, maximum glycolytic capacity, ATP demand-limited rate and glycolytic reserve as computed from H+/lactate production were significantly decreased. Mitophagy positive control DFP treated cells also showed similar changes to that of BNIP3-silenced cells (). Published protocol was then used to isolate the ATP production rates from glycolysis and oxidative metabolism in NP cells combining ECAR and OCR. shows raw ECAR and OCR traces under basal (no glucose) and following sequential addition of glucose, oligomycin and finally rotenone plus myxothiozol. Under basal conditions ECAR is similar but OCR is lower in BNIP3-knockdown and DFP treated cells suggesting that oxidative phosphorylation was affected. After the addition of glucose, in control cells while ECAR increased significantly, OCR also showed an appreciable decrease reflecting a shift toward glycolysis [Citation29,Citation30]. Moreover, control cells showed further increase in ECAR and decrease in OCR following the successive addition of inhibitors of ATP synthase, oligomycin, and complex I and III, rotenone+myxothiazol. In contrast, the corresponding changes in ECAR and OCR following glucose and mitochondrial inhibitors in BNIP3 knockdown and DFP-treated cells were significantly blunted suggesting dysregulation in both glycolysis and oxidative phosphorylation. We calculated ATP generated from glycolysis and oxidative metabolism using ECAR and OCR traces (). Under the basal condition, there was no difference in ATP generation from glycolysis among the groups however oxidative ATP production was decreased in BNIP3-silenced and DFP treated cells due to altered and dysfunctional mitochondria. However, after addition of glucose, glycolytic ATP generation is lower in both BNIP3 knockdown and in DFP treated cells compared to control without affecting oxidative ATP generation. Finally inhibiting ATP synthase also showed a similar decrease in glycolytic ATP generation in both experimental groups. These data suggested that BNIP3 is necessary for maintaining anerobic glycolysis (H+/lactate production) and ATP generation in NP cells.
Loss of BNIP3 impacts broader NP cell metabolism
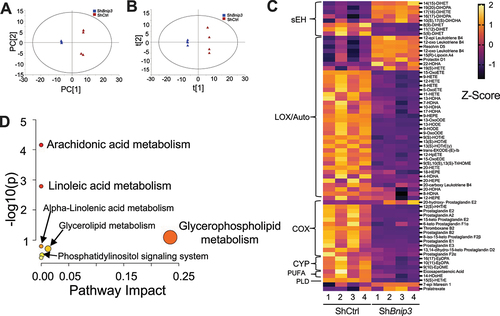
Considering the role of BNIP3 in regulating mitochondrial morphology, quality control, and glycolytic capacity, we assessed its impact on cell metabolism. Metabolic profiling was used in conjunction with 13C tracer analysis to examine the interrelationship between glycolysis and the TCA cycle regulated by BNIP3. A total of 319 metabolites that met the QC cutoff of coefficient of variation (CV) <30% were imported into the SIMCA-p software for multivariate analysis, separately. An unsupervised principal component analysis (PCA) and supervised partial least square-discrimination analysis (PLS-DA) models were generated which showed a clear separation between the ShBnip3 and ShCtrl samples (). We delineated metabolites with significant differences using FDR adjusted p value ≤0.05 cutoff and observed that 136 metabolites were decreased, and 37 metabolites were increased in BNIP3-silenced cells, represented in the heatmap (). The metabolite enrichment and pathway analyses were run separately for up and down metabolites in ShBnip3. The pathway impact on upregulated metabolites revealed the enrichment of nucleotide sugars metabolism, starch and sucrose metabolism, lactose synthesis, pyrimidine metabolism, gluconeogenesis, galactose metabolism, glycolysis, pentose phosphate pathway, phosphatidylcholine biosynthesis, amino sugars metabolism, sphingolipid metabolism, glycerolipid metabolism and steroid biosynthesis, inositol, and inositol phosphate metabolism (). Whereas metabolic pathways of the differentially downregulated metabolites mainly contained amino acid metabolism such as arginine, proline, methionine, glycine, serine, alanine, aspartate, tryptophan, histidine, phenylalanine, tyrosine, furthermore, nicotinate and nicotinamide metabolism, purine metabolism, glutathione metabolism, vitamin B6 metabolism, thyroid hormone metabolism were downregulated in ShBnip3 (). Moreover, despite some differences in enrichment levels a few metabolic pathways such as malate-aspartate shuttle, methylhistidine metabolism, thiamine metabolism, and glutamate metabolism were overlapped between up and down metabolites in BNIP3 knockdown cells. Furthermore, ShBnip3 group showed decreased levels of NAD+ without changes in NADH, and a significant increase in ATP levels (). The levels of glycolytic metabolites glucose-6-phosphate and fructose 1,6-bisphosphate were higher in ShBnip3. Conversely, TCA cycle intermediates citrate, succinate, along with glutamine, glutamate, aspartate was decreased (). We also performed eicosanoid profiling from conditioned medium of BNIP3-knockdown cells. PCA, and PLS-DA analysis showed distinct clustering between ShCtrl and ShBnip3 samples (). A total of 75 differentially present eicosanoids with FDR adjusted p value ≤0.05, were identified of which 15 were elevated, and 50 were lower in BNIP3-silenced cells (). The enriched pathways and their impact scores were computed for these differentially present eicosanoids (). In BNIP3-silenced cells glycerophospholipid metabolism was highly affected with a higher impact score of 0.25, whereas arachidonic acid and linoleic acid metabolism were most significantly affected with a higher enrichment (-log10(p) >2.75–4.2). Together, these studies revealed that BNIP3 loss-of-function results in a wider dysregulation of NP cell metabolism.
Figure 5. BNIP3 is a key regulator of hypoxic NP cell metabolism. (A) Unsupervised principal component analysis (PCA) of widely targeted small metabolites. (B) Supervised partial least square-discrimination analysis (PLS-DA) model. (C) Heat map normalized concentration of metabolites differentially found between ShCtrl and ShBnip3 using FDR adjusted p-value ≤0.05%. (D, E) Metabolite set enrichment analysis (MSEA) of upregulated and down regulated metabolites in NP cells transduced with ShCtrl and ShBnip3. (F, G) Metabolic pathway analysis (MetPA) of up and down regulated metabolites between ShCtrl and ShBnip3. (H-J) Differentially measured metabolites NAD, NADH, and ATP between ShCtrl and ShBnip3 cells. (K) Schematic showing metabolites that are increased (blue) or decreased (red) after the knockdown of BNIP3. Data are from four independent experiments. Statistical significance was computed using t-test (H-J). The significance of affected metabolites less than p < 0.05 were used for the enrichment and pathway analysis.
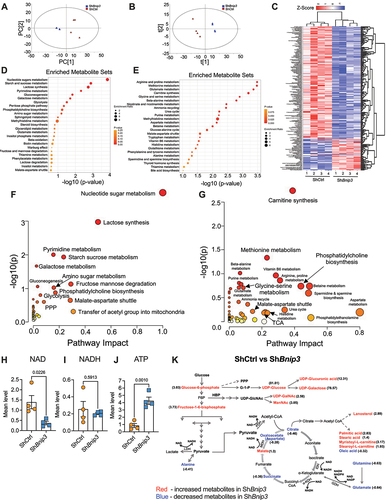
Figure 6. BNIP3 loss results in dysregulated eicosanoid metabolism in NP cells. Unsupervised principal component analysis (PCA) of widely targeted small metabolites. (B) Supervised partial least square-discrimination analysis (PLS-DA) model. (C) Heat map normalized concentration of eicosanoids differentially present between ShCtrl and ShBnip3 using ≤0.05% FDR adjusted p value. (D) Metabolic pathway analysis (MetPA) of differentially measured eicosanoids in ShBnip3. Data are from four independent experiments. The significance of affected metabolites less than p < 0.05 were used for the enrichment and pathway analysis.
Loss of BNIP3 dysregulates utilization of key metabolic substrate glucose while sustaining TCA utilization of glutamine
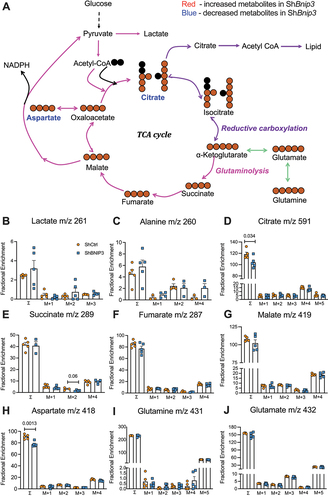
To gain further understanding of how the loss of BNIP3 affects key metabolic substrate utilization, BNIP3-silenced cells were cultured for 24 h under hypoxia, with the addition of 50% enrichment in glucose with [Citation1,Citation2]-13C-glucose. The outline for 13C tracer analysis using [Citation1,Citation2]-13C-glucose is shown in () [Citation1,Citation2]-13C-glucose yields [Citation2,Citation3]-13C-lactate accumulating in media via anaerobic glycolysis (M2 lactate), whereas M1 lactate is generated after transit of glucose through the oxidative branch of the pentose cycle. BNIP3 knockdown cells showed a significant decrease in extracellular lactate M2 m/z 91 and about 50–60% increase in pentose cycle flux as measured by lactate (M1/M2)/ (3 + M1/M2), compared to control (). The balance between flux entering the TCA cycle via PDH and PCX with BNIP3 silencing was computed using 13C enrichment in glutamate in the medium. PCX+PDH and PDH fluxes, PDH:PCX ratio but not PCX flux were significantly increased in ShBnip3 cells (). Analysis of cell pellets showed decreased sigma mean equal to the weighed mean average of the metabolite’s enrichment (∑ mn = 1 *M1 + 2*M2 + 3*M3 etc.) in TCA cycle intermediates citrate (m/z 591), fumarate (m/z 287), malate (m/z 419), aspartate (m/z 418), and glutamate (m/z 432) without changes in succinate (m/z 289) and alanine (m/z 260). We also noted decreased enrichment in one carbon metabolite serine (m/z 390) and an increase in stearic acid flux (m/z 341) without changes in palmitate (m/z 313), oleic acid (m/z 339), and cholesterol (m/z 443) enrichment in BNIP3 knockdown cells (). These findings suggested that deletion of BNIP3 in NP cells resulted in dysregulation of glycolytic and mitochondrial TCA cycle flux interactions and increase in pentose cycle shunt pathway. Increased pentose flux should result in quenching of ROS and/or increased fatty acid synthesis supporting some increase in the average stearate enrichment (sigma) that was seen.
Figure 7. Loss of BNIP3 dysregulates glycolytic and mitochondrial metabolic flux in NP cells. (A) Summation of flux results through glycolysis, pentose, and TCA cycle using [Citation1,Citation2]-13C-glucose and assessing lactate and glutamate isotopomers after 24 of [Citation1,Citation2]-13C-glucose addition. Metabolites that are decreased shown in red after knockdown of BNIP3. If glucose directly metabolized through glycolytic pathway [Citation1,Citation2]-13C-glucose becomes [Citation2,Citation3]-13C lactate (and unlabeled lactate 1:1) [Citation3].-13C-lactate is generated if glucose is diverted into the pentose phosphate pathway [Citation2,Citation3].-13C-pyruvate can enter the TCA cycle through PDH (pyruvate dehydrogenase) or PCX (pyruvate carboxylase). M1 of glutamate around m/z 103 reflects the presence of 13C at the fourth carbon position. This reflects acetyl units originating from glucose to pyruvate entering through PDH. M2 of glutamate 104 reflects the presence of 13C at the second and third carbon position, indicating pyruvate entering the oxaloacetate pool through PCX. M2 of Glutamate around 131 reflects the presence of 13C at either the third and fourth carbon position, or the fourth carbon and fifth carbons, and reflects the overall TCA cycle flux, from either pyruvate entering from PCX or PDH. (B) Glycolysis flux measured by M2 lactate m/z 91, (C) Pentose cycle flux measured by lactate using formula (M1/M2)/ (3 + M1/M2, (D) PCX+PDH flux measured glutamate m/z 131, I PCX flux measured glutamate m/z 104, (F) PDH flux measured glutamate m/z 103 (G) PDH/PCX flux measured by glutamate m/z 103-M1/104-M2, (H) alanine m/z 260, (I) citrate m/z 591, (J) succinate m/z 289, (K) fumarate m/z 287, (L) malate m/z 419, aspartate m/z 418, (N) glutamate m/z 432, (O) serine m/z 390, (P) cholesterol m/z 443 (Q) palmitate (C16:0) m/z 313, (R) stearic acid (C18:0) m/z 341, (S) oleic acid (C18:1) m/z 339. Data are from five independent experiments. Data points are not included for negative values (not detectable ∑ mn). Statistical significance was computed using t-test (B-G, H, J-P, R, S) or Mann-Whitney test (I, Q) as appropriate.
![Figure 7. Loss of BNIP3 dysregulates glycolytic and mitochondrial metabolic flux in NP cells. (A) Summation of flux results through glycolysis, pentose, and TCA cycle using [Citation1,Citation2]-13C-glucose and assessing lactate and glutamate isotopomers after 24 of [Citation1,Citation2]-13C-glucose addition. Metabolites that are decreased shown in red after knockdown of BNIP3. If glucose directly metabolized through glycolytic pathway [Citation1,Citation2]-13C-glucose becomes [Citation2,Citation3]-13C lactate (and unlabeled lactate 1:1) [Citation3].-13C-lactate is generated if glucose is diverted into the pentose phosphate pathway [Citation2,Citation3].-13C-pyruvate can enter the TCA cycle through PDH (pyruvate dehydrogenase) or PCX (pyruvate carboxylase). M1 of glutamate around m/z 103 reflects the presence of 13C at the fourth carbon position. This reflects acetyl units originating from glucose to pyruvate entering through PDH. M2 of glutamate 104 reflects the presence of 13C at the second and third carbon position, indicating pyruvate entering the oxaloacetate pool through PCX. M2 of Glutamate around 131 reflects the presence of 13C at either the third and fourth carbon position, or the fourth carbon and fifth carbons, and reflects the overall TCA cycle flux, from either pyruvate entering from PCX or PDH. (B) Glycolysis flux measured by M2 lactate m/z 91, (C) Pentose cycle flux measured by lactate using formula (M1/M2)/ (3 + M1/M2, (D) PCX+PDH flux measured glutamate m/z 131, I PCX flux measured glutamate m/z 104, (F) PDH flux measured glutamate m/z 103 (G) PDH/PCX flux measured by glutamate m/z 103-M1/104-M2, (H) alanine m/z 260, (I) citrate m/z 591, (J) succinate m/z 289, (K) fumarate m/z 287, (L) malate m/z 419, aspartate m/z 418, (N) glutamate m/z 432, (O) serine m/z 390, (P) cholesterol m/z 443 (Q) palmitate (C16:0) m/z 313, (R) stearic acid (C18:0) m/z 341, (S) oleic acid (C18:1) m/z 339. Data are from five independent experiments. Data points are not included for negative values (not detectable ∑ mn). Statistical significance was computed using t-test (B-G, H, J-P, R, S) or Mann-Whitney test (I, Q) as appropriate.](/cms/asset/df6429ee-c4af-426e-acc1-235e86d77365/kaup_a_2162245_f0007_oc.jpg)
To gain further insight on glutamine utilization in BNIP3 knockdown cells, U13C-glutamine tracer was used (). We did not observe any changes in the enrichment of lactate (m/z 261), alanine (m/z 260), succinate (m/z 289), fumarate (m/z 287), malate (m/z 419), glutamate (m/z 432), and glutamine (m/z 431) in BNIP3 knockdown cells. However, these BNIP3 knockdown cells showed a decrease ∑ mn of citrate (m/z 591) and aspartate (m/z 418) (). This glutamine labeling experiment suggested an attempt by BNIP3 knockdown cells to maintain glutamine oxidation to sustain levels of TCA cycle intermediates. Together these tracer experiments imply that BNIP3 depletion may cause increased glycolytic flux up to triose phosphate step that feeds into pentose phosphate and hexosamine biosynthesis pathways involved in ROS scavenging and epigenetic programming of cells through O-GlcNAcylation [Citation31] respectively. Noteworthy, there is further redirection of glycolytic flux into pyruvate (decrease in H+/Lactate levels) which then feeds into TCA cycle through PDH.
Figure 8. BNIP3 loss does not significantly alter glutamine flux through TCA cycle. (A) Summation of flux results through glycolysis, pentose, and TCA cycle using U13C-glucose and assessing isotopomers after 24 h of U13C-glutamine addition. Metabolites that are decreased are shown in red after the knockdown of BNIP3. (B) lactate m/z 261, (C) alanine m/z 260, (D) citrate m/z 591, (E) succinate m/z 289, (F) fumarate m/z 287, (G) malate m/z 419, (H) aspartate m/z 418, (I) glutamine m/z 431, (J) glutamate m/z 432. Data shown are from five independent experiments. Statistical significance was computed using a t-test (B-J).
Transcriptomic profiling of ShBnip3 in NP cells and its commonality with degenerative human discs transcriptomes
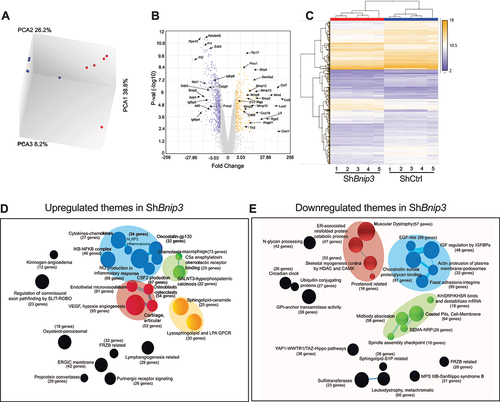
To gain an understanding of transcriptomic changes resulting from BNIP3 loss, microarray analysis was conducted. The PCA showed distinct clustering between ShBnip3 and ShCtrl (). The volcano plot and heat maps of ShBnip3 versus ShCtrl comparison showed distribution and hierarchical clustering respectively of 1012 differentially expressed genes (DEGs) used for enrichment analysis with a fold change of 2 (FDR ≤ 0.05) (). Further, an AI based CompBio tool was used for pathway level analysis of the DEGs between ShBnip3 and ShCtrl [Citation32–34]. Lists of up- and downregulated themes (and associated concepts) that were significantly enriched in ShBnip3 compared to ShCtrl were computed (Fig. S4A, B). Upregulated themes comprised of a broad set of biological process related to angiogenesis, extracellular matrix/cartilage/bone biology, inflammatory mediators, cell signaling, and homeostasis/metabolism (Fig. S5A-N). Conversely, downregulated themes included ECM signaling/growth factors, ECM-muscle, protein activity, membranes, catabolic processes, cytoskeleton, and circadian clock (Fig. S6A-N). Interrelationship between the themes and associated concepts was visualized as sphere and stick model, where the size of a sphere is proportional to enrichment score and thickness of the lines connecting themes signifies the number of genes shared between them. This allowed identification of closely related themes which formed thematic super clusters. From the upregulated DEGs, super clusters related to immune response, ECM-bone, sphingolipid-ceramide were apparent (). From the downregulated DEGs, three super clusters were apparent: ECM-muscle, ECM-growth factor signaling, and cell cycle-cell membrane ().
Figure 9. BNIP3-loss in NP cells significantly impacts NP cell transcriptomic program. (A) Transcriptomic clustering profile by Principal Component Analysis (PCA) of ShCtrl and ShBnip3 cells. (B, C) Volcano plot and Hierarchical clustering of differentially expressed genes (DEGs) with FDR ≤0.05%, >2-fold change. The CompBio biological process maps generated from DEGs FDR ≤0.05% and 2-fold change are shown. (D) Themes associated with upregulated DEGs immune responses (blue), green), ECM-angiogenesis (red), sphingolipids (yellow) are highlighted. (E) Themes associated with downregulated DEGs ECM-muscle (Orange), cell-matrix interaction (blue), cell-membrane receptors (green) are highlighted. The size of a sphere is related to its enrichment score and thickness of the lines connecting themes signifies the number of genes shared between them.
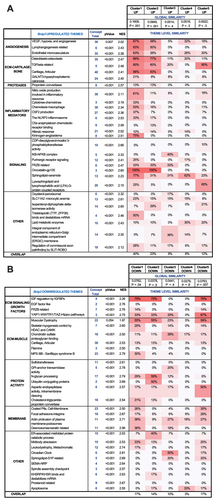
To investigate whether transcriptomic changes in NP due to mitochondrial dysfunction captures gene signatures seen during human disc pathology, the CompBio tool was used to compare the microarray dataset of BNIP3 knockdown cells with human degenerative NP tissue dataset (GSE70362) [Citation35] analyzed by Novais et al. [Citation36]. Based on transcriptomic hierarchical clustering, these samples were grouped into 7 distinct clusters including a healthy cluster, and degenerative clusters 1–5 were used for the comparison with ShBnip3 data. Remarkably, BNIP3 knockdown cells showed varying degrees of global and theme level similarity/overlap with these human clusters (). For ShBnip3 upregulated DEGs, human clusters 1 and 2 showed the most global similarity with a score 0.1609 and 0.0949 (p < 0.001) and 40% and 23% thematic level overlap (, Fig. S7A, S7B). At the individual theme level, human cluster 1 showed a 78%, 69%, and 38% overlap for the themes angiogenesis, ECM, and inflammatory respectively, whereas cluster 2 showed 36%, 57%, and 10% overlap. In terms of downregulated DEGs, clusters 1 and 5 showed a global similarity score of 0.073, and at the thematic level showed an overall 17% overlap (, Fig. S7C, S7D). For the themes ECM-signaling, ECM-muscle, protein activity and membranes human cluster 1 showed 31%, 36%, 37% and 29% overlap respectively. Whereas cluster 5 showed 39%, 17%, 9%, and 23% similarity respectively. Overall, our study suggests that dysregulation of mitochondria could be an important contributor to disc degeneration.
Figure 10. Transcriptomic profiling of BNIP3-deficient NP cells shows commonality with transcriptomes of a subset of degenerative human discs. (A, B) ShBnip3 upregulated and down regulated themes showing similarity with transcriptome-based clusters generated from GSE70362 deposited microarray data based on histological grades. A pseudo heatmap showing global similarity as well as theme level similarity between transcriptional profiles of ShBnip3 model and human clusters (GSE70362). FDR ≤0.05% and 2-fold change transcripts were used for the comparison study. (A) Pseudo heat map for upregulated DEGs (B) pseudo heat map for downregulated DEGs.
Loss of BNIP3 causes alterations in mitophagy, mitochondrial morphology, and early degenerative changes in bnip3 knockout mice
To delineate if loss of BNIP3 results in a change in mitochondrial homeostasis, we analyzed young bnip3 KO-mitoQC reporter mice to visualize mitochondrial morphology and mitophagy in vivo [Citation11]. In agreement with our in vitro findings, while NP cells in WT mice showed fragmented mitochondria, cells in bnip3 KO mice contained tubular mitochondria. Moreover, the incidence of mitophagy as evident by red puncta was significantly higher in bnip3 KO-mitoQC mice compared to WT-mitoQC (). Since studies have linked mitochondrial dysfunction to disc degeneration, we assessed disc health in bnip3 KO mice [Citation6]. Noteworthy, young adult bnip3 KO mice showed decreased disc height and disc height index, parameters usually associated with disc degeneration (). However, safranin O-Fast Green staining of the intervertebral disc did not reveal pronounced structural and morphological changes in disc compartments of bnip3 KO. Discs in both WT and bnip3 KO mice showed GAG-rich NP with normal cellularity, a clear demarcation between NP and AF tissues with intact lamellar AF structure and had comparable modified Thompson scores (). We delineated if there were subtle alterations in the cellular phenotype since one of the hallmarks of disc degeneration is the change in cellular phenotype. Immunofluorescence staining showed that expression of NP phenotypic marker, SLC2A1/GLUT1, was robust and levels were comparable between genotypes (). We further assessed the expression and localization of COL10A1 which is a known marker of cellular hypertrophy in chondrocytes and often expressed by NP cells during degeneration. Results showed a significant increase in COL10A1 levels in the NP compartment suggesting that cells were undergoing early phenotypic changes (). These results suggested that changes in mitochondria in bnip3 KO mice are linked to early degenerative changes in the NP compartment.
Figure 11. Deletion of Bnip3 does affect disc health of 4-month-old mice. (A) Representative images of disc sections from 4-month-old WT and bnip3 KO-mitoQC reporter mice showing mitochondrial morphology (GFP labeling) and mCherry-positive (red) mitolysosomes from the NP compartment. (B) Quantification of mCherry-positive mitolysosmes from WT-mitoQC and bnip3 KO- mitoQC mouse NP tissue sections. DAPI-stained nuclei are shown in blue. Z-stack images were used for the calculations. (n = 3–4 discs/animal, 4 animals/genotype, 14–16 discs/genotype). (C) Disc height, and disc height index of 4-month-old WT and bnip3 KO mice. (n = 5–6 lumbar discs/animal, 9 animals/genotype, 52–54 lumbar discs/genotype). (D) Safranin O/Fast Green staining of lumbar discs showing disc morphology and overall proteoglycan content in the intervertebral disc. Whole disc (scale bar: 200 μm) and high-magnification images of the NP and AF compartment (scale bar: 100 μm) in 4-month wild-type and bnip3-KO mice. (E) Histological grade of degeneration using modified Thompson grading scale. (n = 5–6 lumbar discs/animal, 10 animals/genotype, 59–60 discs/genotype). (F, G) Representative images and quantitative immunohistological staining of SLC2A1 and COL10A1 from WT and bnip3 KO discs. (n = 5–6 lumbar discs/animal, 3 animals/genotype, 17–18 discs/genotype). Quantitative data represent mean ± SEM. Statistical significance was determined using a t-test (C, G) or Mann-Whitney test (B, E) if data were not normally distributed. (H) Schematic showing the consequences of BNIP3-loss on metabolic homeostasis and mitochondrial function in NP cells. PPP: pentose phosphate pathway; HBP: hexosamine biosynthetic pathway; PDH: pyruvate dehydrogenase. Quantitative measures were determined by using an unpaired t-test or Mann-Whitney test if data were not normally distributed.
Discussion
Until recently it was generally believed that NP cells contain very few mitochondria, and therefore were not a significant contributor to NP cell physiology. Opposing the established view our recent study showed that these cells contain well-networked mitochondria. We further showed that these mitochondria are responsive to hypoxia which governs their morphology, composition, and mass in a HIF1A-dependent manner. Noteworthy, mitochondrial translocation of BNIP3 was required for mediating hypoxia-induced mitophagy. The work presented herein delineates the role of BNIP3 in maintaining mitochondrial metabolism and quality control in hypoxic NP cells. We show that BNIP3 alters mitochondrial morphology, number, and mitophagy. Interestingly, BNIP3-loss induces mitophagy in NP cells through other mitophagy receptors. Further, we provide evidence that BNIP3 regulates glycolysis and mitochondrial metabolism in NP cells and many transcriptomic features evident in BNIP3-deficient cells are captured by subsets of degenerative human NP samples. Overall, our study suggests that dysregulation of mitochondrial function could be an important underlying cause of disc degeneration.
Mitochondrion function is fundamentally tied to its ultrastructure, and alterations in the number, size, and shape of mitochondria lead to functional deficits and disease states. For example, interference in mitochondrial fusion and/or fission machinery results in mitochondria elongation and disorganization of cristae [Citation37]. This is further evident in metabolic syndromes of skeletal muscle, such as mitochondrial myopathies, where defects in mitochondrial metabolism are associated with increased numbers of mitochondria that are larger and possess abnormal cristae [Citation12]. Likewise, in various liver disorders, mitochondrial structural abnormalities in hepatocytes contribute to altered metabolism and increased oxidative stress [Citation13,Citation38]. In this study, we noted that BNIP3-loss results in NP cells with an increased number of mitochondria that are fused, networked, and branched as observed previously in HIF1A-silenced cells [Citation11]. This suggests that increased mitochondrial number and altered morphology reflected compromised mitochondrial function in BNIP3-silenced cells. Remarkably, NP cell size was also affected, and overall cellular hypertrophy was observed in BNIP3-silenced cells. There is a direct correlation between cell size and mitochondria, and as a central metabolic hub, mitochondria control the cellular growth rate. Inhibition of oxidative phosphorylation, membrane potential, and elevated production of mitochondrial ROS is reported to increase cell size and reduce cell proliferation [Citation39]. Conversely, increased transcription and translation rates are correlated with higher mitochondrial mass or increased membrane potential [Citation40–42]. The increased cell size in the absence of BNIP3 is not due to cellular swelling, but a consequence of increased cellular components reflecting an altered metabolic state. To our knowledge, this is the first report on the role of BNIP3 in maintaining cell size and regulation of mitochondrial morphology and number in NP cells.
Silencing BNIP3 in NP cells increased mitophagy to maintain a healthy pool of mitochondria, a finding that contradicts several studies suggesting that silencing BNIP3 either did not affect [Citation43–45] or reduced mitophagy [Citation46–48]. Previously, we have shown that in absence of HIF1A and BNIP3 mitochondrial translocation mitophagy remained unaffected, implicating other BCL2 family mitophagy receptor, BNIP3L, in a compensatory role [Citation11]. Intriguingly, silencing BNIP3 upregulated mitophagy; without altering levels of other mitochondrial outer membrane mitophagy receptors such as BNIP3L, BCL2L13 and FUNDC1, or colocalization of BNIP3L and FUNDC1 with mitochondria. These results are in line with previous studies that show that the loss of a single mitophagy receptor is not sufficient to inhibit overall mitophagy [Citation23,Citation44,Citation48,Citation49]. However, when two receptors, BNIP3 and BNIP3L or BNIP3L and FUNDC1, were deleted, mitophagy was reduced [Citation44,Citation48]. These results along with a lack of change in pUb levels in ShBnip3 group and elevated LC3-II levels in prkn null NP cells with BNIP3 depletion suggest that other receptors can substitute to augment mitophagy to remove dysfunctional mitochondria caused by the BNIP3 loss. Altogether our data illustrate that BNIP3 regulates cell size, mitochondrial morphology, number, and mitophagy in NP cells.
The mitochondrion is the primary site of bioenergetic and biosynthetic pathways in the cell, and for that reason, there is great interest in assessing how altered mitochondrial function contributes to the pathobiology of metabolic diseases [Citation13]. We, therefore, delineated the effect of BNIP3 loss on NP cell metabolism. Interestingly, while the mitochondrial morphology was comparable between the BNIP3- and HIF1A-silenced NP cells, BNIP3 loss caused a decrease in overall OCR as opposed to an increase seen in HIF1A- silenced cells [Citation8]. Our data suggest that in absence of BNIP3, a positive correlation between elongated mitochondrial morphology and oxidative phosphorylation does not exist in NP cells. Furthermore, forced elongation of mitochondria reduced glycolytic capacity as well as glycolytic ATP production rate without affecting the rate of oxidative ATP generation despite the decreases observed in OCR. Since NP cells primarily depend on glycolysis for energy production, it is evident that BNIP3 is not only essential for mitochondrial function but also maintains glycolytic bioenergetics. Our results are in line with previous studies that noted changes in mitochondrial morphology and metabolic function in BNIP3-deficient cells [Citation50–52]. For example, BNIP3 deletion in hepatocytes [Citation50] was seen to increase mitochondrial mass but a high proportion of these mitochondria showed loss of membrane potential, abnormal structure, and reduced oxygen consumption highlighting broader mitochondrial dysfunction in absence of BNIP3. Similarly, Bnip3 deletion in 3T3-L1 adipocytes decreased mitochondrial bioenergetics [Citation51,Citation52].
We further explored the consequence of BNIP3-loss on NP cell metabolism under hypoxia and implemented widely targeted small metabolic profiling by measuring intracellular and extracellular metabolites using mass spectrometry. The small metabolites analysis revealed that glycolytic and nucleotide-sugar metabolites were increased whereas TCA cycle intermediates, as well as glutamate and glutamine, were decreased. Furthermore, amino acids, nucleotide metabolism, cofactor, and vitamins metabolites were decreased in ShBnip3 cells. Similarly, increased glycolysis and altered lipid metabolism were shown in bnip3 null liver cells [Citation50]. Moreover, the lower NAD:NADH ratio seen in BNIP3-silenced cells correlated with the ECAR measurements implying decreased lactate production. These results also suggested that elevated glycolytic metabolites were being redirected to the pentose cycle to counteract oxidative stress and as well as to hexosamine biosynthesis pathways for protein O-GlcNAcylation [Citation31]. Interestingly, despite the lower ATP production rate in BNIP3-silenced cells, ATP levels were significantly higher. Since a significant amount of ATP is consumed during protein and nucleic acid synthesis, decreased levels of amino acids and nucleotide metabolites suggest a reduction in overall biosynthesis pathways [Citation53]. The widely targeted metabolites and eicosanoid profiling data thus suggested an overall decreased rate of metabolism in BNIP3-silenced cells. We followed up widely targeted metabolic profiling with parallel labeling using two stable isotope tracers [Citation1,Citation2]-13C-glucose and U13C-glutamine to gain insights into metabolic flux. The [Citation1,Citation2]-13C-glucose tracing further confirmed that there is an increased pentose cycle flux, necessary to combat oxidative stress via generating NADPH. Pentose cycle generated NADPH is also critical in reductive biosynthesis of fatty acids whereas ribose-5-phosphate is utilized in nucleotide synthesis. The MFA also implied that there is increased glycolytic flux as there was no change in alanine ∑ mn reflecting a stable pool of pyruvate, which is redirected to the TCA cycle through increased PDH flux. The higher PDH:PCX ratio suggested that pyruvate enters the TCA cycle through the canonical pathway as there is redirection of glycolysis from lactate to TCA cycle. The 13C-glucose MFA further showed that the loss of BNIP3 results in decreased enrichment into TCA intermediates: citrate, fumarate, malate, aspartate. Lower citrate enrichment suggested the possibility of citrate being utilized for fatty acid synthesis supported by increased stearic acid flux. Traditionally, TCA cycle intermediates are considered important for the biosynthesis of macromolecules; more recent studies have shown additional roles in post-translational modifications of proteins, chromatin modification, and DNA methylation [Citation54]. Therefore, it was not surprising to see that there is a maintenance of glutamine utilization in the TCA cycle of bnip3 KO cells. Accordingly, U13C-glutamine labeling showed both glutaminolysis and reductive carboxylation were occurring. Since aspartate (a measure of oxaloacetate) flux is decreased, it is possible that aspartate is being exported to the cytosol via the malate-aspartate shuttle where it regenerates NADPH to combat oxidative stress and regenerates pyruvate to feed the TCA cycle in BNIP3-silenced cells. Conversely, citrate flux is decreased suggesting that citrate generated through reductive carboxylation is utilized for fatty acid synthesis. These results supported the widely targeted metabolite measurements where increased lipid metabolites were seen. Overall, the widely targeted study suggested a reduction in the metabolism and 13C-flux studies suggested the compensatory mechanisms at work to maintain critical metabolites resulting from the loss of BNIP3 leading to increased oxidative stress. Inclusive results support the idea that BNIP3 plays an essential role in maintaining glycolytic and mitochondrial metabolism.
We assessed transcriptomic changes underscored by BNIP3 loss and possible overlap with different human degenerated NP tissues segregated by transcriptomic clustering. It is important to note that metabolic dysregulation is tightly linked to broader transcriptomic and epigenetic changes seen in many organs including skeletal tissues [Citation55–57]. Noteworthy, the BNIP3 knockdown signatures showed a high degree of global and thematic level similarity with some clusters. Herniation and calcification have been hallmarks of disc degenerative phenotypes [Citation58] as we found that most upregulated DEGs belonged to concepts: angiogenesis, ECM-cartilage-bone, inflammatory mediators, lipid metabolism and axonal pathfinding SLIT-ROBO signaling. Increased vascularization in degenerated discs has been noted [Citation59,Citation60] and thus increased levels of transcripts related to angiogenesis may promote neo-vascularization and an influx of immune cells to the tissue [Citation61]. Similarly, inflammatory mediators such as cytokines, chemokines, Csf2, nitric oxide synthesis-related transcripts were upregulated in BNIP3-deficient cells. Altered lipid metabolism is known to increase inflammatory mediators and vice versa [Citation62–64]. It is possible that altered arachidonic acid and sphingolipid metabolism in ShBnip3 cells contribute to the increased inflammatory cytokines. Eicosanoids, derived from arachidonic acid, and sphingolipids are some of the key regulators and mediators of inflammation [Citation65–68]. Epigenetic mechanisms play an acute role in regulating inflammatory signaling. In various cancers, defects in DNA and histone methylation stimulate inflammatory signaling pathways. Recently, epigenome-wide association studies (EWAS), global DNA methylation patterns, and candidate gene analysis suggested that global genome hypomethylation is linked to inflammation [Citation69]. Silencing BNIP3 in NP cells affected one-carbon metabolism; serine-glycine, methionine, aspartate, betaine, polyamines, and vitamin B6 metabolism, raising a possibility that hypomethylation of DNA and histones may contribute to the increased inflammatory gene expression.
Pathways related to muscular dystrophy, ECM signaling growth factors, chondroitin sulfate proteoglycan binding, ER-associated misfolded catabolic process, and endocytosis pathways are downregulated in BNIP3 knockdown cells. Interestingly, in themes associated with growth factor and ECM signaling; IGF signaling pathway showed up to 75% similarity and YAP1-WWTR1/TAZ-Hippo pathways showed 33% – 67% similarity with the human degenerative clusters. Dysregulation of these signaling pathways has been linked to intervertebral disc degeneration [Citation35,Citation70]. YAP1-WWTR1/TAZ-Hippo pathway is known to play a central role in regulating cellular homeostasis by interacting with plasma membrane [Citation71]. Related to this, transcripts for actin-cytoskeletal, focal adhesion-integrins [Citation72,Citation73], plasma-membrane podosome [Citation74], and receptor-mediated endocytosis clathrin-coated pits [Citation75] were decreased highlighting the contribution of cell-cell and cell-ECM interactions. Focal adhesion-integrins maintain cell morphology, plasma-membrane podosomes regulate cell protrusions by enabling the cell motility inside the tissue, and in ECM remodeling, whereas endocytosis is important in internalization and vesicular transport of membrane-bound protein and lipids. We have shown previously that deletion of Actr2/Arp2 and Actr3/Arp3, encoding components of a major actin-cytoskeletal regulator in the disc, results in disc degeneration [Citation76]. Overall, the lack of BNIP3 in NP cells affected plasma membrane integrity which is important to sense and adapt to changes in the extracellular environment. BNIP3 loss also negatively affected protein quality control mechanisms in NP cells. Accumulation of misfolded protein in the ER is known to impair normal cellular activity as evident from altered bioenergetics and metabolism. Our metabolic data also showed increased flux through the pentose phosphate pathway and malate-aspartate shuttle suggesting that altered metabolism and misfolded protein accumulation due to lack of protein quality control causes oxidative stress.
In light of the broad metabolic and functional changes we observed in BNIP3-deficient cells and the known role of this mitophagy receptor in mitochondrial morphology and function [Citation50–52], our investigations suggest that maintenance of mitochondrial homeostasis is closely linked to NP cell health. This hypothesis is further bolstered by early signs of disc degeneration including decreased disc height and disc height index, aberrant expression of a protein linked to chondrocyte hypertrophy, and phenotypic drift in bnip3-KO mice suggesting that dysregulation of mitochondrial homeostasis may promote disc degeneration. Consequently, targeting mitochondrial dysfunction may open a new therapeutic avenue for treating disc degeneration.
Materials and methods
Animals
All procedures were performed under protocols approved by the IACUC of Maine Medical Center Research Institute and Thomas Jefferson University. The bnip3-null mouse was rederived from bnip3 heterozygous mice kindly provided by Dr. Gerald Dorn (Washington University School of Medicine, St. Louis). Briefly, the BH3 and transmembrane domains of BNIP3 were truncated to generate the bnip3-null allele by replacing exons 2 and 3 of the Bnip3 gene with a neomycin resistance cassette through homologous recombination. The bnip3-null allele has been validated by Dorn and colleagues, by Northern blot and immunoblot assays [Citation77]. MitoQC mice with constitutive knockin of mCherry-GFP-mtFIS1[101–152] on the C57BL/6 background developed earlier were maintained as reported [Citation78]. The bnip3 heterozygous mice were crossed to mitoQC mice to generate the wild-type and bnip3-null mice on a homozygous mitoQC background. Adult male Sprague Dawley rats (300–350 g) were purchased from Charles River labs and maintained in the animal facility at Thomas Jefferson University till they were used for cell isolations.
Cell isolation, treatments, and hypoxic culture
Primary NP cells from Sprague Dawley (Charles River, strain 400), prkn/park2 KO and WT (Envigo, HsdSage:LE-Park2em1Sage) and bnip3 KO-mitoQC and WT-mitoQC reporter mice were isolated and maintained in Dulbecco’s modified Eagle medium (DMEM; Sigma, D6046) and 10% FBS supplemented with antibiotics [Citation79]. To investigate effects of BNIP3, lentiviral particle production and viral transduction LV-ShBnip3 clone #1 (Sigma, TRCN0000373999) and LV-ShBnip3 clone #2 (Sigma, TRCN00000009691) and pLKO.1 shCtrl (Addgene, 10,878, Jason Moffat, Cambridge, MA) and psPAX2 (Addgene, 12,260; deposited by Didier Trono, Lausanne) and pMD2.G (Addgene, 12,259; deposited by Didier Trono) were used. HEK 293 T cells (ATCC, CRL-3216) were plated in 10-cm plates (5x10⁶ cells/plate) in DMEM with 10% heat-inactivated FBS 1 day before transfection. Cells were transfected with ShCtrl or ShBnip3 plasmids along with psPAX2 and pMD2.G and lentiviral particles were harvested at 48 to 60 h post-transfection. Cells were transduced with viral particles with 8 mg/ mL polybrene and after 3 days of transduction cell were cultured hypoxia workstation (Invivo2 400; Baker Ruskinn, Bridgend, UK) with a mixture of 1% O2, 5% CO2, and 94% N2 for 24 h and day 4 cells were harvested for protein extraction. To induce mitophagy, cells were treated with deferiprone (1 mM; Sigma, 379,409) for 24 h. Because both the Bnip3 shRNA clones showed comparable effect on mitochondrial morphology and mitophagy, for all the metabolic and transcriptomic studies cells transduced with LV-ShBnip3 #1 (TRCN0000373999) were used.
Immunocytochemistry
ShCtrl or ShBnip3 transfected, or DFP-treated NP cells were plated on glass coverslips and treated with 100 nM MitoTracker Red CMXRos (Thermo Fisher Scientific, M7512) for 30 min after completion of the experimental treatments. Cells were then fixed with 4% PFA or ice-cold methanol for 15 min and permeabilized with 0.1% Triton X-100 (Sigma, T8787) for 10 min and blocked with 1% BSA (Thermo Fisher Scientific, BP9706) for 1 h. Cells were incubated with anti-BNIP3 (Novus Biologicals, 3769S), anti-BNIP3L (Novus Biologicals, 12396S), anti-FUNDC1 (Novus Biologicals, NBP1-81,063), anti-LC3 (Cell Signaling Technology, 12,741), and anti-LAMP1 (Abcam, ab24170), in blocking buffer (2% BSA + 0.1% Triton X-100) at 1:100 to 1:200 at 4°C overnight. After washing, cells were Incubated with Alexa Fluor 488 (Jackson ImmunoResearch, 712–545-150) and mounted with ProLong Gold Antifade Mountant with DAPI (Invitrogen, P36971 To confirm the specificity of staining cells were incubated with isotype mouse (7076P2) or rabbit (7074P2) IgG antibodies (Cell Signaling Technology) (Fig. S6). Cells were visualized using a Zeiss LSM 800 Axio Inverted confocal microscope (Plan-Apochromat 40x/1.3 oil or 63x/1.40 oil). Positive staining for markers and colocalization of LC3, LAMP1, BNIL3L and FUNDC1 with mitochondria was measured as area (pixel2/cell) using the colocalization Plugin of ImageJ software (http://rsb.info.nih.gov/ij/).
Mitochondrial morphology analysis
Mitochondrial number, branching, and morphology were quantified in ImageJ using methods reported earlier [Citation80,Citation81]. Briefly, the confocal images were converted to binary by threshold and then converted to a skeleton that represented the features in the original image using a wireframe of lines one pixel wide. All pixels within a skeleton were then measured using analyze skeleton. The output will give the number of particles which denotes the total number of mitochondria, the aspect ratio (AR) represents the “length to width ratio” and the form factor (FF), the complexity and branching aspect of mitochondria were calculated from circularity.
Western blotting
ShCtrl- or ShBnip3-transfected, and DFP-treated cells were lysed and 35 μg of protein was electroblotted to PVDF membranes (EMD Millipore, IPVH00010). The membranes were blocked and incubated overnight at 4°C with antibodies against BNIP3, BNIP3L, BCL2L13 (Proteintech, 16,612-1-AP), anti-FUNDC1, anti-LC3, anti-LAMP1, anti-TOMM20 (Thermo Fisher Scientific, PA5-52,843), anti-OxPhos cocktail (Thermo Fisher Scientific, 45–8099), anti-DNM1L/DRP1 (BD Biosciences, 611,113), anti-OPA1 (BD Biosciences, 612,607) anti-CYCS/cytochrome c (BD Biosciences, 556,433), anti-PRKN/PARKIN (Santa Cruz Biotechnology, sc-32,282), p-Ub (Cell Signaling Technology, 62,802), anti-ACTB/β-actin (Santa Cruz Biotechnology, sc-81,178), or anti-GAPDH (Cell Signaling Technology, 5174), anti-TUBB/β-tubulin (1:5000; DSHB, AA12.1). An ECL reagent (Prometheus, 20–301) was utilized to detect immunolabeling using a LAS400 imager (GE Life Science). Densitometric analysis was performed using ImageJ software.
Seahorse XF analysis
Maximum glycolytic capacity and ATP production rate using methods reported by Mookerjee and colleagues [Citation29,Citation30]. Briefly, 24 h prior to assay ShCtrl, ShBnip3 and cell with DFP were plated in 24-well Seahorse V7-PS assay plate under hypoxia. Prior to measurement cells were washed three times with 500 ul of Krebs Ringer Phosphate HEPES/KRPH (2 mM HEPES, 136 mM NaCl, 2 mM NaH2PO4, 3.7 mM KCl, 1 mM MgCl2, 1.5 mM CaCl2, 0.1% [w:v] fatty-acid-free BSA (Sigma, A7511), pH 7.4 at 37°C) and incubated 37°C for 1 h under 100% air. Oxygen consumption rate (OCR) and associated extracellular acidification rate (ECAR) were measured in a Seahorse XF-24 analyzer by addition via ports A-C of 10 mM glucose, 1 μM rotenone (Sigma, R8875) plus 1 μM myxothiazol (Sigma, T5580), and 200 μM monensin (Sigma, M5273) plus 1 μM FCCP (Sigma, C2920) for measuring glycolytic capacity. To measure ATP production rate from oxidative and glycolytic, OCR and ECAR was measured by addition of 10 mM glucose, 2 μg oligomycin (Sigma, 75,351), 1 μM rotenone plus 1 μM myxothiazol. The rate of oxygen consumption and extracellular acidification were normalized to protein content of the appropriate well.
Widely targeted small metabolites and eicosanoids measurements
Cells were transduced with ShCtrl and ShBnip3 viral particles as described above. For metabolomics, on the third day media was changed to DMEM without pyruvate, 10% dialyzed FBS (Sigma, F0392) and then cultured in hypoxia for 24 h. On harvest, cells were rinsed and collected in ice-cold 80% methanol and snap-frozen in liquid nitrogen and stored at −80°C until use. Prior to widely targeted small metabolites analysis, the extraction from cell pellet samples were centrifuged and pipetted into a LC sampling vial. Internal standards were added into each sample. The samples were then dried under gentle nitrogen flow and reconstitute in 150 μl of 80% methanol for injection. For eicosanoid profiling, the culture medium (500 μl) was diluted with phosphate buffer solution (500 μl) with internal standards. The extraction was loaded onto a StrataX SPE column and eicosanoids were eluted with methanol. The samples were dried under gentle nitrogen flow. The dried samples were reconstituted into 100 μl of methanol and pending LC injection.
The samples were analyzed on an ABsciex 6500+ coupled with a Waters UPLC. Small metabolites separation was performed on the Ace PFP column and iHILIC-p column (HILICON, 160–152-0520). The eicosanoids were separated on a BEH Shield RP18 column (Waters Corporation, 186,002,852). A pooled quality control (QC) sample was added to the sample list for the small metabolites and eicosanoids assays, separately. The QCs sample were injected six times for coefficient of variation (CV) calculation for data quality control. Metabolites with CVs lower than 30% used for the quantification. The data was analyzed with MetaboAnalyst 5.0 web server and accepted metabolites was entered manually using HMDB number. The enrichment and pathway analysis were performed using the small metabolites pathway data base (SMPDB), 99 metabolites based on normal human metabolic pathways. MetaboAnalyst provides the list of pathways in which these metabolites are found.
13C-Metabolic flux analysis
When flux was assessed in the [Citation1,Citation2]-13C-glucose labeling experiment, labeled glucose was added to be 50% of the total DMEM glucose concentration. A volume of 100 μl of cell culture medium from 1,2–13C glucose experiment was treated with 400 μl of methanol. After centrifugation, the supernatant was transferred to a LC-MS sampling vial and dried under gentle nitrogen flow. The sample was reconstituted into 100 ml of 80% methanol for LC-MS injection. Metabolite separation was performed on an ACE PFP-C18 column (1.7 μM x 1 mm x 100 mm; Mac-Mod Analytical, EXL17101002U) and analyzed on a ABSciex 6500+ with a Multiple Reaction Monitoring (MRM) mode. Two fragments were monitored with the carbon from position 1 to 4 (M0, m/z 102), and the carbon position from 1 to 5 (M0, m/z 128). M1 of glutamate of the C1-4 fragment (m/z 103) reflects the presence of 13C at the fourth carbon position and reflects pyruvate entering the acetyl units originating from glucose to pyruvate entering through PDH (pyruvate dehydrogenase). M2 of the same C1-4 glutamate fragment (m/z 104) reflects the presence of 13C at the second and third carbon and reflects pyruvate entering the oxaloacetate pool through pyruvate carboxylase [Citation9,Citation11,Citation82]. M2 of the glutamate C1-5 fragment (m/z 131) reflects the presence of both 13C at the second and third carbon positions and the presence of both 13C at the fourth and fifth carbon positions, summing as the overall TCA cycle flux. The two 13C atoms (M2) come from either pyruvate entering via PCX (pyruvate carboxylase) (carbons 2 and 3) or via PDH (carbons 4 and 5). The fraction of glucose converted to pentose phosphate in the pentose cycle is defined as: Pentose cycle = (M1/M2)/ (3 + M1/M2), where the M2 isotope yield in lactate is the product of glycolysis from [Citation1,Citation2]-13C-glucose and the recycled (from glucose through the pentose cycle) isotope yield of lactate as M1 lactate and lactate isotopomers were also derived from the ECF derivatization method [Citation9,Citation11,Citation83]. M0 lactate has m/z 89, M1 lactate m/z 90, and M2 lactate m/z 91. This LC/MS method yields the equivalent information as our previous GC/MS based method (9.11), and it was developed for use here because of an interfering spectral peak on chromatography for the GC/MS method.
When flux was assessed in the U13C-glutamine labeling experiment, labeled glutamine was added to be 50% of the total DMEM glutamine concentration. Methanol extraction from [Citation1,Citation2]-13C-glucose and U13C glutamine labeled cell pellets were dried under gentle nitrogen flow. The dried samples were derivatized with a methyl-moximation (with 15 mg/ml methoxy amine in pyridine, 30°C for 90 minutes) and MTBSTFA (at 70°C for 60 minutes). The samples were then analyzed with an Agilent GC-MS, with an electron impact mode and a DB-5 MS column (Agilent) following our protocol [Citation84]. The data were analyzed with Mass Hunter Quantitative Analysis software (Agilent). The enrichment was calculated after subtraction from the background of the non-labeled treatment samples. Fractional enrichments from G to R is sigma (stands for sigma mean), and it is equal to the weighted mean average of the metabolite’s enrichment (sigma mn = 1 xm1 + 2xm2 + 3xm3 etc).
Mitochondrial DNA quantification
DNA was extracted using DNA extraction lysis buffer (Qiagen, 158,845) from ShCtrl and ShBnip3 cells [Citation85]. qPCR (PowerUP SYBR green master mix; Applied Biosystems, A25742) was used to assess the mitochondrial DNA (mtDNA) content. For mtDNA and nuclear DNA (nDNA), mt-Nd1 (sense 5’-GGC TCC TTC TCC CTA CAA ATA C-3”; antisense −5’-TGT TTC TGC AAG GGT TGA AAT G-3’) and Cox4i1 (sense 5’-ATG TTG ATC GGC GTG ACT AC-3’; antisense 5’-AGT GGG CCT TCT CCT TCT-3’) were employed, respectively. The ratio of mtDNA to nDNA (mtDNA:nDNA) reflects the relative mtDNA content.
Transcriptomic profiling and bioinformatic analysis
DNA-free RNA was purified from ShCtrl, and ShBnip3 NP cells was quantified, and quality was assessed using a Nanodrop ND 100 spectrophotometer (Thermo Fisher Scientific) and Agilent 2200 Tape Station (Agilent Technologies, Palo Alto, CA, USA) respectively. The GeneChip WT Plus kit (Thermo Fisher Scientific, 902,414) was used to synthesize fragmented biotin-labeled cDNA. Rat Clariom S gene chips (Thermo Fisher Scientific, 902,935) were hybridized with fragmented, biotin-labeled cDNA in 100 mL of hybridization cocktail. Arrays were washed and stained with GeneChip hybridization wash and stain kit using GeneChip Fluidics Station 450 (Thermo Fisher Scientific) and subsequently scanned on an Affymetrix GeneChip Scanner 3000 7 G, using Command Console Software (Affymetrix, Santa Clara, CA, USA). CHP files were generated by sst rma normalization from CEL files and quality control of the experiment was performed in the Transcriptome Analysis Console (TAC) v4.0.2 (Affymetrix). The ShBnip3 group was compared to the ShCtrl group in the TAC, including all probe sets where at least 50% of the samples had a DABG (detected above background) p < 0.05. Inclusion cutoffs were defined at a 2-fold change, FDR ≤0.05%. Significantly differentially up- and downregulated genes were analyzed using the GTAC-CompBio Analysis Tool (PercayAI Inc., St. Louis, MO). CompBio performs a literature analysis to identify relevant processes and pathways represented by differentially expressed, or otherwise related, biological entities (genes, proteins, miRNAs, or metabolites) as described elsewhere [Citation32].
Comparison of ShBnip3 transcriptome with human degenerative disc transcriptome
The Assertion Engine (AE V1.0) is a machine learning module within the CompBio tool that can analyze and compare the entirety of the significantly enriched biological concepts and the inter-concept relationships from one experimental data set with another. The program was further used to compare the ShBnip3 and human degenerative disc profiles (GSE70362) [Citation35] at the concept level. As the concepts from a given analysis are related to one another, through conditional probability analysis, the AE computes the contextual preservation of similar concepts across the two compared data sets. In other words, if the same enriched concept is present in both data sets, the AE determines how similar or different that concept’s relationships are with the other concepts in the respective data sets. Strongly preserved groups of concept associations will form high-scoring sub-maps within the overall analysis. A global score, representing the complete contextual biological similarity between the two is also computed. A score of 0.0 represents no similarity and a score of 1.0 represents complete similarity.
Micro-computed tomography (μCT) analysis
μCT imaging was performed on the lumbar spine of 4-month WT and bnip3 KO mice (n = 5–6 lumbar discs/animal, 9 animals/genotype, 52–54 lumbar discs/genotype) using the high-resolution μCT scanner (Skyscan 1272, Bruker, Belgium). Lumber segments L2-6 were placed in PBS and scanned with an energy of 50 kVp and current of 200 mA resulting in 15 mm3 voxel size resolution. Intervertebral disc height and the length of the vertebral bones were measured and averaged along the dorsal, midline, and ventral regions in the sagittal plane. Disc height index (DHI) was calculated as previously described [Citation9].
Immunohistochemistry
To visualize mitochondrial morphology and mitophagy in vivo 4-month WT-mitoQC and bnip3 KO-mitoQC reporter mice caudal spines were fixed in 4% PFA for 8 h at 4°C, decalcified in 20% EDTA and treated with 30% (wt:vol) sucrose (Sigma, S0389) before embedding in OCT compound (Thermo Fisher Scientific, 4585). Coronal sections (8-μm thick) were cut on a cryostat (CM3050S; Leica Biosystems, Wetzlar, Germany), washed with PBS, and mounted with ProLong Gold Antifade Mountant with DAPI. Images were visualized using a Zeiss LSM 800 Axio Inverted confocal microscope (Plan-Apochromat 63x/1.40 oil). Lumbar spines from 4-month-old WT and bnip3 KO mice were harvested and fixed in 4% PFA for 48 h and decalcified in 12.5% EDTA at 4°C for 15 days prior to paraffin embedding. Mid-coronal IVD sections (n = 5–6 lumbar discs/animal, 10 animals/genotype, 59–60 lumbar discs/genotype) were stained with Safranin O/Fast Green/ Hematoxylin then visualized using a light microscope (AxioImager 2, Carl Zeiss). For immunofluorescence microscopy mid-coronal disc tissue sections of 7-μm thickness were de-paraffinized and incubated in microwaved citrate buffer for 20 min, proteinase K (BioLabs, P8107S) for 10 min at room temperature, or chondroitinase ABC (Sigma, C3667) for 30 min at 37°C for antigen retrieval (n = 5–6 lumbar discs/animal, 3 animals/genotype, 17–18 lumbar discs/genotype). Sections were blocked in 5% normal serum (Thermo Fisher Scientific, 10,000 C) in PBS-T (0.4% Triton X-100 in PBS) and incubated with antibody against SLC2A1/GLUT1 (1:200; Abcam, ab40084), COL10A1/collagen X (1:500; Abcam, ab58632). For mouse primary antibody Mouse on Mouse Kit (Vector laboratories, BMK2202) was used for blocking and primary antibody incubation. Tissue sections were thoroughly washed and incubated with Alexa Fluor 488-conjugated secondary antibody, at a dilution of 1:700 for 1 h at room temperature in the dark. The sections were washed with PBS-T and mounted with ProLong® Gold Antifade Mountant with DAPI. All mounted slides were visualized with Axio Imager 2 (Carl Zeiss) using 5×/0.15 NAchroplan (Carl Zeiss) or 10×/0,3 EC Plan-Neofluar (Carl Zeiss) objectives, X-Cite® 120Q Excitation Light Source (Excelitas), AxioCam MRm camera (Carl Zeiss), and Zen2TM software (Carl Zeiss).
Statistical analysis
Statistical analysis was performed using Prism9 (GraphPad, La Jolla, CA, USA). The quantitative data are represented as mean ± SEM or Box and whisker plots with median and interquartile range. Data distribution was checked with Shapiro-Wilk normality test, and differences between two groups were assessed by t-test or Mann-Whitney test as appropriate. One-way ANOVA or Kruskal Wallis test with appropriate post-hoc test (Sidak’s multiple comparisons test) was used for comparisons between more than two groups using Prism9 (Graphpad Software); p < 0.05.
Data Availability
All data generated or analyzed during this study are included in this published article (and its Supplementary files) or deposited in the GEO database (GSE202349, GSE70362)
Supplemental Material
Download MS Word (5.7 MB)Acknowledgments
We thank the Sidney Kimmel Cancer Center Cancer Genomics Facility of Thomas Jefferson University for performing the microarray analysis.
Disclosure statement
R.A. Barve may receive royalty income based on the CompBio technology developed by R.A. Barve and licensed by Washington University to PercayAI. The remaining authors declare they have no competing interests to disclose in relation to the contents of this article.
Supplementary material
Supplemental data for this article can be accessed online at https://doi.org/10.1080/15548627.2022.2162245
Additional information
Funding
References
- Livshits G, Popham M, Malkin I, et al. Lumbar disc degeneration and genetic factors are the main risk factors for low back pain in women: the UK twin spine study. Ann Rheum Dis. 2011;70(10):1740–1745. PMID: 2164416.
- James SL, Abate D, Abate KH, et al. Global, regional, and national incidence, prevalence, and years lived with disability for 354 diseases and injuries for 195 countries and territories, 1990-2017: a systematic analysis for the global burden of disease study 2017. Lancet. 2018;392:1789–1858. PMID: 30496104.
- Silagi ES, Shapiro IM, Risbud MV. Glycosaminoglycan synthesis in the nucleus pulposus: dysregulation and the pathogenesis of disc degeneration. Matrix Biol. 2018;72:368–379. PMID: 29501510.
- Choi H, Tessier S, Silagi ES, et al. A novel mouse model of intervertebral disc degeneration shows altered cell fate and matrix homeostasis. Matrix Biol. 2018 PMID: 29605718;70:102–122.
- Tessier S, Tran VA, Ottone OK, et al. TonEBP-deficiency accelerates intervertebral disc degeneration underscored by matrix remodeling, cytoskeletal rearrangements, and changes in proinflammatory gene expression. Matrix Biol. 2020 PMID: 31707045;87:94–111.
- Madhu V, Guntur AR, Risbud MV. Role of autophagy in intervertebral disc and cartilage function: implications in health and disease. Matrix Biol. 2021;100-101:207–220. PMID: 33301899.
- Agrawal A, Guttapalli A, Narayan S, et al. Normoxic stabilization of HIF-1α drives glycolytic metabolism and regulates aggrecan gene expression in nucleus pulposus cells of the rat intervertebral disk. Am J Physiol Cell Physiol. 2007;293(2):C621–31. PMID: 17442734.
- Silagi ES, Schoepflin ZR, Seifert EL, et al. Bicarbonate recycling by HIF-1–dependent carbonic anhydrase isoforms 9 and 12 is critical in maintaining intracellular pH and viability of nucleus pulposus cells. J Bone Miner Res. 2018;33(2):338–355. PMID: 28940640.
- Silagi ES, Novais EJ, Bisetto S, et al. Lactate efflux from intervertebral disc cells is required for maintenance of spine health. J Bone Miner Res. 2020;35(3):550–570. PMID: 31692093.
- Gan JC, Ducheyne P, Vresilovic EJ, et al. Intervertebral disc tissue engineering II: cultures of nucleus pulposus cells. Clin Orthop Relat Res. 2003;411:315–324. PMID: 12782890.
- Madhu V, Boneski PK, Silagi E, et al. Hypoxic regulation of mitochondrial metabolism and mitophagy in nucleus pulposus cells is dependent on HIF-1a-BNIP3 axis. J Bone Miner Res. 2020;35(8):1504–1524. PMID: 32251541.
- Vincent AE, Ng YS, Whilte K, et al. The spectrum of mitochondrial ultrastructural defects in mitochondrial myopathay. Sci Rep. 2016;6(1):30610. PMID: 27506553.
- Galloway CA, Yoon Y. Mitochondrial morphology in metabolic diseases. Antioxid Redox Signal. 2013;19(4):415–430. PMID: 22793999.
- Meng H, Yan WY, Lei YH, et al. SIRT3 regulation of mitochondrial quality control in neurodegenerative diseases. Front Aging Neurosci. 2019 PMID: 31780922;11:313.
- Hanahan D, Weinberg RA. The hallmarks of cancer. Cell. 2000;100(1):57–70. PMID: 10647931.
- Galluzzi L, Blomgren K, Kroemer G. Mitochondrial membrane permeabilization in neuronal injury. Nat Rev Neurosci. 2009;10(7):481–494. PMID: 19543220.
- Pernas L, Scorrano L. Mito-morphosis: mitochondrial fusion, fission, and cristae remodeling as key mediators of cellular function. Annu Rev Physiol. 2016;78(1):505. PMID: 26667075.
- Kraus F, Ryan MT. The constriction and scission machineries involved in mitochondrial fission. J Cell Sci. 2017;130(18):2953–2960. PMID: 28842472.
- Rub C, Wilkening A, Voos W. Mitochondrial quality control by the Pink1/Parkin system. Cell Tissue Res. 2017;367(1):111–123. PMID: 27586587.
- Hasson SA, Kane LA, Yamano K, et al. High-content genome-wideRNAi screens identify regulators of parkin upstream of mitophagy. Nature. 2013;504(7479):291–295. PMID: 24270810.
- Narendra DP, Jin SM, Tanaka A, et al. PINK1 is selectively stabilized on impaired mitochondria to activate Parkin. PLoS Biol. 2010;8(1):e1000298. PMID: 20126261.
- Zhang J, Ney PA. Role of BNIP3 and NIX in cell death, autophagy, and mitophagy. Cell Death Differ. 2009;16(7):939–946. PMID: 19229244.
- Liu L, Feng D, Chen G, et al. Mitochondrial outer-membrane protein FUNDC1 mediates hypoxia-induced mitophagy in mammalian cells. Nat Cell Biol. 2012;14(7):177–185. PMID: 22267086.
- Onishi M, Yamano K, Sato M, et al. Molecular mechanisms and physiological functions of mitophagy. EMBO J. 2021;40(3):e104705. PMID: 33438778.
- Chen G, Ray R, Dubik D, et al. The E1B 19K/Bcl-2-binding protein Nip3 is a dimeric mitochondrial protein that activates apoptosis. J Exp Med. 1997;186(12):1975–1983. PMID: 9396766.
- Palikaras K, Lionaki E, Tavernarakis N. Coordination of mitophagy and mitochondrial biogenesis during ageing in C. elegans. Nature. 2015;521(7553):525–528. PMID: 25896323.
- Fivenson EM, Lautrup S, Sun N, et al. Mitophagy in neurodegeneration and aging. Neurochem Int. 2017 PMID: 28235551;109:202–209.
- Williams FMK, Bansa AT, van Meurs JB, et al. Novel genetic variants associated with lumbar disc degeneration in Northern Europeans: a meta-analysis of 4600 subjects. Ann Rheum Dis. 2013;72(7):1141–1148. PMID: 22993228.
- Mookerjee SA, Nicholls DG, Brand MD. Determining maximum glycolytic capacity using extracellular flux measurements. PLoS One. 2016;11(3):e0152016. PMID: 27031845.
- Mookerjee SA, Gerencser AA, Nicholls DG, et al. Quantifying intracellular rates of glycolytic and oxidative ATP production and consumption using extracellular flux measurements. J Biol Chem. 2017;292(17):7189–7207. PMID: 28270511.
- Dehennaut V, Leprince D, Lefebvre T. O-GlcNAcylation, an epigenetic mark. Focus on the histone code, TET family proteins, and polycomb group proteins. Front. Endocrinology. 2014; 5:155. PMID: 25309514.
- Winkler ES, Gilchuk P, Yu JAA. Human neutralizing antibodies against SARS-CoV-2 require intact Fc effector functions for optimal therapeutic protection. Cell. 2021;184(7):1804–1820. PMID: 33691139.
- Tsingas M, Ottone OK, Hasseb A, et al. Sox9 deletion causes severe intervertebral disc degeneration characterized by apoptosis, matrix remodeling, and compartment-specific transcriptomic changes. Matrix Biol. 2020 PMID: 33027692;94:110–133.
- Delannoy-Bruno O, Desai C, Raman AS, et al. Evaluating microbiome-directed fibre snacks in gnotobiotic mice and humans. Nature. 2021;595(7865):91–95. PMID: 34163075.
- Kazezian Z, Gawri R, Haglund L, et al. Gene expression profiling identifies interferon signalling molecules and IGFBP3 in human degenerative annulus fibrosus. Sci Rep. 2015;5(1):15662. PMID: 26489762.
- Novais EJ, Tran VA, Miao J, et al. Comparison of inbred mouse strains shows diverse phenotypic outcomes of intervertebral disc aging. Aging Cell. 2020;19(5):e13148. PMID: 32319726.
- Otera H, Wang C, Cleland MM, et al.Mff is an essential factor for mitochondrial recruitment of Drp1 during mitochondrial fission in mammalian cells.J Cell Biol. 2010Dec13;191:1141–1158. PMID: 211495676
- Auger C, Alhasawi A, Contavadoo M, et al. Dysfunctional mitochondrial bioenergetics and the pathogenesis of hepatic disorders. Front Cell Dev Biol. 2015;3:40. PMID: 26161384.
- Miettinen TP, Pessa HKJ, Caldez MJ, et al. Identification of transcriptional and metabolic programs related to mammalian cell size. Curr Biol. 2014;24(6):598–608. PMID: 24613310.
- Das Neves RP, Jones NS, Andreu L, et al. Connecting variability in global transcription rate to mitochondrial variability. PLoS Biol. 2010;8(12):e1000560. PMID: 21179497.
- Johnston IG, Gaal B, Das Neves RP, et al. Mitochondrial variability as a source of extrinsic cellular noise. PLOS Comput Biol. 2012;8(3):e1002416. PMID: 22412363.
- Guantes R, Rastrojo A, Neves R, et al. Global variability in gene expression and alternative splicing is modulated by mitochondrial content. Genome Res. 2015;25(5):633–644. PMID: 25800673.
- Tang C, Han H, Liu Z, et al. Activation of BNIP3-mediated mitophagy protects against renal ischemia-reperfusion injury. Cell Death Dis. 2019;19(9):677. PMID: 31515472.
- Zhao JF, Rodger CE, Allen GFG, et al. HIF1a-dependent mitophagy facilitates cardiomyoblast differentiation. Cell Stress. 2020;4(5):99–113. PMID: 32420530.
- Zhang HW, Kim MR, Lee HJ, et al. P53/BNIP3-dependent mitophagy limits glycolytic shift in radioresistant cancer. Oncogene. 2019;38(9):3729–3742. PMID: 30664690.
- Spinger MZ, Poole LP, Drake LE, et al. BNIP3-dependent mitophagy promotes cytosolic localization of LC3B and metabolic homeostasis in the liver. Autophagy. 2021;17(11):3530–3546. PMID: 33459136.
- Vera-Perez M, Rossi M, Van den Haute C, et al. BNIP3 promotes HIF-1a driven melanoma growth by curbing intracellular iron homeostasis. EMBO J. 2021;40(10):e106214. PMID: 33932034.
- Lampert MA, Orogo AM, Najor RH, et al. BNIP3L/NIX and FUNDC1-mediated mitophagy is required for mitochondrial network remodeling during cardiac progenitor cell differentiation. Autophagy. 2019;15(7):1182–1198. PMID: 30741592.
- Wang J, Zhu P, Li R, et al. Fundc1-depedent mitophagy is obligatory to ischemic precondition-conferred renoprotection is ischemic AKI via suppression of DRP1-mediated mitochondrial fission. Redox Biol. 2020;30:101415. PMID: 31901590.
- Glick D, Zhang W, Beaton M, et al. BNIP3 regulates mitochondrial function and lipid metabolism in the liver. Mol Cell Biol. 2012;32(13):2570–2584. PMID: 22547685.
- Tol MJ, Ottenhoff R, van Eijk M, et al. A PPARg-Bnip3 axis couples adipose mitochondrial fusion-fission balance to systemic insulin sensitivity. Diabetes. 2016;65(9):2591–2605. PMID: 27325287.
- Choi JW, Jo A, Kim M, et al. BNIP3 is essential for mitochondrial bioenergetics during adipocyte remodelling in mice. Deabetologia. 2016;59(3):571–581. PMID: 26693709.
- Buttgereit F, Brand MD. A hierarchy of ATP-consuming processes in mammalian cells. Biochem J. 1995;312(1):163–167. PMID: 7492307.
- Martinez-Reyes I, Chandel NS. Mitochondrial TCA cycle metabolites control physiology and disease. Nat Commun. 2020;11(1):102. PMID: 31900386.
- Kühl I, Miranda M, Atanassov I, et al. Transcriptomic and proteomic landscape of mitochondrial dysfunction reveals secondary coenzyme Q deficiency in mammals eLife. eLife. 2017;6:e30952.
- Tower RJ, Busse E, Jaramillo J, et al. Spatial transcriptomics reveals metabolic changes underly age-dependent declines in digit regeneration eLife. eLife. 2022;11:e71542.
- Huang M, Lou D, Charli A, et al. Mitochondrial dysfunction-induced H3K27 hyperacetylation perturbs enhancers in Parkinson’s disease. JCI Insight. 2021;6(17):e138088. PMID: 34494552.
- Novais EJ, Diekman BO, Shapiro IM, et al. p16Ink4a deletion in cells of the intervertebral disc affects their matrix homeostasis and senescence associated secretory phenotype without altering onset of senescence. Matrix Biol. 2019;82:54–70. PMID: 30811968.
- Ratsep T, Minajeva A, Asser T. Relationship between neovascularization and degenerative changes in herniated lumbar intervertebral discs. Eur Spine J. 2013;22(11):2474–2480. PMID: 23736847.
- Binch LA, Cole AA, Breakwell LM, et al. Expression and regulation of neurotrophic and angiogenic factors during human intervertebral disc degeneration. Arthritis Res Ther. 2014;16(4):416. PMID: 25209447.
- Wiet MG, Piscioneri A, Khan SN, et al. Mast Cell-Intervertebral disc cell interactions regulate inflammation, catabolism and angiogenesis in discogenic back pain. Sci Rep. 2017;7(1):12492. PMID: 28970490.
- Weisberg SP, McCann D, Desai M, et al. Obesity is associated with macrophage accumulation in adipose tissue. J Clin Invest. 2003;112(12):1796–1808. PMID: 14679176.
- Wouters K, van Gorp PJ, Bieghs V, et al. Dietary cholesterol, rather than liver steatosis, leads to hepatic inflammation in hyperlimididemic mouse models of nonalcoholic steatohepatitis. Hepatology. 2008;48(2):474–486. PMID: 18666236.
- Van Diepen JA, Berbee JF, Havekes LM, et al. Interactions between inflammation and lipid metabolism: relevance for efficacy of anti-inflammatory drugs in the treatment of atherosclerosis. Atherosclerosis. 2013;228(2):306–315. PMID: 23518178.
- Greene ER, Huang S, Serhan CN, et al. Regulation of inflammation in cancer by eicosanoids. Prostaglandins Other Lipid Mediat. 2011;96(1–4):27–36. PMID: 21864702.
- Harizi H, Corcuff JB, Gualde N. Arachidonic-acid-derived eicosanoids: roles in biology and immunopathology. Trends Mol Med. 2008;14(10):461–469. PMID: 18774339.
- Kitano M, Hla T, Sekiguchi M, et al. Sphingosine 1-phosphate/sphingosine 1-phosphate receptor 1 signaling in rheumatoid synovium: regulation of synovial proliferation and inflammatory gene expression. Arthritis Rheum. 2006;54(3):742–753. erratum 54, 1704 (2006). PMID: 16508938.
- Majumdar I, Mastrandrea LD. Serum sphingolipids and inflammatory mediators in adolescents at risk for metabolic syndrome. Endocrine. 2012;41(3):442–449. PMID: 22228496.
- Gonzalez-Jaramillo V, Portilla-Fernandez E, Glisic M, et al. Epigenetics and inflammatory markers: a systematic review of the current evidence. Int J Inflamm. 2019;2019:e6273680. PMID: 31205673.
- Zhang C, Wang F, Xie Z, et al. Dysregulation of YAP by the Hippo pathway is involved in intervertebral disc degeneration, cell contact inhibition and cell senescence. Oncotarget. 2018;9(2):2175–2192. PMID: 29416763.
- Rausch V, Hansen CG. The Hippo pathway, YAP/TAZ, and the plasma membrane. Trends Cell Biol. 2020;30(1):32–48. PMID: 31806419.
- Vogel V. Unraveling the mechanobiology of extracellular matrix. Annu Rev Physiol. 2018;80(1):353–387. PMID: 29433414.
- Kechagia JZ, Ivaska J, Roca-Cusachs P. Integrins as biomechanical sensors of the microenvironment. Nat Rev Mol Cell Biol. 2019;20(8):457–473. PMID: 31182865.
- Cao F, Zhou Y, Liu X, et al. Podosome formation promotes plasma membrane invagination and integrin-β3 endocytosis on a viscous RGD-membrane. Commun Biol. 2020;3(1):117. PMID: 32170110.
- Saffarian S, Cocucci E, Kirchhausen T. Distinct dynamics of endocytic clathrin-coated pits and coated plaques. PLoS Biol. 2009;7(9):e1000191. PMID: 19809571.
- Tessier S, Doolittle AC, Sao K, et al. Arp2/3 inactivation causes intervertebral disc and cartilage degeneration with dysregulated TonEBP-mediated osmoadaptation. JCI Insight. 2020;5(4):e131382. PMID: 31961823.
- Diwan A, Krenz M, Syed FM, et al. Inhibition of ischemic cardiomyocyte apoptosis through targeted ablation of Bnip3 restrains postinfarction remodeling in mice. J Clin Invest. 2007;117(10):2825–2833. PMID: 17909626.
- McWilliams TG, Prescott AR, Allen GF, et al. Mito-QC illuminates mitophagy and mitochondrial architecture in vivo. J Cell Biol. 2016;214(3):333–345. PMID: 27458135.
- Risbud MV, Guttapalli A, Stokes DG, et al. Nucleus pulposus cells express HIF-1 alpha under normoxic culture conditions: a metabolic adaptation to the intervertebral disc microenvironment. J Cell Biochem. 2006;98(1):152–159. PMID: 16408279.
- Valente AJ, Maddalena LA, Robb EL, et al. A simple ImageJ macro tool for analyzing mitochondrial network morphology in mammalian cell culture. Acta Histochem. 2017;119(3):315–326. PMID: 28314612.
- Picard M, Gentil BJ, McManus MJ, et al. Acute exercise remodels mitochondrial membrane interactions in mouse skeletal muscle. J Appl Physiol. 2013;115(10):1562–1571. PMID: 23970537.
- Boros LG, Bassilian S, Lim S, et al. Genistein inhibits nonoxidative ribose synthesis in MIA pancreatic adenocarcinoma cells: a new mechanism of controlling tumor growth. Pancreas. 2001;22(1):1–7. PMID: 11138960.
- Lee WP, Boros LG, Puigjaner J, et al. Mass isotopomer study of the nonoxidative pathways of the pentose cycle with [1,2-13C2]glucose. Am J Physiol Endocrinol Metab. 1998;274(5):E843–51. PMID: 9612242.
- Qiu Y, Moir R, Willis I, et al. Isotopic ratio outlier analysis of the S. cerevisiae metabolome using accurate mass gas chromatography/time-of-flight mass spectrometry: a new method discovery. Anal Chem. 2016;88(5):2747–2754. PMID: 26820234.
- Longchamps RJ, Castellani CA, Yang SY, et al. Evaluation of mitochondrial DNA copy number estimation techniques. PLoS One. 2020 Jan 31;15(1):e0228166. PMID:32004343.