
ABSTRACT
Mitophagy is a form of autophagy that plays a key role in maintaining the homeostasis of functional mitochondria in the cell. Viruses have evolved various strategies to manipulate mitophagy to escape host immune responses and promote virus replication. In this study, the nucleoprotein (NP) of H1N1 virus (PR8 strain) was identified as a regulator of mitophagy. We revealed that NP-mediated mitophagy leads to the degradation of the mitochondria-anchored protein MAVS, thereby blocking MAVS-mediated antiviral signaling and promoting virus replication. The NP-mediated mitophagy is dependent on the interaction of NP with MAVS and the cargo receptor TOLLIP. Moreover, Y313 of NP is a key residue for the MAVS-NP interaction and NP-mediated mitophagy. The NPY313F mutation significantly attenuates the virus-induced mitophagy and the virus replication in vitro and in vivo. Taken together, our findings uncover a novel mechanism by which the NP of influenza virus induces mitophagy to attenuate innate immunity.
Abbreviations: ACTB: actin beta; ATG7: autophagy related 7; ATG12: autophagy related 12; CCCP: carbonyl cyanide 3-chlorophenyl hydrazone; co-IP: co-immunoprecipitation; COX4/COXIV: cytochrome c oxidase subunit 4; DAPI: 4ʹ,6-diamidino-2-phenylindole, dihydrochloride; EID50: 50% egg infective dose; GAPDH: glyceraldehyde-3-phosphate dehydrogenase; GFP: green fluorescent protein; HEK: human embryonic kidney; hpi: hours post-infection; IAV: influenza A virus; IFN: interferon; IP: immunoprecipitation; LAMP1: lysosomal associated membrane protein 1; MAP1LC3/LC3: microtubule associated protein 1 light chain 3; MAVS: mitochondrial antiviral signaling protein; Mdivi-1: mitochondrial division inhibitor 1; MLD50: 50% mouse lethal dose; MOI: multiplicity of infection; NBR1: NBR1 autophagy cargo receptor; NP: nucleoprotein; PB1: basic polymerase 1; RFP: red fluorescent protein; RIGI: RNA sensor RIG-I; RIGI-N: RIGI-CARD; SeV: Sendai virus; SQSTM1/p62: sequestosome 1; TIMM23: translocase of inner mitochondrial membrane 23; TOLLIP: toll interacting protein; TOMM20: translocase of outer mitochondrial membrane 20; TUBA: tubulin alpha; Vec: empty vector; vRNP: viral ribonucleoprotein.
Introduction
Mitophagy is a form of autophagy that selectively removes damaged mitochondria from the cell and, as such, plays an important role in the homeostasis of functional mitochondria [Citation1]. The process of mitophagy is initiated by effectors that bring together molecular signals on mitochondria and MAP1LC3/LC3 (microtubule associated protein 1 light chain 3) on phagophores. Then, the resulting autophagosome fuses with the lysosome to form an autolysosome. Eventually, the mitochondria are degraded by the autolysosome [Citation2]. Accumulating evidence suggests that multiple viruses, such as severe acute respiratory syndrome coronavirus 2 (SARS-CoV-2), human parainfluenza virus type 3 (HPIV3), and Newcastle disease virus, have developed various strategies to trigger mitophagy for their own benefit [Citation3–5]. Upon viral infection, the MAVS (mitochondria antiviral signaling protein) plays an essential role in antiviral type I IFN/interferon responses. Some viruses can benefit from the induction of mitophagy, which leads to the degradation of MAVS and blocks the MAVS-mediated type I IFN response [Citation6,Citation7]. However, the molecular mechanisms responsible for virus-induced mitophagy remain unknown.
Influenza A viruses (IAVs) are important zoonotic pathogens responsible for global pandemics and annual epidemics, and are continually challenging animal and human health. IAVs (H1N1, H2N2, and H3N2) have caused four influenza pandemics since 1918 and an unprecedented number of deaths [Citation8]. IAVs are segmented, single-stranded, negative-sense RNA viruses that are members of the Orthomyxoviridae family. The IAV genome comprises eight gene segments (basic polymerase 2 [PB2], basic polymerase 1 [PB1], acidic polymerase [PA], hemagglutinin [PA], nucleoprotein [NP], neuraminidase [NA], matrix [M], and nonstructural protein [NS]) that encode at least 14 proteins [Citation9,Citation10]. Among them, the NP protein is highly conserved and the most abundant non-enzymatic viral protein in infected cells [Citation11]. NP is a key component of the viral ribonucleoproteins (vRNPs) complex, and its recognized functions include, but are not limited to, binding to RNA and oligomerizing for the vRNP complex, undergoing intracellular trafficking, and participating in the switch from mRNA transcription to vRNA replication [Citation9,Citation12,Citation13]. One study has reported that NP induces the AKT-MTOR-dependent autophagy pathway to increase the production of infectious viral particles [Citation14]. However, whether NP plays a role in IAV-induced mitophagy remains unclear.
TOLLIP (toll interacting protein) is a multitasking intracellular protein that is expressed in most cell types [Citation15]. It was first identified as a protein that interacts with the cytoplasmic tail of IL1RAP (interleukin 1 receptor accessory protein) to mediate the inflammatory response [Citation16]. TOLLIP is a key component of multiple essential intracellular pathways that mediate pro- or anti-inflammatory effects, such as the signaling pathways in which NFKB/NF-κB (nuclear factor kappa B), TLR4 (toll like receptor 4), and TGFB/TGFβ (transforming growth factor beta) participate [Citation17]. As a well-known adaptor protein in intracellular trafficking, TOLLIP contains LC3-interacting regions and a coupling of ubiquitin to ER degradation domain, which enables the binding of TOLLIP to ubiquitinated protein aggregates, bridging the whole complex with LC3, which can then be shuttled via autophagosomes to lysosomes for degradation [Citation18]. A recent study showed that TOLLIP regulates PRKN/parkin-dependent endosomal trafficking of a discrete subset of mitochondrial-derived vesicles/MDVs to facilitate the clearance of damaged mitochondrial components [Citation19].
In the present study, we demonstrated that the NP of IAV interacts with MAVS and TOLLIP on mitochondria and induces mitophagy, resulting in the degradation of MAVS and the inhibition of the type I interferon response. Further study revealed that the Y313 residue of NP is essential for NP-induced mitophagy. Our data reveal an important mechanism through which IAV NP hijacks mitophagy to facilitate virus replication.
Results
PR8-H1N1 NP overexpression induces mitophagy
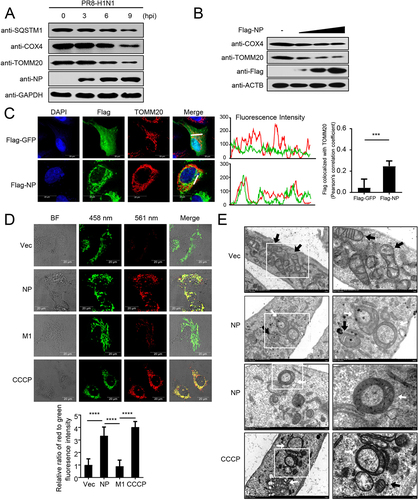
Previous studies have revealed that IAV infection induces mitophagy [Citation7,Citation20]. Here, we consistently found that the expression of polyubiquitin-binding protein SQSTM1/p62 (sequestosome 1) and the mitochondrial proteins COX4/COXIV (cytochrome c oxidase subunit 4) and TOMM20 (translocase of outer mitochondrial membrane 20) was reduced following PR8 virus infection (). To confirm which protein of IAVs may induce mitophagy, we constructed 11 Flag-tagged expression plasmids encoding the individual viral proteins of PR8 virus (PB2, PB1, HA, NA, PA, M1, M2, NS1, NS2, PB1-F2, and PA-X). Confocal microscopy showed that the NP protein colocalizes with mitochondria and could induce mitophagy (data not shown). As verification, different amounts of NP plasmid were transfected into HEK293T cells, and the expression of COX4 and TOMM20 was found to be clearly reduced (). Confocal microscopy confirmed that NP colocalized with TOMM20, which anchors at the outer membrane of mitochondria (). To further confirm the role of NP in mitophagy, we used mito-keima, which is a pH-sensitive, dual-excitation ratiometric fluorescent protein with resistance to lysosomal proteases that is widely used to assess single mitophagic events [Citation21,Citation22]. Using CCCP (carbonyl cyanide 3-chlorophenyl hydrazone)-induced mitophagy as a positive control and the matrix protein 1 (M1) of PR8 virus as a negative control, we detected limited red fluorescence in the mito-keima and empty vector (Vec) or M1-expressing U2OS cells; however, NP or CCCP treatment induced a remarkable increase in red fluorescence (). Using MitoTracker to label the mitochondria, we found that NP increased the colocalization of mitochondria with endogenous LC3 and LAMP1 (lysosomal associated membrane protein 1) (Figure S1A,B). In addition, transmission electron microscopy experiments clearly showed that (parts of) mitochondria were often enclosed by double membrane structures in the NP-expressing cells (). Collectively, these findings suggest that the NP of PR8 virus induces mitophagy.
Figure 1. PR8 NP induces mitophagy. (A) HEK293T cells were infected with PR8 virus for the indicated times before WB (western blotting). (B) HEK293T cells were transfected with increasing amounts of Flag-NP for 24 h before WB. (C) NP colocalizes with TOMM20. U2OS cells were transfected with Flag-NP or Flag-GFP plasmids. Twenty hours later, the cells were fixed with 4% paraformaldehyde and stained with anti-Flag before confocal microscopy. The middle panels show the red (TOMM20) and green (Flag) pixel intensity. Scale bar: 20 μm. The right panel shows the quantification of Pearson’s colocalization coefficient between TOMM20 and Flag. (D) U2OS cells expressing mito-keima were transfected with empty vector (Vec), Flag-NP, Flag-M1, or treated with CCCP (as a control to induce mitophagy), respectively. Twenty hours later, the cells were imaged with 458-nm and 561-nm laser excitation for mito-keima. BF indicates the bright field images. Scale bar: 20 μm. The bottom panel shows the quantification of the relative ratio of fluorescence intensity (561 nm:458 nm) of the cells. (E) Electron microscopy images from U2OS cells transfected with a Flag-NP plasmid or treated with CCCP. The black arrows indicate mitochondria; the white arrows indicate mitophagic vacuoles. Results are representative of three independent experiments.
NP-mediated mitophagy leads to MAVS degradation and restriction of type I interferon signaling
As MAVS predominantly localizes and functions at the outer membrane of mitochondria [Citation23], we hypothesized that NP-mediated mitophagy might affect the functions of MAVS. To test this hypothesis, we transfected Flag-tagged NP into HEK293T cells and used PB1 as a positive control, which was previously shown to mediate MAVS degradation [Citation24]. It was found that NP specifically downregulated the expression of endogenous or HA-tagged MAVS (). Additionally, NP specifically downregulated the expression of MAVS, but not of RIGI that does not localize on the mitochondria (). Using CHX to block protein translation, we confirmed that NP shortened the half-life of MAVS (). ATG7 (autophagy related 7) and ATG12 (autophagy related 12) are key adaptors of autophagy degradation [Citation25]. As shown in Figure S2A, ATG7 or ATG12 deficiency completely blocked NP-mediated degradation of MAVS, which was fully restored by reconstitution with ATG7 or ATG12, respectively. Moreover, NP-mediated MAVS degradation could be mostly restored by treatment with the autophagy inhibitors 3-methylademine (3-MA), chloroquine (CQ), bafilomycin A1 (BafA1), or the lysosome inhibitor ammonium chloride (NH4Cl), but not by the proteasome inhibitor MG132, or the caspase inhibitor ZVAD (). Using mitochondrial division inhibitor 1 (Mdivi-1) to inhibit mitophagy, as described previously [Citation26], we found that Mdivi-1 suppressed the NP-induced degradation of mitochondrial proteins, including MAVS, TIMM23, and TOMM20 (). Collectively, these data suggest that NP-mediated mitophagy results in the degradation of MAVS.
Figure 2. PR8 NP-indued mitophagy promotes MAVS degradation. (A) HEK293T cells were transfected with the indicated plasmids for 24 h before WB. The right panel shows the intensities of the indicated protein bands, which were determined by ImageJ and normalized to GAPDH. (B) Overexpression of NP decreases the MAVS protein level. HEK293T cells were transfected with HA-MAVS or HA-RIGI and increasing amounts of Flag-NP for 24 h before WB. (C) HEK293T cells were transfected with the indicated plasmids and treated with CHX (100 μg/mL). Cells were harvested for total protein extraction at the indicated times after treatment, then WB was performed with the indicated antibodies. (D) 3-MA, CQ, NH4Cl, and BafA1 blocked NP-mediated MAVS degradation. HEK293T cells were transfected with the indicated plasmids for 20 h and then treated with 3-MA (10 mM), CQ (50 μM), NH4Cl (20 mM), MG132 (10 μM), BafA1 (0.2 μM), or ZVAD (20 μM) for 6 h. The cell lysates were then analyzed by WB. The intensities of the indicated protein bands were determined and normalized to ACTB by using ImageJ, and are shown as the fold-change of the indicated MAVS:ACTB. (E) HEK293T cells were treated with Mdivi-1 (20 μM) for 2 h and then transfected with Flag-NP or Vec for 20 h. The cell lysates were then analyzed by WB. (F) HEK293T cells were transfected with Flag-NP or Vec, and subsequently treated with RIGI-N or infected with SeV. The IFNB concentration in the supernatants was determined by use of an ELISA. Results are representative of three independent experiments.
MAVS plays vital roles in virus-triggered type I interferon induction and innate antiviral responses [Citation27]. Having established that NP can induce mitophagy, resulting in MAVS degradation, we sought to determine whether NP affects type I interferon signaling. Overexpression of NP strongly inhibited RIGI-CARD (RIG-IN), SeV (Sendai virus), or poly(I:C)-triggered activation of the IFNB/IFN-β promoter (Figure S2B). In contrast, NP did not affect the activation of the IFNB promoter triggered by HA-MITA or HSV, which do not involve MAVS (Figure S2C). Quantitative PCR/qPCR analysis indicated that overexpression of NP significantly inhibited PR8 or SeV-triggered transcription of the IFNB (interferon beta), ISG15 (ISG15 ubiquitin like modifier), IFIT1/ISG56 (interferon induced protein with tetratricopeptide repeats 1), IFIT2, MX1 (MX dynamin like GTPase 1), and CXCL10 (C-X-C motif chemokine ligand 10) genes in human A549 cells (Figure S2D). Most importantly, NP significantly inhibited the induction of IFNB triggered by SeV or RIGI-N (). Taken together, these data suggest that NP inhibits the type I interferon signaling pathway.
NP interacts with MAVS
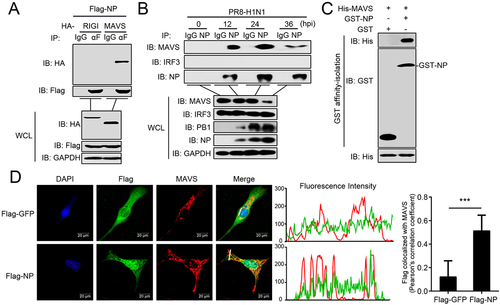
We next investigated the mechanism by which NP induces mitophagy. A recent study reported that the M2 protein of IAV anchors to mitochondria and disrupts mitochondrial dynamics through an interaction with MAVS [Citation28]. We therefore asked whether MAVS is involved in NP-induced mitophagy. Co-immunoprecipitation (co-IP) experiments indicated that HA-tagged MAVS, but not RIGI, specifically interacted with Flag-tagged NP (). Endogenous co-IP experiments further verified that NP associates with MAVS following PR8 virus infection at the indicated times (). Affinity-isolation assays showed that GST-NP directly interacts with His-MAVS in vitro (). Confocal microscopy confirmed that NP colocalizes with MAVS in the cytoplasm (). These results suggest that MAVS might participate in the NP-mediated mitophagy through interacting with NP.
Figure 3. PR8 NP interacts with MAVS. (A) Overexpressed NP interacts with MAVS. HEK293T cells were transfected with the indicated plasmids for 24 h. Then, co-IP and WB were performed with the indicated antibodies. (B) PR8 NP interacts with endogenous MAVS. A549 cells were infected with PR8 virus for the indicated times before co-IP and WB. (C) PR8 NP interacts with MAVS directly. Purified GST-NP was used to affinity-isolate purified His-MAVS. (D) PR8 NP colocalizes with MAVS. U2OS cells were transfected with Flag-GFP or Flag-NP, along with HA-MAVS. Twenty hours later, the cells were fixed with 4% paraformaldehyde and stained with anti-Flag and anti-MAVS before confocal microscopy. The middle panels show the red (MAVS) and green (Flag) pixel intensity. Scale bar: 20 μm. The right panel shows the quantification of Pearson’s colocalization coefficient between MAVS and Flag. Results are representative of three independent experiments.
NP and MAVS interact with TOLLIP
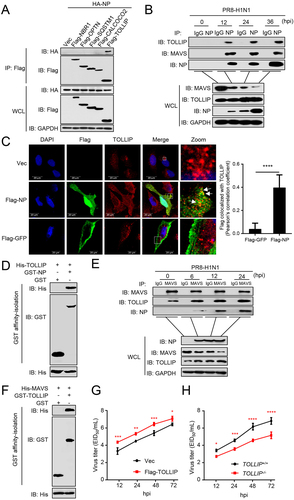
To identify the cargo receptor participating in the NP-mediated mitophagy, we used co-IP experiments and revealed that NP interacted with TOLLIP, but not with SQSTM1, OPTN (optineurin), NBR1 (NBR1 autophagy cargo receptor), and CALCOCO2/NDP52 (calcium binding and coiled-coil domain 2) (). Following infection of A549 cells with PR8 virus, NP specifically interacted with endogenous TOLLIP, as well as MAVS (). Confocal microscopy analysis revealed the colocalization of NP and TOLLIP (). GST affinity-isolation assays showed that GST-NP directly interacted with His-TOLLIP (). Additionally, we found that MAVS specifically interacts with TOLLIP in the absence of virus infection. Moreover, the MAVS-TOLLIP interaction increased following PR8 virus infection (). GST affinity-isolation assay revealed that GST-TOLLIP directly interacts with His-MAVS in vitro (). At the virus level, overexpression of TOLLIP enhanced virus replication, whereas TOLLIP-deficiency significantly inhibited viral replication compared to wild-type cells at the indicated times (). Together, these results demonstrate that TOLLIP specifically interacts with NP and MAVS to facilitate virus replication.
Figure 4. NP and MAVS interact with TOLLIP. (A) HEK293T cells were transfected with HA-NP and Flag-tagged cargo receptors (NBR1, OPTN, SQSTM1, CALCOCO2, and TOLLIP) for 24 h before WB. (B) A549 cells were infected with PR8 virus for the indicated times before co-IP with anti-NP antibody. (C) U2OS cells were transfected with Vec, Flag-GFP, or Flag-NP. Twenty hours later, the cells were fixed with 4% paraformaldehyde and stained with anti-Flag and anti-TOLLIP before confocal microscopy. Scale bar: 20 μm. The right panel shows the quantification of Pearson’s colocalization coefficient between MAVS and Flag. (D) Purified GST-NP was used to affinity-isolate purified His-TOLLIP. (E) A549 cells were infected with PR8 virus for the indicated times before co-IP with anti-MAVS antibody. (F) Purified GST-TOLLIP was used to affinity-isolate purified His-MAVS. (G) A549 cells were transfected with Flag-TOLLIP or Vec, and then infected with PR8 virus at an MOI of 0.1. At the indicated times post-infection, the supernatant containing viral particles was assessed in the EID50 assay. (H) TOLLIP+/+ or TOLLIP−/− cells were infected with PR8 virus at an MOI of 0.1. At the indicated times post-infection, the supernatant containing viral particles was assessed in the EID50 assay. Results are representative of three independent experiments.
NP-mediated mitophagy is dependent on MAVS and TOLLIP
To clarify the mechanism(s) by which NP induces mitophagy with MAVS and TOLLIP, we first analyzed the expression of multiple proteins in the cytosol and mitochondrial fractions after PR8 infection. Following PR8 infection, the mitochondria-located MAVS, COX4, and TOMM20 levels were significantly reduced, whereas the expression of NP and TOLLIP was increased and more enriched in the mitochondrial fraction (). Following NP expression, the levels of the mitochondria-located protein TOMM20 were significantly reduced in wild-type cells. In MAVS-deficient cells, the NP-induced degradation of TOMM20 was restored (). Consistently, in TOLLIP-deficient cells, the NP-induced degradation of MAVS and TOMM20 was markedly restored (). In contrast, cargo receptor NBR1 or CALCOCO2 deficiency did not affect the NP-induced degradation of MAVS (Figure S3A,B). In addition, overexpressed TOLLIP enhanced the NP-mediated degradation of MAVS (). In MAVS-deficient cells, the interaction between NP and TOLLIP was impaired (). Furthermore, MAVS-deficiency blocked the NP-induced degradation of TOMM20, and the enrichment of the mitochondria-localized NP and TOLLIP (). These results reveal that mitochondria-localized MAVS is necessary to recruit NP and TOLLIP to mitochondria, and that TOLLIP acts as a receptor for NP-mediated MAVS-dependent mitophagy.
Figure 5. MAVS and TOLLIP are key molecules for NP-mediated mitophagy. (A) HEK293T cells were infected with PR8 virus for the indicated times. Cytoplasmic and mitochondrial fractions were purified for WB (Fractions: Cyto, purified cytosolic; Mito, purified mitochondria). The intensities of the indicated protein bands were determined by using ImageJ and normalized to GAPDH. (B) MAVS+/+ or MAVS−/− cells were transfected with the indicated plasmids for 24 h before WB. The intensities of the indicated protein bands were determined by using ImageJ and normalized to TUBA/α-Tubulin. (C) TOLLIP+/+ or TOLLIP−/− cells were transfected with the indicated plasmids for 24 h before WB. The intensities of the indicated protein bands were determined by using ImageJ and normalized to ACTB. (D) HEK293T cells were transfected with the indicated plasmids for 24 h before WB. (E) MAVS+/+ or MAVS−/− cells were transfected with the indicated plasmids for 24 h before co-IP with anti-Flag antibody. (F) MAVS+/+ or MAVS−/− cells were transfected with the indicated plasmids for 24 h. Cytoplasmic and mitochondrial fractions were purified for WB (Fractions: Cyto, purified cytosolic; Mito, purified mitochondria). The intensities of the indicated protein bands were determined by using ImageJ and normalized to GAPDH. Results are representative of three independent experiments.
Tyrosine at position 313 in NP is essential for the NP-mediated mitophagy
We previously reported that the NP of H7N9, H5N1, and H5N6 IAV potentiates the activation of the IFNB promoter, but that of H1N1 virus had the opposite effect [Citation29]. Here, we asked whether the NP-mediated mitophagy and degradation of MAVS contribute to this effect. We found that NP protein from SZ19 (H7N9) virus did not decrease the expression of MAVS (). As shown in Figure S4A, the sequence of NP proteins of PR8 and SZ19 differs by nine amino acids. To identify the key amino acid involved in the interaction of PR8 NP with MAVS, we first constructed four truncations of NP. Domain mapping experiments suggested that amino acids 181–370 of NP are critical for the interaction with MAVS (Figure S4B). Within this region, only three amino acids differ between PR8 and SZ19 (namely Y313F, K351R, and K357Q). As shown in , the Y313F mutation of PR8 NP abolished the NP-mediated degradation of MAVS. Consistent with this finding, the Y313F mutation restored the NP-induced decrease in MAVS and TOMM20 expression levels within the mitochondria and the recruitment of TOLLIP onto the mitochondria (Figure S4C). As a result, the Y313F mutation of PR8 NP blocked the NP-induced inhibition of the induction of IFNB triggered by SeV or RIGI-N (Figure S4D).
Figure 6. Tyrosine at position 313 of NP is the key residue for NP-mediated mitophagy. (A) HEK293T cells were transfected with HA-MAVS along with PR8-NP or SZ19-NP for 24 h before WB. (B) HEK293T cells were transfected with PR8-NP and its mutants for 24 h before WB. (C) HEK293T cells were infected with rPR8 or rPR8-NPY313F virus for 24 h before WB. (D) U2OS cells expressing mito-keima were infected with rPR8 or rPR8-NPY313F virus at an MOI of 1.0. Twenty hours later, the cells were imaged with 458 nm and 561 nm laser excitation for mito-keima. BF indicates the bright field images. Scale bar: 20 μm. The right panel shows the quantification of the relative ratio of fluorescence intensity (561 nm: 458 nm) of the cells. (E) U2OS cells were infected with rPR8 or rPR8-NPY313F virus at an MOI of 1.0, and subsequently stained with MitoTracker. After being fixed with 4% paraformaldehyde, the cells were stained with anti-NP and anti-LC3 before confocal microscopy. Scale bar: 20 μm. The right panel shows the quantification of Pearson’s colocalization coefficient between MitoTracker and LC3. (F) U2OS cells were infected with rPR8 or rPR8-NPY313F virus at an MOI of 1.0, and subsequently stained with MitoTracker. After being fixed with 4% paraformaldehyde, the cells were stained with anti-NP and anti-LAMP1 before confocal microscopy. Scale bar: 20 μm. The right panel shows the quantification of Pearson’s colocalization coefficient between MitoTracker and LAMP1. Results are representative of three independent experiments.
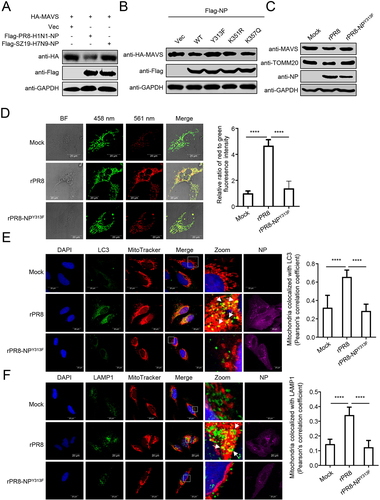
To determine the significance of NPY313F to the PR8 virus, we rescued a rPR8-NPY313F mutant virus. The expression of MAVS and TOMM20 was reduced in cells infected with rPR8 virus, whereas the reduced expression of MAVS and TOMM20 was largely restored in cells infected with the rPR8-NPY313F virus (). The mito-keima assay showed that rPR8 virus induced clear mitophagy, whereas the rPR8-NPY313F virus induced limited mitophagy (). Confocal microscopy analysis revealed that rPR8 virus increased the colocalization of mitochondria with endogenous LC3 and LAMP1, which was less prevalent in cells infected with rPR8-NPY313F virus (). Transmission electron microscopy verified that rPR8 virus, but not rPR8-NPY313F virus, induced mitophagy in cells (Figure S4E). The replication kinetics of the rPR8 and rPR8-NPY313F mutant viruses revealed that the NPY313F mutation led to significant reductions of virus replication from 12 to 72 hpi, compared to that of the wild-type virus (Figure S4F).
These data suggest that the NPY313F mutation attenuates the NP-mediated mitophagy.
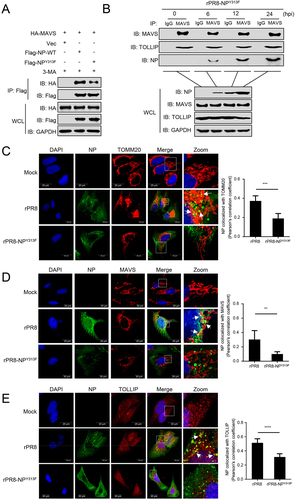
The mutation Y313F in NP weakens the MAVS-NP interaction
To determine how NPY313F mutation affects NP-induced mitophagy, we analyzed the interaction between MAVS and NP. Co-IP experiments indicated that the NPY313F mutation clearly impaired the interaction between NP and MAVS (). The MAVS-TOLLIP interaction was increased following rPR8 infection (), but not elevated following infection with the rPR8-NPY313F virus (). Next, we used confocal microscopy analysis to confirm the interaction of NP with TOMM20, MAVS, and TOLLIP in cells infected with different viruses. As shown in , the NPY313F mutation significantly reduced the colocalization of NP with TOMM20, MAVS, or TOLLIP. These results demonstrate that the NPY313F mutation attenuates the NP-MAVS interaction and subsequent recruitment of TOLLIP.
Figure 7. Tyrosine at position 313 of NP is the key residue for the interaction of MAVS with NP. (A) HEK293T cells were transfected with PR8-NP or PR8-NPY313F before co-IP with anti-Flag antibody. (B) A549 cells were infected with rPR8-NPY313F virus for the indicated times before co-IP with anti-MAVS antibody. (C) U2OS cells were infected with rPR8 or rPR8-NPY313F virus, respectively. Twenty hours later, the cells were fixed and stained with anti-NP and anti-TOMM20 before confocal microscopy. Scale bar: 20 μm. The right panel shows the quantification of Pearson’s colocalization coefficient between NP and TOMM20. (D) U2OS cells were infected with rPR8 or rPR8-NPY313F virus, respectively. Twenty hours later, the cells were fixed and stained with anti-NP and anti-MAVS before confocal microscopy. Scale bar: 20 μm. The right panel shows the quantification of Pearson’s colocalization coefficient between NP and MAVS. (E) U2OS cells were infected with rPR8 or rPR8-NPY313F virus, respectively. Twenty hours later, the cells were fixed and stained with anti-NP and anti-TOLLIP before confocal microscopy. Scale bar: 20 μm. The right panel shows the quantification of Pearson’s colocalization coefficient between NP and TOLLIP. Results are representative of three independent experiments.
The residue at 313 of NP is thought to contribute to the adaptation of H7N9 avian influenza virus in mammalian hosts [Citation30]. To assess the conservation of 313Y in various IAVs, we aligned the NP sequences of IAVs isolated from different species. We found that 313Y in NP has more than 61% identity in human-origin viruses; however, more than 92% or 61% of NP from chicken or swine-origin IAVs, respectively, have phenylalanine (F) at position 313 (Figure S5A). Furthermore, among six selected NP proteins of IAVs from different subtypes and species (Table S2), NP proteins with 313Y induced mitophagy, whereas the NP proteins with 313 F induced limited mitophagy (Figure S5B). Consistently, the NP proteins with 313Y decreased the expression of MAVS and TOMM20, whereas the NP proteins with 313 F did not (Figure S5C). Together, our results indicate that the amino acid at position 313 in NP of IAVs plays a vital role in NP-mediated mitophagy.
The mutation Y313F in NP impairs viral replication and pathogenicity
To determine the significance of NPY313F to the virulence of PR8, we evaluated the replication of the rPR8 and rPR8-NPY313F mutant viruses in vivo. We first determined the MLD50 (50% mouse lethal dose) of the mutant virus. Groups of five 6-week-old female BALB/c mice were intranasally inoculated with serially diluted rPR8 or rPR8-NPY313F, and body weight, disease signs, and death were monitored daily for 14 days. The wild-type virus caused severe disease and killed the mice at an MLD50 of 102.5 EID50 (). Following inoculation with 104, 105, or 106 EID50 of rPR8 virus, all of the mice died within 7 days. Mice inoculated with rPR8-NPY313F lost much less body weight than those inoculated with the same dose of the wild-type virus, but the mice inoculated with 104, 105, or 106 EID50 of the mutant virus all died between 7 dpi and 10 dpi. As a result, the MLD50 of the mutant virus (103.38 EID50) was not dramatically reduced compared with that of the wild-type virus. Consistent with these data, the pathological findings indicated that rPR8 virus infection recruited many lymphocytes and neutrophils to the lung and induced a strong inflammatory response. In contrast, rPR8-NPY313F virus infection led to moderate tissue lesions at 3 dpi, but the mice exhibited more severe lung lesions at 5 dpi than 3 dpi ().
Figure 8. Replication and pathogenicity of rPR8 and rPR8-NPY313F viruses in vitro and in vivo. (A) Six-week-old female BALB/c mice were intranasally infected with 10-fold serial dilutions containing 101 to 106 EID50 of rPR8 or rPR8-NPY313F virus. Changes in body weight were monitored for 14 days after the viral challenge. (B) BALB/c mice were intranasally infected with 10-fold serial dilutions containing 101 to 106 EID50 of rPR8 or rPR8-NPY313F virus. The MLD50 was calculated by using the method of Reed and Muench. (C) Evaluation of histopathological changes in the lungs of infected and uninfected mice by means of HE staining on day 3 or 5 post-inoculation. Scale bar: 200 μm. (D) BALB/c mice intranasally infected with rPR8 (106 EID50) or rPR8-NPY313F (106 EID50) were euthanized on day 3 post-inoculation, and the nasal turbinates and lungs were collected for viral titration in chicken eggs. (E) BALB/c mice intranasally infected with rPR8-NPY313F (106 EID50) were euthanized on days 1, 3, and 5 post-inoculation, and the lung tissue was collected for viral RNA isolation and sequencing. Each bar represents the amino acid at position 313 of the NP protein from an individual animal. Results are representative of three independent experiments.
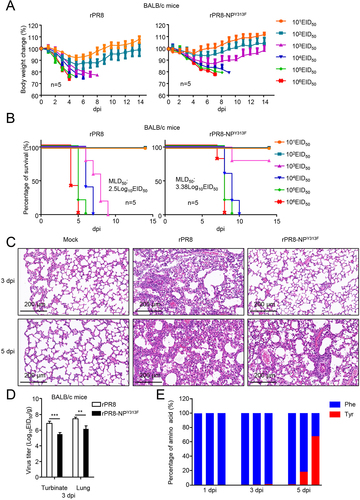
To assess the replication and virulence of rPR8 and rPR8-NPY313F in mice, 6-week-old female BALB/c mice were inoculated with the rPR8 or rPR8-NPY313F virus. The mice were killed on day 3 post-infection, and the viral loads in their organs were determined by using the EID50 assay. The titers of the rPR8 virus in the nasal turbinate and lungs of the mice were significantly higher than those in the tissues of the mice that were inoculated with the rPR8-NPY313F mutant virus ().
Based on the data above, we suspected that the rPR8-NPY313F mutant virus might generate a reverse mutation (From F to Y) during replication in mice. Using next-generation sequencing, we analyzed the amino acid distribution of NP-313 in the lungs of rPR8-NPY313F -infected mice at different times post-infection. We found that about 1% of the NP gene mutated from TTC (F) back to TAC (Y) in one of the three mice at day 3 post-infection (). At day 5 post-infection, 18.3% and 67.9% of the NP gene mutated from TTC (F) back to TAC (Y) in two of other three mice. These data indicate that the rPR8-NPY313F mutant virus could easily obtain the F313Y reverse mutation while replicating in mice, and become high pathogenic for mice, which might explain why the mice inoculated with rPR8-NPY313F virus showed moderate tissue lesions in the early stage of infection, but all died by day 7 post-infection.
Together, these results demonstrate that the NPY313F mutation significantly attenuates the replication of PR8 virus in vivo.
Discussion
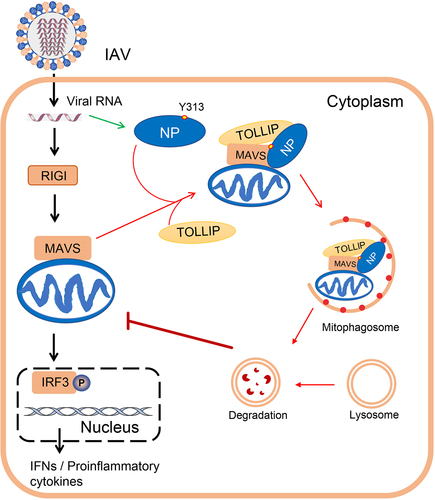
The findings of this study lead us to propose a model in which the NP protein of PR8 virus interacts with MAVS and TOLLIP to induce mitophagy, leading to a blockade of MAVS-mediated antiviral signaling and the promotion of virus replication (). Moreover, the NPY313F mutation attenuates NP-mediated mitophagy and the subsequent degradation of MAVS, which further elevates the production of IFNB, resulting in inhibited replication of virus in vitro and in vivo. Our findings demonstrate that NP-induced mitophagy during IAV infection is a novel regulatory mechanism by which IAV evades the host antiviral immune response and facilitates virus replication.
Figure 9. A model of NP-induced mitophagy. The black arrows indicate RIGI-MAVS-mediated type I IFN signaling pathway; the green arrow indicates the expression of NP protein; and the red arrows indicate the process of NP-mediated mitophagy.
Mitochondria fulfill multiple cellular functions, such as energy production, maintenance of calcium homeostasis, reactive oxygen species generation, and apoptosis initiation. In addition, mitochondria also actively participate in innate immunity via the innate immune signaling receptor MAVS located at the mitochondrial outer membrane [Citation31]. Mitophagy serves as a mechanism to selectively remove damaged mitochondria [Citation1]. Growing evidence suggests that some viruses promote their replication and propagation in host cells by hijacking mitophagy. For example, Newcastle disease virus induces mitophagy to hijack the host’s metabolic resources for replication in infected cells [Citation3]. The matrix protein of HPIV3 translocates to the mitochondria and induces mitophagy through an interaction with the TUFM (Tu translation elongation factor, mitochondrial) and the autophagy protein LC3 [Citation5]. Similarly, the ORF10 of SARS-CoV-2 has been shown to inhibit the innate immune response and facilitate viral replication by inducing mitophagy through interactions with mitophagy receptor BNIP3L/NIX (BCL2 interacting protein 3 like) and LC3B [Citation4]. Several studies have focused on the relationship between mitophagy and IAVs [Citation7,Citation32]. The NS1 protein of IAV, which is essential for evading interferon-mediated antiviral responses, has been reported to play an important role in triggering mitochondrial fission and subsequent mitophagy [Citation32]. One study revealed that the PB1-F2 protein of IAV can translocate into the mitochondrial inner membrane space via Tom40 channels to impair cellular innate immunity [Citation33]. Wang et al. demonstrated that PB1-F2 can also induce complete mitophagy, which requires the interactions of PB1-F2 with both TUFM and LC3B, and subsequently leads to MAVS degradation and suppression of type I IFN production [Citation7]. In the present study, we found that the NP protein of IAV locates on mitochondria through an interaction with MAVS, where it promotes the fusion of mitochondria and autophagosomes and ultimately leads to mitophagy. However, we cannot exclude the possibility that other proteins on mitochondria also facilitate the recruitment of NP to mitochondria, because NP is still able to locate at mitochondria in MAVS-deficient cells (). Additional functional roles of mitochondria-anchored NP remain to be investigated.
TOLLIP is a ubiquitous intracellular adaptor protein that plays a key role in mediating intracellular inflammatory responses, promoting autophagy, and enabling vacuole transport within the cell [Citation34]. TOLLIP can act as a cargo adaptor linking LC3A-coated autophagosomes to ubiquitin-modified protein aggregates, and plays a critical role in autophagic clearance of cytotoxic protein aggregates [Citation18]. Ryan et al. reported that TOLLIP regulates endosomal trafficking for the sorting of damaged mitochondrial-derived cargo to the lysosomes during the mitochondrial stress response [Citation19]. In our study, we showed, for the first time, that TOLLIP participates in the NP-mediated mitophagy by acting as a mitophagy receptor. Following IAV infection, TOLLIP is recruited onto mitochondria by directly interacting with NP and MAVS, and hence bridges the interaction of NP-MAVS with LC3B, thereby recruiting mitochondria to the autophagosome, resulting in the induction of mitophagy. As a consequence, TOLLIP knockout blocks the NP-mediated mitophagy and the degradation of mitochondria-located proteins.
NP is a key component of the vRNP complex, associating with the polymerase subunits PB1 and PB2 to mediate the nuclear import and export of the complex during the virus life cycle [Citation9]. In the last decade, more functions of NP have come to light. For example, IAV NP has been shown to directly interact with and suppress the expression of apoptosis inhibitor protein API5, thus facilitating E2F1-dependent apoptosis and hence maintenance of viral replication [Citation35]. Sharma et al. found that IAV NP interacts with host FLNA (filamin A) to disrupt the FLNA-TRAF2 interaction and activate the MAPK/JNK stress-signaling pathway for efficient viral replication [Citation36]. Our group reported that H7N9 NP positively regulates type I interferon signaling via stabilized TRAF3 expression [Citation29]. In the present study, our data indicate that the NP protein induces mitophagy to facilitate virus replication, through an interaction with MAVS, and subsequently TOLLIP to recruit LC3-coated autophagosomes. Of note, the Y313F mutation attenuated the NP-MAVS interaction. One study showed that tyrosine-313 of NP is related to Mx sensitivity and is required for adaptation in mammals [Citation37]. With the exception of the Mx-related mechanism, the present study is the first to suggest a role for Y313 in the NP protein outside of the functions of NP in the replication and pathogenicity of influenza A virus. The NPY313F mutation abolished NP-mediated mitophagy and significantly attenuated virus replication in vitro and in vivo. Further, the distributions of amino acids at position 313 of NP showed apparent species specificity, suggesting that NP-313 might be involved in virus-host co-evolution, which warrants further investigation. Interestingly, we found that during the replication of the Y313F mutant viruses in mice, the rPR8-NPY313F virus could easily obtain the F313Y back-mutation and become highly lethal. Enhanced Mx resistance and the ability to induce mitophagy might be intrinsic driving forces to acquire the F313Y mutation during replication in mice. To further distinguish the relationship between the Mx-related and the mitophagy-related mechanism, one of these pathways should be excluded through genome editing techniques or specific inhibitors in future studies.
In conclusion, our results uncover a novel role for IAV NP as an inducer of mitophagy and reveal that TOLLIP acts as a receptor to mediate mitophagy during IAV infection. We discovered that the tyrosine-313 residue of NP is important for the NP-MAVS interaction, and thus affects NP-mediated mitophagy. These findings strengthen our understanding of mitophagy induction during IAV infection and uncover a potential target for the development of novel antiviral therapeutic strategies.
Materials and methods
Ethical statements
This study was performed in strict accordance with the recommendations in the Guide for the Care and Use of Laboratory Animals of the Ministry of Science and Technology of the People’s Republic of China. Studies with influenza viruses were conducted in a biosafety level 2 laboratory approved for such use by Lanzhou Veterinary Research Institute, Chinese Academy of Agricultural Sciences. The protocols for animal studies were approved by the Animal Ethics Committee of Lanzhou Veterinary Research Institute, Chinese Academy of Agricultural Sciences (SYXK-2020-0010).
Cells, viruses, and plasmids
MDCK, HEK293T, and U2OS cells (American Type Culture Collection, CCL-34, CRL-3216, and HTB-96) were grown in DMEM (Gibco, C11995500BT) supplemented with 10% (vol:vol) FBS (Gibco, 10,270–106) and penicillin-streptomycin (Gibco, 15,140,163). A549 cells (American Type Culture Collection, CCL-185) were grown in Kaighn’s modified Ham F-12 nutrient mixture medium (Gibco, C11330500BT) supplemented with 10% FBS and penicillin-streptomycin. All cells were cultured and maintained at 37°C with 5% CO2.
For TOLLIP−/−, ATG7−/−, and ATG12−/− cells, target sequences (TOLLIP-targeting sgRNA sequence, TGGGCGTTCACGGCGGCCGGGGG; ATG7-targeting sgRNA sequence, AGAAGAAGCTGAACGAGTAT; ATG12-targeting sgRNA sequence, CCTCCAGCAGCAATTGAAGT) were cloned into pX459 (Addgene, 62,988; deposited by Dr. Feng Zhang) digested with BpiI. Transfected HEK293T and A549 cells were purified by puromycin selection. MAVS−/− cells, NBR1−/−, and CALCOCO2−/− cells have been described previously [Citation24].
The influenza A virus A/Puerto Rico/8/1934 (PR8, H1N1) was stored in our laboratory and inoculated into 10-day-old SPF (specific-pathogen-free) chicken embryos for virus propagation. SeV was kindly provided by Hongkui Deng (Peking University, China). HSV-1 was kindly provided by Bo Zhong (Wuhan University, China). Virus stocks were propagated in SPF chicken eggs and stored at −70°C until use.
Plasmids for HA-, Flag-, and MYC-tagged PB1, RIGI, RIGI-N, MAVS, and STING1/MITA, and use of the IFNB/IFN-β-Luc and pRL-TK internal control luciferase reporter plasmids used in the study, were described previously [Citation38,Citation39]. Plasmids for Flag, MYC or HA-tagged NBR1, OPTN, SQSTM1, CALCOCO2, TOLLIP, ACTB/β-actin and GAPDH were kindly provided by Dr. Yu Zhang (Huazhong University of Science and Technology, China). Flag-tagged PR8-PB1, GFP, ATG7, ATG12, NP from different viruses, NP truncations, and NP mutants (Y313F, K351R, K357Q, or S482N) were constructed and cloned into pRK (provided by Prof. Hong-Bing Shu from Wuhan University, China) by using standard molecular biology techniques.
His-tagged MAVS and TOLLIP were constructed and cloned into the pET-28a (Sigma-Aldrich, 69,864) prokaryotic expression vector, and GST-tagged NP and TOLLIP were constructed and cloned into the pGEX-4 T-1 (GE Healthcare Technology, 27–4580-01) prokaryotic expression vector by using standard molecular biology techniques.
Reagents and antibodies
The antibodies used in this study were as follows: HRP-conjugated anti-HA (12,013,819,001), anti-MYC (11,814,150,001), and anti-GFP (11,814,460,001) antibodies (Roche); MAVS (24930S), TBK1 (3013S), IRF3 (4302S), phosphorylated TBK1(5483), IRF3 (4961) antibodies (Cell Signaling Technology); GST-Tag (M20007L) and HRP-conjugated goat anti-mouse secondary antibody (M21001L) (Abmart); PB1 antibody (Genetex); COX4/COXIV (60,251–1), TIMM23 (67,535–1) antibodies (Proteintech); MAVS antibody (BETHYL, A300-782A); His (TA-02), ATG12 (100,672-T34) and HRP-conjugated goat anti-rabbit IgG (ZB-2301) (Zsbio); GAPDH (ab181602), ACTB (ab8226), TUBA/alpha-tubulin (ab7291), TOLLIP (ab187198) and TOMM20 (ab186735) antibodies (Abcam); LC3 (PM036) and ATG7 (PM039) antibodies (MBL); Alexa Fluor 488-conjugated anti-mouse IgG (A0428), Cy3-labeled goat anti-rabbit IgG (A0516), Alexa Fluor 647-conjugated goat anti-mouse IgG (A0473) secondary antibodies (Beyotime Biotechnology); NP (11,675-MM03T) antibodies (Sino Biological); and HRP-conjugated anti-Flag (A8592) antibodies (Sigma-Aldrich).
The reagents used in the study were: poly(I:C) (InvivoGen, tlrl-picwlv); 3-MA (M9281), MG132 (M7449), DMSO (D2650), CQ (PHR1258), NH4Cl (09718), carbonyl cyanide 3-chlorophenyl hydrazone (CCCP; C2759), anti-Flag agarose affinity beads (A2220) and protein A/G agarose affinity beads (P6486/E3403) (Sigma-Aldrich); Mdivi-1 (Enzo life Sciences, BML-CM127); CHX (Abcam, ab120093); human IFNB DuoSet ELISA kit (R&D, DY814-05); glutathione Sepharose 4B (GE Healthcare Technology, 17–0756-05); BafA1 (Selleck, S1314); and ZVAD (C1202), NP-40 (ST366), DAPI (C1002), MitoTracker Red CMXRos (C1049B) (Beyotime Biotechnology). Lipofectamine 2000 (11,668,019), RNAi MAX (13,778,030), and TRIzol (15,596,026) were obtained from Invitrogen). SYBR Green I Master Mix (4,673,492,001) was purchased from Roche.
Virus infection and titration
All cells were seeded at the desired density in culture plates per the requirements for different experiments. Viruses were inoculated into cells at a specific multiplicity of infection (MOI) for various experiments. One hour after inoculation, the medium was replaced with fresh OPTI-MEM (Gibco, 31,985,070) and the cells were incubated at 37°C. Viral titers of virus stocks, collected tissues and cell culture supernatants were determined by end-point titration in eggs. For end-point viral titration in eggs, 10-fold serial dilutions of each sample were inoculated into 9-day-old SPF eggs. Sixty hours after inoculation, fluid from the allantoic cavity was collected and tested for its ability to agglutinate chicken erythrocytes as an indicator of viral replication. Infectious virus titers are reported as log10 EID50/mL, and were calculated from three replicates by using the method of Reed-Muench [Citation40].
Western blotting
Cells were lysed in RIPA buffer (Beyotime Biotechnology, P0013B). Proteins were separated by 10% SDS-PAGE and transferred to a nitrocellulose membrane (Pall, 66,485). The membrane was blocked for 1 h in TBST (Solarbio, T1085) containing 5% milk and subsequently incubated with primary antibodies overnight at 4°C. After a 1-h incubation with HRP-conjugated secondary antibody, the immunoreactive bands were visualized by using an ECL system (Millipore, WBKLS0500). The intensities of the target bands were quantified by using the ImageJ program (NIH, USA).
Dual-luciferase reporter assays
To detect activation of the IFN1@/IFN-I pathway, HEK293T cells grown in 24-well plates were co-transfected with Luciferase reporter plasmids (IFNB-Luc or ISRE-Luc) and the pRL-TK plasmid, along with the indicated amount of empty vector or plasmids expressing NP or other molecules. At 24 h post-transfection, the cells were stimulated by SeV, PR8, RIGI-N, or poly(I:C) for an additional 12 h. Cell lysates were prepared and analyzed for firefly and Renilla luciferase activities by using the dual luciferase assay kit (Promega, E2980).
RNA isolation and quantitative PCR
Total RNA from cells was extracted with TRIzol following the manufacturer’s instructions. For mRNAs, total RNA was transcribed into cDNA using M-MLV Reverse Transcriptase, according to the manufacturer’s protocol (Promega, M1701). GAPDH was used as an invariant control for mRNAs. Real-time PCR was carried out using the ABI 7500 detection System (Applied Biosystems, USA). The RNA level of each gene is shown as the fold of induction (2−ΔΔCT) in the graphs. The sequences of the gene-specific primers used for qPCR are provided in Table S1.
GST affinity-isolation assay
GST affinity-isolation assays were conducted as previously described with slight modifications [Citation41]. Briefly, the encoded GST- or His-tagged fusion proteins and the control GST proteins were expressed in BL21 cells after induction with 0.1 mmol/L IPTG (Solarbio, I8070) overnight at 18°C. Centrifuged cells were resuspended in lysis buffer (1 × PBS [Solarbio, P1020], 0.2 mM PMSF [Beyotime Biotechnology, ST505], 1% Triton X-100 [Sigma-Aldrich, V900502]) and sonicated for 15 min. After centrifugation, the supernatant was applied to a Glutathione-Sepharose 4B bead column (GE Healthcare Technology, 17–0756-05) or ProteinIso Ni-NTA Resin (TransGen Biotech, DP101-01), in accordance with the manufacturers’ instructions. Purified GST- or His-tagged fusion proteins were diluted with 1× PBS and filtered through Amicon Ultra 0.5-ml filters (Millipore, UFC5010). Then, 1 μg of purified GST protein or GST fusion protein was captured by the glutathione-Sepharose 4B beads, and His-tagged fusion protein was added for incubation overnight at 4°C. The beads were then washed three times with ice-cold PBS. The supernatant was loaded onto gels and analyzed by immunoblotting.
Co-immunoprecipitation
HEK293T or A549 cells were co-transfected with the indicated plasmids with or without virus infection for 24 h. The transfected cells were then harvested and lysed in NP-40 lysis buffer (20 mM Tris-HCl, pH 7.5, 150 mM NaCl, 1% NP-40, 1 mM EDTA with protease inhibitor cocktails [Roche, 4,693,116,001]). For each immunoprecipitation, 1 mL of lysate was incubated for 4 h at 4°C with 0.5 μg of the indicated antibody or control IgG and 30 μL of protein A/G-Sepharose (Abcam, ab193262). The beads were washed three times with 1 mL of lysis buffer containing 500 mM NaCl. The precipitates were analyzed by using standard immunoblotting procedures.
Electron microscopy
Electron microscopy was performed as described elsewhere [Citation42]. Briefly, cell samples were washed three times with 1× PBS, trypsinized, and collected by centrifugation at 1,000 × g for 5 min. The cell pellets were fixed in 2.5% (v:v) glutaraldehyde, 2% (v:v) paraformaldehyde in 0.1 M cacodylate (pH 7.2) buffer for 2 h at room temperature, washed in cacodylate, post-fixed with 2% (w:v) osmium tetroxide supplemented with 1.5% (w:v) potassium ferrocyanide (45 min, 4°C), washed in water, dehydrated in ethanol (increasing concentrations from 30% to 100%), and embedded in Epon (Sigma-Aldrich, 45,345) as previously described [Citation43]. Ultrathin sections of cell monolayers were prepared with a Reichert UltracutS ultramicrotome (Leica Microsystems, Germany) and contrasted with uranyl acetate and lead citrate. Images of thin sections were observed under a transmission electron microscope (Hitachi, HT7700, Japan).
Mito-keima assay
Mito-keima assays were conducted as previously described with slight modifications [Citation22]. Briefly, U2OS cells were infected with a lentivirus harboring the mito-keima vector (a gift from Zhiyin Song, Wuhan University), and grown for several days. Next, cells were cultured in glass-bottom dishes, and subsequently transfected with plasmids or infected with viruses. At the indicated times post-treatment, the cells were scanned and images were collected using a Leica SP8 confocal microscopy (× 100 oil objective NA 1.40) with an argon laser (448 nm, mito-keima at neutral pH and 561 nm, mito-keima at acidic pH). Ratiometric (552 nm:448 nm) analysis was performed using ImageJ software.
Confocal microscopy
Confocal microscopy was performed as previously described [Citation41]. Cells were seeded in 12-well plates on coverslips, and transfected or infected for 24 h before staining with or without MitoTracker (Beyotime Biotechnology, C1049B). Cells were then fixed with 4% paraformaldehyde for 20 min at room temperature, and washed three times with PBS. Cells were permeabilized with 0.1% Triton X-100 in PBS for 10 min and blocked with 5% skimmed milk for 1 h. Then, the cells were incubated with the indicated primary and secondary antibodies and DAPI. The stained cells were observed with a Leica SP8 confocal microscopy (× 100 oil objective NA 1.40). At least 20 cells (from 4–10 confocal images) were randomly selected for quantification in each experiment. The fluorescence intensity was quantified and the colocalization analysis was conducted with ImageJ software. The data were further analyzed by using GraphPad Prism 6.
Subcellular fractionation
Pure mitochondrial fractionation was achieved by utilizing the Cell Mitochondria Isolation Kit (Beyotime Biotechnology, C3601) according to the manufacturer’s instructions. Briefly, transfected or infected cells were washed with ice-cold PBS twice and then detached with a cell scraper. Subsequently, the cell pellets were collected after centrifugation and resuspended in 800 μL of Isotonic Mitochondrial Buffer with protease inhibitor cocktail at 1:100 dilutions. Cells were homogenized with a 1 mL Dounce homogenizer via 40 strokes on ice and were centrifuged at 600 × g for 10 min. The supernatants were recentrifuged at 11,000 × g for 20 min. All centrifugation was performed at 4°C. The mitochondrial fraction of the pellets was resuspended. The supernatants were considered as the cytosolic fraction. Equivalent amounts of proteins from each fraction were analyzed by western blotting using the indicated antibodies.
Generation of recombinant viruses
The eight gene segments of PR8-H1N1 and NPY313F were inserted into the vRNA-mRNA bidirectional transcription vector pBD (from Prof. Hualan Chen, Harbin Veterinary Research Institute, Chinese Academy of Agricultural Sciences) by using a CloneExpress II One Step Cloning Kit (Vazyme, C112-02). Rescue of influenza viruses was achieved by following previously described protocols [Citation44]. The rescued viruses were identified by use of a hemagglutination assay and were fully sequenced to ensure the absence of unwanted mutations. The rescued viruses were designated rPR8 and rPR8-NPY313F.
NP sequence analysis
To determine the distributions of amino acids at position 313 of NP in influenza A virus derived from different species, a total of 55,445 NP amino acid sequences were downloaded from the Global Initiative on Sharing All Influenza Data (GISAID) (https://www.gisaid.org/) database and the Influenza Virus Database of GenBank (https://www.ncbi.nlm.nih.gov/genomes/FLU/Database/nph-select.cgi?go_database). The amino acid sequences of each NP were aligned using MAFFT [Citation45]. Base compositional data of the amino acid at position 313 were then graphically plotted using the R language and modified in Adobe Illustrator.
Mouse study
To determine MLD50 values, groups of five 6-week-old female BALB/c mice were lightly anesthetized with CO2 and inoculated intranasally with 10-fold serial dilutions containing 101–106 EID50 of rPR8 or rPR8-NPY313F virus in a 50-µL volume. The mice were monitored for 14 days for weight loss and mortality. To assess virus replication, groups of three 6-week-old female BALB/c mice were lightly anesthetized with CO2 and inoculated intranasally with 106 EID50 of rPR8 or rPR8-NPY313F virus in a 50-µL volume, and were then euthanized on day 3 p.i.; their nasal turbinates and lungs were collected and titrated for virus infectivity in eggs or for pathological assessments.
Next-generation sequencing analysis
Viral RNA was extracted from lung homogenates and reverse-transcribed into cDNA by use of Uni12 primer (5’-AGCRAAAGCAGG-3’). A portion of the NP gene around position 313 was amplified with the specific primers shown in Table S1. Next-generation sequencing was conducted and analyzed by Tsingke (Tsingke Biotechnology Co., Ltd.).
Statistical analysis
Data are expressed as the mean ± SD (standard deviation). Statistical significance was determined by using Student’s two-tailed non-parametric t test or ANOVA (analysis of variance) with GraphPad Prism software (version 6.0, USA). Differences between groups were considered significant when the P value was <0.05 (*), <0.01 (**), <0.001 (***), and <0.0001 (****).
Supplemental Material
Download Zip (6.3 MB)Acknowledgments
We thank Susan Watson for editing the manuscript and Prof. Hualan Chen for her critical suggestions at Harbin Veterinary Research Institute, CAAS (Harbin, China). We appreciate gifts of innate immune molecule-related plasmids from Prof. Hong-Bing Shu, HSV-1 from Prof. Bo Zhong, and mito-keima expressing plasmid from Prof. Zhiyin Song at Wuhan University (Wuhan, China); autophagy-related plasmids and cells from Prof. Chan Ding at Shanghai Veterinary Research Institute, CAAS (Shanghai, China); Dr. Yu Zhang at Huazhong University of Science and Technology (Wuhan, China); SeV from Prof. Hongkui Deng at Peking University (Beijing, China); and the MAVS-deficient cell line from Prof. Xin Cao at Jilin Agricultural University (Changchun, China). We thank the staff at the Instrument Center, Lanzhou Veterinary Research Institute, Chinese Academy of Agricultural Sciences.
Disclosure statement
No potential conflict of interest was reported by the authors.
Supplementary material
Supplemental data for this article can be accessed online at https://doi.org/10.1080/15548627.2022.2162798
Additional information
Funding
References
- Xu Y, Shen J, Ran Z. Emerging views of mitophagy in immunity and autoimmune diseases. Autophagy. 2020 Jan;16(1):3–17.
- Johansen T, Lamark T. Selective autophagy mediated by autophagic adapter proteins. Autophagy. 2011 Mar;7(3):279–296.
- Gong Y, Tang N, Liu P, et al. Newcastle disease virus degrades SIRT3 via PINK1-PRKN-dependent mitophagy to reprogram energy metabolism in infected cells. Autophagy. 2021;31:1–19.
- Li X, Hou P, Ma W, et al. SARS-CoV-2 ORF10 suppresses the antiviral innate immune response by degrading MAVS through mitophagy. Cell Mol Immunol. 2022 Jan;19(1):67–78.
- Ding B, Zhang L, Li Z, et al. The matrix protein of human parainfluenza virus type 3 induces mitophagy that suppresses interferon responses. Cell Host Microbe. 2017 Apr 12;21(4):538–547 e4.
- Xia M, Gonzalez P, Li C, et al. Mitophagy enhances oncolytic measles virus replication by mitigating DDX58/RIG-I-like receptor signaling. J Virol. 2014 May;88(9):5152–5164.
- Wang R, Zhu Y, Ren C, et al. Influenza A virus protein PB1-F2 impairs innate immunity by inducing mitophagy. Autophagy. 2021 Feb;17(2):496–511.
- Taubenberger JK, Kash JC. Influenza virus evolution, host adaptation, and pandemic formation. Cell Host Microbe. 2010 Jun 25;7(6):440–451.
- Eisfeld AJ, Neumann G, Kawaoka Y. At the centre: influenza A virus ribonucleoproteins. Nat Rev Microbiol. 2015 Jan;13(1):28–41.
- Lakdawala SS, Wu Y, Wawrzusin P, et al. Influenza a virus assembly intermediates fuse in the cytoplasm. Plos Pathog. 2014 Mar;10(3):e1003971.
- Zhou A, Zhang W, Dong X, et al. The battle for autophagy between host and influenza A virus. Virulence. 2022 Dec;13(1):46–59.
- Ye Q, Krug RM, Tao YJ. The mechanism by which influenza A virus nucleoprotein forms oligomers and binds RNA. Nature. 2006 Dec 21;444(7122):1078–1082.
- Tang YS, Xu S, Chen YW, et al. Crystal structures of influenza nucleoprotein complexed with nucleic acid provide insights into the mechanism of RNA interaction. Nucleic Acids Res. 2021 Apr 19;49(7):4144–4154.
- Wang R, Zhu Y, Zhao J, et al. Autophagy promotes replication of influenza A virus in vitro. J Virol. 2019 Feb 15;93(4):e01984–18.
- Li X, Goobie GC, Gregory AD, et al. Toll-interacting protein in pulmonary diseases. abiding by the goldilocks principle. Am J Respir Cell Mol Biol. 2021 May;64(5):536–546.
- Burns K, Clatworthy J, Martin L, et al. Tollip, a new component of the IL-1RI pathway, links IRAK to the IL-1 receptor. Nat Cell Biol. 2000 Jun;2(6):346–351.
- Kowalski EJA, Li L. Toll-interacting protein in resolving and non-resolving inflammation. Front Immunol. 2017;8:511.
- Lu K, Psakhye I, Jentsch S. Autophagic clearance of polyQ proteins mediated by ubiquitin-Atg8 adaptors of the conserved CUET protein family. Cell. 2014 Jul 31;158(3):549–563.
- Ryan TA, Phillips EO, Collier CL, et al. Tollip coordinates Parkin-dependent trafficking of mitochondrial-derived vesicles. EMBO J. 2020 Jun 2;39(11):e102539.
- Lupfer C, Thomas PG, Anand PK, et al. Receptor interacting protein kinase 2-mediated mitophagy regulates inflammasome activation during virus infection. Nat Immunol. 2013 May;14(5):480–488.
- Sun N, Malide D, Liu J, et al. A fluorescence-based imaging method to measure in vitro and in vivo mitophagy using mt-Keima. Nat Protoc. 2017 Aug;12(8):1576–1587.
- Jian F, Chen D, Chen L, et al. Sam50 regulates PINK1-parkin-mediated mitophagy by controlling PINK1 stability and mitochondrial morphology. Cell Rep. 2018 Jun 5;23(10):2989–3005.
- Seth RB, Sun L, Ea CK, et al. Identification and characterization of MAVS, a mitochondrial antiviral signaling protein that activates NF-kappaB and IRF 3. Cell. 2005 Sep 9;122(5):669–682.
- Zeng Y, Xu S, Wei Y, et al. The PB1 protein of influenza A virus inhibits the innate immune response by targeting MAVS for NBR1-mediated selective autophagic degradation. PLoS Pathog. 2021 Feb;17(2):e1009300.
- Mizushima N, Yoshimori T, Ohsumi Y. The role of Atg proteins in autophagosome formation. Annu Rev Cell Dev Biol. 2011;27(1):107–132.
- Zhang Y, Yao Y, Qiu X, et al. Listeria hijacks host mitophagy through a novel mitophagy receptor to evade killing. Nat Immunol. 2019 Apr;20(4):433–446.
- Xu LG, Wang YY, Han KJ, et al. VISA is an adapter protein required for virus-triggered IFN-beta signaling. Mol Cell. 2005 Sep 16;19(6):727–740.
- Wang R, Zhu Y, Lin X, et al. Influenza M2 protein regulates MAVS-mediated signaling pathway through interacting with MAVS and increasing ROS production. Autophagy. 2019 Jul;15(7):1163–1181.
- Wei Y, Zeng Y, Zhang X, et al. The nucleoprotein of H7N9 influenza virus positively regulates TRAF3-mediated innate signaling and attenuates viral virulence in mice. J Virol. 2020 Nov 23;94(24). DOI:10.1128/JVI.01640-20.
- Riegger D, Hai R, Dornfeld D, et al. The nucleoprotein of newly emerged H7N9 influenza A virus harbors a unique motif conferring resistance to antiviral human MxA. J Virol. 2015 Feb;89(4):2241–2252.
- Zhang L, Qin Y, Chen M. Viral strategies for triggering and manipulating mitophagy. Autophagy. 2018;14(10):1665–1673.
- Lee JH, Oh SJ, Yun J, et al. Nonstructural protein NS1 of influenza virus disrupts mitochondrial dynamics and enhances mitophagy via ULK1 and BNIP3. Viruses. 2021 Sep 15;13(9):1845.
- Yoshizumi T, Ichinohe T, Sasaki O, et al. Influenza A virus protein PB1-F2 translocates into mitochondria via Tom40 channels and impairs innate immunity. Nat Commun. 2014 Aug 20;5(1):4713.
- Li X, Goobie GC, Zhang Y. Toll-interacting protein impacts on inflammation, autophagy, and vacuole trafficking in human disease. J Mol Med (Berl). 2021 Jan;99(1):21–31.
- Mayank AK, Sharma S, Nailwal H, et al. Nucleoprotein of influenza A virus negatively impacts antiapoptotic protein API5 to enhance E2F1-dependent apoptosis and virus replication. Cell Death Dis. 2015 Dec 17;6(12):e2018.
- Sharma A, Batra J, Stuchlik O, et al. Influenza A virus nucleoprotein activates the JNK stress-signaling pathway for viral replication by sequestering host filamin A protein. Front Microbiol. 2020;11:581867.
- Manz B, Dornfeld D, Gotz V, et al. Pandemic influenza A viruses escape from restriction by human MxA through adaptive mutations in the nucleoprotein. PLoS Pathog. 2013 Mar;9(3):e1003279.
- Sun H, Zhang Q, Jing YY, et al. USP13 negatively regulates antiviral responses by deubiquitinating STING. Nat Commun. 2017 May 23;8(1):15534.
- Wang J, Zeng Y, Xu S, et al. A naturally occurring deletion in the effector domain of H5N1 swine influenza virus nonstructural protein 1 regulates viral fitness and host innate immunity. J Virol. 2018 Jun 1;92(11). DOI:10.1128/JVI.00149-18.
- Reed LJ, Muench H. A simple method of estimating fifty percent endpoints. Am J Epidemiol. 1938;27(3):493–497.
- Wang J, Lei CQ, Ji Y, et al. Duck tembusu virus nonstructural protein 1 antagonizes IFN-beta signaling pathways by targeting VISA. J Immunol. 2016 Dec 15;197(12):4704–4713.
- Li M, Jiang X, Liu D, et al. Autophagy protects LNCaP cells under androgen deprivation conditions. Autophagy. 2008 Jan;4(1):54–60.
- Pila-Castellanos I, Molino D, McKellar J, et al. Mitochondrial morphodynamics alteration induced by influenza virus infection as a new antiviral strategy. PLoS Pathog. 2021 Feb;17(2):e1009340.
- Zhu Q, Yang H, Chen W, et al. A naturally occurring deletion in its NS gene contributes to the attenuation of an H5N1 swine influenza virus in chickens. J Virol. 2008 Jan;82(1):220–228.
- Katoh K, Misawa K, Kuma K, et al. MAFFT: a novel method for rapid multiple sequence alignment based on fast Fourier transform. Nucleic Acids Res. 2002 Jul 15;30(14):3059–3066.