
ABSTRACT
Mutations in the Krebs cycle enzyme IDH1 (isocitrate dehydrogenase (NADP(+)) 1) are associated with better prognosis in gliomas. Though IDH1 mutant (IDH1R132H) tumors are characterized by their antiproliferative signatures maintained through hypermethylation of DNA and chromatin, mechanisms affecting cell death pathways in these tumors are not well elucidated. On investigating the crosstalk between the IDH1 mutant epigenome, ferritinophagy and inflammation, diminished expression of PRMT1 (protein arginine methyltransferase 1) and its associated asymmetric dimethyl epigenetic mark H4R3me2a was observed in IDH1R132H gliomas. Reduced expression of PRMT1 was concurrent with diminished levels of PTX3, a key secretory factor involved in cancer-related inflammation. Lack of PRMT1 H4R3me2a in IDH1 mutant glioma failed to epigenetically activate the expression of PTX3 with a reduction in YY1 (YY1 transcription factor) binding on its promoter. Transcriptional activation and subsequent secretion of PTX3 from cells was required for maintaining macroautophagic/autophagic balance as pharmacological or genetic ablation of PTX3 secretion in wild-type IDH1 significantly increased autophagic flux. Additionally, PTX3-deficient IDH1 mutant gliomas exhibited heightened autophagic signatures. Furthermore, we demonstrate that the PRMT1-PTX3 axis is important in regulating the levels of ferritin genes/iron storage and inhibition of this axis triggered ferritinophagic flux. This study highlights the conserved role of IDH1 mutants in augmenting ferritinophagic flux in gliomas irrespective of genetic landscape through inhibition of the PRMT1-PTX3 axis. This is the first study describing ferritinophagy in IDH1 mutant gliomas with mechanistic details. Of clinical importance, our study suggests that the PRMT1-PTX3 ferritinophagy regulatory circuit could be exploited for therapeutic gains.
Abbreviations: 2-HG: D-2-hydroxyglutarate; BafA1: bafilomycin A1; ChIP: chromatin immunoprecipitation; FTH1: ferritin heavy chain 1; FTL: ferritin light chain; GBM: glioblastoma; HMOX1/HO-1: heme oxygenase 1; IHC: immunohistochemistry; IDH1: isocitrate dehydrogenase(NADP(+))1; MDC: monodansylcadaverine; NCOA4: nuclear receptor coactivator 4; NFE2L2/Nrf2: NFE2 like bZIP transcription factor 2; PTX3/TSG-14: pentraxin 3; PRMT: protein arginine methyltransferase; SLC40A1: solute carrier family 40 member 1; Tan IIA: tanshinone IIA; TCA: trichloroacetic acid; TEM: transmission electron microscopy; TNF: tumor necrosis factor
Introduction
Mutations in the tricarboxylic acid cycle enzyme IDH1 (isocitrate dehydrogenase 1 (NADP(+)) 1) are present in majority of low grade gliomas (LGGs) and in 5–10% of glioblastomas (GBMs) which mainly develop from LGGs [Citation1]. Gliomas with these mutations are less aggressive, more susceptible to therapeutics, and associated with better prognosis [Citation1,Citation2]. Through the common point mutation R132H, IDH1 acquires a gain-of-function activity that converts α-ketoglutarate into D-2-hydroxylutarate (2-HG) [Citation3]. Accumulation of oncometabolite 2-HG is known to affect epigenetic regulators resulting in altered chromatin landscape in many cancers including gliomas [Citation4,Citation5]. These epigenetic alterations further activate key gene expression programs that are predictive of improved survival [Citation6]. Antiproliferative signatures activated by the altered epigenome in IDH1 mutants have therefore been the subject of intense recent investigation [Citation7]. Although enrichment of repressive histone methylation is well documented in IDH1 mutant glioma, there is limited understanding about asymmetric histone marks and their targets in these mutants. PRMT1 (protein arginine methyltransferase 1) is an important regulator of asymmetric dimethylation of histones and are known to be elevated in gliomas [Citation8]. Most importantly, the PRMT1 target H4R3me2a is known to regulate gene programs associated with glioma progression [Citation9]. While several mechanisms have been proposed to explain the greater overall survival in IDH1R132H glioma patients, alterations in epigenetic landscape have emerged to be particularly important. Therefore, identification of epigenetic targets of PRMT1 H4R3me2a that regulate antiproliferative/cell death signatures may not only provide a novel molecular handle on understanding death mechanisms in IDH1 mutant cells, but can also have therapeutic implications.
The innate immune molecule PTX3/TSG-14 (pentraxin 3) is involved in different aspects of cancer progression [Citation10]. PTX3 (a secretory protein), induced mainly by TNF/TNFα [Citation11], plays a role in cancer-related inflammation and glioma malignancy [Citation12]. Glycosylation of PTX3 fine tunes its functions in immunity and inflammation [Citation13]. PTX3 has also been identified as a new prognostic biomarker of various cancers [Citation14,Citation15]. Interestingly, IDH1 mutant glioma patients have low expression of PTX3 as compared to the wild-type counterparts [Citation16]. PTX3 negatively regulates autophagy in glioma [Citation16], and autophagy-related genes are currently being used as a risk signature to predict GBM survival [Citation17]. With autophagy taking center stage as a possible cancer hallmark, it is emerging as a molecular target for cancer treatment [Citation18]. Furthermore, autophagy-mediated degradation of ferritin (ferritinophagy) that promotes ferroptosis – an iron-dependent cell death process [Citation19], is unfolding as a novel target for cancer therapy. Though IDH1 mutation sensitizes cells to ferroptosis [Citation20], the precise regulation of these processes by epigenetic mediators remains largely unknown. Besides its involvement in the regulation of inflammatory genes and inflammatory responses [Citation21], PRMT1 also regulates autophagy and ferritin expression [Citation22,Citation23]. As epigenomic alterations resulting from IDH1 mutation regulate genes that are predictive of improved survival [Citation6], we investigated the role of PRMT1 and its associated mark H4R3me2a in differentially regulating PTX3 mediated autophagic responses in IDH1 wild-type and mutant gliomas.
Results
Diminished levels of PRMT1, H4R3me2a and YY1 in IDH1R132H gliomas
While PRMT1 is known to be involved in glioma progression [Citation24], little is known about its transcriptional regulatory function in gliomas harboring IDH1R132H [Citation25]. The Cancer Genome Atlas (TCGA) dataset analysis revealed reduced expression of PRMT1 mRNA in IDH1R132H patients as compared to those harboring wild-type IDH1 (). Immunoblot analysis demonstrated diminished levels of PRMT1 and its histone methylation mark H4R3me2a in cells harboring IDH1R132H (, Fig. S1A). A similar decrease in PRMT1 and H4R3me2a levels was observed upon transient transfection of other glioma cell lines A172, LN229 and U87-MG with IDH1R132H as compared to cells transfected with WT IDH1 (). This suggested that IDH1R132H is an important regulator of PRMT1 and H4R3me2a levels in gliomas independent of genetic landscape. We further confirmed this observation in patient samples by TCGA dataset analysis (Fig. S1B). Immunohistochemistry (IHC) revealed reduced levels of PRMT1 and H4R3me2a in IDH1 mutant glioma patients as compared to patients with WT IDH1 (). Moreover, Kaplan-Meier estimates suggested PRMT1 to be of prognostic value in gliomas (Fig. S1C).
Figure 1. Expressions of PRMT1, H4R3me2a and YY1 in WT IDH1 and IDH1R132H gliomas. (A) TCGA dataset analysis depicts PRMT1 mRNA expression in IDH1R132H and WT IDH1 glioma patients. Data from n = 270 WT IDH1 and 365 IDH1R132H patients have been used for analysis. Whiskers represent 10–90 percentile. ****P < 0.0001 (two-tailed Student’s t-test). (B) Immunoblots show reduced PRMT1 and histone mark H4R3me2a levels in IDH1R132H cells. (C) Representative western blots show diminished PRMT1 and H4R3me2a levels in A172, LN229 and U87-MG cells transiently expressing IDH1R132H compared to the wild-type counterparts. (D) Representative images of immunohistochemical staining shows reduced PRMT1 and H4R3me2a expression in IDH1 mutants as compared to WT IDH1 glioma patients. Scale bar: 100 µm. n = 3 WT DH1 and n = 3 IDH1 mutant patients. Data in graphs are presented as mean ± s.e.m. *P < 0.05 (two-tailed Student’s t-test). (E) TCGA dataset analysis depicting YY1 mRNA expression in WT IDH1 and IDH1R132H glioma patients. Data from n = 270 WT IDH1 and 365 IDH1R132H patients from TCGA have been used for analysis. Whiskers represent 10–90 percentile. ****P < 0.0001 (two-tailed Student’s t-test). (F) Representative western blot shows reduced YY1 levels in IDH1R132H cells. (G) Immunoblots show diminished YY1 levels in IDH1R132H-overexpressing A172, LN229 and U87-MG cells. The image of loading control used for YY1 is the same as that used for PRMT1 (Figure 1C) in case of LN229 cells. (H) Immunohistochemistry evaluations show reduced expression of YY1 in IDH1 mutants as compared to WT IDH1 glioma patients. Scale bar: 100 µm. n = 3 WT IDH1 and n = 3 IDH1 mutant patients. Blots are representative of n = 3 biological replicates. WCE, whole cell extract; NE, Nuclear extract.
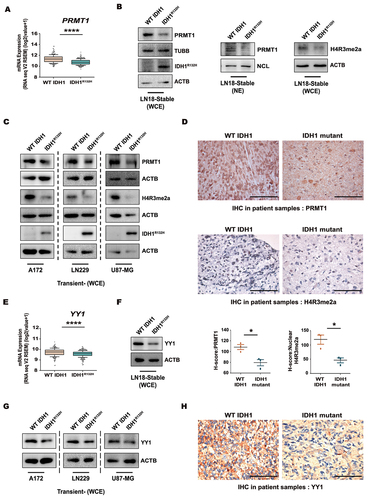
Transcription factor YY1 binds and recruits PRMT1 to YY1-activated promoter [Citation26]. TCGA dataset analysis revealed decreased YY1 expression in IDH1R132H gliomas as compared to those harboring wild-type IDH1 (). Diminished YY1 expression both at whole cell and nuclear levels was observed in IDH1R132H cells as compared to cells over-expressing WT IDH1 (, Fig. S1D). Similarly, transient transfection of A172, LN229 and U87-MG cells with IDH1R132H resulted in reduced levels of YY1 () and this, together with TCGA data analysis highlighted reduced YY1 expression in IDH1 mutant gliomas independent of genetic landscape (Fig. S1E). Immunohistochemistry of patient-derived glioma tissues also revealed diminished YY1 levels in IDH1 mutants as compared to wild-type (, Fig. S1F). Kaplan-Meier estimates suggested better survival in glioma patients with lower YY1 expression (Fig. S1G). Interestingly, the levels of PRMT1 and its transcriptional partner YY1 were also found to be positively correlated in glioma patients (Fig. S1H).
Conserved role of IDH1R132H in reducing PTX3 expression and release
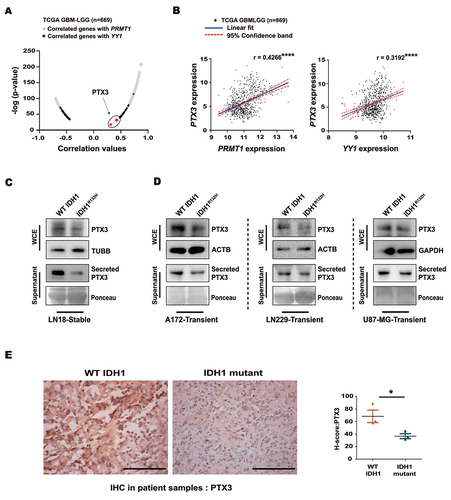
Given the involvement of PRMT1 in TNF-mediated signaling [Citation27], decrease in the expression of mature form (active form) of TNF in IDH1R132H cells was concomitant with reduced PRMT1 levels (Fig. S2A). As TNF is known to induce PTX3 and the expression of the latter correlated with those of both PRMT1 and YY1 in glioma patients (), its status was investigated in IDH1R132H gliomas. TCGA dataset analysis showed diminished PTX3 expression in IDH1R132H gliomas as compared to those harboring wild-type IDH1 (Fig. S2B). A decrease in cellular PTX3 expression as well as its secretory levels was observed in IDH1R132H glioma cells as compared to WT IDH1 (, Fig. S2C). This decreased PTX3 expression observed in IDH1R132H glioma is in accord with a previous study [Citation16]. A similar reduction in cellular PTX3 protein and its secretory level was observed in A172, LN229 and U87-MG cells transiently transfected with IDH1R132H (). In consistence with the findings noted in cell lines of diverse genetic backgrounds, TCGA data analysis also suggested that diminished PTX3 is a feature of IDH1R132H gliomas irrespective of the genetic landscape (Fig. S2D). Immunohistochemistry () indicated diminished PTX3 expression in patients with IDH1 mutant glioma as compared to those with wild-type IDH1. Correlation of lower PTX3 levels with better outcome in glioma patients (Fig. S2E) corroborates the better survival responses observed in PTX3-deficient IDH1 mutants. Also, increase in PTX3 expression, and its release in IDH1R132H cells following TNF treatment (Fig. S2F), further confirmed the role of TNF as an inducer of PTX3. Since TNF mediates activation of YY1 in tumor cells [Citation28] and as PRMT1 affects TNF expression, increase in PRMT1 and YY1 levels was observed in TNF treated IDH1R132H cells (Fig. S2G).
Figure 2. Differential expression of PTX3 in WT IDH1 and IDH1R132H gliomas. (A) Volcano plot for Pearson correlations of PRMT1 and YY1 with PTX3 mRNA levels in TCGA GBM-LGG cohort (n = 669). (B) Pearson correlation coefficient analysis of PRMT1 and YY1 mRNA with PTX3 mRNA levels in TCGA GBM-LGG dataset (n = 669). r represents the Pearson correlation coefficient. ****P < 0.0001. (C) Immunoblots depicting levels of whole cell as well as secreted PTX3 in WT IDH1 and IDH1R132H cells. (D) Immunoblots shows whole cell as well as secreted PTX3 levels in A172, LN229 and U87-MG cells upon transient transfection with WT IDH1 and IDH1R132H. The image of loading control used for PTX3 is the same as that used for YY1 () in case of A172 cells. (E) Representative images of immunohistochemical staining show diminished PTX3 expression in IDH1 mutant glioma patients as compared to those harboring WT IDH1 gliomas. Scale bar: 100 µm. Data are presented as mean ± s.e.m. n = 3 WT IDH1 and n = 3 IDH1 mutant patients. *P < 0.05 (two-tailed Student’s t-test). Blots are representative of n = 3 biological replicates. WCE, whole cell extract.
Diminished occupancy of PRMT1, H4R3me2a and YY1 on PTX3 promoter in IDH1R132H cells
Glycosylation is crucial in the modulation of PTX3 functions [Citation13]. Diminished expression and secretion of PTX3 in WT IDH1 cells transfected with glycosylation-site mutant (PTX3N220Q) (, Fig. S3A), indicated the importance of soluble PTX3 in sustaining its own intracellular expression. As diminished PRMT1 level was concurrent with reduced PTX3 expression in IDH1R132H, the role of PRMT1 in regulating PTX3 was investigated. Treatment of WT IDH1 cells with PRMT1 inhibitor, AMI-1 [Citation29], reduced PTX3 expression and secretion (, Fig. S3B). PRMT1 inhibition was confirmed by reduced levels of H4R3me2a upon AMI-1 treatment (). A similar decrease in PTX3 expression was observed upon AMI-1 treatment in A172, LN229 and U87-MG cells overexpressing WT IDH1 (Fig. S3C). Conversely, overexpression of PRMT1 increased PTX3 expression in IDH1R132H cells as compared to cells transfected with empty vector (, Fig. S3D). Additionally, PRMT1 inhibition reduced YY1 levels in WT IDH1 cells while its overexpression increased YY1 in IDH1R132H cells (, Fig. S3E). Similarly, PRMT1 inhibition decreased YY1 levels in A172, LN229 and U87-MG cells transiently expressing WT IDH1 (Fig. S3F). This suggested the potential of PRMT1 to regulate YY1 expression in addition to its known ability to bind YY1. Reduced expressions of YY1 and PRMT1 were accompanied by their diminished association in IDH1R132H cells ().
Figure 3. Transcriptional regulation of PTX3 by coordinated binding of YY1 and PRMT1. (A) Illustration of the single N-linked glycosylation site in human PTX3 protein at 220 amino acid residue and the N-linked glycosylation site mutated from asparagine to glutamine (N220Q) using site-directed mutagenesis. Immunoblot shows reduced PTX3 level and its release in WT IDH1 cells upon transfection with the glycosylation mutant PTX3N220Q as compared with that of WT PTX3 overexpressing cells. (B) Representative western blot shows reduced PTX3 expression as well as its release upon treatment of WT IDH1 cells with PRMT1 inhibitor AMI-1. Inset shows the decreased levels of histone mark H4R3me2a after AMI-1 treatment. (C) Immunoblot shows increased expression of PTX3 in IDH1R132H cells upon PRMT1 overexpression. (D) Immunoblots show altered YY1 levels upon genetic and pharmacological manipulations of PRMT1 in WT IDH1 and IDH1R132H cells. (E) Co-immunoprecipitation assay with anti-FLAG antibody shows diminished PRMT1 and YY1 interaction in FLAG-YY1 transfected IDH1R132H cells as compared to the wild-type counterpart. (F) PTX3 promoter luciferase activity in WT IDH1 and IDH1R132H cells. Diminished luciferase activity was observed in WT IDH1 cells upon transfection with PTX3Δ promoter luciferase or after AMI-1 treatment. Data represents means ± s.e.m. from three biologically independent experiments. *P < 0.05, #P = 0.14 (paired two-tailed Student’s t-test). (G) ChIP-re-ChIP analyses indicate diminished recruitment of PRMT1 at the YY1 binding site of the PTX3 promoter in IDH1R132H compared to WT IDH1 cells. Primary ChIP and secondary ChIP were performed with YY1 and PRMT1, respectively. Values represent the mean ± s.e.m. from three independent experiments. P = 0.17 (two-tailed Student’s t-test). (H) ChIP-qPCR analysis indicating decreased abundance of H4R3me2a mark at the YY1 binding site on the PTX3 promoter in IDH1R132H compared to WT IDH1 cells. Values represent the mean ± s.e.m. from three independent experiments. P = 0.11 (two-tailed Student’s t-test). Immunoblots are representative of n = 3 biologically independent experiments. WCE, whole cell extract. EV, empty vector; OE, overexpression.
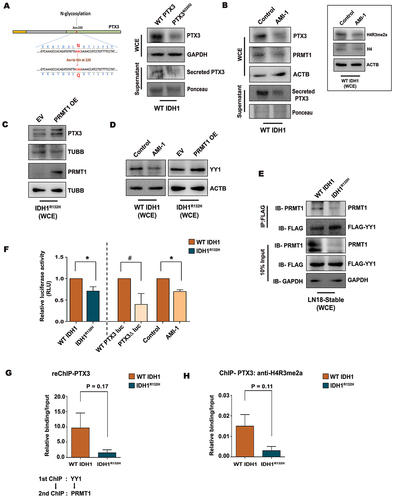
As PTX3 expression was dependent on PRMT1 levels, and since the interaction of the latter with YY1 was abrogated in IDH1R132H cells, we next delineated the mechanism by which PRMT1-YY1 affects PTX3 expression. On scanning for consensus YY1-binding site “CCATTTT” on PTX3 promoter using ALGGEN PROMO, a specific site at 156–162 was identified (Fig. S3G). The functionality of this YY1 site on PTX3 promoter was confirmed by luciferase reporter assays containing the wild-type PTX3 promoter (WT PTX3 luciferase) or PTX3 promoter with a mutation in the predicted YY1 binding site (PTX3Δ luciferase) (Fig. S3G). Decreased PTX3 luciferase reporter activity, suggestive of diminished PTX3 transactivation, was observed in IDH1R132H cells as compared to WT IDH1 cells (). Reduced PTX3 promoter activity was observed in WT IDH1 cells transfected with PTX3Δ luciferase reporter, as compared to cells transfected with WT PTX3 luciferase reporter construct (). This, together with PRMT1 inhibitor AMI-1-mediated decrease in PTX3 promoter activity in WT IDH1 cells (), suggested that both YY1 and PRMT1 drive PTX3 expression. Sequential chromatin immunoprecipitation (ChIP-re-ChIP) indicated a higher enrichment of PRMT1-YY1 complex at YY1-binding site on PTX3 promoter in WT IDH1 cells as compared to IDH1R132H cells (Fig. S3H, ). ChIP assay revealed diminished occupancy of active PRMT1 Arg-methylation mark, H4R3me2a on YY1-binding site of PTX3 promoter in IDH1R132H cells (). Thus, decreased dimethylation of H4R3 correlated with diminished occupancy of PRMT1-YY1-binding at the YY1 site of PTX3 promoter in IDH1 mutant cells. Taken together, diminished recruitment of PRMT1 to PTX3 promoter through its association with YY1 coupled with decreased enrichment of PRMT1 specific methylation mark H4R3me2a affects PTX3 transcriptional activation in IDH1R132H cells.
PTX3 is a negative regulator of autophagic flux
In addition to increased expression of major autophagic marker LC3B [Citation7], IDH1 mutant gliomas also exhibit reticulophagy [Citation30]. Consistent with the previous studies, increased level of LC3B-II was observed in IDH1R132H cells as compared to wild-type IDH1 (, Fig. S4A). This was concomitant with diminished levels of SQSTM1/p62 (a surrogate marker of increased autophagy that is degraded in the process of autophagy execution [Citation31]) in IDH1R132H cells (, Fig. S4A). Similarly, transient expression of IDH1R132H led to increased LC3B-II levels and diminished SQSTM1 levels in A172, LN229 and U87-MG cells compared to those transfected with WT IDH1 cells (Fig. S4B). TCGA dataset analysis as well as immunohistochemistry revealed increased MAP1LC3B and reduced SQSTM1 in IDH1 mutant gliomas compared with WT IDH1 (Fig. S4C and S4D). As PTX3 is a negative regulator of autophagy in glioma cells [Citation16], its involvement in regulation of these autophagic markers was investigated. Stalling the secretion of PTX3 in WT IDH1 cells with glycosylation mutant PTX3N220Q or treatment with tanshinone IIA (Tan IIA; a known PTX3 inhibitor that also serves as a regulator of autophagy) [Citation32], increased LC3B-II and diminished SQSTM1 levels as compared to their corresponding controls (, Fig. S4A). Likewise, treatment with rhPTX3 (which rescues PTX3 expression and release in IDH1R132H cells [Fig. S4E]) decreased LC3B-II and elevated SQSTM1 in IDH1R132H cells (, Fig. S4A) as well as in A172, LN229 and U87-MG cells transiently expressing IDH1R132H (Fig. S4F). These results not only established that PTX3 serves as a negative regulator of autophagic markers in glioma, but this attribute of PTX3 was found to be independent of the heterogenous genetic landscape of different glioma cell lines. TCGA data also indicated inverse correlation of PTX3 with MAP1LC3B and a positive correlation with SQSTM1 () in glioma patients. These changes in MAP1LC3B and SQSTM1 were also found to be of prognostic significance (increased survival of patients with high MAP1LC3B and low SQSTM1) ().
Figure 4. Autophagic responses in gliomas are PTX3-dependent. (A) Immunoblots show altered levels of LC3B-II and SQSTM1 in cells overexpressing IDH1R132H as compared to WT IDH1 cells. (B) Western blots show increased levels of LC3B-II expression and reduced levels of SQSTM1 in WT IDH1 cells upon overexpression of the glycosylation mutant PTX3N220Q or treatment with Tan IIA. Inset shows the reduced levels of whole cell and secreted PTX3 after Tan IIA treatment in WT IDH1 cells. (C) Levels of LC3B-II and SQSTM1 in IDH1R132H cells upon rhPTX3 treatment as depicted by western blot analysis. (D) Pearson correlation coefficient analysis of MAP1LC3B and SQSTM1 with PTX3 mRNA expression in TCGA GBM-LGG dataset (n = 669). r represents the Pearson correlation coefficient. ***P < 0.001; ****P < 0.0001. (E) Representative survival curves for MAP1LC3B and SQSTM1 mRNA expression in TCGA GBM-LGG patient cohort. n = 599 for MAP1LC3B high group and n = 66 for MAP1LC3B low group. n = 77 for SQSTM1 high group and n = 588 for SQSTM1 low group. Log rank test P-values and hazard ratios (HR) are indicated. ****P < 0.0001. (F) Microscopic images show increased MDC labeling of autophagic vacuoles in IDH1R132H cells as compared to WT IDH1. Treatment with rhPTX3 diminishes MDC accumulation in autophagic vacuoles of IDH1R132H cells (bottom panel). Representative images from two independent experiments are shown. Scale bar: 10 µm. (G) Quantification from MDC fluorescence demonstrates altered MDC accumulation under the conditions indicated. Values are representative of three independent experiments and are plotted as means ± s.e.m. relative to their respective controls. *P < 0.05, #P = 0.12 (paired two-tailed Student’s t-test). (H) Autophagic flux as quantified from LC3B-II levels in WT IDH1 or IDH1R132H in the presence or absence of BafA1. Immunoblots demonstrating autophagic flux in WT IDH1 and IDH1R132H cells expressing either glycosylation mutant PTX3N220Q or treated with rhPTX3, respectively. The normalized densitometric value of LC3B-II in control samples was subtracted from the corresponding BafA1-treated samples. The numerical values represent fold change in autophagic flux. Blots are representative of n = 3 biological replicates. WCE, whole cell extract.
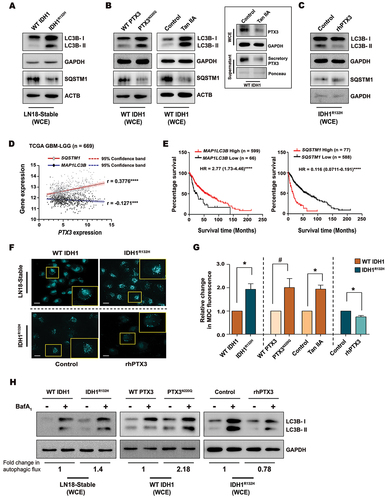
Visualization of autophagic vacuolization by staining with fluorescent dye monodansylcadaverine (MDC) [Citation33], demonstrated increased MDC accumulation in IDH1R132H cells as compared to WT IDH1 cells (). This increased accumulation of MDC-stained vacuoles in IDH1R132H was consistent with altered expression of autophagic markers (). Accumulation of MDC was found to be PTX3 dependent, as rhPTX3 diminished MDC accumulation in IDH1R132H (), while ectopic expression of PTX3-glycosylation mutant or Tan IIA treatment increased MDC accumulation in WT IDH1 cells (). As increased autophagosomes in IDH1R132H could indicate either their increased accumulation or heightened autophagic flux, LC3B-II levels were measured in the presence of bafilomycin A1 (BafA1) that prevents maturation of autophagic vacuoles through inhibition of late-stage fusion between autophagosomes and lysosomes. Increased LC3B-II accumulation in IDH1R132H cells upon BafA1 treatment indicated an increased autophagic flux as compared to WT IDH1 cells (). Elevation in LC3B-II levels in WT IDH1 cells overexpressing PTX3N220Q in the presence of BafA1, as compared to BafA1 treated cells over-expressing WT PTX3 indicated the dependency of autophagic-flux on PTX3 (). Similarly, Tan IIA increased (Fig. S4G) and rhPTX3 decreased () autophagic flux in WT IDH1 and IDH1R132H cells, respectively.
PTX3 regulates the fusion of autophagosomes with lysosomes
The role of PTX3 in affecting autolysosome formation was further demonstrated using mCherry-EGFP-LC3B construct (). In autophagosomes, GFP and mCherry retain their respective fluorescence wherein vesicles appear yellow; while fluorescence of GFP is progressively quenched as autophagosomes fuse with lysosomes to form autolysosomes causing them to exhibit red fluorescence. In rhPTX3-treated glioma cells expressing the mCherry-EGFP-LC3B construct, a decrease in the number of vesicles double positive for GFP and mCherry (GFP+ mCherry+, autophagosome) was observed. This was followed by a decrease in autolysosome formation (GFP− mCherry+, autolysosome) upon rhPTX3 treatment (). Conversely, ectopic expression of PTX3-glyosylation mutant increased the autolysosome formation as exhibited by increase in number of vesicles positive for red fluorescence (GFP− mCherry+) (). This suggested that PTX3 decreases autophagic flux by diminishing the autophagosome formation as well as its fusion with lysosome.
Figure 5. Autolysosome formation in glioma cells is PTX3-dependent. (A) Representative confocal images of LN18 glioma cells transfected with mCherry-EGFP-LC3B construct showing autophagosome formation. Schematic depicts autophagosome degradation during the process of autophagic flux. Panel shows reduced autophagosome and autolysosome formation indicated by the yellow and red colored vacuoles in the presence of rhPTX3 as compared to control cells. Scale bar: 10 µm. Graph represents the number of yellow puncta (GFP+ mCherry+, autophagosomes) and red puncta (GFP− mCherry+, autolysosomes). Data from 15 cells under each condition from n = 2 biological replicates are presented as mean ± s.e.m. ****P < 0.0001 (two-tailed Student’s t-test). (B) Panel shows increase in autolysosome formation upon PTX3N220Q transfection due to progressive quenching of GFP (autolysosome formation causing red fluorescence emission). Scale bar: 10 µm. Graph represents the number of yellow puncta and red puncta. Data from 15 cells under each condition from n = 2 biological replicates are presented as mean ± s.e.m. ***P < 0.001; ****P < 0.0001(two-tailed Student’s t-test). (C) Electron micrographs show increased autophagic vacuoles (panel iii; red arrows) and mitochondrial fragmentation (panel iv; yellow arrows) in IDH1R132H cells compared to WT IDH1 cells which shows more elongated mitochondria (panel ii; yellow arrow) and fewer autophagic vacuoles (panel i; red arrow). Bar graphs show number of autophagic vacuoles and percentage fragmented mitochondria in the two conditions. Values represent the means ± s.e.m. (Scale bar: 200 nm, magnification: 40000x). ***P < 0.001; ****P < 0.0001 (two-tailed Student’s t-test). (D) Representative TEM images show decrease in autophagic vacuoles and mitochondrial fragmentation when IDH1R132H cells were treated with rhPTX3. Bar graphs represents number of autophagic vacuoles and percentage fragmented mitochondria upon rhPTX3 treatment. Values represent the means ± s.e.m. (Scale bar: 500 nm, magnification: 30000x). *P < 0.05 (two-tailed Student’s t-test).
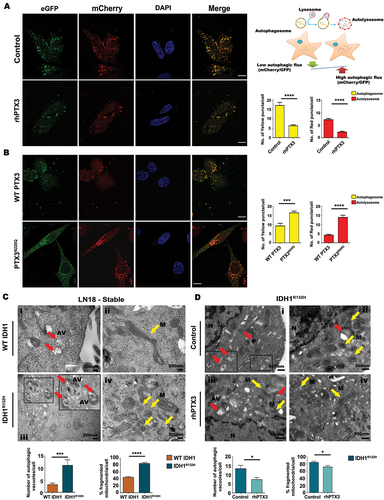
To provide greater insight into the evaluation of autophagy, transmission electron microscopy (TEM) was performed to further characterize the status of autophagic flux in WT IDH1 and IDH1R132H cells. WT IDH1 cells exhibited normal appearing mitochondria in contrast to IDH1R132H cells that exhibited fragmented mitochondria and autophagic vesicles with dense organelles having round and double-membrane structures. Compared to WT IDH1, IDH1R132H glioma cells displayed numerous autophagic vacuoles, and heightened mitochondrial fragmentation (). The above cellular changes observed in IDH1R132H cells were rescued upon treatment with rhPTX3 ().
PTX3 regulates genes associated with ferritinophagy
Autophagy degrades iron-storage macromolecule ferritin by the process of ferritinophagy. Such degradation of ferritin increases cellular iron levels leading to accumulation of reactive oxygen species (ROS) and subsequently cell death through ferroptosis [Citation34]. Interestingly, PTX3 inhibitor Tan IIA induces ferroptosis in gastric cancer [Citation35]. As diminished PTX3 level triggers autophagic flux in IDH1R132H glioma cells, we next investigated the expression of key molecules associated with ferritinophagy such as ferritin and SLC40A1/ferroportin (solute carrier family 40 member 1) involved in iron storage and iron export, respectively. Decrease in FTH1 (ferritin heavy chain 1), FTL (ferritin light chain) and SLC40A1 both at mRNA () and protein levels (, Fig. S5A) was observed in IDH1R132H cells as compared to WT IDH1 cells, suggesting increased ferritinophagic degradation of these iron regulatory molecules. A similar decrease in FTH1, FTL and SLC40A1 protein levels was observed in A172, LN229 and U87-MG cells transiently expressing IDH1R132H (Fig. S5B). These changes in ferritinophagy markers were found to be PTX3 dependent, as ectopic expression of PTX3N220Q decreased mRNA as well as protein levels of the mentioned genes in WT IDH1 cells, whereas rhPTX3 treatment in IDH1R132H cells rescued their levels (, Fig. S5C-E). Likewise, an increase in ferritinophagic markers was observed upon rhPTX3 treatment in A172, LN229 and U87-MG cells transiently expressing IDH1R132H (Fig. S5F). A decrease in the levels of these proteins was also observed upon Tan IIA treatment in WT IDH1 cells (, Fig. S5D). Increased degradation of ferritin and ferroportin in IDH1R132H cells as compared to WT IDH1, was concomitant with heightened iron accumulation (). Also, decreased cellular iron accumulation in rhPTX3 treated IDH1R132H cells () was consistent with enhanced levels of ferritin and ferroportin observed in these cells (). TCGA data analysis showed diminished FTH1, FTL and SLC40A1 mRNA expression in IDH1R132H glioma patients ().
Figure 6. Expression of ferritinophagy genes in gliomas is PTX3 dependent. (A) Heat map represents relative transcript abundance of ferritinophagy-related genes FTH1, FTL and SLC40A1 in WT IDH1 and IDH1R132H cells or in glycosylation mutant PTX3N220Q overexpressing WT IDH1 cells. Gene expression values were normalized with RNA18S rRNA levels. Data are presented as mean ± s.e.m. for n = 3 independent experiments. (B) Reduced levels of ferritinophagy markers FTH1, FTL and SLC40A1 (ferroportin) in IDH1R132H cells as compared to their wild-type counterpart, as demonstrated by western blot analysis. (C) Decreased expression of ferritinophagic markers in WT IDH1 cells expressing either glycosylation mutant PTX3N220Q or treated with Tan IIA. Treatment with rhPTX3 increases expression of ferritinophagic markers in IDH1R132H cells. (D) Iron levels in IDH1R132H cells as compared to WT IDH1 cells and upon treatment with rhPTX3.Values are representative of two or three independent experiments and are plotted as means ± s.e.m. relative to their respective controls. *P < 0.05 (paired two-tailed Student’s t-test). (E) TCGA dataset analysis depicting reduced expression of FTH1, FTL and SLC40A1 in IDH1R132H glioma patients compared to those harboring WT IDH1. Data from n = 270 WT IDH1 and 365 IDH1R132H glioma patients from TCGA was used for analysis. Whiskers represent 10–90 percentile. ****P < 0.0001 (two-tailed Student’s t-test). (F) Immunoblots show increased level of NCOA4 and decreased levels of redox sensing genes SOD1, HMOX1 and NFE2L2 in IDH1R132H cells as compared to IDH WT cells. (G) Western blot detection of NCOA4, SOD1, HMOX1 and NFE2L2 in WT IDH1cells expressing either glycosylation mutant PTX3N220Q or treated with Tan IIA. rhPTX3 alters expression of NCOA4 and molecules associated with oxidative stress in IDH1R132H cells. (H) DHE fluorescence measurements for cellular ROS levels in WT IDH1 cells expressing either glycosylation mutant PTX3N220Q or treated with Tan IIA, and in IDH1R132H cells treated with rhPTX3. Values are representative of three independent experiments and plotted as fold change to their respective controls. *P < 0.05 (paired two-tailed Student’s t-test). (I) Volcano plot representation for Pearson correlations of ferritinophagy and redox sensing genes with PTX3 mRNA expression in TCGA GBM-LGG cohort (n = 669). Immunoblots are representative of n = 3 biological replicates. WCE, whole cell extract.
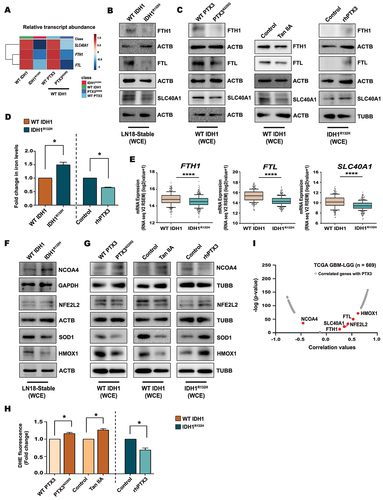
Excessive ferritinophagy resulting from autophagic degradation of ferritin contributes to iron overload and ferroptosis, and multiple players are involved in ferroptosis. Besides the selective autophagic cargo receptor NCOA4 (nuclear receptor coactivator 4) that promotes ferroptosis, transcription factor NFE2L2/Nrf2, involved in regulation of HMOX1/HO-1 (heme oxygenase 1), serves as a negative regulator of ferroptosis by reducing cellular iron uptake and limiting ROS production. TCGA analysis of data for ferritinophagic markers, NFE2L2, HMOX1 and NCOA4, confirmed their correlation with increased ferritinophagy in IDH1R132H (Fig. S5G). NCOA4-mediated ferritinophagy promotes ROS accumulation [Citation36], and heightened ROS levels in IDH1R132H glioma cells is reported [Citation37]. Consistent with increased ferritinophagy, diminished SOD1, NFE2L2 and HMOX1 levels were observed in IDH1R132H cells expressing elevated NCOA4 levels (, Fig. S5H). These changes were found to be PTX3-dependent as PTX3 glycosylation mutant or Tan IIA treatment in WT IDH1 cells not only elevated NCOA4 levels but also reduced NFE2L2, SOD1 and HMOX1 (, Fig. S5I). Altered expression of mediators involved in oxidative stress responses upon PTX3N220Q overexpression or Tan IIA treatment was accompanied by heightened ROS levels in WT IDH1 cells (). On the other hand, treatment of IDH1R132H cells with rhPTX3 diminished NCOA4, elevated expressions of NFE2L2, SOD1, HMOX1 (, Fig. S5J), and reduced ROS levels (). TCGA data analysis also confirmed the positive correlation of PTX3 with ferritinophagy markers as well as NFE2L2 and HMOX1 in glioma patients (, Fig. S5K).
PRMT1 potentiates the ability of PTX3 to sensitize glioma cells to ferroptosis inducer
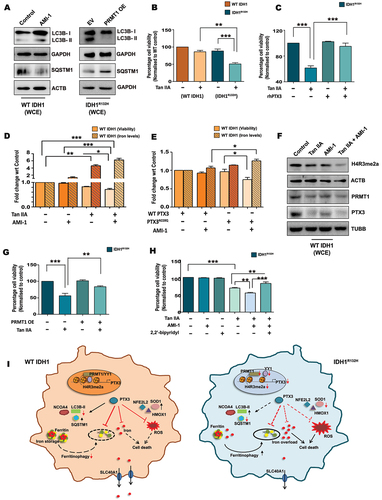
Since PRMT1 regulates both PTX3 expression and release, and as the latter is a negative regulator of autophagy and ferritinophagy; the role of PRMT1 in affecting PTX3-driven autophagic/ferritinophagic responses was investigated. Besides, H4R3 methylation by PRMT1 is known to regulate ferritin transcription [Citation23]. While PRMT1 inhibitor AMI-1 increased LC3B-II and decreased SQSTM1 in WT IDH1 cells, the reverse was noted in IDH1R132H upon PRMT1 overexpression (, Fig. S6A). Treatment of A172, LN229 and U87-MG cells transiently expressing WT IDH1 with AMI-1 increased LC3B-II and decreased SQSTM1 expression (Fig. S6B). As these results highlighted PRMT1-PTX3 axis to be a negative regulator of autophagy, we next investigated their combinatorial effect on ferritinophagic responses. Heightened sensitivity to Tan IIA-induced cell death in IDH1R132H cells () was PTX3-dependent, as co-treatment with rhPTX3 rescued the cytotoxic effect of Tan IIA (). Conversely, while treatment with AMI-1 alone had no significant effect on the viability of WT IDH1 cells, its co-treatment with Tan IIA triggered cell death (). Increased cell death upon AMI-1 and Tan IIA co-treatment was accompanied by increased intracellular iron levels () and altered levels of ferritinophagy genes (Fig. S6C and S6D). Complementary experiments were next performed to investigate whether Tan IIA-mediated diminished PTX3 confers vulnerability to PRMT1 inhibition in WT IDH1 cells. Although AMI-1 alone had no effect on the viability of cells overexpressing WT PTX3, ectopic expression of PTX3N220Q diminished cell viability in the presence of AMI-1 (i.e., under conditions of PTX3 and PRMT1 deficit) (). Increased iron accumulation was noted in AMI-1 treated cells overexpressing PTX3N220Q as compared to those overexpressing WT PTX3 (). Interestingly, Tan IIA was also found to reduce PRMT1 levels in WT IDH1 cells in addition to its documented ability to decrease PTX3 (). Tan IIA and AMI-1 co-treatment not only affected PRMT1 but also synergistically decreased the active methylation mark H4R3me2a, thus confirming the importance of this epigenetic modification in rendering cells sensitive toward iron-mediated cell death (, Fig. S6D). While PRMT1 inhibition potentiated Tan IIA-mediated cell death (), its overexpression in IDH1R132H cells rescued PTX3 inhibition induced death (). These results further establish the important role of PRMT1 in sensitizing cells to PTX3 inhibition/inhibitors (like Tan IIA which also serves as a ferroptosis inducing agent) in gliomas. Patient data analysis confirmed the positive correlation of PRMT1 with ferritin and ferroportin (Fig. S6E). Cell death induced by the combination of Tan IIA and AMI-1 was found to be iron-dependent as treatment with ferroptosis inhibitor, 2,2’-bipyridyl (which functions as an iron chelator) rescued death in IDH1R132H cells (). This study suggests the link between PRMT1 H4R3me2a loss and diminished PTX3 secretion as crucial for mediating ferritinophagy in IDH1 mutant gliomas ().
Figure 7. PRMT1-PTX3 axis regulates ferritinophagy associated cell death. (A) WT IDH1 or IDH1R132H cells were treated or transfected under the conditions indicated, and cell lysates were analyzed for LC3B-II and SQSTM1 by western blotting. (B) MTS assay shows viability of IDH1R132H and WT IDH1 cells upon treatment with Tan IIA. (C) Co-treatment with rhPTX3 rescues Tan IIA mediated death in IDH1R132H cells as demonstrated by MTS assay. (D) MTS assay shows cell viability of WT IDH1 cells upon treatment with Tan IIA or AMI-1 either alone or in combination. The cellular iron levels under different treatment conditions are shown. For iron assay, values are representative of two independent experiments and are plotted as means ± s.e.m. relative to control. (E) MTS assay show viability of WT IDH1 cells overexpressing WT PTX3 or PTX3N220Q in the presence or absence of AMI-1. Iron levels corresponding to the different treatment conditions are shown. For iron assay, values are representative of two independent experiments and are plotted as means ± s.e.m. relative to WT PTX3 control. (F) Co-treatment with Tan IIA and AMI-1 diminishes expression of PTX3, PRMT1 and H4R3me2a in WT IDH1 cells as compared to cells treated withTan IIA or AMI-1 alone, as demonstrated by western blot analysis. (G) PRMT1 overexpression rescues Tan IIA mediated death of IDH1R132H cells as shown by MTS assay. (H) Iron chelator, 2,2’-bipyridyl rescues death in IDH1R132H cells triggered upon co-treatment with Tan IIA and AMI-1, as shown by MTS assay. (I) Schematic depicting the role of PRMT1 and PTX3 in regulating ferritinophagic responses in WT IDH1 and IDH1R132H gliomas. Immunoblots are representative of n = 3 biological replicates. WCE, whole cell extract. EV, empty vector; OE, overexpression. Cell viability as shown by MTS assay is expressed as percentage normalized to their respective control groups and presented as mean ± s.e.m.; n = 3 or 4 biological replicates. Comparisons among multiple groups were done using one-way ANOVA with Tukey’s multiple comparison test. *P < 0.05; **P < 0.01; ***P < 0.001.
Discussion
With dysregulation of protein arginine methylation being associated with several malignancies, PRMTs have emerged as novel anti-cancer targets as exemplified by multiple clinical trials of PRMT inhibitors [Citation38]. Because H4R3 methylation by PRMT1 is crucial for a wide range of “active” chromatin modifications [Citation39], changes in protein arginine methylation and PRMT1 may provide opportunities for manipulating genes associated with survival responses in glioma. IDH1 mutation establishes a glioma CpG island methylator phenotype (G-CIMP) that contributes to reorganization of methylome and transcriptome to affect key gene expressions predictive of improved survival [Citation6,Citation40]. Here we show diminished expression of PRMT1 as well as reduced level of its specific histone modification mark H4R3me2a in IDH1R132H gliomas. It is possible that the methylome reorganization that characterizes IDH1R132H could render the promoter of PRMT1 less accessible for transcription, thereby contributing to its diminished levels. PRMT1 serves as key transcriptional regulator of PTX3, as reduced enrichment of PRMT1 and H4R3me2a at YY1 site of PTX3 promoter resulted in its diminished transcriptional activation in IDH1R132H. That insufficient PRMT1, YY1 and H4R3me2a in IDH1R132H are associated with diminished PTX3 expression was further demonstrated by their reduced expression in patients harboring this mutation. This together with the involvement of glycosidic moiety of PTX3 in regulating its own release and altered TNF levels further contributed to the differential expression of PTX3 in wild-type or mutant IDH1 cells.
Despite the paradoxical role of autophagy in GBM, high expression of LC3B-II has been associated with an improved outcome for glioma patients [Citation41]. Targeting the autophagic regulatory circuitry in gliomas with repurposed drugs elicits cell-lethal autophagy and therapeutic benefit [Citation42]. PTX3 plays a crucial role in the orchestration of autophagy in glioma cells [Citation16], and PRMT1 deficiency augments the autophagic response [Citation43]. As IDH1 mutants are susceptible to autophagy [Citation44], it is likely that PRMT1 and PTX3 deficiency in these mutants contributes to heightened autophagic flux as displayed by numerous autophagosomes, autolysosomes and empty vacuoles. Autophagic degradation of ferritin via ferritinophagy increases iron levels resulting in oxidative stress by Fenton reaction, and sensitizes cells to ferroptosis. It is noteworthy that PTX3-dependent changes in ferritinophagic genes are linked to heightened ferritinophagic flux in IDH1R132H cells. It is likely that such PTX3-dependent difference in ferritinophagy markers as well as intracellular iron homeostasis could account for increased ROS generation in IDH1R132H [Citation37]. This is in agreement with increased mitochondrial fragmentation and elevated ROS levels observed in IDH1R132H gliomas [Citation37].
PRMT1 is involved in the transcriptional regulation of ferritin gene, with induction of histone arginine methylation and nuclear accumulation of PRMT1 being involved in mRNA expression of FTL and FTH [Citation23]. Although dependence of PRMT1-catalyzed H4R3me2a in tumor maintenance has uncovered new avenues to further the clinical development of PRMT1 inhibitors [Citation45], studies to highlight the role of PRMT1 and its histone methylation target H4R3me2a in gliomas are limited. Our findings underscore for the first time, the contribution of PRMT1 in negatively driving iron homeostasis through PTX3 and its consequences on differential responsiveness of glioma cells to PRMT1 inhibition. We found this unexpected result attractive as it hinted at a previously unknown link between the PRMT1-PTX3 axis and ferritinophagy. IDH1 knockdown confers sensitivity to erastin, a ferroptosis inducer in human pancreatic ductal carcinoma cells [Citation46]. Since PRMT1 inhibitor AMI-1 potentiated the effect of ferroptosis inducer Tan IIA, it will be interesting to investigate whether this ability of PRMT1 inhibitor extends to other ferroptosis inducers as well.
Because metabolic adaptation in WT IDH1 overexpressing glioma promotes tumor progression and reduces susceptibility to therapies, IDH1 targeted therapies have been suggested as a universal modality against GBM [Citation47]. Our findings establish the importance of IDH1 mutational status in conferring selective vulnerability to PRMT1 inhibitors through altered PTX3 levels. Confirmation of the existence of IDH1-PRMT1-PTX3-ferritnophagy axis in glioma cell lines of diverse genetic makeup, warrants further investigation into targeting this axis for sensitizing glioma cells to ferroptosis inducers. Investigating the vulnerabilities of IDH1 mutants in other malignancies would open exciting avenues for exploiting combinatorial PRMT1 and PTX3 inhibitor therapy for cancers in general. By underscoring the heightened PRMT1-PTX3 axis as an actionable (“druggable”) mechanism that favors survival of WT IDH1 gliomas, our findings provide the rationale for evaluating dual PRMT1-PTX3 inhibitors as potential anti-glioma agents. Also, our findings present the prospect of upholding PRMT1-PTX3 status as a novel marker for determining susceptibility of glioma patients to ferroptosis inducers. Given that distinct epigenomic architecture particularly H4R3me2a status in IDH1R132H and WT IDH1 render these two glioma types differentially susceptible to PRMT1 and PTX3 inhibitors, assessment of epigenetic states will be useful as a predictive biomarker in determining responsiveness to chemotherapeutics.
Materials and methods
Cell culture and stable cell line generation
Human glioma cell lines LN18 (ATCC, CRL-2610), LN229 (ATCC, CRL-2611) and A172 (ATCC, CRL-1620) were obtained from the American Type Culture Collection. Glioma cell line U87-MG was obtained from Sigma-Aldrich (89081402). Cells were cultured in Dulbecco’s Modified Eagle Medium (DMEM; Gibco, 12800–017) supplemented with 10% heat-inactivated fetal bovine serum (HI-FBS; Gibco, 16140–071) and penicillin (100 U/mL)-streptomycin (100 μg/mL) (Gibco, 15140–122). For the establishment of stable glioma cell lines, LN18 cells were transfected with the pEGFP-WT IDH1 and pEGFP-IDH1R132H constructs (gift from Hai Yan, Duke University School of Medicine, USA) as described previously [Citation48].
Site-directed mutagenesis
Plasmid pcDNA3-PTX3 containing the human full-length PTX3 cDNA (gift from Prof. Roberto Ronca, University of Brescia, Italy [Citation49]) was used to generate the PTX3 N-glycan site mutant (N220Q AAC → CAG) by site-directed mutagenesis kit (NEB, M0530S) using the manufacturer’s protocol as described previously [Citation50]. The mutated plasmid (PTX3N220Q) was constructed by replacement of asparagine 220 (Asn220) to glutamine. Similarly, PTX3-promoter luciferase mutation plasmid (YY1 binding site mutated from 156–162) was generated using site-directed mutagenesis and designated as PTX3Δ luciferase. The wild-type PTX3-promoter luciferase construct was a gift from Prof. Abdelilah S. Gounni (University of Manitoba, Canada [Citation51]). Mutations in the plasmids were verified by Sanger sequencing. The sequences of the primers used for site-directed mutagenesis are provided in Table S1.
Transfections and treatments
For transfections, LN18 cells stably harboring WT IDH1 or IDH1R132H were transfected with pBABE-puro-PTX3, pBABE-puro-PTX3N220Q, pEGFP-EV, pEGFP-PRMT1 (kind gift from Prof. Mark Bedford; The University of Texas, Smithville, TX, USA) [Citation52], pcDNA3.1 FLAG-YY1 (Addgene, 104396; deposited by Prof. Richard Young) [Citation53] and pBABE-puro mCherry-EGFP-LC3B (Addgene, 22418; deposited by Prof. Jayanta Debnath) [Citation54] using Lipofectamine 2000 reagent (Invitrogen,11668–027) or Lipofectamine 3000 reagent (Invitrogen, L-3000-015) as described previously [Citation55]. Similarly, other glioma cell lines, A172, LN229 and U87-MG were transiently transfected with plasmids encoding WT IDH1 or IDH1R132H. Upon attaining semi-confluence, cells were serum-starved for 6 h and then treated with either 200 ng/ml recombinant human PTX3 (rhPTX3; R&D Systems, 1826-TS), or 100 ng/ml human recombinant TNF (R&D Systems, 210-TA), or 300 µM AMI-1 (Sigma-Aldrich, A9232), or 30 µM Tan IIA (Sigma-Aldrich, T4952), or 100 nM BafA1 (Sigma-Aldrich, B1793), or 25 µM 2,2’-bipyridyl (Sigma-Aldrich, D216305). DMSO was used as a control for Tan IIA, BafA1 and 2,2’-bipyridyl. After 24 h or 36 h of treatment or transfection, cells were harvested for further processing, and culture supernatant was stored at −80°C for subsequent protein precipitation by trichloroacetic acid (TCA).
Western blot
Western blot analysis was performed on nuclear and whole cell proteins isolated from cells transfected with different constructs or treated with different inhibitors as described previously [Citation48], or from culture supernatants precipitated using TCA method; with primary and secondary antibodies listed in . Briefly, for TCA precipitation, an equal volume of culture supernatant was precipitated using TCA in a 4:1 ratio (supernatant:TCA). This was followed by acetone washes and the dried protein pellet was subjected to SDS-PAGE. Horseradish peroxidase (HRP)-conjugated antibodies were from Vector Laboratories Inc. After the addition of a chemiluminescent reagent (Millipore, WBKLS0500), blots were exposed to the Syngene G:Box XX8 system (Syngene) and images were captured with GeneSys software (Syngene). The blots were stripped and re-probed with anti-ACTB/β-actin, anti-TUBB/β-tubulin, anti-NCL/C23 or anti-GAPDH to determine equivalent loading as described previously.
Table 1. List of antibodies used in the study.
qRT-PCR
To find the relative abundances of mRNAs of interest under various treatment/transfections, real-time reverse transcription-PCR (quantitative PCR [qPCR]) was used. Briefly, total RNA isolated using the TRIzol method (Sigma-Aldrich, T9424) was reverse transcribed with a cDNA synthesis kit (Applied Biosystems, 4368814) on a ProFlex PCR System thermal cycler (Applied Biosystems Inc.) according to the manufacturer’s protocol. qPCR was done using Power SYBR green PCR master mix (Applied Biosystems Inc., 4367659) as described previously [Citation48] with a QuantStudio 5 real-time thermocycler (Applied Biosystems Inc.) for 40 cycles. Target gene expression was analyzed using delta delta Ct method and normalized to 18S rRNA expression. Oligonucleotide sequences are listed in Table S1.
Co-immunoprecipitation
Co-immunoprecipitation was performed as described previously [Citation48]. Briefly, glioma cells stably harboring WT IDH1 and IDH1R132H were transfected with pcDNA3.1 FLAG-YY1 (Addgene, 104396; deposited by Prof. Richard Young) [Citation53]. After 24 h, whole cell protein extracts were incubated with anti-FLAG antibody at 4°C for 16 h, followed by further incubation with protein A/G-Sepharose beads (Biovision, 6503) at room temperature for 4 h. The beads were washed in IP buffer (50 mM Tris-HCl, pH 8.0, 150 mM NaCl, 10% glycerol, 1 mM PMSF [Sigma-Aldrich, P7626], 0.5% Triton X-100 [Sigma-Aldrich, T9284]), and immunoprecipitated proteins were subjected to western blot analysis using anti-PRMT1 and anti-FLAG antibody. Ten percent of the total protein lysates were used as inputs.
Chromatin immunoprecipitation, re-ChIP, and ChIP-qPCR assays
ChIP was performed by enzymatic DNA shearing as previously described [Citation48]. Cells were fixed in 1% formaldehyde, isolated nuclei were lysed, and DNA enzymatically sheared with the Enzymatic Shearing kit (Active Motif, 53009). This was followed by immunoprecipitation of sheared DNA using anti-YY1 antibody. For re-ChIP, anti-YY1 antibody was used for primary IP, followed by anti-PRMT1 for the second pulldown. Similarly, ChIP was performed using anti-H4R3me2a. After reverse cross linking and DNA purification, immunoprecipitated DNA and DNA from the input (diluted 1:10) were analyzed by qPCR using Power SYBR green PCR master mix with a ViiA7 real-time thermocycler (Applied Biosystems Inc.) for 40 cycles. The results were analyzed as relative fold enrichment with respect to the input and calculated based on the CT as 100/2∆CT where ΔCT = CT (IP) – (CT input – log2 dilution factor). Primer sequences used for qPCR analyses are given in table S1.
TCGA data analysis
To study the expression pattern and prognostic implications of PRMT1, YY1 and PTX3 along with autophagic and ferritinophagic genes in IDH1R132H gliomas, whole transcriptome sequencing (RNA-seq) data from tumor tissues of low grade and high grade glioma patients (TCGA-LGG and GBM dataset) were downloaded using cBioPortal [Citation56]. The patients were segregated on the basis of IDH1 mutation status and classified as patients bearing WT IDH1 or IDH1R132H mutation. The gene expression data was then log transformed and compared using unpaired two-tailed Student’s t-test. To understand the conserved role of IDH1R132H in mediating gene expression patterns across diverse genetic landscapes in gliomas, patients were also classified according to the commonly occurring TP53 mutation status and were designated as patients harboring wild-type or mutant TP53. Thereafter, patients in these groups were further segregated based on IDH1 mutation status (WT IDH1 or IDH1R132H) and gene expression analysis in these different groups was performed. For survival analysis, corresponding clinical data were downloaded from cBioPortal. According to the level of expression of each gene, the patients were divided into a high-expression group and a low-expression group based on the cutoff which was designated using Cutoff finder [Citation57]. Survival analyses were performed with Log-rank test using GraphPad Prism. To study correlation between two genes in glioma patients, transcriptome data for TCGA-GBM-LGG datasets from GlioVis [Citation58] was downloaded and linear correlation analysis of log transformed expression values were performed using GraphPad Prism. Similarly, volcano plots were plotted to show the top and bottom 200 correlated genes with the gene of interest using GraphPad Prism.
Luciferase reporter assay
Luciferase reporter gene assays were performed using cells after transfection/treatment with different combinations as described previously [Citation55]. Briefly, WT IDH1 and IDH1R132H cells were transfected with 300 ng of WT PTX3 or PTX3Δ luciferase constructs using Lipofectamine 3000 transfection reagent. Cells were co-transfected with 20 ng of Renilla luciferase vector, pRL-TK (Promega, E2241) for normalization of transfection efficiency. Cell lysates were analyzed with Dual-luciferase reporter assay system (Promega, E1960) on Glomax Explorer Multimode Microplate Reader (Promega).
Detection of autophagic vacuoles by MDC staining
Acidic autophagic vacuoles were detected using monodansylcadaverine (MDC; Sigma-Aldrich, 30,432) staining [Citation59]. Briefly, cells under different treatment conditions were incubated with 0.05 mM MDC dye in PBS (137 mM NaCl, 2.7 mM KCl, 10 mM Na2HPO4, 1.8 mM KH2PO4, pH 7.0) at 37°C for 10 min. Following the incubation, cells were washed with PBS and examined by fluorescence microscopy on Nikon Eclipse Ti2 microscope using 100 × 1.4 NA oil immersion objective at excitation wavelength of 380 nm. For fluorometric analysis of MDC staining, following incubation of cells with 0.05 mM MDC dye in PBS at 37°C for 10 min, cells were washed with PBS and incubated with 10 mM Tris-HCl, pH 8.0 containing 0.1% Triton X-100 for 10 min. The intracellular MDC was measured using Infinite M200 Pro microplate reader (TECAN) (Excitation/Emission: 380/520 nm). To normalize the values with the number of cells present in each well, 0.2 µM ethidium bromide was added and DNA fluorescence was measured (Excitation/Emission: 530/590 nm). The MDC fluorescence intensities were expressed as fold change respective to the corresponding controls.
Confocal imaging and analysis
Cells were either co-transfected with pBABE-puro mCherry-EGFP-LC3B and WT PTX3 or PTX3N220Q or treated with rhPTX3. After 24 h of treatment or transfection, cells were washed with PBS and then fixed in 4% formaldehyde. Following washes after fixation, the cells were mounted in Vectashield Antifade Mounting Medium with DAPI (Vector Laboratories Inc., H-1200). The slides were then imaged with Nikon A1R confocal microscope configured with Nikon Eclipse Ti2, controlled by NIS-Elements software. Z-stacks images of 1024 × 1024 pixel per frame, with a step-size of 0.5 µm were captured. Line averaging was set to 2 and signals were collected sequentially in three-channel mode. For analysis, the fluorescence images were deconvolved with ImageJ [Citation60]. The number of puncta GFP+ mCherry+ (yellow) or GFP – mCherry+ (red) were counted using the merged images from red and green channels. The number of yellow and red puncta were then plotted in each experimental condition.
Immunohistochemistry and image analysis
Immunohistochemistry in IDH1 wild-type and mutant glioblastoma patients was performed as described previously [Citation37]. Histologically confirmed sections from All India Institute of Medical Sciences (AIIMS), New Delhi, India were obtained as per the guidelines of the Institutional Human Ethics Committees. Formalin fixed paraffin embedded tissue sections were deparaffinized in xylene followed by rehydration in graded alcohols. This was followed by antigen retrieval in sodium-citrate buffer (pH 6.0) at 100°C. After quenching the endogenous peroxidase activity with 1% H2O2, the tissue sections were permeabilized using 0.1% Triton X-100. Followed by blocking with the respective serum, sections were incubated in rabbit monoclonal or polyclonal antibody to PRMT1, H4R3me2a, YY1, PTX3, LC3B or SQSTM1; overnight at 4°C in a humidified chamber. After incubation, the sections were washed with PBS and incubated with biotinylated anti-rabbit antibody for the proteins, at room temperature in a humidified chamber. Thereafter, the sections were processed with VECTASTAIN Elite ABC-HRP kit (Vector Laboratories Inc., PK-6100), counterstained with hematoxylin, followed by dehydration in graded alcohols and mounting in DPX. The tissue sections were imaged using Leica DMRXA2 microscope equipped with Leica Application Suite software. Images were quantified using IHC profiler plugin for ImageJ [Citation61]. Using the plugin, staining intensities in the images were divided into four scores: 0, negative staining; 1, low positive staining; 2, positive staining and, 3, high positive staining. H-scores were calculated using the formula – (3×% of high positive) + (2×% of positive) + (1×% of low positive).
Transmission electron microscopy
Cells under different treatment conditions were pelleted, washed in PBS and fixed with Karnovsky fixative (composition:2% paraformaldehyde, 2.5% glutaraldehyde, and 0.1 M sodium phosphate buffer, pH 7.2) for 45 min at 4°C. After fixation, cells were pelleted, washed with 0.1 M sodium phosphate buffer (pH 7.2) and fixed in osmium tetroxide followed by dehydration and embedding. Thin sections were cut and after staining with uranyl acetate and lead citrate, the sections were examined with a JEM1400 Flash transmission electron microscope, equipped with sCMOS camera.
ROS assay
Intracellular ROS levels in the cells were measured using dihydroethidium (DHE; Sigma-Aldrich, D7008) dye as previously described [Citation62]. Briefly, upon different treatment or transfections, cells were stained with 1 µM DHE in serum-free medium for 40 min at 37°C. Following PBS washes after the incubation, fluorescence intensity was measured at 535 nm wavelength using an Infinite M200PRO (Tecan) microplate plate reader.
Iron colorimetric assay
The intracellular iron levels in cell lysates were assessed using an iron colorimetric assay kit (BioVision, K390-100) according to the manufacturer’s instructions. In this assay, the ferric carrier protein dissociates ferric ions into the solution. After reduction the ferrous form of iron reacts with Ferene S to produce a stable-colored complex. Total iron levels were obtained by measuring the absorbance at 593 nm in a microplate reader.
MTS assay
Viability of cells was assessed using MTS assay (Promega, G3580) as described [Citation62]. Cells grown in 96-well plates were subjected to different treatment conditions. Following incubation with MTS solution for 4 h at 37°C, the absorbance was measured at 490 nm. Values from the assay were expressed as a percentage or fold change relative to control.
Statistical analysis
All comparisons between two groups were performed by using two-tailed Student’s t-test unless otherwise stated. Comparison among multiple groups were carried out using one-way ANOVA with Tukey’s multiple comparison test. All P-values of < 0.05 were considered significant where *P < 0.05, **P < 0.01, ***P < 0.001 and ****P < 0.0001.
Supplemental Material
Download MS Word (4.3 MB)Acknowledgments
We acknowledge the help of Shanker Datt Joshi with immunohistochemistry experiments and Rajesh Kumar Kumawat for technical assistance. We are thankful to Dr. Chinmay K. Mukhopadhyay (Jawaharlal Nehru University, New Delhi, India) for his valuable suggestions and for providing antibodies.
Disclosure statement
The authors declare no competing or financial interests.
Supplementary material
Supplemental data for this article can be accessed online at https://doi.org/10.1080/15548627.2023.2165757
Additional information
Funding
References
- Yan H, Parsons DW, Jin G, et al. IDH1 and IDH2 mutations in gliomas. N Engl J Med. 2009 Feb 19;360(8):765–773.
- Cheng HB, Yue W, Xie C, et al. IDH1 mutation is associated with improved overall survival in patients with glioblastoma: a meta-analysis. Tumour Biol. 2013 Dec;34(6):3555–3559.
- Bleeker FE, Atai NA, Lamba S, et al. The prognostic IDH1(R132) mutation is associated with reduced NADP+-dependent IDH activity in glioblastoma. Acta Neuropathol. 2010;119(4):487–494.
- Sasaki M, Knobbe CB, Munger JC, et al. IDH1(R132H) mutation increases murine haematopoietic progenitors and alters epigenetics. Nature. 2012 Aug 30;488(7413):656–659.
- Phillips RE, Soshnev AA, Allis CD. Epigenomic reprogramming as a driver of malignant glioma. Cancer Cell. 2020 Nov 9;38(5):647–660.
- Turcan S, Rohle D, Goenka A, et al. IDH1 mutation is sufficient to establish the glioma hypermethylator phenotype. Nature. 2012 Feb 15;483(7390):479–483.
- Gilbert MR, Liu Y, Neltner J, et al. Autophagy and oxidative stress in gliomas with IDH1 mutations. Acta Neuropathol. 2014 Feb;127(2):221–233.
- Yang Y, Bedford MT. Protein arginine methyltransferases and cancer. Nat Rev Cancer. 2013 Jan;13(1):37–50.
- Wang S, Tan X, Yang B, et al. The role of protein arginine-methyltransferase 1 in gliomagenesis. BMB Rep. 2012 Aug;45(8):470–475.
- Giacomini A, Ghedini GC, Presta M, et al. Long pentraxin 3: a novel multifaceted player in cancer. Biochim Biophys Acta Rev Cancer. 2018 Jan;1869(1):53–63.
- Han B, Mura M, Andrade CF, et al. TNFα-induced long pentraxin PTX3 expression in human lung epithelial cells via JNK. J Immunol. 2005 Dec 15;175(12):8303–8311.
- Locatelli M, Ferrero S, Martinelli Boneschi F, et al. The long pentraxin PTX3 as a correlate of cancer-related inflammation and prognosis of malignancy in gliomas. J Neuroimmunol. 2013 Jul 15;260(1–2):99–106.
- Inforzato A, Peri G, Doni A, et al. Structure and function of the long pentraxin PTX3 glycosidic moiety: fine-tuning of the interaction with C1q and complement activation. Biochemistry. 2006 Sep 26;45(38):11540–11551.
- Thomas C, Henry W, Cuiffo BG, et al. Pentraxin-3 is a PI3K signaling target that promotes stem cell-like traits in basal-like breast cancers. Sci Signal. 2017 Feb 21;10(467).
- Stallone G, Cormio L, Netti GS, et al. Pentraxin 3: a novel biomarker for predicting progression from prostatic inflammation to prostate cancer. Cancer Res. 2014 Aug 15;74(16):4230–4238.
- Wang Z, Wang X, Zhang N, et al. Pentraxin 3 promotes glioblastoma progression by negative regulating cells autophagy. Front Cell Dev Biol. 2020;8:795.
- Wang Y, Zhao W, Xiao Z, et al. A risk signature with four autophagy-related genes for predicting survival of glioblastoma multiforme. J Cell Mol Med. 2020 Apr;24(7):3807–3821.
- Alvarez-Meythaler JG, Garcia-Mayea Y, Mir C, et al. Autophagy takes center stage as a possible cancer hallmark. Front Oncol. 2020;10:586069.
- Hou W, Xie Y, Song X, et al. Autophagy promotes ferroptosis by degradation of ferritin. Autophagy. 2016 Aug 2;12(8):1425–1428.
- Wang TX, Liang JY, Zhang C, et al. The oncometabolite 2-hydroxyglutarate produced by mutant IDH1 sensitizes cells to ferroptosis. Cell Death Dis. 2019 Oct 7;10(10):755.
- Sun Q, Liu L, Roth M, et al. PRMT1 upregulated by epithelial proinflammatory cytokines participates in COX2 expression in fibroblasts and chronic antigen-induced pulmonary inflammation. J Immunol. 2015 Jul 1;195(1):298–306.
- Hwang HJ, Ha H, Lee BS, et al. LC3B is an RNA-binding protein to trigger rapid mRNA degradation during autophagy. Nat Commun. 2022 Mar 17;13(1):1436.
- Huang BW, Ray PD, Iwasaki K, et al. Transcriptional regulation of the human ferritin gene by coordinated regulation of Nrf2 and protein arginine methyltransferases PRMT1 and PRMT4. FASEB J. 2013 Sep;27(9):3763–3774.
- Favia A, Salvatori L, Nanni S, et al. The protein arginine methyltransferases 1 and 5 affect Myc properties in glioblastoma stem cells. Sci Rep. 2019 Nov 4;9(1):15925.
- Dong F, Li Q, Yang C, et al. PRMT2 links histone H3R8 asymmetric dimethylation to oncogenic activation and tumorigenesis of glioblastoma. Nat Commun. 2018 Oct 31;9(1):4552.
- Rezai-Zadeh N, Zhang X, Namour F, et al. Targeted recruitment of a histone H4-specific methyltransferase by the transcription factor YY1. Genes Dev. 2003 Apr 15;17(8):1019–1029.
- Tikhanovich I, Kuravi S, Artigues A, et al. Dynamic arginine methylation of tumor necrosis factor (TNF) receptor-associated factor 6 regulates toll-like receptor signaling. J Biol Chem. 2015 Sep 4;290(36):22236–22249.
- Huerta-Yepez S, Vega M, Garban H, et al. Involvement of the TNF-alpha autocrine-paracrine loop, via NF-kappaB and YY1, in the regulation of tumor cell resistance to Fas-induced apoptosis. Clin immunol (Orlando, Fla). 2006 Sep;120(3):297–309.
- Tikhanovich I, Zhao J, Bridges B, et al. Arginine methylation regulates c-Myc-dependent transcription by altering promoter recruitment of the acetyltransferase p300. J Biol Chem. 2017 Aug 11;292(32):13333–13344.
- Viswanath P, Radoul M, Izquierdo-Garcia JL, et al. 2-hydroxyglutarate-mediated autophagy of the endoplasmic reticulum leads to an unusual downregulation of phospholipid biosynthesis in mutant IDH1 gliomas. Cancer Res. 2018 May 1;78(9):2290–2304.
- Pankiv S, Clausen TH, Lamark T, et al. p62/SQSTM1 binds directly to Atg8/LC3 to facilitate degradation of ubiquitinated protein aggregates by autophagy. J Biol Chem. 2007 Aug 17;282(33):24131–24145.
- Fang J, Chen Q, He B, et al. Tanshinone IIA attenuates TNF-alpha induced PTX3 expression and monocyte adhesion to endothelial cells through the p38/NF-kappaB pathway. Food Chem Toxicol. 2018;121:622–630.
- Biederbick A, Kern HF, Elsasser HP. Monodansylcadaverine (MDC) is a specific in vivo marker for autophagic vacuoles. Eur J Cell Biol. 1995 Jan;66(1):3–14.
- Park E, Chung SW. ROS-mediated autophagy increases intracellular iron levels and ferroptosis by ferritin and transferrin receptor regulation. Cell Death Dis. 2019 Oct 28;10(11):822.
- Guan Z, Chen J, Li X, et al. Tanshinone IIA induces ferroptosis in gastric cancer cells through p53-mediated SLC7A11 down-regulation. Biosci Rep. 2020;40(28):Aug.
- Santana-Codina N, Gikandi A, Mancias JD. The role of NCOA4-mediated ferritinophagy in ferroptosis. Adv Exp Med Biol. 2021;1301:41–57.
- Patrick S, Gowda P, Lathoria K, et al. YAP1-mediated regulation of mitochondrial dynamics in IDH1 mutant gliomas. J Cell Sci. 2021 Nov 15;134(22).
- Guccione E, Richard S. The regulation, functions and clinical relevance of arginine methylation. Nat Rev Mol Cell Biol. 2019 Oct;20(10):642–657.
- Huang S, Litt M, Felsenfeld G. Methylation of histone H4 by arginine methyltransferase PRMT1 is essential in vivo for many subsequent histone modifications. Genes Dev. 2005 Aug 15;19(16):1885–1893.
- Noushmehr H, Weisenberger DJ, Diefes K, et al. Identification of a CpG island methylator phenotype that defines a distinct subgroup of glioma. Cancer Cell. 2010 May 18;17(5):510–522.
- Aoki H, Kondo Y, Aldape K, et al. Monitoring autophagy in glioblastoma with antibody against isoform B of human microtubule-associated protein 1 light chain 3. Autophagy. 2008 May;4(4):467–475.
- Shchors K, Massaras A, Hanahan D. Dual targeting of the autophagic regulatory circuitry in gliomas with repurposed drugs elicits cell-lethal autophagy and therapeutic benefit. Cancer Cell. 2015 Oct 12;28(4):456–471.
- Choi S, Jeong HJ, Kim H, et al. Skeletal muscle-specific Prmt1 deletion causes muscle atrophy via deregulation of the PRMT6-FOXO3 axis. Autophagy. 2019 Jun;15(6):1069–1081.
- Tateishi K, Wakimoto H, Iafrate AJ, et al. Extreme vulnerability of IDH1 mutant cancers to NAD+ depletion. Cancer Cell. 2015 Dec 14;28(6):773–784.
- Giuliani V, Miller MA, Liu CY, et al. PRMT1-dependent regulation of RNA metabolism and DNA damage response sustains pancreatic ductal adenocarcinoma. Nat Commun. 2021 Jul 30;12(1):4626.
- Song X, Liu J, Kuang F, et al. PDK4 dictates metabolic resistance to ferroptosis by suppressing pyruvate oxidation and fatty acid synthesis. Cell Rep. 2021 Feb 23;34(8):108767.
- Calvert AE, Chalastanis A, Wu Y, et al. Cancer-associated IDH1 promotes growth and resistance to targeted therapies in the absence of mutation. Cell Rep. 2017 May 30;19(9):1858–1873.
- Gowda P, Patrick S, Singh A, et al. Mutant isocitrate dehydrogenase 1 disrupts PKM2-beta-catenin-BRG1 transcriptional network-driven CD47 expression. Mol Cell Biol. 2018 May 1;38:9.
- Rodrigues PF, Matarazzo S, Maccarinelli F, et al. Long pentraxin 3-mediated fibroblast growth factor trapping impairs fibrosarcoma growth. Front Oncol. 2018;8:472.
- Sheikh T, Sen E. p53 affects epigenetic signature on SOCS1 promoter in response to TLR4 inhibition. Cytokine. 2021 Apr;140:155418.
- Zhang J, Koussih L, Shan L, et al. TNF up-regulates Pentraxin3 expression in human airway smooth muscle cells via JNK and ERK1/2 MAPK pathways. Allergy Asthma Clin Immunol. 2015;11:37.
- Dhar S, Vemulapalli V, Patananan AN, et al. Loss of the major Type I arginine methyltransferase PRMT1 causes substrate scavenging by other PRMTs. Sci Rep. 2013;3:1311.
- Weintraub AS, Li CH, Zamudio AV, et al. YY1 is a structural regulator of enhancer-promoter loops. Cell. 2017 Dec 14;171(7):1573–1588 e28.
- N’Diaye EN, Kajihara KK, Hsieh I, et al. PLIC proteins or ubiquilins regulate autophagy-dependent cell survival during nutrient starvation. EMBO Rep. 2009 Feb;10(2):173–179.
- Ghosh S, Paul A, Sen E. Tumor necrosis factor alpha-induced hypoxia-inducible factor 1alpha-beta-catenin axis regulates major histocompatibility complex class I gene activation through chromatin remodeling. Mol Cell Biol. 2013 Jul;33(14):2718–2731.
- Gao J, Aksoy BA, Dogrusoz U, et al. Integrative analysis of complex cancer genomics and clinical profiles using the cBioPortal. Sci Signal. 2013 Apr 2;6(269): pl1.
- Budczies J, Klauschen F, Sinn BV, et al. Cutoff Finder: a comprehensive and straightforward Web application enabling rapid biomarker cutoff optimization. PLoS One. 2012;7(12):e51862.
- Bowman RL, Wang Q, Carro A, et al. GlioVis data portal for visualization and analysis of brain tumor expression datasets. Neuro Oncol. 2017 Jan;19(1):139–141.
- Munafo DB, Colombo MI. A novel assay to study autophagy: regulation of autophagosome vacuole size by amino acid deprivation. J Cell Sci. 2001 Oct;114(Pt 20):3619–3629.
- Schneider CA, Rasband WS, Eliceiri KWNIH. Image to ImageJ: 25 years of image analysis. Nat Methods. 2012 Jul;9(7):671–675.
- Varghese F, Bukhari AB, Malhotra R, et al. IHC Profiler: an open source plugin for the quantitative evaluation and automated scoring of immunohistochemistry images of human tissue samples. PLoS One. 2014;9(5):e96801.
- Dixit D, Sharma V, Ghosh S, et al. Manumycin inhibits STAT3, telomerase activity, and growth of glioma cells by elevating intracellular reactive oxygen species generation. Free Radic Biol Med. 2009 Aug 15;47(4):364–374.