
ABSTRACT
There are diverse links between macroautophagy/autophagy pathways and unfolded protein response (UPR) pathways under endoplasmic reticulum (ER) stress conditions to restore ER homeostasis. Phosphorylation of EIF2S1/eIF2α is an important mechanism that can regulate all three UPR pathways through transcriptional and translational reprogramming to maintain cellular homeostasis and overcome cellular stresses. In this study, to investigate the roles of EIF2S1 phosphorylation in regulation of autophagy during ER stress, we used EIF2S1 phosphorylation-deficient (A/A) cells in which residue 51 was mutated from serine to alanine. A/A cells exhibited defects in several steps of autophagic processes (such as autophagosome and autolysosome formation) that are regulated by the transcriptional activities of the autophagy master transcription factors TFEB and TFE3 under ER stress conditions. EIF2S1 phosphorylation was required for nuclear translocation of TFEB and TFE3 during ER stress. In addition, EIF2AK3/PERK, PPP3/calcineurin-mediated dephosphorylation of TFEB and TFE3, and YWHA/14-3-3 dissociation were required for their nuclear translocation, but were insufficient to induce their nuclear retention during ER stress. Overexpression of the activated ATF6/ATF6α form, XBP1s, and ATF4 differentially rescued defects of TFEB and TFE3 nuclear translocation in A/A cells during ER stress. Consequently, overexpression of the activated ATF6 or TFEB form more efficiently rescued autophagic defects, although XBP1s and ATF4 also displayed an ability to restore autophagy in A/A cells during ER stress. Our results suggest that EIF2S1 phosphorylation is important for autophagy and UPR pathways, to restore ER homeostasis and reveal how EIF2S1 phosphorylation connects UPR pathways to autophagy.
Abbreviations: A/A: EIF2S1 phosphorylation-deficient; ACTB: actin beta; Ad-: adenovirus-; ATF6: activating transcription factor 6; ATZ: SERPINA1/α1-antitrypsin with an E342K (Z) mutation; Baf A1: bafilomycin A1; BSA: bovine serum albumin; CDK4: cyclin dependent kinase 4; CDK6: cyclin dependent kinase 6; CHX: cycloheximide; CLEAR: coordinated lysosomal expression and regulation; Co-IP: coimmunoprecipitation; CTSB: cathepsin B; CTSD: cathepsin D; CTSL: cathepsin L; DAPI: 4’,6-diamidino-2-phenylindole dihydrochloride; DMEM: Dulbecco’s modified Eagle’s medium; DMSO: dimethyl sulfoxide; DTT: dithiothreitol; EBSS: Earle’s Balanced Salt Solution; EGFP: enhanced green fluorescent protein; EIF2S1/eIF2α: eukaryotic translation initiation factor 2 subunit alpha; EIF2AK3/PERK: eukaryotic translation initiation factor 2 alpha kinase 3; ER: endoplasmic reticulum; ERAD: endoplasmic reticulum-associated degradation; ERN1/IRE1α: endoplasmic reticulum to nucleus signaling 1; FBS: fetal bovine serum; gRNA: guide RNA; GSK3B/GSK3β: glycogen synthase kinase 3 beta; HA: hemagglutinin; Hep: immortalized hepatocyte; IF: immunofluorescence; IRES: internal ribosome entry site; KO: knockout; LAMP1: lysosomal associated membrane protein 1; LMB: leptomycin B; LPS: lipopolysaccharide; MAP1LC3A/B/LC3A/B: microtubule associated protein 1 light chain 3 alpha/beta; MAP1LC3B/LC3B: microtubule associated protein 1 light chain 3 beta; MEFs: mouse embryonic fibroblasts; MFI: mean fluorescence intensity; MTORC1: mechanistic target of rapamycin kinase complex 1; NES: nuclear export signal; NFE2L2/NRF2: NFE2 like bZIP transcription factor 2; OE: overexpression; PBS: phosphate-buffered saline; PLA: proximity ligation assay; PPP3/calcineurin: protein phosphatase 3; PTM: post-translational modification; SDS: sodium dodecyl sulfate; SDS-PAGE: sodium dodecyl sulfate-polyacrylamide gel electrophoresis; SEM: standard error of the mean; TEM: transmission electron microscopy; TFE3: transcription factor E3; TFEB: transcription factor EB; TFs: transcription factors; Tg: thapsigargin; Tm: tunicamycin; UPR: unfolded protein response; WB: western blot; WT: wild-type; Xbp1s: spliced Xbp1; XPO1/CRM1: exportin 1.
Introduction
EIF2S1/eIF2α (eukaryotic translation initiation factor 2 subunit alpha) is a subunit of the EIF2 complex, which facilitates the placement of an initiator tRNA (methionyl-tRNAi) onto the P site of the 40S ribosomal subunit during the translation initiation of cytoplasmic mRNAs in eukaryotic cells [Citation1]. EIF2 complex activity is regulated by EIF2S1 phosphorylation, which occurs on serine 51 (S51) and is mediated by four kinases (EIF2AK1/HRI, EIF2AK2/PKR, EIF2AK3/PERK, and EIF2AK4/GCN2) in response to diverse cellular stresses including heme deficiency, oxidative stress, viral infection, endoplasmic reticulum (ER) stress, and amino acid deficiency [Citation2–4]. EIF2S1 phosphorylation transiently attenuates the translation of most mRNAs but promotes the translation of selected mRNAs, including the transcripts of TF (transcription factor) genes (Atf4, Ddit3/Chop, Atf5, Cebpa/C/ebp and Cebpb/C/ebp), nutrient metabolism-related genes (Slc7a1/Cat1, Slc35a4, and Eprs), a phosphatase regulatory subunit gene (Ppp1r15a/Gadd34), and cellular adaptation-related genes (Ibtk/Ibtk and Cpeb4) [Citation5,Citation6]. These signaling programs allow cells to conserve resources and initiate adaptive gene expression to restore cellular homeostasis, referred to as the integrated stress response [Citation3,Citation7,Citation8].
Eukaryotic cells cope with ER stress by activating the unfolded protein response (UPR), which is initiated by three main UPR sensors (ERN1/IRE1 [endoplasmic reticulum to nucleus signaling 1], ATF6 [activating transcription factor 6], and EIF2AK3/PERK [eukaryotic translation initiation factor 2 alpha kinase 3]) [Citation9,Citation10]. ERN1 has ER stress-regulated kinase and endonuclease activities that can initiate unconventional splicing of Xbp1 mRNA to remove a 26-nucleotide intron and then introduce a translational frameshift. Spliced Xbp1 (Xbp1s) mRNA encodes a potent TF (XBP1s) that induces transcription of genes encoding proteins that facilitate protein folding, secretion, and degradation in response to ER stress [Citation9,Citation10]. ATF6 is a TF encoded by two related genes, Atf6 and Atf6b [Citation11]. Upon ER stress, it translocates to the Golgi apparatus, where it is cleaved by site-1 protease and site-2 protease. The cleaved N-terminal cytosolic domain of ATF6 (hereafter referred to as “the activated ATF6 form”) then translocates into the nucleus, where it binds to ER stress-response elements and thereby activates target genes that encode proteins with functions in ER protein folding, endoplasmic reticulum-associated degradation (ERAD), protein secretion, and ER biogenesis [Citation11,Citation12]. EIF2AK3 is the major protein responsible for attenuation of mRNA translation via EIF2S1 phosphorylation, reducing the protein burden within the ER. Paradoxically, EIF2AK3-mediated EIF2S1 phosphorylation upregulates the translation of several mRNAs as described above. Among them, translation of Atf4 mRNA is crucial for upregulation of genes involved in redox homeostasis, amino acid metabolism, protein folding, and protein synthesis [Citation5,Citation9]. In addition, crosstalk can occur between the EIF2AK3-EIF2S1 phosphorylation-ATF4 pathway and other UPR pathways (ERN1-XBP1- and ATF6-mediated UPR pathways). Phosphorylation of EIF2S1 is required for maximal induction of XBP1s protein by stabilizing its mRNA [Citation13], and for activation of ATF6 by facilitating its trafficking from the ER to the Golgi in response to ER stress [Citation14]. Thus, phosphorylation of EIF2S1 affecting activation of all three UPR pathways is responsible for transcriptional as well as translational reprogramming to help cells maintain cellular homeostasis and overcome cellular stresses.
Macroautophagy (hereafter referred to as “autophagy”) is an evolutionarily conserved cellular process by which accumulating aberrant proteins or damaged subcellular organelles undergo lysosomal degradation [Citation15,Citation16]. In brief, autophagy includes five steps: initiation and phagophore nucleation, phagophore expansion, autophagosome maturation, autophagosome-lysosome fusion, and cargo degradation by lysosomal enzymes [Citation17,Citation18]. Numerous genes are required to perform these processes [Citation19–21]. Increasing evidence indicates that autophagy is regulated at the transcriptional level by several TFs, including TFEB (transcription factor EB), TFE3 (transcription factor E3), FOXO (forkhead box O), and E2F1 (E2 transcription factor 1) [Citation22–24]. TFEB is a member of the microphthalmia-associated TF family, which also includes MITF, TFE3, and TFEC [Citation25]. TFEB and TFE3 are believed to be the master regulators of the autolysosome pathway, and to control expression of genes required for autophagosome formation, lysosome biogenesis, and lysosome function by directly binding to promoters of the coordinated lysosomal expression and regulation (CLEAR) element [Citation20,Citation26,Citation27]. Diverse PTMs (post-translational modifications), including phosphorylation, regulate the activities of these TFs [Citation28–32]. Several kinases that phosphorylate TFEB and TFE3 have been identified. Among them, MTOR (mechanistic target of rapamycin kinase) complex 1 (MTORC1) is the best-studied [Citation33–36]. Under normal conditions, lysosomal MTORC1 phosphorylates TFEB (at S142 and S211) and TFE3 (at S321). Phosphorylated TFEB and TFE3 interact with YWHA/14-3-3, which results in sequestration of these TFs as inactive forms in the cytosol [Citation35–38]. Under starvation and other conditions when MTORC1 is inhibited and/or the Ca2+-CALM (calmodulin)-dependent protein phosphatase PPP3/calcineurin is activated, further phosphorylation of TFEB and TFE3 does not occur and their dephosphorylation is induced. This prevents binding to YWHA/14-3-3 and induces rapid accumulation of TFEB and TFE3 in the nucleus [Citation31,Citation39,Citation40]. However, recent reports suggest that nuclear translocation of TFEB and TFE3 is more complex than generally appreciated. For example, TFEB continuously shuttles between the cytosol and nucleus via nuclear export dependent on the XPO1/CRM1 (exportin 1) [Citation29,Citation30,Citation41]. XPO1 is an export receptor for leucine-rich nuclear export signals (NESs) [Citation29,Citation30,Citation42]. Therefore, whether TFEB is retained in the nucleus has been proposed to depend on the phosphorylation statuses of S142 and S138, which are localized in the proximity of a NES. Nuclear export is promoted by phosphorylation of S142 via MTORC1 and MAPK1/ERK2 (mitogen-activated protein kinase 1), under nutrient-rich conditions [Citation29,Citation30], or CDK4 (cyclin dependent kinase 4) and CDK6, during G1 phase [Citation41]. Moreover, phosphorylation of S142 primes TFEB for phosphorylation of S138 by GSK3B/GSK3β (glycogen synthase kinase 3 beta) [Citation30]. Therefore, the absence of S142 phosphorylation may lead to nuclear retention of TFEB and TFE3. Thus, the mechanisms governing the localization of TFEB and TFE3 in response to multiple signals are not fully understood.
Several studies have shown that the UPR induces autophagy to degrade unfolded and aggregated proteins and thereby restore ER homeostasis [Citation43–46], although excessive and prolonged ER stress may inhibit autophagy by impairing lysosomes [Citation47]. Several components of UPR signaling pathways transcriptionally upregulate genes encoding autophagy machinery, indicating a high level of crosstalk between ER stress and autophagy [Citation43–46]. Several lines of evidence suggest that EIF2S1 phosphorylation plays a key role in regulation of autophagy. EIF2AK3-EIF2S1 phosphorylation is reportedly involved in polyglutamine 72 repeat aggregate-induced autophagy [Citation48]. A nonphosphorylatable knock-in mutation (S51A) of EIF2S1 and dominant-negative EIF2AK3 inhibit polyglutamine 72 repeat-induced MAP1LC3/LC3 conversion. Induction of autophagic puncta by diverse pharmacological autophagy enhancers is also partially inhibited in homozygous EIF2S1S51A knock-in (A/A) mutant human osteosarcoma U2OS cells [Citation49]. Furthermore, the TFs ATF4 and DDIT3/CHOP, which are downstream targets of phosphorylated EIF2S1 are reportedly required to increase transcription of a set of autophagy genes (autophagosome formation, elongation, and function) under amino acid starvation or ER stress conditions [Citation50]. Thus, EIF2S1 phosphorylation may play a central role in autophagy in response to ER stress. Nevertheless, the molecular mechanisms involved in activation and regulation of autophagy through EIF2S1 phosphorylation remain unclear.
In the present study, we revealed that EIF2S1 phosphorylation plays an essential role in nuclear translocation of TFEB and TFE3. Dephosphorylation (at both S211 and S142) of TFEB and its dissociation from YWHA were insufficient for its nuclear translocation in EIF2S1 phosphorylation-deficient (A/A) cells during ER stress. Instead, overexpression (OE) of the activated ATF6 form, XBP1s, and ATF4, production of which was significantly reduced and delayed in A/A cells during ER stress, differentially rescued defects of TFEB and TFE3 nuclear translocation in A/A cells during ER stress. Consequently, OE of the activated ATF6 or TFEB form more efficiently restored autophagy, although XBP1s and ATF4 also displayed an ability to restore autophagy in A/A cells during ER stress. Our data highlight a new mechanism controlling the subcellular localization and activity of TFEB via EIF2S1 phosphorylation-dependent components of UPR signaling pathways under ER stress conditions.
Results
Deficiency of EIF2S1 phosphorylation dysregulates expression of autophagy and UPR genes during ER stress
We investigated whether EIF2S1 phosphorylation contributes to expression of not only UPR gene but also macroautophagy/autophagy genes during ER stress. Wild-type (WT) and EIF2S1 phosphorylation-deficient immortalized mouse embryonic hepatocytes (S/SHep and A/AHep, respectively) [Citation51] were treated with the ER stress inducer tunicamycin (Tm) for the indicated durations. Expression levels of proteins and mRNA transcripts of UPR and autophagy genes in A/AHep cells were compared with those in S/SHep cells. As reported previously [Citation13,Citation51–53], under ER stress conditions, phosphorylated forms of the UPR sensors EIF2AK3 and ERN1 were immediately observed, and their phosphorylation persisted until 24 h in both S/SHep and A/AHep cells treated with Tm ( left panels). By contrast, cleavage of the other UPR sensor ATF6 (ATF6 and ATF6 was diminished and delayed in A/AHep cells compared with S/SHep cells ( right panels and Fig. S1A, B) as reported previously [Citation14], indicating that the initiation mechanism of UPR pathways is partly impaired in A/AHep cells. Furthermore, as shown in several reports, the expression levels of proteins (ATF4 and DDIT3) and mRNAs (Atf4, Ddit3, Ppp1r15a, Asns, and Cth) encoded by EIF2AK3 pathway genes [Citation7,Citation53], a protein (XBP1s) and mRNA (Xbp1s) encoded by a ERN1 pathway gene [Citation13], and proteins (HSP90B1/GRP94 and HSPA5/BiP) and mRNA (Hspa5/BiP) encoded by ATF6 downstream genes [Citation14,Citation54] were significantly reduced in A/AHep cells under Tm-induced ER stress conditions (). Thus, we showed that EIF2S1 phosphorylation is required for cleavage-mediated activation of the UPR sensor ATF6 and expression of multiple genes in all three UPR pathways.
Figure 1. Protein and mRNA expression of autophagy and UPR genes is dysregulated in A/A cells during ER stress. (A) WB analysis of UPR proteins in lysates of S/SHep and A/AHep cells treated with Tm (1 µg/mL) for the indicated durations. ATF6(F): full-length glycosylated ATF6; ATF6(F*): full-length unglycosylated ATF6; ATF6(N): cleaved N-terminal fragment of ATF6; ATF6B(F): full-length glycosylated ATF6B; ATF6B(F*): full-length unglycosylated ATF6B; ATF6B(N*) and ATF6B(N): cleaved N-terminal fragments of ATF6B. The identities of bands indicated in the ATF6 and ATF6B WB analysis were validated by WB analysis (Fig. S1) of atf6 KO and atf6 atf6b double KO cell lines using the same ATF6- and ATF6B-specific antibodies. (B and C) Quantitative RT-PCR analysis of mRNA expression of ER stress response (B) and autophagy (C) genes in S/SHep and A/AHep cells treated with Tm (1 µg/mL) for the indicated durations. Data are presented as mean ± SEM of three independent experiments (two-way ANOVA with Sidak’s post hoc test) (D) WB analysis of autophagy proteins in lysates of S/SHep and A/AHep cells treated with Tm (1 µg/mL) for the indicated durations. CTSB: cathepsin B; CTSL: cathepsin L; Pro: procathepsin; Sc: mature single-chain cathepsin; Dc: heavy chain of mature double-chain cathepsin.
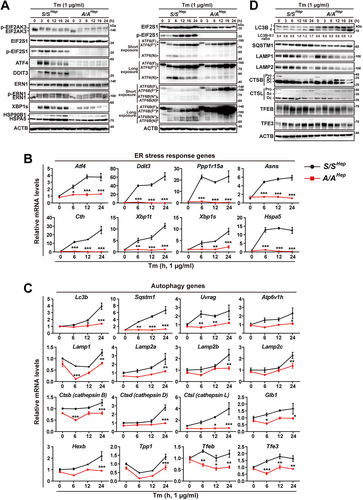
In WT (S/SHep) cells, Tm treatment gradually increased the mRNA levels of most examined autophagy genes and the levels of some autophagosome proteins (LC3B-II and SQSTM1/p62), whereas the levels of lysosomal proteins (LAMP1 and 2, and cathepsin B and L) were decreased at late time points (12, 16, and 24 h) of Tm treatment (). The mRNA and protein levels of most examined autophagy genes, except for LC3B-I/II proteins, were lower in A/AHep cells than in S/SHep cells at most time points (). Although the LC3B-I/II protein levels were higher in A/AHep cells than in S/SHep cells at all-time points, LC3B conversion (LC3B-II:I ratio) was lower in A/AHep cells than in S/SHep cells at most time points (), suggesting that EIF2S1 phosphorylation plays an important role in autophagy pathways. Thus, deficiency of EIF2S1 phosphorylation dysregulates expression of not only UPR genes but also autophagy genes during ER stress.
Autophagy is defective in A/A cells during ER stress
We further investigated whether deficiency of EIF2S1 phosphorylation affects autophagy resulting from Tm-induced ER stress. Formation of autophagosomes and autolysosomes was analyzed in immortalized mouse embryonic hepatocytes treated with Tm (). In WT (S/SHep) cells, Tm treatment strongly increased the number of MAP1LC3A/B/LC3A/B-positive puncta ( left lower panels, and first row second panel), suggesting that ER stress-mediated autophagy induction occurs as previously reported [Citation55–57]. However, there were few prominent LC3A/B-positive puncta in Tm-treated A/AHep cells ( graph and right lower panels, and first row fourth panel). In addition, most LC3A/B-positive structures were smaller in Tm-treated A/AHep cells than in Tm-treated S/SHep cells ( graph and lower panels, and first row). Immunofluorescence (IF) signals of LC3A/B were largely concentrated in the perinuclear regions of Tm-treated A/AHep cells ( graph and right lower panels, and first row fourth panel). Furthermore, these signals colocalized with IF signals of the KDEL-motif-containing ER proteins (HSPA5 and HSP90B1), suggesting that LC3A/B is mislocalized in the ER membrane due to deficiency of EIF2S1 phosphorylation during ER stress (). Next, we observed the subcellular colocalizations of LC3A/B (an autophagosome marker) and the cargo receptor SQSTM1 (a cargo marker) to investigate formation of autophagosomes (). In addition, we observed colocalization of LAMP1 (a lysosome marker) with SQSTM1 () and LC3A/B () to investigate formation of autolysosomes. Colocalization of LC3A/B with SQSTM1 was significantly increased in Tm-treated S/SHep cells ( left lower panels and left graph), indicating that Tm treatment increases autophagosome formation in S/SHep cells. Furthermore, an IF assay confirmed the colocalization of LAMP1 with SQSTM1 ( left lower panels and middle graph) and LC3A/B ( left lower panels and right graph), suggesting that Tm treatment increases autophagosome-lysosome fusion in S/SHep cells. However, colocalization of LC3A/B with SQSTM1 was significantly lower in A/AHep cells than in S/SHep cells under both normal and ER stress conditions ( lower panels and left graph). There were few SQSTM1- and LAMP1-positive puncta in Tm-treated A/AHep cells compared with Tm-treated S/SHep cells (). In addition, colocalization of LAMP1 with SQSTM1 ( lower panels and left graph) and LC3A/B ( lower panels and right graph) was significantly lower in Tm-treated A/AHep cells than in Tm-treated S/SHep cells, although Tm treatment slightly increased colocalization of LAMP1 with LC3A/B in A/AHep cells ( right graph). These results indicate that EIF2S1 phosphorylation is required for not only autophagosome formation, but also autolysosome formation during ER stress.
Figure 2. Autophagy is impaired in A/A cells during ER stress. (A) Representative IF images of LC3A/B in S/SHep and A/AHep cells treated with DMSO (vehicle) or Tm (1 µg/mL) for 24 h. The dotted white line defines the cell boundary. Scale bar: 20 µm. The graph depicts the fraction (%) of cells with different LC3A/B staining patterns (the “punctate” group represents cells with LC3A/B-positive puncta only, the “punctate + accumulated” group represents cells with both LC3A/B-positive puncta and condensed LC3A/B staining in the perinuclear region, the “accumulated” group represents cells with condensed LC3A/B staining only in the perinuclear region, and “no punctate + no accumulated” represents cells with neither LC3A/B-positive puncta nor condensed LC3A/B staining in the perinuclear region). Data are presented as mean ± SEM of three independent experiments (at least 150 cells per condition). (B) Representative IF images of an autophagosome marker (LC3A/B, green) and an ER marker (KDEL, red) in S/SHep and A/AHep cells treated with DMSO or Tm (1 µg/mL) for 24 h. Nuclei were stained with DAPI (blue). Scale bar: 20 µm. (C–E) Representative IF images of an autophagy marker (LC3A/B) or a cargo marker (SQSTM1) and a lysosome marker (LAMP1) in S/SHep and A/AHep cells treated with DMSO or Tm (1 µg/mL) for 24 h. Cells were fixed and costained with anti-LC3A/B (green) and anti-SQSTM1 (red) antibodies in (C), anti-SQSTM1 (green) and anti-LAMP1 (red) antibodies in (D), and anti-LC3A/B (green) and anti-LAMP1 (red) antibodies in (E). Nuclei were stained with DAPI (blue). The right panels are magnified images of the boxes in the left panels. Scale bars: left panels (20 µm) and right panels (10 µm). (F) Quantification of the colocalization of LC3A/B with SQSTM1 in (C) and LAMP1 with SQSTM1 or LC3A/B in (D and E). (G) Representative LysoTracker staining images of S/SHep and A/AHep cells. Cells were treated with Tm (1 µg/mL) for the indicated durations and stained with LysoTracker (100 nM, red) and Hoechst 33,258 (10 μg/mL, blue) for the last 30 min of the treatment. The dotted white line defines the cell boundary. Scale bar: 20 µm. (H) Quantification of the mean fluorescence intensity (MFI) of LysoTracker in (G). Data in the graphs in (F) and (H) are presented as mean ± SEM of three independent experiments (at least 150 cells per condition). A two-way ANOVA with Sidak’s post hoc test was used in the graphs in (F) and (H).
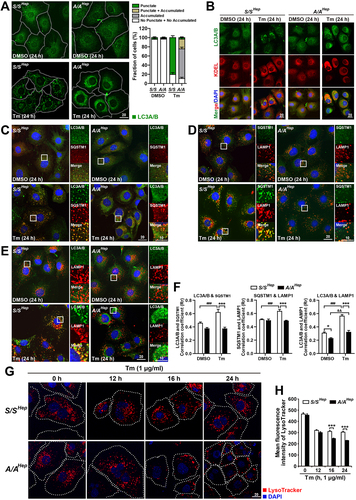
Defective lysosomal function contributes to dysregulation of autophagy [Citation19,Citation58]. We next examined lysosomal dysfunctions in A/AHep cells using the pH-sensitive dye LysoTracker Red, which specifically labels acidic vesicles such as functional lysosomes and autolysosomes. Consistent with a defect in autolysosome formation under ER stress conditions (), the number of LysoTracker-positive structures () and fluorescence intensity of LysoTracker () were decreased much more in A/AHep cells than in S/SHep cells upon Tm treatment, indicating that EIF2S1 phosphorylation is required to maintain functional lysosomes and autolysosomes during ER stress. Upon autophagy induction, lysosomes amass in the perinuclear region, and this increases autophagosome-lysosome fusion rates, whereas dispersion of lysosomes to the cell periphery reduces fusion rates [Citation59–61]. A/AHep cells exhibited peripherally accumulated lysosomes, whereas substantial numbers of lysosomes were predominantly found in the perinuclear region of S/SHep cells after treatment with Tm for 16 and 24 h as expected (). However, an IF assay of the lysosome marker LAMP1 revealed that LAMP1-positive lysosomal vesicles did not accumulate peripherally but were found everywhere in Tm-treated A/AHep cells (), indicating that only peripheral LAMP1-positive vesicles are acidic and functional in these cells. Therefore, the autophagosome-lysosome fusion rates will be decreased in Tm-treated A/AHep cells. These results suggest that EIF2S1 phosphorylation is important to maintain the activity and subcellular localization of lysosomes, which can affect formation of autolysosomes under ER stress conditions.
Autophagic flux and autophagic degradation of misfolded proteins are impaired in A/A cells
To fortify the association between EIF2S1 phosphorylation and autophagy in Tm-treated cells, we performed transmission electron microscopy (TEM) analysis of S/SHep and A/AHep cells treated with and without Tm. Autolysosomes accumulated in Tm-treated S/SHep cells, but not in Tm-treated A/AHep cells, while autophagosomes were hardly detected in S/SHep and A/AHep cells treated with and without Tm ( second row and ). These results confirmed that EIF2S1 phosphorylation deficiency inhibits the formation of autolysosomes under ER stress conditions. In addition, although both Tm-treated S/SHep and A/AHep cells had swollen and fragmented ER as previously reported [Citation62,Citation63], Tm-treated A/AHep cells had more excessively fragmented ER than Tm-treated S/SHep cells. In addition, the fragmented ER tubules were highly accumulated and looked like a compact mass in Tm-treated A/AHep cells ( third row and yellow dotted area in the Tm-treated A/AHep panel of first row), suggesting that deficiency of EIF2S1 phosphorylation also alters the ER structure during ER stress.
Figure 3. Autophagic flux is impaired in A/A cells during ER stress. (A) Representative TEM images of S/SHep and A/AHep cells treated with DMSO or Tm (1 µg/mL) for 24 h. The panels of the second (red) and third (yellow) rows are magnified images of the red and yellow boxes in the panels of the first row, respectively. Green arrowheads indicate autophagosomes, red arrowheads indicate autolysosomes, and yellow arrows indicate the ER. The dotted yellow line defines a mass of dilated and fragmented ER structures. Scale bars: first row 2 µm and second and third rows 0.5 µm. (B) Quantification of the number of autolysosomes per cell in the TEM images in (A). Data are presented as mean ± SEM of three independent experiments (at least 15 cells per condition). (C) WB analysis of LC3B in protein lysates of S/SHep and A/AHep cells. Cells were treated with DMSO or Tm (1 µg/mL) for 16 h in the absence or presence of the lysosomal inhibitor Baf A1 (200 nM) for 3 h before harvest. The graph depicts the LC3B-II level normalized to the ACTB level. Data are presented as mean ± SEM of three independent experiments. (D and E) WB analysis of SERPINA1/alpha-1-antitrypsin mutant Z (α1-AT [ATZ]) in protein lysates of S/SHep and A/AHep cells. Cells were transfected with the pcDNA3.1-α1-AT [ATZ] plasmid for 24 h. Transfected cells were treated with DMSO, the proteasome inhibitor MG132 only (20 µM) (C), the lysosomal inhibitor Baf A1 only (100 nM) (D), MG132 plus the translation inhibitor CHX (100 µg/mL) (C), or Baf A1 plus CHX (D) for the indicated durations. The graphs depict the ATZ level normalized to the ACTB level after treatment for 6 h. Data are presented as mean ± SEM of three independent experiments. (F) WB analysis of SQSTM1, an endogenous cargo of autophagy in protein lysates of S/SHep and A/AHep cells. S/SHep and A/AHep cells were treated with DMSO or Tm and then with MG132 (20 µM) only or MG132 plus CHX for the indicated durations before harvesting samples. The graphs depict the SQSTM1 level normalized to the ACTB level after treatment for 6 h. Data are presented as mean ± SEM of three independent experiments. A two-way ANOVA with Sidak’s post hoc test was used in (B)-(F).
![Figure 3. Autophagic flux is impaired in A/A cells during ER stress. (A) Representative TEM images of S/SHep and A/AHep cells treated with DMSO or Tm (1 µg/mL) for 24 h. The panels of the second (red) and third (yellow) rows are magnified images of the red and yellow boxes in the panels of the first row, respectively. Green arrowheads indicate autophagosomes, red arrowheads indicate autolysosomes, and yellow arrows indicate the ER. The dotted yellow line defines a mass of dilated and fragmented ER structures. Scale bars: first row 2 µm and second and third rows 0.5 µm. (B) Quantification of the number of autolysosomes per cell in the TEM images in (A). Data are presented as mean ± SEM of three independent experiments (at least 15 cells per condition). (C) WB analysis of LC3B in protein lysates of S/SHep and A/AHep cells. Cells were treated with DMSO or Tm (1 µg/mL) for 16 h in the absence or presence of the lysosomal inhibitor Baf A1 (200 nM) for 3 h before harvest. The graph depicts the LC3B-II level normalized to the ACTB level. Data are presented as mean ± SEM of three independent experiments. (D and E) WB analysis of SERPINA1/alpha-1-antitrypsin mutant Z (α1-AT [ATZ]) in protein lysates of S/SHep and A/AHep cells. Cells were transfected with the pcDNA3.1-α1-AT [ATZ] plasmid for 24 h. Transfected cells were treated with DMSO, the proteasome inhibitor MG132 only (20 µM) (C), the lysosomal inhibitor Baf A1 only (100 nM) (D), MG132 plus the translation inhibitor CHX (100 µg/mL) (C), or Baf A1 plus CHX (D) for the indicated durations. The graphs depict the ATZ level normalized to the ACTB level after treatment for 6 h. Data are presented as mean ± SEM of three independent experiments. (F) WB analysis of SQSTM1, an endogenous cargo of autophagy in protein lysates of S/SHep and A/AHep cells. S/SHep and A/AHep cells were treated with DMSO or Tm and then with MG132 (20 µM) only or MG132 plus CHX for the indicated durations before harvesting samples. The graphs depict the SQSTM1 level normalized to the ACTB level after treatment for 6 h. Data are presented as mean ± SEM of three independent experiments. A two-way ANOVA with Sidak’s post hoc test was used in (B)-(F).](/cms/asset/8b094dfd-9037-4cf5-ae8b-5f7be79ef86d/kaup_a_2173900_f0003_oc.jpg)
Both colocalization analysis of LAMP1 and SQSTM1 () and LAMP1 and LC3A/B () and TEM observation of autophagic vesicles () indicated that autophagic flux is impaired in A/AHep cells under ER stress conditions. To explore the impairment of autophagic flux in Tm-treated A/AHep cells, we investigated LC3B-II accumulation in Tm-treated cells incubated with bafilomycin A1 (Baf A1), a specific inhibitor of vacuolar H+-ATPases and a blocker of autophagosome-lysosome fusion [Citation64,Citation65]. During active autophagic flux, LC3B-II protein accumulates upon Baf A1 treatment [Citation66]. In the absence of Tm treatment, Baf A1 increased the level of LC3-II protein as expected (), indicating that autophagic flux is active in both S/SHep and A/AHep cells under normal conditions. However, Baf A1 failed to induce LC3B-II accumulation in Tm-treated A/AHep cells, but still increased the LC3B-II protein level in Tm-treated S/SHep cells (), indicating that autophagic flux is impaired in A/AHep but not in S/SHep cells under ER stress conditions.
A variant of SERPINA1/α1-antitrypsin with the E342K (Z) mutation (ATZ) is degraded by both autophagy and proteasome-dependent ERAD [Citation67,Citation68]. Autophagy pathways are defective in EIF2S1 phosphorylation-deficient cells; therefore, we investigated whether EIF2S1 phosphorylation deficiency affects autophagic degradation of ATZ protein. ATZ-expressing cells were treated with the proteasome inhibitor MG132 alone to inhibit proteasome-mediated degradation, or cotreated with MG132 and cycloheximide (CHX) to inhibit both proteasome-mediated degradation and de novo protein synthesis for 3 or 6 h (). Therefore, cotreatment with MG132 and CHX will predominantly allow autophagic degradation of ATZ protein. Western blot (WB) analysis revealed that cotreatment with MG132 and CHX for 6 h significantly increased autophagic degradation of ATZ in S/SHep cells, but this degradation was decreased in A/AHep cells (). Next, ATZ-expressing cells were treated with Baf A1 alone to inhibit autophagic degradation, or cotreated with Baf A1 and CHX to inhibit both autophagic degradation and de novo protein synthesis for 6 h (). Therefore, cotreatment with Baf A1 and CHX will allow proteasome-mediated degradation of ATZ proteins. Proteasome-mediated ATZ degradation was not impaired but improved in A/AHep cells compared with S/SHep cells upon cotreatment with Baf A1 and CHX (). Furthermore, degradation of SQSTM1, an endogenous cargo of autophagy [Citation15,Citation16], was also impaired in A/AHep cells under ER stress conditions (). Thus, our results suggest that phosphorylation of EIF2S1 is important to maintain autophagic flux (such as autophagosome and autolysosome formation), which can affect degradation of its target substrates.
Nuclear translocation of TFEB and TFE3 is impaired in A/A cells during ER stress
Most genes examined in , which displayed lower mRNA levels in A/AHep cells than in S/SHep cells during ER stress, are downstream targets of TFEB and TFE3, the master transcriptional regulators of autophagy and lysosome biogenesis [Citation20,Citation26,Citation27,Citation69]. TFEB and TFE3 reportedly regulate expression of their target genes by binding to the CLEAR motif sequence [Citation20,Citation26,Citation27]. To determine whether EIF2S1 phosphorylation deficiency influences CLEAR promoter element activity during ER stress, S/S and A/A mouse embryonic fibroblasts (MEFs) were transfected with a 5XCLEAR luciferase reporter construct (containing five tandem copies of a CLEAR promoter element). Changes of luciferase activities were investigated in S/SMEF and A/AMEF cells treated with Tm and Earle’s Balanced Salt Solution (EBSS) (). ER stress-induced TFEB activity was abolished in A/AMEF cells, whereas Tm treatment significantly stimulated luciferase activity of the transfected reporter construct in S/SMEF cells ( upper graph). Furthermore, starvation induced by EBSS treatment only modestly increased CLEAR promoter activity in A/AMEF cells, but substantially induced reporter activity in S/SMEF cells ( lower graph), indicating that EIF2S1 phosphorylation is required for expression of autophagy genes induced by TFEB and TFE3 activation. These results (and those presented in ) demonstrate that EIF2S1 phosphorylation plays a novel and important role in transcriptional regulation of autophagy genes during ER stress.
Figure 4. Nuclear translocation of TFEB and TFE3 is impaired in A/A cells during ER stress. (A) Luciferase activity assay of the 5xCLEAR luciferase reporter. S/SMEF and A/AMEF cells were cotransfected with plasmids expressing 5XCLEAR-driven firefly luciferase and CMV-driven Renilla luciferase for 30 h. Cells were treated with Tm (100 ng/mL) for the indicated durations or starved with EBSS for 12 h, and then luciferase activities were measured. Data are presented as mean ± SEM of three independent experiments. (B) Representative IF images of TFEB (upper) and TFE3 (lower) in S/SHep and A/AHep cells treated with Tm (1 µg/mL) for the indicated durations. Scale bar: 20 µm. The percentage of cells with nuclear localized TFEB or TFE3 is indicated in each image and shown in the graphs. Data are presented as mean ± SEM of three independent experiments (about 140–500 cells per condition). (C) WB analysis of the subcellular distributions of TFEB and TFE3 in S/SHep and A/AHep cells treated without or with Tm (1 µg/mL) for 24 h. LMNA (lamin A/C) and ACTB were used as loading controls of the nuclear and cytoplasmic fractions, respectively. (D) Densitometric quantification of nuclear TFEB and TFE3 in (C). Values were normalized against LMNA levels. Data are presented as mean ± SEM of three independent experiments. (E and F) Representative IF images of TFEB (E) and TFE3 (F) in WT HeLa cells (HeLa-WT), HA-Cas9- and FLAG-EIF2S1S51A-expressing HeLa cells (HeLa-Cas9 EIF2S1S51A OE), and HA-Cas9- and FLAG-EIF2S1S51A-expressing and EIF2S1-KO HeLa cells (HeLa-Cas9 EIF2S1S51A OE EIF2S1 KO). Cells were treated with DMSO or Tm (2 µg/mL) for 24 h. Scale bar: 20 µm. The graphs depict the percentage of cells with nuclear TFEB or TFE3. Data are presented as mean ± SEM of three independent experiments (at least 150 cells per condition). (G) WB analysis of the subcellular distributions of TFEB and TFE3 in HeLa-WT, HeLa-Cas9 EIF2S1S51A OE, and HeLa-Cas9 EIF2S1S51A OE EIF2S1 KO cells treated with DMSO or Tm (2 µg/mL) for 24 h. Histone H3 and ACTB were used as loading controls of the nuclear and cytoplasmic fractions, respectively. (H) Densitometric quantification of nuclear TFEB and TFE3 in (G). Values were normalized against Histone H3 levels. Data are presented as mean ± SEM of three independent experiments. A two-way ANOVA with Sidak’s post hoc test was used in (A)-(H).
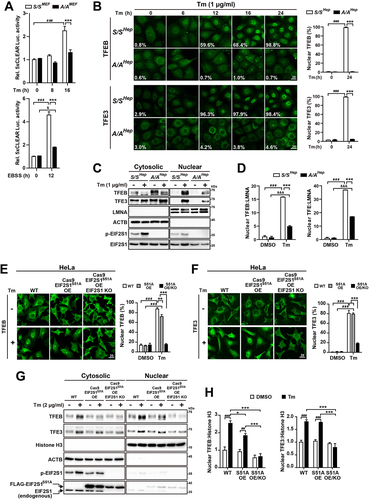
A/A cells had several defects in autophagy pathways, including in autophagic flux and autophagy gene expression in response to Tm treatment; therefore, we postulated that TFEB and TFE3 may be inactive in Tm-treated A/A cells. To investigate this, we first examined the subcellular distributions of endogenous TFEB and TFE3 in S/SHep and A/AHep cells treated with Tm. Nuclear translocation of TFEB and TFE3 was observed at 6 h, gradually increased, and reached almost 100% at 24 h in Tm-treated S/SHep cells (), whereas very little (<5%) nuclear translocation of TFEB and TFE3 was observed in Tm-treated A/AHep cells (). To verify our results, we performed subcellular fractionation analysis of S/SHep and A/AHep cells treated with and without Tm. As reported previously [Citation37], Tm treatment potently induced accumulation of endogenous TFEB and TFE3 in the nuclear fraction of S/SHep cells (). However, levels of TFEB and TFE3 were significantly lower in the nuclear fraction of Tm-treated A/AHep cells than in that of Tm-treated S/SHep cells (). These data indicate that EIF2S1 phosphorylation is necessary for nuclear accumulation of TFEB and TFE3 in response to ER stress.
Furthermore, we conducted subcellular localization experiments using multiple cell lines to confirm that defective nuclear translocation of TFEB and TFE3 is not limited to particular EIF2S1 phosphorylation-deficient cell types. First, similar to A/AHep cells, A/AMEF cells displayed defective nuclear translocation of TFEB and TFE3 in response to Tm treatment (Fig. S2A–C). In addition, as previously reported [Citation37], nuclear translocation of TFEB and TFE3 was severely impaired in eif2ak3-knockout (KO) (eif2ak3−/−) MEFs in response to Tm treatment, whereas these proteins substantially translocated from the cytosol to the nucleus in WT (Eif2ak3+/+) MEFs treated with Tm for 16 h (Fig. S2A–C). Second, defective nuclear translocation of TFEB and TFE3 in response to Tm treatment was completely restored by human WT EIF2S1 OE in A/AMEF cells (Fig. S2D–F). Third, to conveniently analyze changes in the cellular localization of TFEB under diverse experimental conditions, we established S/SMEF and A/AMEF cell lines expressing human TFEB fused with enhanced green fluorescent protein (EGFP) at the C-terminus and control S/SMEF and A/AMEF cell lines expressing EGFP only (Fig. S2G) [Citation70]. Stable highly expressing clones (S/S-TFEB-EGFP clone 5 and A/A-TFEB-EGFP clone 5) were chosen by fluorescence microscopy and WB analyses (Fig. S2G, H). Under normal conditions, TFEB-EGFP expressed in S/S-TFEB-EGFP and A/A-TFEB-EGFP MEFs mainly localized to the cytoplasm (Fig. S2H, I). Similar to A/AHep and A/AMEF cells, after Tm treatment for 16 h, nuclear localized TFEB-EGFP was observed in only a very small percentage (<5%) of A/A-TFEB-EGFP MEFs, whereas almost 80% of S/S-TFEB-EGFP MEFs displayed nuclear localized TFEB-EGFP (Fig. S2H, I). However, the nuclear translocation defect of TFEB-EGFP in response to Tm treatment was efficiently corrected by recombinant adenovirus-mediated OE of WT EIF2S1, but not of mutant EIF2S1S51A, in A/A-TFEB-EGFP MEFs (Fig. S2J–L). Finally, we examined nuclear translocation of TFEB and TFE3 in an EIF2S1 phosphorylation-deficient human cell line. To establish a HeLa cell line that lacks phosphorylation of EIF2S1 residue S51, a HeLa cell line expressing both the HA-tagged Cas9 (CRISPR-associated protein 9) restriction enzyme and the FLAG-tagged human EIF2S1S51A mutant (HeLa-Cas9 EIF2S1S51A OE) was first generated. Then, the HeLa-Cas9 EIF2S1S51A OE EIF2S1 KO cell line, in which the endogenous WT EIF2S1 gene was knocked out, was established from HeLa-Cas9 EIF2S1S51A cells using CRISPR-Cas9 technology. Similar observations were made in HeLa-Cas9 EIF2S1S51A OE EIF2S1 KO cells, which were engineered to express FLAG-tagged EIF2S1S51A and lacked endogenous WT EIF2S1 (). HeLa-Cas9 EIF2S1S51A OE EIF2S1 KO cells displayed significant nuclear translocation impairment () and diminished nuclear accumulation () of TFEB and TFE3 during ER stress. These data indicate that impairment of TFEB and TFE3 nuclear translocation induced by EIF2S1 phosphorylation deficiency is not a species- or cell type-specific event during ER stress.
In addition to Tm treatment, other conditions induce autophagy. These include treatment with other ER stress inducers such as thapsigargin (Tg) and dithiothreitol (DTT) [Citation56,Citation71], as well as diverse cellular stress conditions such as MTOR inhibition (Torin 2), nutrient starvation (EBSS), and inflammation (lipopolysaccharide [LPS]) [Citation31]. We examined nuclear translocation of endogenous TFEB and TFE3 in S/SHep and A/AHep cells in response to these autophagic stimuli (Fig. S3A–C). As expected, all stimuli induced nuclear localization of TFEB and TFE3 in S/SHep cells with different sensitivities (Fig. S3A, B). They immediately induced EIF2S1 phosphorylation in S/SHep cells but not in A/AHep cells (Fig. S3C). By contrast, their nuclear translocation was almost completely abolished in A/AHep cells in response to all five stimuli tested (Fig. S3A–C). To confirm these results, we analyzed the nuclear localization of TFEB in S/S-TFEB-EGFP and A/A-TFEB-EGFP MEFs treated with all five stimuli tested, other MTOR inhibitors (Torin 1 and PP242), and Torin 2 plus Tm. In agreement with the hepatocyte data, all stimuli including Torin 2 plus Tm (data not shown) induced nuclear translocation of TFEB-EGFP in S/S-TFEB-EGFP MEFs but not in A/A-TFEB-EGFP MEFs (Fig. S3D, E). In addition, the MTORC1 inhibitory activity of Torin 2 and Torin 1 was sustained in both genotype for the entire experimental durations (16 h) (). Thus, our data suggest that EIF2S1 phosphorylation plays a novel and crucial role in regulating nuclear translocation of TFEB and TFE3 in response to diverse cellular stresses including ER stress.
Collectively, these observations raise the question of whether EIF2S1 phosphorylation influences nuclear translocation of multiple proteins under ER stress conditions. Therefore, we examined the nuclear localization of GSK3B, which translocates into the nucleus under ER stress conditions [Citation72,Citation73], in S/S-TFEB-EGFP and A/A-TFEB-EGFP MEFs under ER stress conditions. As already shown in Figure. S2H–K and S3D, E, nuclear translocation of TFEB-EGFP was markedly inhibited in A/A-TFEB-EGFP MEFs under ER stress conditions, whereas nuclear translocation of GSK3B was not inhibited in TFEB-EGFP-expressing S/S or A/A MEFs (Figure. S3G, H). These results indicate that impairment of nuclear translocation by EIF2S1 phosphorylation deficiency is a specific defect that only affects TFEB, TFE3, and a few related proteins under ER stress conditions.
EIF2S1 phosphorylation deficiency does not impair YWHA-mediated regulation of TFEB and TFE3 nuclear translocation
Tm treatment induces nuclear translocation of TFEB and TFE3 via a process that is dependent on calcium-activated PPP3 [Citation37], which can emasculate YWHA-mediated retention of these TFs in the cytosol [Citation33,Citation35]. Furthermore, EIF2AK3 is thought to be necessary for PPP3 activation in response to Tm treatment because it can modulate calcium levels in the ER and cytoplasm [Citation74–76]. By using the PPP3 inhibitor FK506 in our experimental systems, we recapitulated that PPP3-mediated dephosphorylation of TFEB is important for ER stress-induced nuclear translocation of TFEB in Tm-treated S/S-TFEB-EGFP MEFs (). In addition, the results presented in Figure S2A, B and indicate that activation of the EIF2AK3-Ca2+-PPP3 pathway determines nuclear translocation of TFEB and TFE3 in response to Tm treatment. However, EIF2AK3 activation was not dysregulated in A/A cells (). Therefore, we next investigated whether cytosolic Ca2+ mobilization is impaired in Tm-treated A/A cells. Although Tm treatment changed the cytoplasmic Ca2+ levels in all MEFs, eif2ak3 KO (eif2ak3−/−) MEFs displayed lower cytosolic Ca2+ levels than Eif2ak3+/+ MEFs before and after Tm treatment (), whereas A/AMEF cells exhibited higher cytosolic Ca2+ levels than S/SMEF cells after Tm treatment (). These results indicate that there are no EIF2AK3- and Ca2+-dependent PPP3-related impairments of TFEB and TFE3 nuclear translocation in A/A cells.
Figure 5. EIF2S1 phosphorylation deficiency does not impede regulation of TFEB and TFE3 nuclear translocation by YWHA. (A) Representative fluorescence images of TFEB-EGFP in S/S-TFEB-EGFP MEFs. S/S-TFEB-EGFP MEFs were treated with DMSO, Tm only (50 ng/mL), or Tm (50 ng/mL) plus the PPP3 inhibitor FK506 (5 µM) for 16 h. The cellular localization of TFEB-EGFP was indicated by the green fluorescence signal of EGFP in cells. Nuclei were stained with DAPI (blue). Scale bar: 20 µm. The graph depicts the percentage of cells with nuclear TFEB-EGFP. Data are presented as mean ± SEM of three independent experiments (at least 130 cells per condition). (B) WB analysis of TFEB-EGFP and endogenous TFEB in protein lysates of cells treated with the same chemicals used in (A). In the left panel, proteins were separated by 6% SDS-PAGE and then subjected to WB analysis with antibodies against GFP or TFEB to detect TFEB-EGFP or endogenous TFEB, respectively. In the right panel, cells were lysed and subjected to IP with an anti-GFP antibody. Immunoprecipitates were analyzed by immunoblotting with antibodies against GFP (to detect TFEB-EGFP), phospho-(Ser)-YWHA binding motif (which binds to phosphorylated TFEB-EGFP at S211), or YWHA. (C and D) Representative measurements of Tm-induced cytosolic Ca2+ changes. WT (Eif2ak3+/+) and eif2ak3-KO (eif2ak3−/−) MEFs (C) and S/SMEF and A/AMEF cells (D) were treated with Tm (10 µg/mL), and Fura-2 Ca2+ imaging was performed as described in the Materials and Methods. The graphs depict the cytosolic Ca2+ concentration in basal and Tm-stimulated MEFs (Eif2ak3+/+, n = 169; eif2ak3−/−, n = 167; S/SMEF, n = 134; and A/AMEF, n = 131). Data are presented as mean ± SEM. (E and F) WB analysis of TFEB and TFE3 in protein lysates of S/SHep and A/AHep cells treated with the MTOR inhibitor Torin 2 (250 nM) (E) or Tm (1 µg/mL) (F) for the indicated durations. Proteins were separated by 6% SDS-PAGE to detect differences in the migration of TFEB and TFE3 proteins. (G) WB analysis of the phosphorylation status of TFEB-EGFP in protein lysates of S/S- and A/A-TFEB-EGFP MEFs treated with Tm (100 ng/mL) for the indicated durations. The phosphorylation status of TFEB-EGFP was analyzed using specific antibodies against phosphorylated S211 and phosphorylated S142 of TFEB. The graphs depict the levels of TFEB-EGFP phosphorylated at S211 or S142 normalized to that of total TFEB-EGFP. Data are presented as mean ± SEM of three independent experiments. *p < 0.05 and **p < 0.01, S/S-TFEB-EGFP vs A/A-TFEB-EGFP; #,&p < 0.05, ##,&&p < 0.01, and ###,&&&, 0 h vs. each time point in S/S- and A/A-TFEB-EGFP MEFs; N.S; not significant. (H and I) WB analysis of immunoprecipitated TFEB-EGFP and YWHA in S/S- and A/A-TFEB-EGFP MEFs treated with Torin 2 (50 nM, 3 h) (H) or Tm (50 ng/mL, 16 h) (I). Torin 2 treatment was performed for 3 h, which did not significantly change the levels of TFEB-EGFP proteins (see Fig. S3F vs Fig. S4C). Cells were lysed and subjected to IP with an anti-GFP antibody. Immunoprecipitates were analyzed by immunoblotting with antibodies against GFP (to detect TFEB-EGFP), phospho-(Ser)-YWHA binding motif (which binds to phosphorylated TFEB-EGFP at S211), phospho-TFEB-(S142), or YWHA. A one-way ANOVA with Tukey’s post hoc test in (A) was used and a two-way ANOVA with Sidak’s post hoc test was used in (C), (D), and (G).
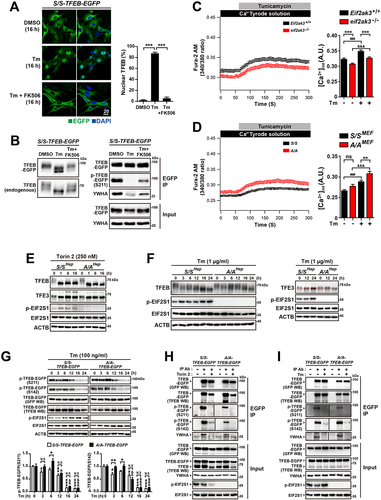
To corroborate our conclusion, we compared the migration of TFEB and TFE3 in lysates of Torin 2- or Tm-treated S/SHep and A/AHep cells on sodium dodecyl sulfate-polyacrylamide gel electrophoresis (SDS-PAGE) gels. As expected, after Torin 2 and Tm treatment, the rapidly migrating TFEB and TFE3 forms were observed in both S/SHep and A/AHep cells, although they appeared slightly slower in A/AHep cells than in S/SHep cells in response to Tm treatment but the molecular weight of the bands in A/AHep cells eventually become like those in S/SHep cells (). By contrast, molecular weight shifts of TFEB and TFE3 proteins were not significant in eif2ak3−/− MEFs compared with Eif2ak3+/+ MEFs (Figure. S4A), possibly due to defective cytosolic Ca2+ mobilization under ER stress conditions (). Furthermore, we directly assessed the phosphorylation statuses of S211 and S142 in TFEB-EGFP, which are important for regulation of nuclear translocation [Citation33,Citation35] and export [Citation29] of TFEB, respectively. MTORC1 is responsible for phosphorylation of TFEB residues S211 and S142 [Citation30,Citation31,Citation33]. Torin 2 treatment strongly inhibited MTORC1, resulting in almost complete dephosphorylation of its target proteins (RPS6KB1 and EIF4EBP1) in both S/S and A/A cells (Fig. S3F, S4B left panels). Consistently, Torin 2 treatment strongly inhibited phosphorylation of TFEB-EGFP residues S211 and S142 in both S/S-TFEB-EGFP and A/A-TFEB-EGFP MEFs (Figure. S4C panels and graphs). In addition, we investigated whether Tm treatment inhibits MTORC1, which might contribute to the decreased phosphorylation of TFEB and its target proteins (RPS6KB1 and EIF4EBP1). Consistent with Martina’s report [Citation37], Tm treatment decreased phosphorylation of MTORC1 itself in both S/SHep and A/AHep cells (Fig. S4B). In addition, phosphorylation of RPS6KB1 was significantly reduced, although phosphorylation of EIF4EBP1 was unchanged (Fig. S4B). Consistent with the results presented in , the dephosphorylation levels of TFEB-EGFP residues S211 and S142 did not differ in S/S-TFEB-EGFP and A/A-TFEB-EGFP MEFs treated with Tm for 16 h. (Fig. S4C panels and graphs). Furthermore, we time-dependently assessed the phosphorylation statuses of TFEB-EGFP at S211 and S142 in S/S-TFEB-EGFP and A/A-TFEB-EGFP MEFs after Tm treatments (). Although S/S-TFEB-EGFP MEFs had more dephosphorylated TFEB-EGFP than A/A-TFEB-EGFP MEFs at earlier time points, the phosphorylation statuses of TFEB-EGFP residues S211 and S142 in A/A-TFEB-EGFP MEFs eventually become similar to those in S/S-TFEB-EGFP MEFs after Tm treatment for 12 h. Therefore, based on the results presented in and Fig. S4A–C, we suggest that TFEB dephosphorylation is required but insufficient for nuclear translocation of TFEB in A/A cells during ER stress, although the delayed TFEB dephosphorylation possibly impairs TFEB nuclear translocation.
Finally, we checked whether changes of the phosphorylation status of TFEB-EGFP residues S211 and S142 affect dissociation of the TFEB-EGFP-YWHA complex, which may result in transport of TFEB-EGFP to the nucleus. As expected, dephosphorylation of TFEB-EGFP residue S211 in eif2ak3−/− MEFs compared with Eif2ak3+/+ MEFs was insufficient to completely dissociate the TFEB-EGFP-YWHA protein complex after Tm treatment (Fig. S4D), suggesting that activation of the EIF2AK3-Ca2+-PPP3 pathway is an important factor determining TFEB and YWHA dissociation and subsequent nuclear translocation of TFEB in response to Tm treatment. However, TFEB-EGFP protein immunoprecipitated from lysates of cells treated not only with Torin 2 () but also with Tm () showed greatly reduced phosphorylation of both S211 and S142, resulting in a strong reduction of the TFEB-EGFP-YWHA complex in both WT and EIF2S1 phosphorylation-deficient cells. Nevertheless, translocation of TFEB to the nucleus was significantly prevented in EIF2S1 phosphorylation-deficient cells, but not in WT cells under ER stress conditions as well as under MTORC1-inhibited conditions (, Fig. S2, S3).
Altogether, our results (, Fig. S4) and Martina’s report [Citation37], strongly suggest that activation of EIF2AK3 and Ca2+-dependent PPP3 is required but insufficient for nuclear translocation of TFEB and TFE3 under ER stress conditions. In other words, there is an unknown mechanism(s) that regulates the subcellular localization of TFEB and TFE3 and is controlled by EIF2S1 phosphorylation under ER stress conditions.
TFEB translocates from the cytosol to the nucleus but cannot be retained in the nucleus in A/A cells under ER stress conditions
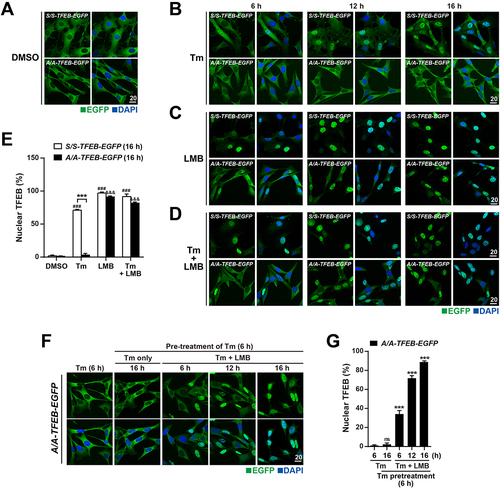
Recent studies demonstrate that TFEB continuously shuttles between the cytosol and nucleus via nuclear export dependent on the major exportin XPO1 under normal conditions [Citation29,Citation30,Citation42]. Phosphorylation of S211 of TFEB mediates its cytosolic retention via 14–3–3 binding [Citation30,Citation33], whereas phosphorylation of S142 and S138 is required for recognition and binding of the TFEB NES by XPO1, which is crucial for efficient nuclear export [Citation29,Citation30]. However, as shown in and Fig. S4C, Tm treatment significantly reduced phosphorylation of S211 and S142, but TFEB was sequestrated in the cytosol of A/A cells. Therefore, we investigated whether TFEB undergoes continuous nucleocytoplasmic shuttling in A/A cells even after Tm treatment. The effect of treatment with the XPO1 inhibitor leptomycin B (LMB) was investigated in S/S-TFEB-EGFP and A/A-TFEB-EGFP MEFs (). Treatment with LMB only and Tm plus LMB induced nuclear translocation of TFEB-EGFP at 6 h and almost 100% nuclear translocation of TFEB-EGFP at 16 h in both S/S-TFEB-EGFP and A/A-TFEB-EGFP MEFs, whereas nuclear translocation of TFEB-EGFP was impaired in A/A-TFEB-EGFP MEFs but not in S/S-TFEB-EGFP MEFs after Tm treatment for 16 h, indicating that nucleocytoplasmic shuttling of TFEB continues in EIF2S1 phosphorylation-deficient cells but not in WT cells under ER stress conditions (). To observe dynamic changes of the subcellular localization of TFEB due to inhibition of its nuclear export, cells were sequentially treated with Tm and LMB (). Sequential treatment with Tm and LMB increased nuclear translocation of TFEB-EGFP, whereas treatment with only Tm did not induce its nuclear translocation at all in A/A-TFEB-EGFP MEFs (). These results indicate that TFEB translocates from the cytosol to the nucleus but is continuously re-exported to the cytosol by a XPO1-dependent nuclear export pathway in A/A cells under ER stress conditions.
Figure 6. TFEB translocates to the nucleus in A/A cells but is subsequently exported to the cytoplasm under ER stress conditions. (A–D) Representative fluorescence images of TFEB-EGFP in S/S- and A/A-TFEB-EGFP MEFs. MEFs were treated with DMSO (A), Tm (40 ng/mL) only (B), the nuclear export inhibitor LMB (20 nM) only (C), or Tm (40 ng/mL) plus LMB (20 nM) (D) for the indicated durations. The cellular localization of TFEB-EGFP was indicated by the green fluorescence signal of EGFP in cells. Nuclei were stained with DAPI (blue). Scale bar: 20 µm. (E) The percentage of cells with nuclear TFEB-EGFP in (A–D) at 16 h. Data are presented as mean ± SEM of three independent experiments (at least 140 cells per condition). ***p < 0.001, S/S-TFEB-EGFP vs. A/A-TFEB-EGFP; ###p < 0.001, DMSO vs. chemicals in S/S-TFEB-EGFP; &&&p < 0.001, DMSO vs. chemicals in A/A-TFEB-EGFP. (F) Representative fluorescence images of TFEB-EGFP in A/A-TFEB-EGFP MEFs. MEFs were pretreated with Tm (40 ng/mL) for 6 h and further incubated with Tm in the absence or presence of LMB (20 nM) for the indicated durations. The cellular localization of TFEB-EGFP was indicated by the green fluorescence signal of EGFP in cells. Nuclei were stained with DAPI (blue). Scale bar: 20 µm. (G) The percentage of cells with nuclear TFEB-EGFP in (F). Data are presented as mean ± SEM of three independent experiments (at least 130 cells per condition). ***p < 0.001, Tm (6 h) vs. other conditions. A two-way ANOVA with Sidak’s post hoc test was used in (E) and a one-way ANOVA with Dunnett’s post hoc test was used in (G).
OE of the activated ATF6form promotes nuclear translocation of TFEB in A/A cells
Multiple reports (and the data presented in ) demonstrate that EIF2S1 phosphorylation is required for expression or activation of several UPR TFs, including ATF4 [Citation77–80], XBP1s [Citation13], and ATF6 and [Citation14], under ER stress conditions. Therefore, we examined whether OE of active forms of the UPR TFs (ATF4, XBP1s, ATF6[Citation1–373], or ATF6[Citation1–393]) affects nuclear translocation of TFEB-EGFP in A/A-TFEB-EGFP MEFs before and/or after Tm treatment (Fig. S5A, B). Nuclear localization of TFEB-EGFP was increased in most TF-expressing A/A-TFEB-EGFP MEFs regardless of ER stress (Fig. S5A). To determine the magnitude of TFEB-EGFP nuclear localization induced by each TF, we calculated the nuclear vs. cytosolic distribution ratio of TFEB-EGFP (Fig. S5A graphs). Among TFs, the ratio in cells expressing HA-ATF6[Citation1–373] was largest at all time points and highest after Tm treatment for 16 h. We next assessed changes of the transcriptional activity of TFEB upon ectopic OE of HA-ATF6[Citation1–373] and other HA-tagged TFs in A/AMEF cells before and after Tm treatment. To this end, we used a 5XCLEAR luciferase reporter construct. Similar to the results presented in Fig. S5A, luciferase activity was highest upon HA-ATF6[Citation1–373] OE among TFs and was further enhanced by Tm treatment (Fig. S5C). Surprisingly, the increase in reporter activities induced by HA-ATF6[Citation1–373] was almost equivalent to that induced by an TFEB active mutant (TFEBS211A-FLAG) (Fig. S5C). Finally, we assessed the abilities of the UPR TFs (ATF4, XBP1s, and ATF6[Citation1–373]) to ameliorate the impairment of endogenous TFEB and TFE3 nuclear translocation under ER stress conditions by performing IF analysis of A/AHep cells overexpressing ATF4, Flag-XBP1s, and HA-ATF6[Citation1–373] using recombinant adenoviruses (, Fig. S5D). As expected, IF analysis confirmed that the nuclear vs. cytosolic distribution ratios of endogenous TFEB and TFE3 were highest upon HA-ATF6[Citation1–373] OE regardless of Tm treatment (, Fig. S5D). This verified that among the three UPR TFs, the activated ATF6 form best prevents the impaired nuclear translocation of TFEB and TFE3 induced by EIF2S1 phosphorylation deficiency. Intriguingly, before Tm treatment, ATF4 and XBP1s OE had no or a weak effect on nuclear translocation of endogenous TFEB and TFE3 whereas the activated ATF6 form OE strongly induced their nuclear translocation (, Fig. S5D). Quantification of TFEB and TFE3 levels in the cytosolic and nuclear fractions by WB analyses confirmed that HA-ATF6[Citation1–373] potently induced nuclear translocation of endogenous TFEB and TFE3 in A/AHep cells regardless of ER stress, although Tm treatment further increased the nuclear TFEB level slightly (). Consistent with the increased nuclear translocation of TFEB in HA-ATF6[Citation1-373]-overexpressing A/AHep cells, HA-ATF6[Citation1–373] OE greatly induced dephosphorylation of TFEB-EGFP on S211 and S142 (, Fig. S6A), and resulted in dissociation of the TFEB-EGFP-YWHA complex without Tm treatment (). Coimmunoprecipitation (co-IP) assays revealed that ectopically expressed HA-ATF6[Citation1–373] coprecipitated with TFEB-EGFP () and vice versa () in A/A-TFEB-EGFP MEFs before Tm treatment, suggesting that HA-ATF6[Citation1–373] induces nuclear translocation of TFEB (as well as TFEB dephosphorylation and YWHA dissociation) through a physical interaction with TFEB. To confirm this, we performed a proximity ligation assay (PLA) and immunostaining assays. Most PLA signals were found in the nucleus regardless of Tm treatment, demonstrating that the interaction between TFEB and the activated ATF6 form retains TFEB in the nucleus (, Fig. S6B). In addition, a significant portion of PLA signals were in the cytosol regardless of Tm treatment, and cytosolic PLA signals decreased after Tm treatment in HA-ATF6[Citation1-373]-expressing A/A-TFEB-EGFP MEFs (, Fig. S6B), indicating that complexes of TFEB and the activated ATF6 form are generated in the cytosol and translocate to the nucleus, where they are retained. Immunostaining assays of A/AMEF cells coexpressing TFEB-EGFP and HA-ATF6[Citation1–373] also showed colocalization of TFEB with the activated ATF6 form in the nucleus, confirming that TFEB and the activated ATF6form interact in the nucleus (, Fig. S6C).
Figure 7. OE of the activated ATF6 form induces nuclear translocation of TFEB in A/A cells. (A) Representative IF images of endogenous TFEB or TFE3 (red) and EGFP (green) or HA (white) in A/AHep cells. Cells were infected with vector-, ATF4/EGFP, FLAG-XBP1s/EGFP- or HA-ATF6[Citation1-373]-expressing adenoviruses for 24 h and then treated with DMSO or Tm (1 µg/mL) for 24 h. Nuclei were stained with DAPI (blue). Scale bar: 20 µm. The numbers indicate the nuclear vs. cytosolic distribution ratios of endogenous TFEB or TFE3 of EGFP-positive cells in Fig. S5D. Data are presented as mean of three independent experiments (at least 150 cells per condition). (B) WB analysis of the subcellular distributions of endogenous TFEB and TFE3 in vector- or HA-ATF6[Citation1-373]-overexpressing A/AHep cells. Cells infected with vector- or HA-ATF6[Citation1-373]-expressing adenoviruses for 24 h were treated with DMSO or Tm (1 µg/mL) for 24 h. Nuclear TFEB and TFE3 levels normalized by Histone H3 levels are shown below the panels. Data are presented as mean ± SEM of three independent experiments. Histone H3 and TUBA/tubulin alpha were used as loading controls of the nuclear and cytoplasmic fractions, respectively. (C and D) WB analysis of immunoprecipitated TFEB-EGFP and YWHA (C) or HA-ATF6[Citation1–373] (D) in vector- or HA-ATF6[Citation1-373]-overexpressing A/A-TFEB-EGFP MEFs treated with DMSO or Tm (100 ng/mL, 24 h). Cells were lysed and subjected to IP with an anti-GFP antibody (C) or anti-HA antibody (D). Immunoprecipitates were analyzed by immunoblotting with antibodies against GFP (to detect TFEB-EGFP), phospho-(Ser)-YWHA binding motif (which binds to phosphorylated TFEB-EGFP at S211), YWHA, ATF6, or HA-ATF6[Citation1–373]. (E and F) Quantified results of the PLA between TFEB-EGFP and HA-ATF6[Citation1–373] in Fig. S6B. A/A-TFEB-EGFP MEFs transfected with plasmids expressing vector or HA-ATF6[Citation1–373] for 30 h were treated with DMSO or Tm (100 ng/mL) for 16 h. (E) The graph depicts the fraction (%) of cells with PLA signals in the nucleus, nucleus and cytosol, or cytosol. Data are presented as mean of three independent experiments (at least 70 cells per condition). ##p < 0.01, and ###p < 0.001, nucleus vs. nucleus and cytosol; &&&p < 0.001, nucleus vs. cytosol; $p < 0.05, nucleus and cytosol vs. cytosol (one-way ANOVA with Tukey’s post hoc test). *p < 0.05, DMSO vs. Tm in cytosolic PLA-positive cells (paired Student’s t-test). (F) The graph depicts quantification of the relative PLA MFI in the nucleus. Data are presented as mean ± SEM of three independent experiments (at least 32 cells per condition). A one-way ANOVA with Tukey’s post hoc test was used. Representative PLA images of A/A-TFEB-EGFP MEFs are presented in Fig. S6B. (G) Quantification of colocalization of TFEB-EGFP with HA-ATF6[Citation1–373] in Fig. S6C. A/AMEF cells were cotransfected with plasmids expressing TFEB-EGFP and vector or TFEB-EGFP and HA-ATF6[Citation1–373]. They were treated with DMSO or Tm (100 ng/mL) for 16 h, fixed, and stained with an anti-HA antibody (red) to detect HA-ATF6[Citation1–373]. Representative colocalization IF images of HA-ATF6[Citation1–373] and TFEB-EGFP in A/AMEF cells are presented in Fig. S6C. Data are presented as mean ± SEM of three independent experiments (at least 25 cells per condition). A two-way ANOVA with Sidak’s post hoc test was used.
![Figure 7. OE of the activated ATF6 form induces nuclear translocation of TFEB in A/A cells. (A) Representative IF images of endogenous TFEB or TFE3 (red) and EGFP (green) or HA (white) in A/AHep cells. Cells were infected with vector-, ATF4/EGFP, FLAG-XBP1s/EGFP- or HA-ATF6[Citation1-373]-expressing adenoviruses for 24 h and then treated with DMSO or Tm (1 µg/mL) for 24 h. Nuclei were stained with DAPI (blue). Scale bar: 20 µm. The numbers indicate the nuclear vs. cytosolic distribution ratios of endogenous TFEB or TFE3 of EGFP-positive cells in Fig. S5D. Data are presented as mean of three independent experiments (at least 150 cells per condition). (B) WB analysis of the subcellular distributions of endogenous TFEB and TFE3 in vector- or HA-ATF6[Citation1-373]-overexpressing A/AHep cells. Cells infected with vector- or HA-ATF6[Citation1-373]-expressing adenoviruses for 24 h were treated with DMSO or Tm (1 µg/mL) for 24 h. Nuclear TFEB and TFE3 levels normalized by Histone H3 levels are shown below the panels. Data are presented as mean ± SEM of three independent experiments. Histone H3 and TUBA/tubulin alpha were used as loading controls of the nuclear and cytoplasmic fractions, respectively. (C and D) WB analysis of immunoprecipitated TFEB-EGFP and YWHA (C) or HA-ATF6[Citation1–373] (D) in vector- or HA-ATF6[Citation1-373]-overexpressing A/A-TFEB-EGFP MEFs treated with DMSO or Tm (100 ng/mL, 24 h). Cells were lysed and subjected to IP with an anti-GFP antibody (C) or anti-HA antibody (D). Immunoprecipitates were analyzed by immunoblotting with antibodies against GFP (to detect TFEB-EGFP), phospho-(Ser)-YWHA binding motif (which binds to phosphorylated TFEB-EGFP at S211), YWHA, ATF6, or HA-ATF6[Citation1–373]. (E and F) Quantified results of the PLA between TFEB-EGFP and HA-ATF6[Citation1–373] in Fig. S6B. A/A-TFEB-EGFP MEFs transfected with plasmids expressing vector or HA-ATF6[Citation1–373] for 30 h were treated with DMSO or Tm (100 ng/mL) for 16 h. (E) The graph depicts the fraction (%) of cells with PLA signals in the nucleus, nucleus and cytosol, or cytosol. Data are presented as mean of three independent experiments (at least 70 cells per condition). ##p < 0.01, and ###p < 0.001, nucleus vs. nucleus and cytosol; &&&p < 0.001, nucleus vs. cytosol; $p < 0.05, nucleus and cytosol vs. cytosol (one-way ANOVA with Tukey’s post hoc test). *p < 0.05, DMSO vs. Tm in cytosolic PLA-positive cells (paired Student’s t-test). (F) The graph depicts quantification of the relative PLA MFI in the nucleus. Data are presented as mean ± SEM of three independent experiments (at least 32 cells per condition). A one-way ANOVA with Tukey’s post hoc test was used. Representative PLA images of A/A-TFEB-EGFP MEFs are presented in Fig. S6B. (G) Quantification of colocalization of TFEB-EGFP with HA-ATF6[Citation1–373] in Fig. S6C. A/AMEF cells were cotransfected with plasmids expressing TFEB-EGFP and vector or TFEB-EGFP and HA-ATF6[Citation1–373]. They were treated with DMSO or Tm (100 ng/mL) for 16 h, fixed, and stained with an anti-HA antibody (red) to detect HA-ATF6[Citation1–373]. Representative colocalization IF images of HA-ATF6[Citation1–373] and TFEB-EGFP in A/AMEF cells are presented in Fig. S6C. Data are presented as mean ± SEM of three independent experiments (at least 25 cells per condition). A two-way ANOVA with Sidak’s post hoc test was used.](/cms/asset/3d9a787b-2775-463b-812a-ede125860df9/kaup_a_2173900_f0007_oc.jpg)
OE of the activated ATF6form enhances expression of autophagy genes and ameliorates autophagic defects in A/A cells during ER stress
Ectopically expressed HA-ATF6[Citation1–373] potently induced nuclear translocation of TFEB and TFE3, and increased the activity of the TFEB binding motif (CLEAR)-driven luciferase reporter in A/A cells. Therefore, we assessed whether the activated ATF6 form upregulates expression of TFEB and TFE3-dependent autophagy genes in A/AHep cells. To this end, A/AHep cells were infected with Ad-vector or Ad-HA-ATF6[Citation1–373] and then treated with Tm for the indicated durations. Quantitative PCR and WB analyses confirmed that HA-ATF6[Citation1–373] was overexpressed and harbored transcriptional activities ( left graph, B left panels), as judged by increased mRNA and protein expression of the UPR target genes Hspa5/BiP [Citation81–84], Ddit3 [Citation84–87], Xbp1t, and Xbp1s [Citation84,Citation86]. Among the examined genes, Atf4 mRNA and ATF4 protein were also upregulated in HA-ATF6[Citation1-373]-expressing cells without Tm treatment ( left graph, B left panels), which has not been previously reported. Expression of XBP1s and ATF4 proteins was also increased when HA-ATF6[Citation1–373] was overexpressed in A/A-TFEB-EGFP MEFs (Fig. S5B). Expression analysis of autophagy genes demonstrated that the mRNA and protein levels of Lc3b, Sqstm1, and Ctsb genes were significantly higher in Ad-HA-ATF6[Citation1-373]-infected cells than in Ad-vector-infected cells without Tm treatment, and their mRNA levels were further increased by Tm treatment ( right graph, B right panels). Although LC3B conversion (LC3B-II:I ratio) was lower in A/AHep cells than in S/SHep cells at most time points (), HA-ATF6[Citation1–373] OE in A/AHep cells increased LC3B conversion (LC3B-II:I ratio) at the late stages (12 and 24 h), implying that the activated ATF6form enhances autophagosome formation in A/A cells during ER stress. Although HA-ATF6[Citation1–373] expression itself did not increase mRNA (Ctsd, Ctsl, Lamp1, Lamp2a, Lamp2b, Lamp2c, Mcoln1, Tpp1, Glb1, and Atp6v1h) ( right graph) or protein (CTSL, LAMP1, and LAMP2) ( right panel) expression of many other autophagy genes, Tm treatment strongly enhanced the levels of these transcripts ( right graph) and proteins ( right panels) in HA-ATF6[Citation1-373]-expressing A/AHep cells. These results suggest that enhancement of autophagy gene expression by the activated ATF6form requires other components (such as other TFs and ATF6 PTMs) that are induced by ER stress. Together, these data indicate that activated ATF6 form OE can ameliorate the dysregulated expression of TFEB and TFE3-dependent autophagy genes and some UPR genes in A/A cells during ER stress.
Figure 8. OE of the activated ATF6 form increases expression of autophagy genes and improves autophagic defects in A/A cells during ER stress. A/AHep cells infected with vector- or HA-ATF6[Citation1-373]-expressing adenoviruses for 24 h were treated with DMSO or Tm (1 µg/mL) for the indicated durations. (A) Quantitative RT-PCR analysis of mRNA expression of ER stress response and autophagy genes. Data are presented as mean ± SEM of three independent experiments. *p < 0.05, **p < 0.01, and ***p < 0.001, Ad-vector vs. Ad-HA-ATF6[Citation1–373]; #p < 0.05, ##p < 0.01, and ###p < 0.001, DMSO vs. Tm in Ad-vector; &p < 0.05, &&p < 0.01, and &&& p < 0.001, DMSO vs. Tm in Ad-HA-ATF6[Citation1–373]. The dotted line was put to compare relative mRNA levels of HA-ATF6[Citation1-373]-expressing A/A cells with them of ATF4- (Fig. S8A) or FLAG-XBP1s (Fig. S8B)-overexpressing A/A cells. (B) WB analysis of ER stress and autophagy proteins in cell lysates. To observe the expression levels of ER stress, overexpressed TF, and autophagy proteins, lysates were prepared from HA-ATF6[Citation1-373]-overexpressing A/AHep cells after Tm treatment at each time point. Lysates of Tm (0 and 24 h)-treated S/SHep cells were prepared as positive controls. The lysates were subjected to WB analysis of the indicated proteins. ATF6(N): cleaved N-terminal fragment of endogenous ATF6. The LC3B-II:I ratios are shown below the right first panel. CTSB: cathepsin B; CTSL: cathepsin L; Pro: procathepsin; Sc: mature single-chain cathepsin; Dc: heavy chain of mature double-chain cathepsin. (C) Representative images of LysoTracker staining in vector- or HA-ATF6[Citation1-373]-overexpressing A/AHep cells. Cells were stained with LysoTracker (100 nM, red) and Hoechst 33,258 (10 μg/mL, blue) for the last 30 min of the treatment. The dotted white line defines the cell boundary. Scale bar: 20 µm. The graph depicts quantification of the MFI of LysoTracker. Data are presented as mean ± SEM of three independent experiments (at least 150 cells per condition). (D) Representative IF images of LC3A/B (green) and LAMP1 (red) in vector- or HA-ATF6[Citation1-373]-overexpressing A/AHep cells. Nuclei were stained with DAPI (blue). The bottom panels are magnified images of the boxes in the upper panels. Yellow IF signal indicates double labeling of LC3A/B (green) and LAMP1 (red). Scale bar: 20 µm. (E) The graph depicts the fraction (%) of cells with different LC3A/B staining patterns as described in . Data are presented as mean ± SEM of three independent experiments (at least 150 cells per condition). (F) The graph depicts quantification of the colocalization of LC3A/B with LAMP1 in (D). Data are presented as mean ± SEM of three independent experiments (at least 150 cells per condition). (G) Representative TEM images of vector- or HA-ATF6[Citation1-373]-overexpressing A/AHep cells. The bottom panels are magnified images of the red boxes in the upper panels. Red arrowheads indicate autolysosomes, and yellow arrows indicate the ER. The dotted yellow line defines a mass of dilated and fragmented ER structures. Scale bars: upper panels 1 or 2 µm and bottom panels 0.2 µm. (H) Quantification of the number of autolysosomes per cell TEM images in (G). Data are presented as mean ± SEM of three independent experiments (at least 15 cells per condition). A two-way ANOVA with Sidak’s post hoc test was used in (A), (C), (F), and (H).
![Figure 8. OE of the activated ATF6 form increases expression of autophagy genes and improves autophagic defects in A/A cells during ER stress. A/AHep cells infected with vector- or HA-ATF6[Citation1-373]-expressing adenoviruses for 24 h were treated with DMSO or Tm (1 µg/mL) for the indicated durations. (A) Quantitative RT-PCR analysis of mRNA expression of ER stress response and autophagy genes. Data are presented as mean ± SEM of three independent experiments. *p < 0.05, **p < 0.01, and ***p < 0.001, Ad-vector vs. Ad-HA-ATF6[Citation1–373]; #p < 0.05, ##p < 0.01, and ###p < 0.001, DMSO vs. Tm in Ad-vector; &p < 0.05, &&p < 0.01, and &&& p < 0.001, DMSO vs. Tm in Ad-HA-ATF6[Citation1–373]. The dotted line was put to compare relative mRNA levels of HA-ATF6[Citation1-373]-expressing A/A cells with them of ATF4- (Fig. S8A) or FLAG-XBP1s (Fig. S8B)-overexpressing A/A cells. (B) WB analysis of ER stress and autophagy proteins in cell lysates. To observe the expression levels of ER stress, overexpressed TF, and autophagy proteins, lysates were prepared from HA-ATF6[Citation1-373]-overexpressing A/AHep cells after Tm treatment at each time point. Lysates of Tm (0 and 24 h)-treated S/SHep cells were prepared as positive controls. The lysates were subjected to WB analysis of the indicated proteins. ATF6(N): cleaved N-terminal fragment of endogenous ATF6. The LC3B-II:I ratios are shown below the right first panel. CTSB: cathepsin B; CTSL: cathepsin L; Pro: procathepsin; Sc: mature single-chain cathepsin; Dc: heavy chain of mature double-chain cathepsin. (C) Representative images of LysoTracker staining in vector- or HA-ATF6[Citation1-373]-overexpressing A/AHep cells. Cells were stained with LysoTracker (100 nM, red) and Hoechst 33,258 (10 μg/mL, blue) for the last 30 min of the treatment. The dotted white line defines the cell boundary. Scale bar: 20 µm. The graph depicts quantification of the MFI of LysoTracker. Data are presented as mean ± SEM of three independent experiments (at least 150 cells per condition). (D) Representative IF images of LC3A/B (green) and LAMP1 (red) in vector- or HA-ATF6[Citation1-373]-overexpressing A/AHep cells. Nuclei were stained with DAPI (blue). The bottom panels are magnified images of the boxes in the upper panels. Yellow IF signal indicates double labeling of LC3A/B (green) and LAMP1 (red). Scale bar: 20 µm. (E) The graph depicts the fraction (%) of cells with different LC3A/B staining patterns as described in Figure 2A. Data are presented as mean ± SEM of three independent experiments (at least 150 cells per condition). (F) The graph depicts quantification of the colocalization of LC3A/B with LAMP1 in (D). Data are presented as mean ± SEM of three independent experiments (at least 150 cells per condition). (G) Representative TEM images of vector- or HA-ATF6[Citation1-373]-overexpressing A/AHep cells. The bottom panels are magnified images of the red boxes in the upper panels. Red arrowheads indicate autolysosomes, and yellow arrows indicate the ER. The dotted yellow line defines a mass of dilated and fragmented ER structures. Scale bars: upper panels 1 or 2 µm and bottom panels 0.2 µm. (H) Quantification of the number of autolysosomes per cell TEM images in (G). Data are presented as mean ± SEM of three independent experiments (at least 15 cells per condition). A two-way ANOVA with Sidak’s post hoc test was used in (A), (C), (F), and (H).](/cms/asset/0865a354-8ef0-404b-bc0e-1523097ec754/kaup_a_2173900_f0008_oc.jpg)
Nuclear translocation of TFEB and TFE3 is important for regulation of lysosome biogenesis and function [Citation22,Citation26,Citation27]. Therefore, we checked whether ectopically expressed HA-ATF6[Citation1-373]-mediated nuclear translocation of TFEB prevents perturbation of lysosome biogenesis and function in A/AHep cells under ER stress conditions. Similar to the results presented in , null expressing A/AHep cells exhibited markedly decreased LysoTracker Red staining and peripheral accumulation of lysosomes, whereas HA-ATF6[Citation1-373]-expressing A/AHep cells displayed significant increases in the intensity of LysoTracker Red staining and perinuclear accumulation of lysosomes after Tm treatment (). This indicates that TFEB and TFE3 activation mediated by the activated ATF6 form prevents lysosomal dysfunction in A/A cells under ER stress conditions.
We next investigated if the ability of the activated ATF6 form to induce TFEB and TFE3 activation ameliorates autophagic defects in A/A cells during ER stress. HA-ATF6[Citation1–373] OE significantly reduced accumulation of LC3A/B-positive structures in perinuclear regions, and conversely increased the number of puncta positive for LC3A/B (autophagosomes) and LAMP1 (autolysosomes or lysosomes) in Tm-treated A/AHep cells (). Furthermore, HA-ATF6[Citation1–373] OE markedly enhanced the colocalization of LC3A/B and LAMP1 in Tm-treated A/AHep cells (). Similarly, HA-ATF6[Citation1–373] OE enhanced the colocalization of SQSTM1 and LAMP1 in Tm-treated A/AHep cells (Fig. S7A). Finally, TEM analyses demonstrated that HA-ATF6[Citation1–373] OE increased the number of autolysosomes in Tm-treated A/AHep cells (). In addition, as reported previously [Citation88], HA-ATF6[Citation1–373] OE induced ER expansion in A/AHep cells not treated with Tm and reduced accumulation of the fragmented ER in Tm-treated A/AHep cells (). Together, our data suggest that OE of the activated ATF6 form increases expression of TFEB and TFE3-dependent autophagy genes, and ameliorates autophagic defects and disruption of the ER structure in A/A cells during ER stress.
OE of ATF4 and XBP1s improves expression of autophagy genes and alleviates autophagic defects in A/A cells during ER stress
The activated ATF6 form is an important factor to induce nuclear translocation and activation of TFEB and TFE3 in A/A cells under ER stress conditions. Therefore, we questioned whether ATF6 deficiency influences nuclear translocation of TFEB and TFE3 in Tm-treated cells. However, similar to WT hepatocytes (HEP-Atf6+/+), ATF6-deficient hepatocytes (HEP-atf6−/−) also displayed normal nuclear translocation of TFEB and TFE3 in response to Tm treatment (Fig. S7B). These data indicate that ATF6 is not absolutely required for nuclear accumulation of TFEB and TFE3 during ER stress.
We showed that EIF2S1 phosphorylation was required for expression of ATF4 and XBP1s during ER stress () [Citation7,Citation13,Citation53]. HA-ATF6[Citation1–373] OE increased expression of Atf4 and Xbp1s mRNAs and their proteins (, Fig. S5B). Inversely, ATF6-deficient hepatocytes (HEP-atf6−/−), which had no defect in TFEB and TFE3 nuclear translocation, expressed more ATF4 than WT cells and a similar level of XBP1s as WT cells in response to Tm treatment (Fig. S1A). In addition, ATF4 and XBP1s OE in A/A cells induced nuclear translocation of TFEB and TFE3 under ER stress conditions, although the effect of activated ATF6 form OE was stronger (, Fig. S5). All the data described above indicate that ATF4 or XBP1s OE can mitigate autophagic defects in A/A cells under ER stress conditions. Therefore, we conducted experiments similar to those performed with HA-ATF6[Citation1–373] in . For these experiments, A/AHep cells were infected with Ad-ATF4 EGFP or Ad-Flag-XBP1s EGFP and then treated with Tm for the indicated durations. As reported previously [Citation7,Citation9,Citation13,Citation53,Citation84], ATF4 and XBP1s OE increased expression of mRNAs (Ddit3, Ppp1r15a, Asns, Xbp1s, and Hspa5 for ATF4 OE; Xbp1t, Xbp1s, Ddit3, Hspa5, and Atf6 for XBP1s OE) (Figure S8A, B left graphs) and proteins (DDIT3 in ATF4 OE; HSP90B1, HSPA5, and ATF6(N) for XBP1s OE) (Fig. S8C upper panel and S8D left panel) of their UPR target genes in response to Tm treatment. Expression analysis of autophagy genes demonstrated that the levels of mRNAs (Lc3b, Sqstm1, Ctsl, Lamp2b, and Mcoln1 for ATF4 OE; Lc3b, Ctsb, Ctsd, Lamp1, Lamp2a, Lamp2b, Lamp2c, Glb1, Atp6v1h, Tfe3, and Tfeb for XBP1s OE) (Fig. S8A, B right graphs) and proteins (LC3B, LAMP1, LAMP2, CTSB, and CTSL in ATF4 OE; LC3B, SQSTM1, LAMP1, LAMP2, CTSB, CTSL, TFEB, and TFE3 for XBP1s OE) (Fig. S8C lower panel and S8D right panel) of several autophagy genes were significantly higher in Ad-ATF4 EGFP- or Ad-Flag-XBP1s EGFP-infected cells than in Ad-vector-infected cells in response to Tm treatment. In addition, ATF4- and XBP1s-overexpressing A/AHep cells displayed significant increases in the intensity of LysoTracker Red staining and perinuclear accumulation of lysosomes after Tm treatment (Fig. S9A, B), indicating that ATF4 and XBP1s can mitigate lysosomal dysfunction in A/A cells under ER stress conditions. ATF4 and XBP1s OE reduced accumulation of LC3A/B-positive structures in perinuclear regions, and conversely increased the number of puncta positive for LC3A/B (autophagosomes) and LAMP1 (autolysosomes or lysosomes) in Tm-treated A/AHep cells (Fig. S9C-F). Furthermore, ATF4 and XBP1s OE enhanced the colocalization of LC3A/B and LAMP1 in Tm-treated A/AHep cells (Fig. S9G, H). Together, our data suggest that ATF4 and XBP1s OE also increases expression of TFEB and TFE3-dependent autophagy genes and alleviates autophagic defects in A/A cells during ER stress.
OE of the constitutively active TFEB mutant enhances expression of autophagy genes and ameliorates autophagic defects in A/A cells during ER stress
The results presented in indicate that the effects of the activated ATF6 form on autophagy are mediated by TFEB and TFE3 activation in A/A cells during ER stress. Therefore, we investigated whether TFEB OE increases expression of autophagy genes and thereby prevents autophagic defects in Tm-treated A/A cells. First, we overexpressed WT TFEB (TFEB[WT]-FLAG) or a constitutively active TFEB mutant (TFEBS211A-FLAG) in A/AHep cells and then treated these cells with Tm for the indicated durations. Similar to endogenous TFEB in S/SHep and A/AHep cells, the subcellular localization of overexpressed TFEB[WT]-FLAG differed depending on the genetic background of the cells and stress conditions, although TFEB[WT]-FLAG exhibited a nuclear localization in almost 25% of A/AHep cells treated with Tm for 24 h (Fig. S10A), possibly due to altered regulation by OE. On the other hand, the TFEB mutant (TFEBS211A-FLAG) primarily accumulated in the nucleus regardless of the genetic background of the cells and stress conditions (Fig. S10B), possibly due to the absence of YWHA-mediated cytoplasmic sequestration [Citation33,Citation35]. Second, we compared the transcriptional activities of TFEB[WT]-FLAG and TFEBS211A-FLAG in A/AMEF cells using the 5XCLEAR luciferase reporter construct before and after Tm treatment (). TFEBS211A-FLAG exhibited stronger transcriptional activity than TFEB[WT]-FLAG after Tm treatment, whereas their transcriptional activities were similar before Tm treatment (). Thus, OE of the constitutively active TFEB mutant and even WT TFEB may enhance expression of autophagy genes in A/A cells during ER stress.
Figure 9. OE of the constitutively active TFEB mutant enhances expression of autophagy genes and improves autophagic defects in A/A cells during ER stress. (A) Luciferase activity assay of the 5xCLEAR luciferase reporter. A/AMEF cells were cotransfected with plasmids expressing 5xCLEAR-driven firefly luciferase, CMV-driven Renilla luciferase, and FLAG-tagged TFEB (TFEB[WT]-FLAG or TFEBS211A-FLAG) for 30 h. Cells were then treated with DMSO or Tm (100 ng/mL) for 16 h, and luciferase activities were measured. Data are presented as mean ± SEM of three independent experiments. ***p < 0.001, Vector vs. TFEB[WT]-FLAG or TFEBS211A-FLAG; ###p < 0.001, DMSO vs. Tm; &&&p < 0.001, TFEB[WT]-FLAG vs. TFEBS211A-FLAG. (B) WB analysis of overexpressed TFEB[WT]-FLAG and TFEBS211A-FLAG proteins in A/AMEF cells in (A). (C) Quantitative RT-PCR analysis of mRNA expression of ER stress response and autophagy genes in vector-, TFEB[WT]-FLAG-, or TFEBS211A-FLAG-overexpressing A/AHep cells. A/AHep cells infected with vector-, TFEB[WT]-FLAG-, or TFEBS211A-FLAG-expressing adenoviruses for 24 h were treated with DMSO or Tm (1 µg/mL) for 24 h. Data are presented as mean ± SEM of three independent experiments. *p < 0.05, **p < 0.01, and ***p < 0.001, Ad-vector vs. Ad-TFEB[WT]-Flag or Ad-TFEBS211A-Flag; #p < 0.05 and ##p < 0.01, Ad-TFEB[WT]-Flag vs. Ad-TFEBS211A-Flag. Ctsb: cathepsin B; Ctsd: cathepsin D; Ctsl: cathepsin L. (D and E) WB analysis of EIF2S1, p-EIF2S1, its downstream target proteins (D), and autophagy and lysosomal proteins (E) in vector-, TFEB[WT]-FLAG-, or TFEBS211A-FLAG-overexpressing A/AHep cells. Cells infected with vector-, TFEB[WT]-FLAG-, or TFEBS211A-FLAG-expressing adenoviruses for 24 h were treated with DMSO or Tm (1 µg/mL) for the indicated durations. Cell lysates were prepared at each time point after Tm treatment. Lysates of Tm (0 and 24 h)-treated S/SHep cells were prepared as positive controls. They were subjected to WB analysis of the indicated proteins. The LC3B-II:I ratios are shown below the first panel in (E). CTSB: cathepsin B; CTSL: cathepsin L; Pro: procathepsin; Sc: mature single-chain cathepsin; Dc: heavy chain of mature double-chain cathepsin. (F) Representative IF images of LC3A/B (green) and TFEBS211A-FLAG (red) in vector- or TFEBS211A-FLAG-overexpressing A/AHep cells. Cells were treated with DMSO or Tm (1 µg/mL) for 24 h. The dotted white line defines the cell boundary. Scale bar: 20 µm. The graph depicts the fraction (%) of cells with different LC3A/B staining patterns as described in . Data are presented as mean ± SEM of three independent experiments (at least 150 cells per condition). (G) Representative LysoTracker staining images of vector- or TFEBS211A-FLAG-overexpressing A/AHep cells. Cells were stained with LysoTracker (100 nM, red) and Hoechst 33,258 (10 μg/mL, blue) for the last 30 min of the treatment. The dotted white line defines the cell boundary. Scale bar: 20 µm. The graph depicts quantification of the MFI of LysoTracker. Data are presented as mean ± SEM of three independent experiments (at least 150 cells per condition). (H) Representative IF images of LC3A/B (green) and LAMP1 (red) in vector- or TFEBS211A-FLAG-overexpressing A/AHep cells. Cells were treated with DMSO or Tm (1 µg/mL) for 24 h. Nuclei were stained with DAPI (blue). The third panels in the bottom row are magnified images of the boxes in the second panels. Yellow IF signal indicates double labeling of LC3A/B (green) and LAMP1 (red). Scale bars: 20 µm except for the magnified images (10 µm). The graph depicts quantification of the colocalization of LC3A/B with LAMP1. Data are presented as mean ± SEM of three independent experiments (at least 150 cells per condition). A one-way ANOVA with Tukey’s post hoc test was used in (C) and a two-way ANOVA with Sidak’s post hoc test was used in (A), (G), and (H).
![Figure 9. OE of the constitutively active TFEB mutant enhances expression of autophagy genes and improves autophagic defects in A/A cells during ER stress. (A) Luciferase activity assay of the 5xCLEAR luciferase reporter. A/AMEF cells were cotransfected with plasmids expressing 5xCLEAR-driven firefly luciferase, CMV-driven Renilla luciferase, and FLAG-tagged TFEB (TFEB[WT]-FLAG or TFEBS211A-FLAG) for 30 h. Cells were then treated with DMSO or Tm (100 ng/mL) for 16 h, and luciferase activities were measured. Data are presented as mean ± SEM of three independent experiments. ***p < 0.001, Vector vs. TFEB[WT]-FLAG or TFEBS211A-FLAG; ###p < 0.001, DMSO vs. Tm; &&&p < 0.001, TFEB[WT]-FLAG vs. TFEBS211A-FLAG. (B) WB analysis of overexpressed TFEB[WT]-FLAG and TFEBS211A-FLAG proteins in A/AMEF cells in (A). (C) Quantitative RT-PCR analysis of mRNA expression of ER stress response and autophagy genes in vector-, TFEB[WT]-FLAG-, or TFEBS211A-FLAG-overexpressing A/AHep cells. A/AHep cells infected with vector-, TFEB[WT]-FLAG-, or TFEBS211A-FLAG-expressing adenoviruses for 24 h were treated with DMSO or Tm (1 µg/mL) for 24 h. Data are presented as mean ± SEM of three independent experiments. *p < 0.05, **p < 0.01, and ***p < 0.001, Ad-vector vs. Ad-TFEB[WT]-Flag or Ad-TFEBS211A-Flag; #p < 0.05 and ##p < 0.01, Ad-TFEB[WT]-Flag vs. Ad-TFEBS211A-Flag. Ctsb: cathepsin B; Ctsd: cathepsin D; Ctsl: cathepsin L. (D and E) WB analysis of EIF2S1, p-EIF2S1, its downstream target proteins (D), and autophagy and lysosomal proteins (E) in vector-, TFEB[WT]-FLAG-, or TFEBS211A-FLAG-overexpressing A/AHep cells. Cells infected with vector-, TFEB[WT]-FLAG-, or TFEBS211A-FLAG-expressing adenoviruses for 24 h were treated with DMSO or Tm (1 µg/mL) for the indicated durations. Cell lysates were prepared at each time point after Tm treatment. Lysates of Tm (0 and 24 h)-treated S/SHep cells were prepared as positive controls. They were subjected to WB analysis of the indicated proteins. The LC3B-II:I ratios are shown below the first panel in (E). CTSB: cathepsin B; CTSL: cathepsin L; Pro: procathepsin; Sc: mature single-chain cathepsin; Dc: heavy chain of mature double-chain cathepsin. (F) Representative IF images of LC3A/B (green) and TFEBS211A-FLAG (red) in vector- or TFEBS211A-FLAG-overexpressing A/AHep cells. Cells were treated with DMSO or Tm (1 µg/mL) for 24 h. The dotted white line defines the cell boundary. Scale bar: 20 µm. The graph depicts the fraction (%) of cells with different LC3A/B staining patterns as described in Figure 2A. Data are presented as mean ± SEM of three independent experiments (at least 150 cells per condition). (G) Representative LysoTracker staining images of vector- or TFEBS211A-FLAG-overexpressing A/AHep cells. Cells were stained with LysoTracker (100 nM, red) and Hoechst 33,258 (10 μg/mL, blue) for the last 30 min of the treatment. The dotted white line defines the cell boundary. Scale bar: 20 µm. The graph depicts quantification of the MFI of LysoTracker. Data are presented as mean ± SEM of three independent experiments (at least 150 cells per condition). (H) Representative IF images of LC3A/B (green) and LAMP1 (red) in vector- or TFEBS211A-FLAG-overexpressing A/AHep cells. Cells were treated with DMSO or Tm (1 µg/mL) for 24 h. Nuclei were stained with DAPI (blue). The third panels in the bottom row are magnified images of the boxes in the second panels. Yellow IF signal indicates double labeling of LC3A/B (green) and LAMP1 (red). Scale bars: 20 µm except for the magnified images (10 µm). The graph depicts quantification of the colocalization of LC3A/B with LAMP1. Data are presented as mean ± SEM of three independent experiments (at least 150 cells per condition). A one-way ANOVA with Tukey’s post hoc test was used in (C) and a two-way ANOVA with Sidak’s post hoc test was used in (A), (G), and (H).](/cms/asset/61c35b99-6fdf-4da9-9edd-87ee22041650/kaup_a_2173900_f0009_oc.jpg)
Next, we assessed the expression levels of individual TFEB and TFE3 target genes in TFEB[WT]-FLAG- and TFEBS211A-FLAG-expressing A/AHep cells after Tm treatment. First, because Martina et al. reported that TFEBS211A OE enhances the ATF4-mediated ER stress response in WT MEFs [Citation37], we investigated whether OE of TFEB[WT]-FLAG or TFEBS211A-FLAG increases the transcript levels of ER stress responsive genes (Atf4, Ddit3, Xbp1t, Xbp1s, and Hspa5) in Tm-treated A/AHep cells. The levels of Atf4 and Ddit3 mRNAs were slightly increased in TFEBS211A-FLAG-expressing Tm-treated A/AHep cells (). However, TFEBS211A-FLAG-mediated transcriptional upregulation of Atf4 and the downstream target Ddit3 did not lead to increases of their protein levels, possibly due to the absence of EIF2S1 phosphorylation in A/AHep cells during ER stress [Citation7,Citation53,Citation78] (). Second, OE of TFEB[WT]-FLAG and TFEBS211A-FLAG increased expression of multiple autophagy genes (), but the transcriptional activity of TFEBS211AFLAG was much stronger than that of TFEB[WT]-FLAG, although their mRNA () and protein () levels were similar. LC3B conversion (LC3B-II:I ratio) as well as LC3B-I and II protein levels were higher in TFEB[WT]-FLAG- and TFEBS211A-FLAG-expressing A/AHep cells than in null expressing A/AHep cells at all time-points (). In addition, the protein level of SQSTM1 gradually decreased possibly due to autophagic degradation [Citation15,Citation16], whereas its mRNA level increased, in TFEBS211A-FLAG-expressing A/AHep cells treated with Tm (). The gradual decreases of LAMP1 and LAMP2 protein levels were slightly delayed by increases of their mRNA levels in TFEBS211A-FLAG-expressing A/AHep cells treated with Tm (compare lanes 2 and 3 with lanes 10 and 11) (). Expression levels of other lysosomal proteins (CTSB and CTSL) were increased in proportion to their mRNA levels in both TFEB[WT]-FLAG- and TFEBS211A-FLAG-expressing A/AHep cells (). Thus, we confirmed that TFEB activation in EIF2S1 phosphorylation-deficient cells can prevent dysregulated expression of autophagy genes during ER stress.
Next, based on the gene expression analysis, we reasoned that TFEBS211A-FLAG OE would improve autophagic processes such as autophagosome formation and autophagosome-lysosome fusion in A/AHep cells under ER stress conditions. To test this idea, we investigated whether TFEBS211A-FLAG OE increases the number of A/AHep cells containing LC3A/B-positive puncta after Tm treatment. TFEBS211A-FLAG OE markedly increased the number of A/AHep cells containing LC3A/B-positive puncta (~70%, graph) after Tm treatment, suggesting that active TFEB mutant OE alleviates dysregulated autophagosome formation in A/AHep cells during ER stress. Furthermore, TFEBS211A-FLAG OE attenuated perinuclear accumulation of LC3A/B-positive structures in Tm-treated A/AHep cells (). TFEB OE increased expression of several lysosomal genes such as Ctsb, Ctsd, Ctsl, Lamp1, Lamp2a, Lamp2b, and Tpp1 (). Therefore, we next determined the effects of TFEBS211A-FLAG OE on lysosome biogenesis and function under ER stress conditions. TFEBS211A-FLAG OE attenuated the decrease of LysoTracker Red staining intensity and increased perinuclear accumulation of lysosomes in A/AHep cells under ER stress conditions (). These results confirmed that TFEB activation can prevent lysosomal dysfunction in A/A cells under ER stress conditions. We next investigated if active TFEB mutant OE ameliorates the impairment of autolysosome formation in A/A cells during ER stress. TFEBS211A-FLAG OE significantly enhanced the colocalization of LC3A/B and LAMP1 in Tm-treated A/AHep cells (), indicating that autolysosome formation was increased. Collectively, these results demonstrate that TFEB activation can resolve most autophagic defects in EIF2S1 phosphorylation-deficient cells during ER stress.
The constitutively active TFEB mutant restores autophagic flux and promotes autophagic degradation of misfolded proteins in A/A cells
To substantiate the effects of TFEB on autophagy induced by ER stress in A/A cells, we performed TEM analyses of vector- and TFEBS211A-FLAG-expressing A/AHep cells treated with and without Tm. TFEBS211A-FLAG-expressing A/AHep cells exhibited an increased number of autolysosomes, whereas vector-expressing A/AHep cells had few autolysosomes after Tm treatment, indicating that constitutively active TFEB mutant OE increases autolysosome formation in A/A cells during ER stress (). However, in contrast with the activated ATF6 form, TFEBS211A-FLAG did not reduce the severity of ER fragmentation and accumulation of the fragmented ER tubules (yellow dotted areas in Tm-treated A/AHep panels of ), indicating that the altered ER structures observed in Tm-treated A/A cells are not critical obstacles of autophagy pathways. We next performed the autophagic flux assay using Baf A1 to biochemically confirm that TFEBS211A-FLAG expression changes autophagic activity in Tm-treated A/AHep cells. In the absence of Tm treatment, the increase (lanes 1–2 vs. lanes 3–4) of LC3-II levels induced by Baf A1 did not significantly differ between vector- and TFEBS211A-FLAG-expressing A/AHep cells (). By contrast, Tm treatment alone strongly decreased (lane 5 vs. lane 7) LC3-II levels in TFEBS211A-FLAG-expressing A/AHep cells compared with vector-expressing A/AHep cells, and consequently, the increase (lanes 5–6 vs. lanes 7–8) of LC3-II levels induced by Baf A1 was significantly higher in the former cells than in the latter cells. These results confirm that the constitutively active TFEB mutant restores autophagic flux in A/AHep cells under ER stress conditions.
Figure 10. OE of the constitutively active TFEB mutant rescues the autophagic flux defect in A/A cells during ER stress. (A and -C) Representative TEM images of vector- or TFEBS211A-FLAG-overexpressing A/AHep cells. Cells infected with vector- or TFEBS211A-FLAG-expressing adenoviruses for 24 h were treated with DMSO or Tm (1 µg/mL) for 24 h. (B) Quantification of the number of autolysosomes per cell in the TEM images in (A). Data are presented as mean ± SEM of three independent experiments (at least 15 cells per condition). The bottom panels in (A) are magnified images of the red boxes in the upper panels. Red arrowheads indicate autolysosomes and yellow arrows indicate the ER. The dotted yellow line defines a mass of dilated and fragmented ER structures. Scale bars: upper panels of (A) (2 µm) and bottom panels of (A) and (C) (0.5 µm). (D) WB analysis of LC3B in protein lysates of vector- or TFEBS211A-FLAG-overexpressing A/AHep cells. Cells infected with vector- or TFEBS211A-FLAG-expressing adenoviruses for 24 h were treated with DMSO or Tm (1 µg/mL) for 16 h in the absence or presence of the lysosomal inhibitor Baf A1 (200 nM) for 3 h before harvest. The graph depicts the LC3B-II level normalized to the ACTB level. Data are presented as mean ± SEM of three independent experiments, N.S., no significant difference. (E) WB analysis of ATZ in protein lysates of vector- or TFEBS211A-FLAG-overexpressing A/AHep cells. Cells were cotransfected with plasmids expressing ATZ and vector or TFEBS211A-FLAG for 24 h and then treated with DMSO, MG132 only (20 µM), or MG132 plus CHX (100 µg/mL) for 6 h. The graphs depict the ATZ level normalized to the ACTB level after treatment for 6 h. Data are presented as mean ± SEM of three independent experiments. A two-way ANOVA with Sidak’s post hoc test was used in (B), (D), and (E).
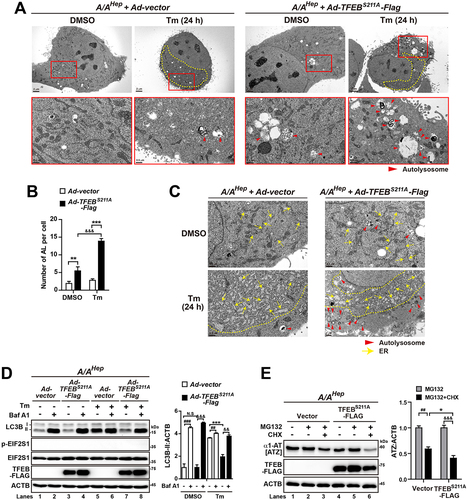
Finally, we examined the effects of constitutively active TFEB mutant OE on autophagic degradation of ATZ protein. ATZ-expressing A/AHep cells were cotreated with MG132 and CHX to retain only autophagic activity (). Therefore, upon cotreatment with MG132 and CHX, ATZ protein will be predominantly degraded by autophagy pathways. WB analysis revealed that cotreatment with MG132 and CHX for 6 h decreased the ATZ levels in both vector- and TFEBS211A-FLAG-expressing A/AHep cells (lanes 3 and 6). However, ATZ degradation was much more efficient in TFEBS211A-FLAG-expressing A/AHep cells than in vector-expressing A/AHep cells (, lane 3 vs. lane 6). These results indicate that the constitutively active TFEB mutant enhances autophagic degradation of misfolded proteins in A/A cells.
Discussion
In this study, we showed that EIF2S1 phosphorylation plays an essential role in nuclear translocation of TFEB and TFE3 during ER stress. Under ER stress conditions, EIF2S1 phosphorylation-deficient A/A cells display dysregulated expression of autophagy genes and impairment of several autophagic processes (such as autophagosome and autolysosome formation), which are regulated by the nuclear translocation and functional activity of TFEB and TFE3. Particularly, we revealed that OE of the activated ATF6 form (HA-ATF6[Citation1–373]), XBP1s, and ATF4, production of which was significantly reduced and delayed in A/A cells during ER stress, ameliorated these autophagic defects of A/A cells by promoting the nuclear translocation and functional activity of TFEB and TFE3. In turn, OE of a constitutively active TFEB mutant (TFEBS211A-FLAG) alleviated the autophagic defects of A/A cells during ER stress. Collectively, our results reveal how EIF2S1 phosphorylation connects the UPR pathways to autophagy.
As reported previously [Citation37], we found that nuclear translocation of TFEB in Tm-treated WT cells requires Ca2+-dependent PPP3 activation, TFEB dephosphorylation, and YWHA dissociation (, and Fig. S4A, C, D). Furthermore, we showed that EIF2AK3 was necessary for nuclear translocation of TFEB and TFE3 (Fig. S2A) [Citation37] because it contributed to cytosolic Ca2+ flux during ER stress (). Tm-mediated cytosolic Ca2+ flux was not reduced but increased in EIF2AK3-sufficient A/A cells () compared with S/S cells (). Likewise, A/A cells displayed TFEB dephosphorylation and YWHA dissociation similar to S/S cells under ER stress conditions (, and Fig. S4C), although TFEB dephosphorylation was delayed at earlier time points (). In addition, Tm treatment induced MTORC1 inhibition, which may contribute to reduced phosphorylation of TFEB in A/A cells (Fig. S4B). Nevertheless, nuclear translocation of TFEB and TFE3 was strongly suppressed in A/A cells under ER stress conditions (, Fig. S2, S3). However, experiments using the XPO1 inhibitor LMB revealed that activated TFEB translocated to the nucleus but was continuously re-exported to the cytosol via a XPO1-dependent nuclear export pathway in A/A cells under ER stress conditions (). Therefore, we postulate that the TFEB nuclear import pathway is not defective, but the TFEB nuclear export pathway is dysregulated in A/A cells during ER stress. Diverse PTMs including phosphorylation regulate nuclear translocation of TFEB and TFE3 [Citation28–32]. Most PTM studies focused on a change in the localizations of TFEB and TFE3 from the cytosol to the nucleus to explain their nuclear translocation [Citation31,Citation35–38]. However, recent reports including a study by Napolitano et al. [Citation29,Citation30,Citation41] imply that nuclear translocation of TFEB and TFE3 can be accomplished when their nuclear export pathway is inhibited because these TFs undergo nucleocytoplasmic shuttling.
Based on previous reports and our results described above, we propose three possible explanations for dysregulation of the TFEB nuclear export pathway in A/A cells during ER stress. First, dysregulation of the TFEB nuclear export pathway may arise due to malfunction of the XPO1-mediated nuclear export pathway. EIF2S1 phosphorylation deficiency may dysregulate the XPO1-mediated nuclear export pathway, which is responsible for nuclear export of diverse XPO1 cargo proteins [Citation89] including TFEB and TFE3, under ER stress conditions. However, this is not a plausible explanation because previous reports indicate that the XPO1-mediated nuclear export pathway works properly for nuclear localization or export of specific target proteins in A/A cells under ER stress conditions. For example, NFE2L2/NRF2 (NFE2 like bZIP transcription factor 2) is a TF essential for antioxidant response element-mediated gene expression and a direct EIF2AK3 substrate [Citation90]. Under normal conditions, NFE2L2 also continuously shuttles between the cytosol and nucleus via XPO1-dependent nuclear export [Citation89,Citation91]. However, Tm treatment induces nuclear translocation of NFE2L2 independently of EIF2S1 phosphorylation [Citation90]. In addition, it was reported that nuclear export of p53 mediated by EIF2S1 kinases such as EIF2AK3 and EIF2AK2/PKR occurs independently of EIF2S1 phosphorylation under ER stress conditions [Citation72]. Thus, dysregulation of the TFEB nuclear export pathway may arise due to impairment of a pathway that specifically exports TFEB and a few related proteins from the nucleus, rather than due to malfunction of the XPO1-mediated nuclear export pathway, which can affect diverse XPO1 cargo proteins.
Second, dysregulation of the TFEB nuclear export pathway may arise due to the absence or presence of a specific modification (such as phosphorylation or other PTMs) on a specific residue(s) of TFEB that can determine its nuclear export. Phosphorylation of S142 and S138 is proposed to be required for recognition and binding of the TFEB NES by XPO1 [Citation29,Citation30,Citation42], which is crucial for efficient nuclear export, whereas phosphorylation of S211 is required for cytosolic retention of TFEB via YWHA binding [Citation35–38]. Phosphorylation of S138 is dependent on prior phosphorylation of S142 [Citation29,Citation30]. Furthermore, reports indicate that S142 and/or S138 phosphorylation may be nuclear events mediated by several kinases such as MTORC1 (at S142 and S138), extracellular signal-regulated kinase (at S142), and GSK3B (at S138) [Citation29,Citation30]. Yin et al. reported that CDK4 and CDK6 interact with and phosphorylate TFEB on S142 in the nucleus [Citation41]. Thus, the status of S142 phosphorylation is an important determinant of TFEB nuclear export. However, dephosphorylation levels of total TFEB proteins on S142 were similar in S/S and A/A cells treated with Tm (, Fig. S4C), although its dephosphorylation in A/A cells was delayed at earlier time points (). Therefore, it is possible that impairment of TFEB nuclear translocation may not arise due to dysregulation of TFEB dephosphorylation on S142 in A/A cells during ER stress. However, although WB analysis of total TFEB proteins indicates that S142 of TFEB is dephosphorylated by Ca2+-dependent PPP3, we cannot rule out the possibility that S142 of nuclear TFEB is immediately and temporarily rephosphorylated by nuclear kinases (such as MTORC1 or CDK4 and CDK6), and that phosphorylated TFEB is rapidly exported to the cytosol in A/A cells during ER stress. Thus, even under ER stress conditions, the continuous cycle of nuclear import and export of TFEB according to its dephosphorylation and rephosphorylation may give the impression that it never enters the nuclei of A/A cells. Therefore, it is worth examining whether specific nuclear kinases (such as MTORC1 and CDK4 and CDK6) are activated and localized to the nucleus for rephosphorylation of TFEB on S142 in A/A cells during ER stress. These issues require further investigation.
Lastly, dysregulation of the TFEB nuclear export pathway may arise due to the lack of a TFEB-interacting nuclear protein that retains TFEB in the nucleus. In this report, we suggested that the activated ATF6 form (HA-ATF6[Citation1–373]) is a missing TFEB-interacting nuclear protein in A/A cells during ER stress. Co-IP assays (), the PLA (, Fig. S6B), and colocalization experiments (, Fig. S6C) indicate there is a physical interaction between TFEB and the activated ATF6 form, and that most of these complexes are in the nucleus, although the interaction might also occur in the cytosol. This nuclear interaction retains TFEB in the nucleus. In addition, this specific interaction can induce TFEB dephosphorylation, YWHA dissociation, and nuclear translocation of TFEB, regardless of ER stress. However, further studies are required to answer many questions about the detailed molecular mechanisms underlying activated ATF6 form-mediated dephosphorylation and nuclear translocation of TFEB. Furthermore, although we suggested that the activated ATF6 form promotes the nuclear translocation and functional activity of TFEB and TFE3 in A/A cells best among the tested UPR TFs because its activities were highest (based on the results presented in and Fig. S5A, S5D for nuclear translocation; and Fig. S5C, S8A, and S8B for autophagy gene expression; and and Fig. S9C-H for autophagosome/autolysosome formation), OE of other TFs (ATF4 and XBP1s) also significantly affected nuclear translocation and functional activities of TFEB and TFE3 in A/A cells (, Fig. S5, S8, and S9). In addition, expression and activation of ATF4, XBP1, and ATF6 are influenced by each other. ATF4 facilitates synthesis of ATF6 and its trafficking from the ER to the Golgi for its proteolytic activation [Citation14], although these effects were not observed in A/A cells (Fig. S8A, C). The activated ATF6 form activates transcription of the Xbp1 genes [Citation86] and heterodimerizes with XBP1s to induce UPR genes [Citation81]. In addition, we showed that activated ATF6 form OE increased the mRNA and protein levels of Atf4, Xbp1t, and Xbp1s (, Fig. S5B). Interestingly, XBP1s OE increased the mRNA level of Atf6 and its proteolytic activation in A/A cells (Fig. S5B, D). Furthermore, ATF4 is reportedly required to induce transcription of a set of autophagy genes in response to ER stress [Citation50] and hepatic OE of XBP1s enhances Tfeb transcription and autophagy [Citation92] (Fig. S8A, B). Thus, we cannot rule out the possibility that ATF4 and XBP1s play roles in activated ATF6 form-overexpressing A/A cells under ER stress conditions. Further studies are needed to investigate whether ATF4 and/or XBP1s are required for the improvement of autophagy by the activated ATF6 form, and how ATF4 and XBP1s promote the nuclear translocation and functional activities of TFEB and TFE3 in A/A cells during ER stress.
Under ER stress conditions, A/A cells displayed abnormal phenotypes of LC3A/B-positive structures (such as few autophagic puncta and perinuclear accumulated small LC3A/B-positive structures) (). Although expression of autophagy genes was not changed as much by the activated ATF6 form as by the constitutively active TFEB mutant (TFEBS211A-FLAG) ( vs. ), the activated ATF6 form prevented the abnormal phenotypes more strongly than the constitutively active TFEB mutant ( vs. ) in A/A cells during ER stress, indicating that the activated ATF6 form has additional roles in autophagy besides induction of nuclear translocation of TFEB and TFE3 in A/A cells. The ER is thought to be the central organelle for de novo lipid synthesis. De novo phosphatidylcholine synthesis is required for autophagosome membrane formation and maintenance during autophagy [Citation93,Citation94]. In addition, OE of the activated ATF6 form modulates enzymatic activities of the CDP-choline pathway and thereby enhances phosphatidylcholine biosynthesis and ER expansion [Citation88] (). Therefore, OE of the activated ATF6 form may increase de novo lipid synthesis required for autophagosome formation in ER membranes, which may not occur or be insufficient in A/A cells during ER stress. However, accumulation of the fragmented ER in Tm-treated A/AHep cells was prevented by the activated ATF6 form () but not by the constitutively active TFEB mutant (), indicating that the altered ER structures in Tm-treated A/A cells are not critical obstacles of autophagy pathways. Furthermore, extensive accumulation of the fragmented ER may indicate that lipid biosynthesis is increased in Tm-treated A/A cells. However, lipid biosynthesis may not provide specific or sufficient lipid species required for autophagosome formation during ER stress due to deficiency of the activated ATF6 form, indicating that A/A cells might require lipid biosynthesis mediated by the activated ATF6 form during ER stress. Further investigation is needed to define the molecular details of autophagy improvement by activated ATF6 form-mediated phosphatidylcholine synthesis in A/A cells during ER stress.
TFEB and TFE3 are members of the microphthalmia-associated TF family [Citation25]. Recent studies demonstrated that they bind to overlapping sets of promoters [Citation20,Citation26,Citation27] and are post-transcriptionally regulated through a similar mechanism [Citation35–38,Citation41]. Therefore, when overexpressed, TFEB can compensate for TFE3 deficiency and vice versa [Citation94]. However, analysis of tfeb and tfe3-double KO (tfeb−/−tfe3−/−) mice revealed the deficiency of both TFE3 and TFE3 results in additive effects with an aggravating hepatic phenotype in a study using a high-fat diet [Citation94]. In addition, a study of tfeb and tfe3-double KO immune cells showed that the reduction in expression of autophagy and immune genes is more pronounced in double KO cells than in single KO cells [Citation95]. These reports indicate that TFEB and TFE3 may play a co-operative role in diverse cellular responses including autophagy. We report here that OE of the active TFEB mutant (TFEBS211A-FLAG) rescued most autophagic defects of A/A cells such that autophagy was comparable with that in S/S cells under ER stress conditions ( vs. ). However, perinuclear accumulation of LC3A/B was not completely prevented and the efficiency of LC3A/B-positive puncta formation was not fully restored in TFEBS211A-FLAG-overexpressing A/A cells compared with S/S cells during ER stress ( vs ), suggesting that missing functions of activated TFE3 may be required to completely rescue all autophagy impairments in TFEBS211A-FLAG-overexpressing A/A cells. This issue requires further investigation.
Under ER stress conditions, cells induce autophagy in addition to the UPR, to restore ER homeostasis by degrading unfolded and aggregated proteins [Citation43–46]. Therefore, UPR pathways can directly and indirectly control autophagy through ER membrane localized proteins (such as ERN1 and ITPR [inositol 1,4,5-trisphosphate receptor]) and several UPR TFs (such as XBP1s, ATF4, DDIT3, and ATF6) [Citation45,Citation46]. Among these proteins, expression and activation of many TFs (such as XBP1s, ATF4, DDIT3, and ATF6) are regulated by EIF2S1 phosphorylation under ER stress conditions. Therefore, regulation of EIF2S1 phosphorylation may have a great impact on cellular homeostasis. Our findings suggest that fine-tuning of EIF2S1 phosphorylation can be a potential tool to treat rapidly growing tumors, which use both UPR and autophagy pathways to maintain cellular homeostasis.
Materials and methods
Reagents and antibodies
The information regarding reagents and antibodies is provided in .
Table 1. List of reagents used in this study.
Table 2. List of antibodies used in this study.
Expression vectors
The PCR primer pairs for plasmid cloning are listed in . To construct a lentiviral vector (pLenti-gATF6B-CRISPR-Bla) expressing a guide RNA (gRNA) sequence targeting ATF6B, lentiCRISPRv2, a gift from Feng Zhang (Addgene, 52,961), was used. The targeting sequence for ATF6B was CGACAACCTGCTGAGTCCGG. This sequence was cloned into the lentiCRISPRv2 plasmid to generate pLenti-gATF6B-CRISPR-Puro. Next, pLenti-gATF6B-CRISPR-Bla was constructed by replacing the puromycin N-acetyltransferase gene of pLenti-gATF6B-CRISPR-Puro with the blasticidin S deaminase gene of pLUB-IRES-Bla [Citation70]. The cDNA fragment encoding blasticidin S deaminase was amplified from the pLUB-IRES-Bla vector via PCR. The PCR product treated with BamHI and MluI was inserted into pLenti-gATF6B-CRISPR-Puro treated with the same restriction enzymes to construct pLenti-gATF6B-CRISPR-Bla.
Table 3. List of PCR primers used in this study.
The plasmid (pcDNA3.1-α1-antitrypsin mutant Z [ATZ]) expressing human SERPINA1/ATZ carrying a missense mutation (substitution of lysine for glutamate at amino acid 342) was provided by Professor Randal J. Kaufman (Degenerative Diseases Program, Sanford Burnham Prebys Medical Discovery Institute, La Jolla, CA, USA).
The pGL4.14–5XCLEAR-Firefly luciferase plasmid (named 5xCLEAR luciferase reporter) used to measure the transcriptional activity of TFEB was constructed by inserting the nucleotide sequence of 5XCLEAR-CMVmini-TATA into the NheI- and XhoI-digested pGL4.14 vector (Promega, E669A). The nucleotide sequence of 5XCLEAR-CMVmini-TATA was GCTAGCCCGGCCACGTGGCCGCAGGGTCACGTGACCCTGCGCACCAGGTGGTGCTGCCCGTCACCTGACGGTGCGGCTCAGCTGAGCCCCGTAGGCGTGTACGGTGGGAGGCCTATATAAGCAGAGCTCGTTTAGTGAACCGTCAGATCGCCTGGACTCGAG (underlined sequences indicate the five CLEAR motifs and one TATA sequence).
To generate WT EIF2S1- and EGFP-expressing lentiviral vectors, pLEF-EIF2S1[WT]-IRES-Bla and pLEF-EGFP-IRES-Bla plasmids were constructed, respectively. pLEF-IRES-Bla was constructed by replacing the CMV promoter of pLVX-IRES-Bla [Citation70] with the EEF1A1/EF-1α promoter of pEF-EGFP (Addgene, 11,154). The Ssp1-EcoRI fragment containing the EEF1A1 promoter from pEF-EGFP was inserted into pLVX-IRES-Bla treated with ClaI-Klenow-EcoRI. To construct pLEF-EIF2S1[WT]-IRES-Bla, the Eco47III-EcoRI fragment containing EIF2S1[WT] from pBabe-EIF2S1[WT] [Citation98] was inserted into pLEF-IRES-Bla treated with BamH1-Klenow-EcoRI. To construct pLEF-EGFP-IRES-Bla, the NotI-Klenow-EcoRI fragment containing EGFP from pEGFP-N1 (Clontech, 6085–1) was inserted into pLEF-IRES-Bla treated with BamHI-Klenow-EcoRI.
To construct pLEF-HA-Cas9-IRES-Bla, the HA-Cas9 fragment from p3s-Cas9-HN [Citation97] treated with SacI-T4 DNA polymerase was inserted into pLEF-IRES-Bla treated with SmaI.
To express EIF2S1S51A (substitution of alanine for serine at amino acid 51), the 3xFLAG-fused EIF2S1S51A-expressing pLUB-3xFlag-EIF2S1S51A-IRES-Puro plasmid was constructed. First, pLUB-IRES-Puro was constructed by replacing the blasticidin S deaminase gene of pLUB-IRES-Bla [Citation70] with the puromycin N-acetyltransferase gene of pLVX-AcGFP-N1 (Clontech, 632,154). The cDNA fragment encoding puromycin N-acetyltransferase was amplified from the pLVX-AcGFP-N1 vector via PCR. The PCR product treated with BstXI and BlpI was inserted into pLUB-IRES-Bla treated with the same restriction enzymes to construct pLUB-IRES-Puro. To generate the EIF2S1S51A sequence of the pLUB-3xFlag-EIF2S1S51A-IRES-Puro plasmid, pShuttle-CMV-EIF2S1S51A was first constructed. The coding sequence of EIF2S1S51A was amplified from pBabe-EIF2S1S51A [Citation98] via PCR. The PCR product treated with KpnI and XhoI was inserted into pShuttle-CMV (Addgene, 16,403) treated with the same restriction enzymes to construct pShuttle-CMV-EIF2S1S51A. Next, the cDNA fragment encoding EIF2S1S51A was transferred into p3xFlag-CMV-10 (Sigma-Aldrich, 32,190,102) to add an N-terminal 3xFLAG tag. The cDNA fragment encoding EIF2S1S51A was amplified from pShuttle-CMV-EIF2S1S51A via PCR. The PCR product treated with HindIII and EcoRI was inserted into p3xFlag-CMV treated with the same restriction enzymes to construct p3xFlag-CMV-EIF2S1S51A. Finally, the cDNA fragment encoding 3xFLAG-EIF2S1S51A was amplified from p3xFlag-CMV-EIF2S1S51A via PCR. The PCR product treated with BstBI and BamHI was inserted into pLUB-IRES-Puro treated with the same restriction enzymes to construct the pLUB-3xFlag-EIF2S1S51A-IRES-Puro plasmid.
To generate WT EIF2S1- and mutant EIF2S1S51A-expressing adenoviral vectors, pShuttle-CMV-EIF2S1[WT] and pShuttle-CMV-EIF2S1S51A plasmids were constructed, respectively. The construction strategy for the pShuttle-CMV-EIF2S1S51A plasmid was described above. To construct pShuttle-CMV-EIF2S1[WT], the cDNA fragment encoding WT EIF2S1 was amplified from pBabe-EIF2S1[WT] via PCR. The PCR product treated with KpnI and XhoI was inserted into pShuttle-CMV treated with the same restriction enzymes to construct the pShuttle-CMV-EIF2S1[WT] plasmid.
The human TFEB fused with EGFP-expressing pLUB-TFEB-EGFP-IRES-Bla and EGFP-expressing pLUB-EGFP-IRES-Bla plasmids were described elsewhere [Citation70].
To generate human C-terminally 3xFLAG-tagged WT TFEB- and mutant TFEBS211A-expressing adenoviral vectors, pShuttle-CMV-TFEB-3xFlag and pShuttle-CMV-TFEBS211A-3xFlag plasmids were constructed, respectively. pCMV-TFEB-3xFlag was constructed by inserting the cDNA fragment encoding human TFEB from pEGFP-N1-TFEB (Addgene, 38,119) treated with BglII and KpnI into p3xFlag-CMV-14 (Sigma-Aldrich, E7908) treated with the same restriction enzymes. To construct pShuttle-CMV-TFEB-3xFlag, the cDNA fragment encoding TFEB-3xFLAG was amplified from pCMV-TFEB-3xFlag via PCR. The PCR product treated with BglII and NotI was inserted into pShuttle-CMV treated with the same restriction enzymes to construct pShuttle-CMV-TFEB-3xFlag. pShuttle-CMV-TFEBS211A-3xFlag was constructed by inserting the cDNA fragment encoding TFEBS211A from pcDNA3.1-TFEBS211A-MYC (Addgene, 805) treated with EcoRI-HindIII-Klenow into pShuttle-CMV-TFEB-3xFlag treated with BglII-SalI-Klenow.
To express UPR TFs (ATF4, XBP1s, ATF6[Citation1–373] and ATF6B[Citation1–393]), pCGN-vector, pCGN-ATF6[Citation1–373], pCGN-IRES-DsRed2, pCGN-ATF4-IRES-DsRed2, pCGN-XBP1s-IRES-DsRed2, pCGN-ATF6[Citation1-373]-IRES-DsRed2, and pCGN-ATF6B[Citation1-393]-IRES-DsRed2 were used. The pCGN-ATF6[Citation1–373] plasmid encoding the N-terminal domain of human ATF6 (aa 1–373) with an hemagglutinin (HA) epitope tag at the N-terminus was described previously [Citation88]. To generate the pCGN-vector, the pCGN-ATF6[Citation1–373] plasmid was treated with XbaI and BamHI to remove the ATF6 (aa 1–373) coding sequence, and the linearized empty vector was self-ligated. The internal ribosome entry site (IRES)-driven Discosoma Sp. red fluorescent protein (DsRed2)-expressing plasmid (pCGN-IRES-DsRed2) was constructed by replacing EGFP of pCGN-IRES-EGFP [Citation88] with DsRed2 of pDsRed2-Nuc (Clontech, 632,408). To construct pCGN-IRES-DsRed2, the cDNA fragment encoding DsRed2 was amplified from pDsRed2-Nuc via PCR. The PCR product treated with BstXI and EagI was inserted into pCGN-IRES-EGFP treated with the same restriction enzymes to construct pCGN-IRES-DsRed2. pCGN-ATF4-IRES-DsRed2, pCGN-XBP1s-IRES-DsRed2, pCGN-ATF6[Citation1-373]-IRES-DsRed2, and pCGN-ATF6B[Citation1-393]-IRES-DsRed2 were constructed by replacing the IRES-EGFP of pCGN-ATF4-IRES-EGFP, pCGN-XBP1s-IRES-EGFP, pCGN-ATF6[Citation1-373]-IRES-EGFP, and pCGN-ATF6B[Citation1-393]-IRES-EGFP [Citation88] with IRES-DsRed2 of pCGN-IRES-DsRed2, respectively. The IRES-DsRed2 fragment obtained from pCGN-IRES-DsRed2 treated with EagI-Klenow-SalI was inserted into vectors treated with the same enzymes.
To generate the HA-ATF6[Citation1-373]-expressing adenoviral vector (named pShuttle-CMV-HA-ATF6[Citation1–373]), the BamHI-Klenow-NdeI fragment containing CMV-HA-ATF6[Citation1–373] from pCGN-ATF6[Citation1–373] was inserted into pShuttle-CMV treated with XhoI-Klenow-NdeI. The ATF4- and FLAG-XBP1s-expressing adenoviral vectors (pAD-Track-ATF4 and pAD-Track-Flag-XBP1s) were described previously [Citation99].
The HA-tagged YWHA-expressing plasmid (pcDNA3.1-HA-YWHA) was obtained from Professor Eek-Hoon Jho (Department of Life Science, University of Seoul, Seoul, Korea) [Citation100].
Transfection and virus production
Cells were transfected with plasmids using Mirus Bio™ TransIT™-LT1 transfection reagent (Fisher Scientific, MIR2306) according to the manufacturer’s instructions for 24–36 h (as described in each figure legend).
Recombinant adenoviruses expressing WT EIF2S1, mutant EIF2S1S51A, TFEB-3xFLAG, TFEBS211A-3xFLAG, HA-ATF6[Citation1–373], ATF4, or FLAG-XBP1s were generated using the AdEasy vector system according to the manufacturer’s instructions (Agilent Technologies, 240,009). In brief, BJ5183 cells were cotransformed with the shuttle vector (pShuttle-CMV-EIF2S1[WT], pShuttle-CMV-EIF2S1S51A, pShuttle-CMV-TFEB-3xFlag, pShuttle-CMV-TFEBS211A-3xFlag, pShuttle-CMV-HA-ATF6[Citation1–373]), pAD-Track-ATF4, or pAD-Track-Flag-XBP1s and the viral DNA plasmid pAdEasy-1 to generate a recombinant adenoviral plasmid. Then, HEK-293A cells were transfected with the recombinant adenoviral plasmids using the calcium phosphate technique to produce viral particles, which were purified using CsCI (Sigma-Aldrich, 3032) gradient centrifugation. The viral titer was determined using an AdEasy Viral Titer Kit (Aligent Technologies, 972,500) according to the manufacturer’s instructions.
To produce lentiviral particles expressing EIF2S1[WT], EGFP, HA-Cas9, or 3xFLAG-EIF2S1S51A proteins, or Atf6b-targeting gRNA, Lenti-X-293 T cells (Clontech Laboratories, 632,180) were cotransfected with each lentiviral construct (pLEF-EIF2S1[WT]-IRES-Bla, pLEF-EGFP-IRES-Bla, pLEF-HA-Cas9-IRES-Bla, pLUB-3xFlag-EIF2S1S51A-IRES-Puro, or pLenti-gATF6B-CRISPR-Bla) and a third-generation lentiviral packaging system (pRSV-Rev, pMD2-VSVG, and pMDLg/pRRE plasmids) using Mirus Bio™ TransIT™-LT1 transfection reagent. On the third day after transfection, lentiviruses were collected from the supernatant of Lenti-X-293 T cells, diluted in complete medium containing 8 µg/mL polybrene, and infected into cells for 48 h.
Cell lines and cell culture
All cell lines were incubated at 37°C in a humidified incubator containing 5% CO2. Immortalized hepatocytes (S/SHep, A/AHep, HEP-Atf6+/+, and HEP-atf6−/−) were cultured in Medium 199 (WelGENE, LM 006–01) supplemented with 10% fetal bovine serum (FBS; WelGENE, S 001–07) and 1% penicillin-streptomycin (WelGENE, LS 202–02) as previously described [Citation96]. MEFs (S/SMEF, A/AMEF, Eif2ak3+/+, eif2ak3−/−, MEF-Atf6+/+, and MEF-atf6−/−) were grown in Dulbecco’s modified Eagle’s medium (DMEM; WelGENE, LM 001–05) supplemented with 10% FBS, 1% penicillin-streptomycin, 2% MEM amino acids (WelGENE, LS 004–01), and 1% MEM nonessential amino acids (WelGENE, LS 005–01) [Citation53]. The HeLa cell line (Korean Cell Line Bank, 10,002) was cultured in MEM Alpha medium (Sigma-Aldrich, M0894) supplemented with 4.4 mg/mL sodium bicarbonate (Sigma-Aldrich, S6014), 10% FBS, and 1% penicillin-streptomycin. To induce starvation, cells were incubated in EBSS (1.8 mM CaCl2, 5.3 mM KCl, 0.8 mM MgSO4, 117 mM NaCl, 26 mM NaHCO3, 1 mM NaH2PO4, and 5.6 mM D(+)-glucose) for the indicated durations.
Generation of TFEB-EGFP- or EGFP-expressing S/SMEF and A/AMEF stable cell lines (named S/S-EGFP, S/S-TFEB-EGFP, A/A-EGFP, and A/A-TFEB-EGFP) was previously described [Citation70]. Briefly, S/SMEF or A/AMEF cells were infected with lentiviral particles containing the pLUB-EGFP-IRES-Bla or pLUB-TFEB-EGFP-IRES-Bla construct. Then, each stable cell line was isolated by blasticidin selection. Cells were maintained in DMEM supplemented with 10% FBS, 1% penicillin-streptomycin, 1% MEM nonessential amino acids, and 5 µg/mL blasticidin S HCl (Invitrogen, R21001).
EIF2S1 phosphorylation-deficient HeLa cells were generated using CRISPR-Cas9 genome editing technology. A HA-Cas9-expressing HeLa stable cell line (named HeLa-Cas9) was first generated by infecting HeLa cells with lentiviral particles containing pLEF-HA-Cas9-IRES-Bla. HA-Cas9-expressing HeLa stable cell lines were isolated by blasticidin selection (4 µg/mL [Invitrogen, R21001]). Among several HA-Cas9-positive clones identified, one stable cell line that showed high expression and nuclear localization of HA-Cas9 was chosen for subsequent experiments. Next, a HeLa-Cas9 cell line expressing 3xFLAG-EIF2S1S51A was generated by infecting HeLa-Cas9 cells with lentiviral particles containing pLUB-3xFLAG-EIF2S1S51A-IRES-Puro. An HA-Cas9- and 3xFLAG-EIF2S1S51A-overexpressing HeLa stable cell line [named HeLa-Cas9 EIF2S1S51A OE] was isolated by double selection with both blasticidin (2 µg/mL [Invitrogen, R21001]) and puromycin (5 µg/mL [Santa Cruz Biotechnology, sc-108,071]). Selection was confirmed by WB analysis using anti-FLAG (Sigma-Aldrich, F1804), anti-phospho-EIF2S1 (Abcam, ab32157), and anti-EIF2S1 (D-3) (Santa Cruz Biotechnology, sc-133,132) antibodies. Microscopic observation using an anti-FLAG antibody (Sigma-Aldrich, F1804) was conducted to check the cytosolic expression of 3xFLAG-EIF2S1S51A in HeLa-Cas9 EIF2S1S51A OE cells. Two CRISPR-Cas9 gRNA target sequences to delete exon 2 of Eif2s1 were identified bioinformatically using the CRISPR Design Tool available at http://www.rgenome.net/. The targeting sequences were CTCCAAGACCTAAGGATTAA for sgRNA1 and GGATCTTGATAATTGACTCA for sgRNA2. Custom-designed Alt-R® CRISPR-Cas9 crRNA (Integrated DNA Technologies, Inc.) and Alt-R® CRISPR-Cas9 tracrRNA (Integrated DNA Technologies, Inc., 1,072,532) were used to generate a functional gRNA duplex. HeLa-Cas9 EIF2S1S51A cells were nucleofected with both sgRNA1 and sgRNA2 duplexes using a SE Cell Line 4D-Nucleofector™ X Kit S (Lonza, V4XC-1032) on a 4D-Nucleofector® X Unit (Lonza, AAF-1003X) with program CN-114 according to the manufacturer’s instructions. Nucleofected cells were seeded as single clones (one cell/well) in 96-well plates. After 3–4 weeks, clones were screened for expression of EIF2S1 and phosphorylated EIF2S1 proteins by WB analysis. Sequencing was performed to confirm that the selected clone [named HeLa-Cas9 EIF2S1S51A OE EIF2S1 KO] expressed 3xFLAG-EIF2S1S51A but not endogenous EIF2S1.
Both ATF6- and ATF6B-deficient MEFs (named MEF-atf6−/−atf6b−/−) were generated using CRISPR-Cas9 genome editing technology. A MEF-atf6−/− cell line was infected with lentiviral particles containing pLenti-gATF6B-CRISPR-Bla. After incubation for 2 days, the infected cells were selected with blasticidin (5 µg/mL) for 3 days. Surviving cells were expanded as single colonies, and KO of ATF6B was confirmed via WB analysis.
WT EIF2S1- or EGFP-expressing A/AMEF stable cell lines were generated by infecting A/AMEF cells with lentiviral particles containing pLEF-EIF2S1[WT]-IRES-Bla or pLEF-EGFP-IRES-Bla, respectively. Infected A/AMEF cells were cultured in medium containing blasticidin (5 µg/mL [Invitrogen, R21001]) to establish A/AMEF-EIF2S1 or A/AMEF-EGFP stable cell lines. They were maintained in DMEM (WelGENE, LM 001–05) supplemented with 10% FBS (WelGENE, S 001–07), 1% penicillin-streptomycin (WelGENE, LS 202–02), 1% MEM nonessential amino acids (WelGENE, LS 005–01), and 5 µg/mL blasticidin S HCl (Invitrogen, R21001).
Subcellular fractionation
Cells were grown in 100 mm cell culture dishes until they reached about 90% confluency and were then treated with dimethyl sulfoxide (DMSO) or Tm for the indicated durations. After harvesting cells, the nuclear and cytoplasmic fractions were separated using a previously described procedure [Citation70]. The protein concentration was calculated, and the fractions underwent WB analysis.
Coimmunoprecipitation (co-IP) assay
S/S- and A/A-TFEB-EGFP MEFs were plated in 100 mm culture dishes at a density of 7 × 10⁵ cells/dish for longer than 16 h and treated with the specified chemicals for the indicated durations. In HA-ATF6[Citation1–373] OE experiments, A/A-TFEB-EGFP MEFs were plated in 100 mm culture dishes at a density of 7 × 10⁵ cells/dish. The next day, cells were transfected with pCGN-vector or pCGN-ATF6[Citation1–373] for 24 h and treated with DMSO or Tm (100 ng/mL) for 24 h. IP of TFEB-EGFP or HA-ATF6[Citation1–373] from the transfected A/A-TFEB-EGFP MEFs were performed using an anti-GFP antibody (Invitrogen) or anti-HA antibody (BioLegend), respectively, as described previously [Citation70].
Eif2ak3+/+ and eif2ak3 KO (eif2ak3−/−) MEFs were plated in 100 mm culture dishes at a density of 7 × 10⁵ cells/dish. The next day, cells were transfected with pLUB-TFEB-EGFP-IRES-Bla and pcDNA3.1-HA-YWHA for 24 h and treated with Tm (1 µg/mL) for 16 h. They were collected in complete growth medium and washed once with phosphate-buffered saline (PBS; 137 mM NaCl [Biosesang, SR1009-250-00], 2.7 mM KCl [USB Corporation, 20,598, discontinued], 1.8 mM KH2PO4 [Junsei, 84,185–0350], and 10 mM Na2HPO4 [FUJIFILM Wako Pure Chemical Corporation, 197–02865], pH 7.4). The pellets were dissolved in 300 µL IP lysis buffer (20 mM Tris-HCl, pH 7.5 [Biosesang, TR2016-050-75], 150 mM NaCl, 1% Triton X-100 [Sigma-Aldrich, T8787], 1 mM EDTA [Thermo Fisher Scientific, 1,861,275], 1 mM EGTA [BioShop Canada Inc., EDT 001], 2.5 mM sodium pyrophosphate [Sigma-Aldrich, P8010], 1 mM β-glycerophosphate [Sigma-Aldrich, G5422], and 1 mM sodium orthovanadate [Sigma-Aldrich, S6508]) supplemented with Half Protease Inhibitor Cocktail (Thermo Fisher Scientific, 1,861,279) at 1× final concentration. Cells were lysed by passing the samples through a 26 G needle ten times. Cell lysates were kept on ice for 30 min and centrifuged at 13,000 × g for 15 min at 4°C to collect soluble fractions. Then, 1.2 mg protein lysate and 2 µg/mL anti-GFP antibody (Invitrogen, A-11122) were diluted in 600 µL IP lysis buffer and rotated at 4°C for 6 h. The protein lysate-antibody complexes were transferred to 40 µL protein A/G agarose beads (Thermo Fisher Scientific, 20,423) (which had been cleaned with 700 µL IP lysis buffer containing 5% bovine serum albumin [BSA {Sigma-Aldrich, A7030}] overnight at 4°C) and incubated with rotation for an additional 2 h at 4°C. After incubation, the beads were washed five times with 1 mL IP lysis buffer. Samples were eluted in 40 µL of 2× sodium dodecyl sulfate (SDS) sample loading buffer (100 mM Tris-HCl [VWR Life Science, 0497], pH 6.8, 200 mM DTT [Promega, V3151], 4% SDS [Promega, H5114], 20% glycerol [USB Corporation, 16,374], and 0.2% bromophenol blue [Sigma-Aldrich, B-5525]); boiled at 100°C for 5 min; and separated by SDS-PAGE.
Western blot (WB) analysis
Cells were lysed in Nonidet P40 lysis buffer (1% IGEPAL CA-630 [NP40; Sigma-Aldrich, I8896], 50 mM Tris-HCl, pH 7.5, 150 mM NaCl, 0.05% SDS, 0.5 mM sodium orthovanadate, 100 mM NaF [Sigma-Aldrich, 201,154], 50 mM β-glycerophosphate, and Halt Protease Inhibitor Cocktail [Thermo Fisher Scientific, 78,437]). Cell lysates were centrifuged at 13,000 × g for 15 min at 4°C, and supernatants were collected. For WB analysis of ATF6 and ATF6B, the cells were treated with Tm for the indicated durations and then with MG132 (20 µM) for 1 h before harvesting samples. Cells were directly lysed in SDS lysis buffer (1% SDS, 50 mM Tris-Cl pH 7.5, 150 mM NaCl, 0.5 mM sodium orthovanadate, 100 mM NaF, and 50 mM β-glycerophosphate) supplemented with Halt Protease Inhibitor Cocktail (Thermo Fisher Scientific, 1,861,279). The lysates were immediately heated for 15 min at 100°C. The homogenates were centrifuged at 13,000 × g for 15 min at 4°C, and the supernatants were collected. Protein concentrations were determined using a Pierce™ BCA Protein Assay Kit (Thermo Fisher Scientific, 23,227). Cell lysates were subjected to WB analysis as described previously [Citation70].
RNA isolation and quantitative real-time polymerase chain reaction
Total RNA was isolated from cells treated with or without Tm for the indicated durations using QIAzol Lysis reagent (QIAGEN, QI-79306). cDNA was synthesized with a High-Capacity cDNA RT Kit (Applied Biosystems, ABS-4368814). Quantitative PCR was performed with Luna® Universal qPCR Master Mix (New England BioLabs, M3003X) and a StepOnePlus Real Time System (Applied Biosystems, CA, USA). The specificity of each primer pair was confirmed by melting curve analysis. The levels of target mRNAs were normalized to that of Actb mRNA. The qPCR primer pairs used in this study are listed in .
Table 4. List of qPCR primers used in this study.
Dual luciferase assay
The 5XCLEAR luciferase assay was performed to representatively assess the activities of TFEB-regulated genes. S/SMEF and A/AMEF cells were cultured overnight in 6-well plates at a density of 6 × 10⁴ cells/dish. Both pGL4.14–5XCLEAR-Firefly luciferase (for 5XCLEAR motif-driven fire luciferase) and pRL-CMV (for CMV promoter-driven Renilla luciferase) plasmids were transfected using Mirus Bio™ TransIT™-LT1 transfection reagent (Fisher Scientific, MIR2306). CMV promoter-driven Renilla luciferase was used to normalize the transfection and expression efficiencies. If necessary, the other indicated constructs (pCGN vectors [pCGN-IRES-DsRed2, pCGN-ATF4-IRES-DsRed2, pCGN-XBP1s-IRES-DsRed2, pCGN-ATF6[Citation1-373]-IRES-DsRed2, or pCGN-ATF6B[Citation1-393]-IRES-DsRed2] or pShuttle vectors [pShuttle-CMV, pShuttle-CMV-TFEB-3xFlag, or pShuttle-CMV-TFEBS211A-3xFlag]) were also cotransfected for 30 h according to the manufacturer’s instructions. After the chemical treatments, cells were washed once with PBS and harvested for luciferase assays using the Dual-Luciferase assay system (Promega, E1980) according to the manufacturer’s instructions. Chemiluminescent signals were measured using a Synergy HTX Multi-Mode Microplate Reader (Biotek Intrusments, Winooski, VT, USA). Firefly luciferase activity was normalized to Renilla luciferase activity for each sample. The presented data were replicated in at least three independent experiments.
Live cell imaging using confocal microscopy
Cells were plated on collagen-coated 35 mm glass bottom confocal dishes (SPL Life Science, 101,350) at a density of 1 × 10⁵ cells/dish. The next day, cells were treated with DMSO or Tm (1 µg/mL) in phenol-red free M199 culture medium (GIBCO, 11,043,023) for the indicated durations. In HA-ATF6[Citation1–373], ATF4, FLAG-XBP1s, or TFEBS211A-FLAG OE experiments, cells were infected with the indicated recombinant adenoviruses (Ad-vector, Ad-HA-ATF6[Citation1–373], Ad-ATF4 EGFP, Ad-Flag-XBP1s EGFP, or Ad-TFEBS211A-Flag) for 24 h before Tm treatment. During the last 30 min of the chemical treatment, the cell culture medium was supplemented with LysoTracker Red DND-99 (100 nM) and Hoechst 33,258 (10 µg/mL) to stain lysosomes and nuclei, respectively. Live cell imaging was performed using an FV1200-OSR confocal microscope (Olympus, Shinjuku, Japan). The intensity of LysoTracker Red staining was measured using the mean fluorescence intensity (MFI) tool of FV10-ASW-4.2 software (Olympus).
Immunofluorescence (IF) staining
Cells were plated on collagen-coated glass coverslips in 6-well dishes and cultured overnight. In experiments overexpressing specific proteins, cells were transfected with the indicated plasmids (pCGN-IRES-DsRed2, pCGN-ATF4-IRES-DsRed2, pCGN-XBP1s-IRES-DsRed2, pCGN-ATF6[Citation1-373]-IRES-DsRed2, or pCGN-ATF6B[Citation1-393]-IRES-DsRed2) or infected with the indicated recombinant adenoviruses (Ad-vector, Ad-HA-ATF6[Citation1–373], Ad-ATF4 EGFP, Ad-Flag-XBP1s/EGFP, Ad-EIF2S1[WT], Ad-EIF2S1S51A, Ad-TFEB[WT]-Flag, or Ad-TFEBS211A-Flag) for 24 h before Tm treatment. Cells were treated with the indicated chemicals for the indicated durations, rinsed twice with PBS, fixed with 4% paraformaldehyde diluted in PBS for 15 min, and permeabilized with 0.1% Triton X-100 (Sigma-Aldrich, T8787) diluted in PBS for 5 min. To visualize LC3A/B, SQSTM1, and LAMP1 puncta, cells on coverslips were fixed with 100% methanol (SK Chemical, L260-18) for 10 min at −20°C, washed twice with PBS, blocked with 3% BSA (Sigma-Aldrich, A7030) diluted in PBS for 1 h, and incubated with the indicated primary antibodies (labeled as “IF” in the antibody description section) overnight at 4°C. Cells were incubated with fluorescence-conjugated secondary antibodies for 1 h at room temperature. Nuclei were stained with DAPI (Invitrogen, D1306). Finally, coverslips were mounted using ProLong Gold mounting medium (Invitrogen, P36930). Cells were observed by confocal laser microscopy using a FV1200-OSR confocal microscope (Olympus). Images in colocalization experiments of HA-ATF6[Citation1–373] and TFEB-EGFP were obtained using Airyscan super-resolution mode with a Zeiss LSM-780 inverted confocal laser scanning microscope (Carl Zeiss Microscopy, Germany) using a Plan-Apochromat 100×/1.46 oil immersion objective lens, and were processed and analyzed with ZEN 2 (Carl Zeiss Microscopy). Colocalization of LC3A/B and SQSTM1, SQSTM1 and LAMP1, LC3A/B and LAMP1 was measured using the Pearson’s Correlation Coefficient calculator tool of FV10-ASW-4.2 software (Olympus).
Transmission electron microscopy (TEM) analysis
Cells were seeded in 100 mm culture dishes at a density of 7 × 10⁴ cells/dish, cultured for at least 16 h, and then treated with Tm (1 µg/mL) for 24 h. In experiments overexpressing HA-ATF6[Citation1–373] or TFEBS211A-FLAG, cells were infected with the indicated recombinant adenoviruses (Ad-vector, Ad-HA-ATF6[Citation1–373], or Ad-TFEBS211A-Flag) for 24 h before Tm treatment. Cells on dishes were washed twice with 0.1 M phosphate buffer (0.02 M NaH2PO4 [Sigma-Aldrich, S8282] and 0.08 M Na2HPO4 [FUJIFILM Wako Pure Chemical Corporation, 197–02865], pH 7.4), and were fixed by immersion in 2.5% glutaraldehyde (Electron Microscopy Sciences, 16,220) diluted in 0.1 M phosphate buffer for 2 h at room temperature. Cells were rinsed twice with 0.1 M phosphate buffer and postfixed with 1% osmium tetroxide (Sigma-Aldrich, 75,632) diluted in 0.1 M phosphate buffer for 1 h at 4°C. Next, samples were dehydrated with a series of graded ethyl alcohol solution (Merck Millipore, 1.00983) and then with acetone (Fisher Scientific, A18-4). The samples were next embedded in EPON 812. Ultrathin sections (70–80 nm) were obtained using an ultramicrotome (Leica Ultracut UCT, Wetzlar, Germany), costained with uranyl acetate (Fisher Scientific, NC1375332) and lead citrate (Fisher Scientific, NC1588038), and examined using a transmission electron microscope (JEM-1010; JEOL, Tokyo, Japan) at 60 kV.
Measurement of intracellular Ca2+ concentrations
MEFs were plated on 0.1% gelatin-coated microscope cover glasses (Paul Marienfeld GmbH & Co. KG, 0111550) at a density of 7 × 10⁴ cells/dish and cultured overnight. Cells were loaded with 1 µM Fura-2/AM (Thermo Fisher Scientific, F1221) in DMEM at 37°C for 30 min. Ratiometric Ca2+ imaging was performed at 340 and 380 nm in 2 mM Ca2+ Tyrode’s solution (129 mM NaCl, 5 mM KCl, 2 mM CaCl2, 1 mM MgCl2, 30 mM glucose, and 25 mM HEPES) containing Tm (10 µg/mL) using an IDX81 fluorescence microscope (Olympus) equipped with an Olympus 40× oil objective lens (NA 1.30), a fluorescent arc lamp (Sutter Instrument, LAMBDA LS), an excitation filter wheel (Sutter Instrument, LAMBDA 10–2), a stage controller (Applied Scientific, MS-2000), and a CCD camera (Hamamatsu, C10600) at room temperature. Images were acquired for 5 min with a time interval of 4 s. Fluorescence intensity profiles were processed with MetaMorph (Molecular Devices, San Jose, CA, USA) and analyzed with Igor software (WaveMetrics, Portland, OR, USA).
Proximity ligation assay (PLA)
A/A-TFEB-EGFP MEFs were plated on collagen-coated glass coverslips in 6-well dishes at a density of 1 × 10⁵ cells/dish, cultured overnight, transfected with pCGN-vector or pCGN-ATF6[Citation1–373] for 30 h, and treated with Tm (100 ng/mL) for 16 h. Thereafter, cells were rinsed twice with PBS, fixed with 3.5% paraformaldehyde diluted in PBS for 15 min, and permeabilized with 0.1% Triton X-100 diluted in PBS for 5 min. Finally, cells were blocked with 3% BSA diluted in PBS for 1 h and incubated with primary antibodies (anti-GFP [Invitrogen, A-11122] and anti-HA [Santa Cruz Biotechnology, sc-7392]) overnight at 4°C. The PLA was performed using a Duolink In Situ Red Starter Kit (Sigma-Aldrich, DUO92101) according to the manufacturer’s protocol. Images were obtained using an FV1200-OSR confocal microscope (Olympus). Cells were classified into three groups, namely, those with PLA-positive signals in the nucleus, the nucleus and cytosol, or the cytosol. The ratio of the MFI in the nucleus to that in the cytosol was quantified using CellProfiler software (https://cellprofiler.org/, Broad institute, USA). This ratio was ≥1.2, ≤0.7 and <1.2, and <0.7 in the nucleus, nucleus and cytosol, and cytosol groups, respectively. The PLA signal in the nucleus was measured using the MFI tool of FV10-ASW-4.2 software (Olympus).
Statistical analysis
All data are presented as mean ± standard error of the mean (SEM). All experiments were performed at least three times as indicated. Statistical analyses of all data were performed using the Student’s t-test, a one-way ANOVA, or a two-way ANOVA as indicated in the figure legends using GraphPad Prism 8.4.3 (GraphPad Software, San Diego, CA, USA). Statistical significance is indicated in the figures (*,#,&p < 0.05, **,##,&&p < 0.01, ***,###,&&&p < 0.001).
Supplemental Material
Download MS Word (6 MB)Acknowledgments
We thank Randal J. Kaufman (Sanford Burnham Prebys Medical Discovery Institute) for providing cells (S/SMEF, S/SHep, A/AMEF, A/AHep, Eif2ak3+/+, eif2ak3−/−, HEP-Atf6+/+, HEP-atf6−/−, MEF-Atf6+/+, and MEF-atf6α−/−) and a plasmid (pcDNA3.1-α1-antitrypsin mutant Z [ATZ]), and the UNIST-Olympus Biomed Imaging Center for their expertise and assistance with using the Zeiss LSM 780 inverted confocal laser scanning microscope.
Disclosure statement
No potential conflict of interest was reported by the authors.
Supplementary material
Supplemental data for this article can be accessed online at https://doi.org/10.1080/15548627.2023.2173900
Additional information
Funding
References
- Sonenberg N, Hinnebusch AG. Regulation of translation initiation in eukaryotes: mechanisms and biological targets. Cell. 2009;136(4):731–745.
- Donnelly N, Gorman AM, Gupta S, et al. The eIF2alpha kinases: their structures and functions. Cell Mol Life Sci. 2013;70:3493–3511.
- Wek RC, Jiang HY, Anthony TG. Coping with stress: eIF2 kinases and translational control. Biochem Soc Trans. 2006;34:7–11.
- Taniuchi S, Miyake M, Tsugawa K, et al. Integrated stress response of vertebrates is regulated by four eIF2alpha kinases. Sci Rep. 2016;6:32886.
- Young SK, Wek RC. Upstream open reading frames differentially regulate gene-specific translation in the integrated stress response. J Biol Chem. 2016;291:16927–16935.
- Back SH. Roles of the translation initiation factor eif2alpha phosphorylation in cell structure and function. Cell Struct Funct. 2020;45:65–76.
- Pakos-Zebrucka K, Koryga I, Mnich K, et al. The integrated stress response. EMBO Rep. 2016;17:1374–1395.
- Ron D. Translational control in the endoplasmic reticulum stress response. J Clin Invest. 2002;110:1383–1388.
- Walter P, Ron D. The unfolded protein response: from stress pathway to homeostatic regulation. Science. 2011;334:1081–1086.
- Wang M, Kaufman RJ. Protein misfolding in the endoplasmic reticulum as a conduit to human disease. Nature. 2016;529:326–335.
- Yoshida H. ER stress and diseases. FEBS J. 2007;274:630–658.
- Back SH, Kaufman RJ. Endoplasmic reticulum stress and type 2 diabetes. Annu Rev Biochem. 2012;81:767–793.
- Majumder M, Huang C, Snider MD, et al. A novel feedback loop regulates the response to endoplasmic reticulum stress via the cooperation of cytoplasmic splicing and mRNA translation. Mol Cell Biol. 2012;32:992–1003.
- Teske BF, Wek SA, Bunpo P, et al. The eIF2 kinase PERK and the integrated stress response facilitate activation of ATF6 during endoplasmic reticulum stress. Mol Biol Cell. 2011;22:4390–4405.
- Mizushima N. Autophagy: process and function. Genes Dev. 2007;21:2861–2873.
- Yang Z, Klionsky DJ. Mammalian autophagy: core molecular machinery and signaling regulation. Curr Opin Cell Biol. 2010;22:124–131.
- Dikic I, Elazar Z. Mechanism and medical implications of mammalian autophagy. Nat Rev Mol Cell Biol. 2018;19:349–364.
- Li L, Tong M, Fu Y, et al. Lipids and membrane-associated proteins in autophagy. Protein Cell. 2021;12:520–544.
- Nakamura S, Yoshimori T. New insights into autophagosome-lysosome fusion. J Cell Sci. 2017;130:1209–1216.
- Palmieri M, Impey S, Kang H, et al. Characterization of the CLEAR network reveals an integrated control of cellular clearance pathways. Hum Mol Genet. 2011;20:3852–3866.
- Galluzzi L, Baehrecke EH, Ballabio A, et al. Molecular definitions of autophagy and related processes. EMBO J. 2017;36:1811–1836.
- Raben N, Puertollano R. TFEB and TFE3: linking lysosomes to cellular adaptation to stress. Annu Rev Cell Dev Biol. 2016;32:255–278.
- Di Malta C, Cinque L, Settembre C. Transcriptional regulation of autophagy: mechanisms and diseases. Front Cell Dev Biol. 2019;7:114.
- Napolitano G, Ballabio A. TFEB at a glance. J Cell Sci. 2016;129:2475–2481.
- Steingrimsson E, Copeland NG, Jenkins NA. Melanocytes and the microphthalmia transcription factor network. Annu Rev Genet. 2004;38:365–411.
- Sardiello M, Palmieri M, Di Ronza A, et al. A gene network regulating lysosomal biogenesis and function. Science. 2009;325:473–477.
- Settembre C, Di MC, VA P, et al. TFEB links autophagy to lysosomal biogenesis. Science. 2011;332:1429–1433.
- Li M, Wang Z, Wang P, et al. TFEB: a emerging regulator in lipid homeostasis for atherosclerosis. Front Physiol. 2021;12:639920.
- Li L, Friedrichsen HJ, Andrews S, et al. A TFEB nuclear export signal integrates amino acid supply and glucose availability. Nat Commun. 2018;9:2685.
- Napolitano G, Esposito A, Choi H, et al. mTOR-dependent phosphorylation controls TFEB nuclear export. Nat Commun. 2018;9:3312.
- Puertollano R, Ferguson SM, Brugarolas J, et al. The complex relationship between TFEB transcription factor phosphorylation and subcellular localization. EMBO J. 2018;37:e98804.
- Zhu SY, Yao RQ, Li YX, et al. The role and regulatory mechanism of transcription factor EB in health and diseases. Front Cell Dev Biol. 2021;9:667750.
- Martina JA, Chen Y, Gucek M, et al. MTORC1 functions as a transcriptional regulator of autophagy by preventing nuclear transport of TFEB. Autophagy. 2012;8:903–914.
- Pena-Llopis S, Vega-Rubin-de-Celis S, Schwartz JC, et al. Regulation of TFEB and V-ATPases by mTORC1. EMBO J. 2011;30:3242–3258.
- Roczniak-Ferguson A, Petit CS, Froehlich F, et al. The transcription factor TFEB links mTORC1 signaling to transcriptional control of lysosome homeostasis. Sci Signal. 2012;5:ra42.
- Settembre C, Zoncu R, Medina DL, et al. A lysosome-to-nucleus signalling mechanism senses and regulates the lysosome via mTOR and TFEB. EMBO J. 2012;31:1095–1108.
- Martina JA, Diab HI, Brady OA, et al. TFEB and TFE3 are novel components of the integrated stress response. EMBO J. 2016;35:479–495.
- Martina JA, Diab HI, Lishu L, et al. The nutrient-responsive transcription factor TFE3 promotes autophagy, lysosomal biogenesis, and clearance of cellular debris. Sci Signal. 2014;7:ra9.
- Medina DL, Di Paola S, Peluso I, et al. Lysosomal calcium signalling regulates autophagy through calcineurin and TFEB. Nat Cell Biol. 2015;17:288–299.
- Wang W, Gao Q, Yang M, et al. Up-regulation of lysosomal TRPML1 channels is essential for lysosomal adaptation to nutrient starvation. Proc Natl Acad Sci U S A. 2015;112:E1373–81.
- Yin Q, Jian Y, Xu M, et al. CDK4/6 regulate lysosome biogenesis through TFEB/TFE3. J Cell Biol. 2020;219(8):e201911036.
- Silvestrini MJ, Johnson JR, Kumar AV, et al. Nuclear export inhibition enhances HLH-30/TFEB activity, autophagy, and lifespan. Cell Rep. 2018;23:1915–1921.
- Yorimitsu T, Nair U, Yang Z, et al. Endoplasmic reticulum stress triggers autophagy. J Biol Chem. 2006;281:30299–30304.
- Ogata M, Hino S, Saito A, et al. Autophagy is activated for cell survival after endoplasmic reticulum stress. Mol Cell Biol. 2006;26:9220–9231.
- Deegan S, Saveljeva S, Gorman AM, et al. Stress-induced self-cannibalism: on the regulation of autophagy by endoplasmic reticulum stress. Cell Mol Life Sci. 2013;70:2425–2441.
- Rashid HO, Yadav RK, Kim HR, et al. ER stress: autophagy induction, inhibition and selection. Autophagy. 2015;11:1956–1977.
- Nakashima A, Cheng SB, Kusabiraki T, et al. Endoplasmic reticulum stress disrupts lysosomal homeostasis and induces blockade of autophagic flux in human trophoblasts. Sci Rep. 2019;9:11466.
- Kouroku Y, Fujita E, Tanida I, et al. ER stress (PERK/eIF2alpha phosphorylation) mediates the polyglutamine-induced LC3 conversion, an essential step for autophagy formation. Cell Death Differ. 2007;14:230–239.
- Humeau J, Leduc M, Cerrato G, et al. Phosphorylation of eukaryotic initiation factor-2alpha (eIF2alpha) in autophagy. Cell Death Dis. 2020;11:433.
- B’Chir W, Maurin AC, Carraro V, et al. The eIF2alpha/ATF4 pathway is essential for stress-induced autophagy gene expression. Nucleic Acids Res. 2013;41:7683–7699.
- Back SH, Scheuner D, Han J, et al. Translation attenuation through eIF2alpha phosphorylation prevents oxidative stress and maintains the differentiated state in beta cells. Cell Metab. 2009;10:13–26.
- Palam LR, Baird TD, Wek RC. Phosphorylation of eIF2 facilitates ribosomal bypass of an inhibitory upstream ORF to enhance CHOP translation. J Biol Chem. 2011;286:10939–10949.
- Han J, Back SH, Hur J, et al. ER-stress-induced transcriptional regulation increases protein synthesis leading to cell death. Nat Cell Biol. 2013;15:481–490.
- Glembotski CC, Arrieta A, Blackwood EA, et al. ATF6 as a nodal regulator of proteostasis in the heart. Front Physiol. 2020;11:267.
- Luhr M, Torgersen ML, Szalai P, et al. The kinase PERK and the transcription factor ATF4 play distinct and essential roles in autophagy resulting from tunicamycin-induced ER stress. J Biol Chem. 2019;294:8197–8217.
- Ganley IG, Wong PM, Gammoh N, et al. Distinct autophagosomal-lysosomal fusion mechanism revealed by thapsigargin-induced autophagy arrest. Mol Cell. 2011;42:731–743.
- Chandrika BB, Yang C, Ou Y, et al. Endoplasmic reticulum stress-induced autophagy provides cytoprotection from chemical hypoxia and oxidant injury and ameliorates renal ischemia-reperfusion injury. PLoS One. 2015;10:e0140025.
- Shen HM, Mizushima N. At the end of the autophagic road: an emerging understanding of lysosomal functions in autophagy. Trends Biochem Sci. 2014;39:61–71.
- Korolchuk VI, Saiki S, Lichtenberg M, et al. Lysosomal positioning coordinates cellular nutrient responses. Nat Cell Biol. 2011;13:453–460.
- Pu J, Guardia CM, Keren-Kaplan T, et al. Mechanisms and functions of lysosome positioning. J Cell Sci. 2016;129:4329–4339.
- Willett R, Martina JA, Zewe JP, et al. TFEB regulates lysosomal positioning by modulating TMEM55B expression and JIP4 recruitment to lysosomes. Nat Commun. 2017;8:1580.
- Arruda AP, Pers BM, Parlakgul G, et al. Chronic enrichment of hepatic endoplasmic reticulum-mitochondria contact leads to mitochondrial dysfunction in obesity. Nat Med. 2014;20:1427–1435.
- Rutkowski DT, Arnold SM, Miller CN, et al. Adaptation to ER stress is mediated by differential stabilities of pro-survival and pro-apoptotic mRNAs and proteins. PLoS Biol. 2006;4:e374.
- Mauvezin C, Nagy P, Juhasz G, et al. Autophagosome-lysosome fusion is independent of V-ATPase-mediated acidification. Nat Commun. 2015;6:7007.
- Yoshii SR, Mizushima N. Monitoring and measuring autophagy. Int J Mol Sci. 2017;18(9):1865.
- Klionsky DJ, Abdel-Aziz AK, Abdelfatah S, et al. Guidelines for the use and interpretation of assays for monitoring autophagy (4th edition)(1). Autophagy. 2021;17:1–382.
- Perlmutter DH. Alpha-1-antitrypsin deficiency: importance of proteasomal and autophagic degradative pathways in disposal of liver disease-associated protein aggregates. Annu Rev Med. 2011;62:333–345.
- Silverman GA, Pak SC, Perlmutter DH. Disorders of protein misfolding: alpha-1-antitrypsin deficiency as prototype. J Pediatr. 2013;163:320–326.
- Zheng G, Zhan Y, Li X, et al. TFEB, a potential therapeutic target for osteoarthritis via autophagy regulation. Cell Death Dis. 2018;9:858.
- Dang TT, Back SH. Translation inhibitors activate autophagy master regulators TFEB and TFE3. Int J Mol Sci. 2021;22(21):12083.
- Smith MD, Harley ME, Kemp AJ, et al. CCPG1 is a non-canonical autophagy cargo receptor essential for ER-phagy and pancreatic ER proteostasis. Dev Cell. 2018;44:217–32 e11.
- Baltzis D, Pluquet O, Papadakis AI, et al. The eIF2alpha kinases PERK and PKR activate glycogen synthase kinase 3 to promote the proteasomal degradation of p53. J Biol Chem. 2007;282:31675–31687.
- Pluquet O, Qu LK, Baltzis D, et al. Endoplasmic reticulum stress accelerates p53 degradation by the cooperative actions of Hdm2 and glycogen synthase kinase 3beta. Mol Cell Biol. 2005;25:9392–9405.
- Huang G, Yao J, Zeng W, et al. ER stress disrupts Ca2+-signaling complexes and Ca2+ regulation in secretory and muscle cells from PERK-knockout mice. J Cell Sci. 2006;119:153–161.
- van Vliet AR, Giordano F, Gerlo S, et al. The ER stress sensor PERK coordinates ER-plasma membrane contact site formation through interaction with Filamin-A and F-Actin remodeling. Mol Cell. 2017;65:885–99 e6.
- Wang R, McGrath BC, Kopp RF, et al. Insulin secretion and Ca2+ dynamics in beta-cells are regulated by PERK (EIF2AK3) in concert with calcineurin. J Biol Chem. 2013;288:33824–33836.
- Scheuner D, Song B, McEwen E, et al. Translational control is required for the unfolded protein response and in vivo glucose homeostasis. Mol Cell. 2001;7:1165–1176.
- Kaufman RJ. Regulation of mRNA translation by protein folding in the endoplasmic reticulum. Trends Biochem Sci. 2004;29:152–158.
- Vattem KM, Wek RC. Reinitiation involving upstream ORFs regulates ATF4 mRNA translation in mammalian cells. Proc Natl Acad Sci U S A. 2004;101:11269–11274.
- Lu PD, Harding HP, Ron D. Translation reinitiation at alternative open reading frames regulates gene expression in an integrated stress response. J Cell Biol. 2004;167:27–33.
- Yamamoto K, Sato T, Matsui T, et al. Transcriptional induction of mammalian ER quality control proteins is mediated by single or combined action of ATF6alpha and XBP1. Dev Cell. 2007;13:365–376.
- Wu J, Rutkowski DT, Dubois M, et al. ATF6alpha optimizes long-term endoplasmic reticulum function to protect cells from chronic stress. Dev Cell. 2007;13:351–364.
- Yoshida H, Haze K, Yanagi H, et al. Identification of the cis-acting endoplasmic reticulum stress response element responsible for transcriptional induction of mammalian glucose-regulated proteins. Involvement of basic leucine zipper transcription factors. J Biol Chem. 1998;273:33741–33749.
- Spaan CN, Smit WL, van Lidth de Jeude JF, et al. Expression of UPR effector proteins ATF6 and XBP1 reduce colorectal cancer cell proliferation and stemness by activating PERK signaling. Cell Death Dis. 2019;10:490.
- Ma Y, Brewer JW, Diehl JA, et al. Two distinct stress signaling pathways converge upon the CHOP promoter during the mammalian unfolded protein response. J Mol Biol. 2002;318:1351–1365.
- Yoshida H, Okada T, Haze K, et al. ATF6 activated by proteolysis binds in the presence of NF-Y (CBF) directly to the cis-acting element responsible for the mammalian unfolded protein response. Mol Cell Biol. 2000;20:6755–6767.
- Yang H, Niemeijer M, van de Water B, et al. ATF6 is a critical determinant of CHOP dynamics during the unfolded protein response. iScience. 2020;23:100860.
- Bommiasamy H, Back SH, Fagone P, et al. ATF6alpha induces XBP1-independent expansion of the endoplasmic reticulum. J Cell Sci. 2009;122:1626–1636.
- Ishizawa J, Kojima K, Hail N Jr., et al. Expression, function, and targeting of the nuclear exporter chromosome region maintenance 1 (CRM1) protein. Pharmacol Ther. 2015;153:25–35.
- Cullinan SB, Zhang D, Hannink M, et al. Nrf2 is a direct PERK substrate and effector of PERK-dependent cell survival. Mol Cell Biol. 2003;23:7198–7209.
- Li W, Jain MR, Chen C, et al. Nrf2 Possesses a redox-insensitive nuclear export signal overlapping with the leucine zipper motif. J Biol Chem. 2005;280:28430–28438.
- Zhang Z, Qian Q, Li M, et al. The unfolded protein response regulates hepatic autophagy by sXBP1-mediated activation of TFEB. Autophagy. 2021;17:1841–1855.
- Andrejeva G, Gowan S, Lin G, et al. De novo phosphatidylcholine synthesis is required for autophagosome membrane formation and maintenance during autophagy. Autophagy. 2020;16:1044–1060.
- Pastore N, Vainshtein A, Klisch TJ, et al. TFE3 regulates whole-body energy metabolism in cooperation with TFEB. EMBO Mol Med. 2017;9:605–621.
- Pastore N, Brady OA, Diab HI, et al. TFEB and TFE3 cooperate in the regulation of the innate immune response in activated macrophages. Autophagy. 2016;12:1240–1258.
- Kim MJ, Choi WG, Ahn KJ, et al. Reduced EGFR level in eIF2alpha phosphorylation-deficient hepatocytes is responsible for susceptibility to oxidative stress. Mol Cells. 2020;43:264–275.
- Kim S, Bae T, Hwang J, et al. Rescue of high-specificity Cas9 variants using sgRNAs with matched 5’ nucleotides. Genome Biol. 2017;18:218.
- Harding HP, Zhang Y, Scheuner D, et al. Ppp1r15 gene knockout reveals an essential role for translation initiation factor 2 alpha (eIF2alpha) dephosphorylation in mammalian development. Proc Natl Acad Sci U S A. 2009;106:1832–1837.
- Kim SH, Kim KH, Kim HK, et al. Fibroblast growth factor 21 participates in adaptation to endoplasmic reticulum stress and attenuates obesity-induced hepatic metabolic stress. Diabetologia. 2015;58:809–818.
- Kim S, Song G, Lee T, et al. PARsylated transcription factor EB (TFEB) regulates the expression of a subset of Wnt target genes by forming a complex with beta-catenin-TCF/LEF1. Cell Death Differ. 2021;28:2555–2570.