
ABSTRACT
Neuroinflammation caused by microglial activation and consequent neurological impairment are prominent features of diabetes-associated cognitive impairment (DACI). Microglial lipophagy, a significant fraction of autophagy contributing to lipid homeostasis and inflammation, had mostly been ignored in DACI. Microglial lipid droplets (LDs) accumulation is a characteristic of aging, however, little is known about the pathological role of microglial lipophagy and LDs in DACI. Therefore, we hypothesized that microglial lipophagy could be an Achilles’s heel exploitable to develop effective strategies for DACI therapy. Here, starting with characterization of microglial accumulation of LDs in leptin receptor-deficient (db/db) mice and in high-fat diet and STZ (HFD/STZ) induced T2DM mice, as well as in high-glucose (HG)-treated mice BV2, human HMC3 and primary mice microglia, we revealed that HG-dampened lipophagy was responsible for LDs accumulation in microglia. Mechanistically, accumulated LDs colocalized with the microglial specific inflammatory amplifier TREM1 (triggering receptor expressed on myeloid cells 1), resulting in the buildup of microglial TREM1, which in turn aggravates HG-induced lipophagy damage and subsequently promoted HG-induced neuroinflammatory cascades via NLRP3 (NLR family pyrin domain containing 3) inflammasome. Moreover, pharmacological blockade of TREM1 with LP17 in db/db mice and HFD/STZ mice inhibited accumulation of LDs and TREM1, reduced hippocampal neuronal inflammatory damage, and consequently improved cognitive functions. Taken together, these findings uncover a previously unappreciated mechanism of impaired lipophagy-induced TREM1 accumulation in microglia and neuroinflammation in DACI, suggesting its translational potential as an attractive therapeutic target for delaying diabetes-associated cognitive decline.
Abbreviations: ACTB: beta actin; AIF1/IBA1: allograft inflammatory factor 1; ALB: albumin; ARG1: arginase 1; ATG3: autophagy related 3; Baf: bafilomycin A1; BECN1: beclin 1, autophagy related; BW: body weight; CNS: central nervous system; Co-IP: co-immunoprecipitation; DACI: diabetes-associated cognitive impairment; DAPI: 4’,6-diamidino-2-phenylindole; DGs: dentate gyrus; DLG4/PSD95: discs large MAGUK scaffold protein 4; DMEM: Dulbecco’s modified Eagle’s medium; DSST: digit symbol substitution test; EDTA: ethylenedinitrilotetraacetic acid; ELISA: enzyme linked immunosorbent assay; GFAP: glial fibrillary acidic protein; HFD: high-fat diet; HG: high glucose; IFNG/IFN-γ: interferon gamma; IL1B/IL-1β: interleukin 1 beta; IL4: interleukin 4; IL6: interleukin 6; IL10: interleukin 10; LDs: lipid droplets; LPS: lipopolysaccharide; MAP2: microtubule associated protein 2; MAP1LC3B/LC3B: microtubule associated protein 1 light chain 3 beta; MWM: morris water maze; NFKB/NF-κB: nuclear factor of kappa light polypeptide gene enhancer in B cells; NLRP3: NLR family pyrin domain containing 3; NOS2/iNOS: nitric oxide synthase 2, inducible; NOR: novel object recognition; OA: oleic acid; PA: palmitic acid; PBS: phosphate-buffered saline; PFA: paraformaldehyde; PLIN2: perilipin 2; PLIN3: perilipin 3; PS: penicillin-streptomycin solution; RAPA: rapamycin; RBFOX3/NeuN: RNA binding protein, fox-1 homolog (C. elegans) 3; RELA/p65: RELA proto-oncogene, NF-kB subunit; ROS: reactive oxygen species; RT: room temperature; RT-qPCR: Reverse transcription quantitative real-time polymerase chain reaction; STZ: streptozotocin; SQSTM1/p62: sequestosome 1; SYK: spleen asociated tyrosine kinase; SYP: synaptophysin; T2DM: type 2 diabetes mellitus; TNF/TNF-α: tumor necrosis factor; TREM1: triggering receptor expressed on myeloid cells 1; TUNEL: terminal deoxynucleotidyl transferase-mediated dUTP-biotin nick end labeling;
Introduction
Diabetes mellitus has become a global health concern, accompanying by increasing prevalence in both absolute and relative numbers [Citation1,Citation2]. As a chronic and progressive metabolic disorder, it produces a chronic inflammatory state and a disordered lipid metabolism leading to hypertriglyceridemia, which extensively deteriorates the organs and tissues, including central nervous system (CNS) [Citation3–5]. Substantial epidemiological evidence supports that cognitive impairment is a common, while severely underestimated complication of diabetes [Citation6,Citation7]. However, the current understanding of diabetes-associated cognitive impairment (DACI) is still in its infancy stage.
Neuroinflammation is an important factor contributing to cognitive impairment and neurodegenerative diseases. Chronic activation of microglia and excessive release of the proinflammatory mediators result in expression of costimulatory molecules, which leads to neuroinflammation and neuronal dysfunction, such as neuronal apoptosis, loss of dendritic complexity, reduced number of synapses, decreased plasticity, etc., implying the importance of microglial homeostasis in determining the destiny of neuronal functions [Citation8–11]. A growing body of evidence reports that autophagy regulates inflammation and activation of microglia. Lipophagy, a selective type of autophagy that targets lipid droplets (LDs) exerts an important regulatory role on degradation and accumulation of LDs in other cells [Citation12]. After the exciting finding of the glial lipid accumulation as characteristic for aging, LDs in microglia had mostly been ignored. In aged mice, the number of the density of cerebral lipid-laden cells increased in distinct regions of the aging brain. These cells may participate in the age-associated neurodegenerative process [Citation13]. In several Drosophila mutants, neuronal mitochondrial defects lead to LD accumulation in glia [Citation14]. In lipopolysaccharide (LPS)-stimulated microglia and hypothalamus of mouse and human brain with metabolic conditions such as type 2 diabetes (T2DM), LDs accumulation has also been reported [Citation15,Citation16]. However, little is known about the dynamic changes of LDs and the pathological role of microglial lipophagy in DACI.
TREM1 (triggering receptor expressed on myeloid cells 1), widely expressed in monocytes and microglia, has a specific role in amplifying oxidative burst and pro-inflammatory cytokine secretion [Citation17,Citation18]. TREM1 exacerbates neuroinflammatory injury [Citation19], while blockage or inhibition of TREM1 exerts protective effect against subarachnoid hemorrhage, stroke, myocardial infarction, and inflammatory bowel diseases [Citation19–22]. TREM1-induced lipid deposition has been reported in atherosclerotic subendothelium [Citation23,Citation24]. As a specific microglial receptor, the association between TREM1 and microglial lipophagy has not been reported.
In the present study, we hypothesize that TREM1 represents a central player for neuroinflammation in DACI. We first report that high-glucose (HG)-impaired microglial lipophagy is responsible for microglia-specific LDs accumulation and elevated TREM1, which mainly engulfed by LDs. Elevated TREM1 potently augments the microglial neuroinflammatory via NLRP3 (NLR family pyrin domain containing 3), and inhibition of TREM1 improve cognitive function in T2DM mice. Our findings establish a distinct role for microglial lipophagy and TREM1 mediated neuroinflammation in DACI.
Results
Accumulation of LDs and impaired lipophagy in hippocampal microglia of db/db mice and HFD/STZ mice
A striking accumulation of LDs has been reported in microglia of aging mice [Citation25], enabling us to explore the presence and distribution of LDs in brain of T2DM mice with cognitive dysfunction. We first examined the LDs distribution in the brain of db/db mice using a major LD protein PLIN2 (perilipin 2), and observed a significantly increased accumulation of LDs in cortex and hippocampus, but rarely in corpus callosum, thalamus, hypothalamus and amygdala ( and Fig. S1A). The coronal brain sections were then immunostained with a microglia marker AIF1/IBA1 (allograft inflammatory factor 1), a marker of mature astrocytes GFAP (glial fibrillary acidic protein), a neuron marker RBFOX3/NeuN (RNA binding protein, fox-1 homolog [C. elegans] 3) and PLIN2, or BODIPY, a dye commonly used to detect lipid droplets. Interestingly, we observed a prominently increased accumulation of LDs in microglia, but not in astrocytes and neurons (and Fig. S1A, Video S1). Subsequent analyses mainly concentrated on hippocampus as it is a critical region in the assessment of cognitive function. The increased PLIN2+ LDs in hippocampus (dentate gyrus [DGs], CA1 and CA3 regions) of db/db mice were concentrated along with AIF1+ microglia, particularly in CA3 (). Immunostaining of LDs with BODIPY and Oil red O staining further confirmed that increased LDs were mainly distributed in microglia of hippocampal CA3 region ( and Fig. S1B).
Figure 1. Accumulation of LDs and impaired lipophagy in hippocampal microglia of db/db mice. (A) Immunostaining of PLIN2+ (LDs) and AIF1+ (microglia), and quantification of PLIN2+ microglia (yellow arrow) in the hippocampi of db/m and db/db mice. Brain tissues were analyzed from five independent experiments (n = 5 mice per group). Scale bar: 50 μm. (B) Representative 3D reconstructions of LDs in astrocyte and in neurons in CA3 region of the hippocampus of db/db mice. Scale bar: 50 μm. (C) Representative 3D reconstructions of BODIPY+ (LDs) and AIF1+ (microglia), and quantification of BODIPY+ microglia in CA3 region of hippocampus. Scale bar: 15 μm. (D) Representative electron microscope images showing autophagosome (arrow), lipophagosome (quadrangle) and LDs (yellow) in the hippocampal microglia (n = 3 mice per group). Scale bar: 1 μm. (E) Representative 3D reconstructions of microglial lipophagy and quantification of LC3B puncta and SQSTM1 puncta in the hippocampal microglia. Lipophagy was visualized using LC3B and SQSTM1, and microglia were visualized using AIF1. Scale bar: 50 μm. ** P < 0.01, *** P < 0.001.
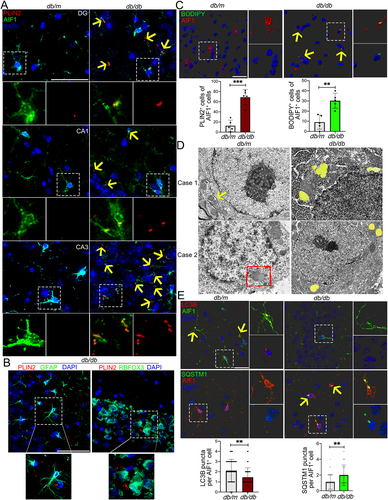
As LDs could be eliminated by the autophagy through a process termed lipophagy [Citation26], microglial lipophagy was then determined. The results of transmission electron microscopy showed increased LDs and decreased lipophagosome in the hippocampus of db/db mice (). Immunostaining results revealed a significant reduction in MAP1LC3B/LC3B (microtubule associated protein 1 light chain 3 beta) puncta, as well as a marked enrichment in SQSTM1/p62 (sequestosome 1) puncta in AIF1+ hippocampal microglia (, Video S2). Similarly, a striking accumulation of LDs and a significantly impairment of lipophagy were further observed in AIF1-positive hippocampal microglia of high-fat diet and STZ (HFD/STZ) mice (Fig. S1C).
HG-dampened lipophagy was responsible for accumulation of LDs in microglia in vitro.
To corroborate our finding of microglia-specific LDs accumulation in T2DM mice, BV2 cells were treated with plasma collected from db/m and db/db mice. In agreement with the animal results, BODIPY- and PLIN2-positive LDs were noticeably increased in BV2 cells treated with hyperglycemic plasma (EDTA [ethylenedinitrilotetraacetic acid] and lipid were removed) from db/db mice (). Hyperglycemia is a major character of diabetic condition, triggering progressive structural and functional abnormalities of brain. We next probed if high glucose played ciritical roles in LDs accumulation by culture of BV2 cells in a Dulbecco’s modified Eagle’s medium (DMEM) medium containing different concentrations of glucose (5.5, 25, and 50 mM) for indicated time points (24, 48, and 72 h). As expected, a time-dependent accumulation of LDs in BV cells treated with 25 and 50 mM glucose were observed, with a peak accumulation after 72 h culture with 25 and 50 mM glucose (, Fig. S2A and S2B). Accordingly, 25 mM glucose and culture for 72 h were considered for subsequent in vitro experiments. Predicted accumulation of LDs encouraged us to examine the microglia lipophagy impairment upon HG culture. Consistently, decreased lipophagy, as indicated by decreased LC3B puncta and increased SQSTM1 puncta, was found in BV2 cells treated with plasma from db/db mice () and 25 mM glucose (). The results of transmission electron microscopy () and western blotting (Fig. S2C) confirmed that HG stimulated accumulation of LDs and lipophagy impairment in BV2 cells. Parallel analyses of primary microglia further revealed similar results (Fig. S2D). However, LDs accumulation was not observed in HG-treated GFAP+ primary astrocytes and MAP2+ (microtubule associated protein 2) primary neurons (Fig. S2E and S2F).
Figure 2. HG-dampened lipophagy was responsible for the accumulation of LDs in microglia. (A and B) Immunostaining and representative Imaris 3D reconstructions of BODIPY+- and PLIN2 +-LDs in BV2 cells treated with plasma of db/m and db/db mice (A) and treated with 5.5 mM and 25 mM glucose for 72 h (B). Scale bar: 25 μm. The percent of cells with BODIPY+ puncta and PLIN2 + puncta were quantified. (C and D) Confocal images and quantifications of LC3B puncta and SQSTM1 puncta in BV2 cells treated with plasma of db/m and db/db mice (C) and treated with 5.5 mM and 25 mM glucose for 72 h (D). Scale bar: 25 μm. (E) Representative electron microscope images of autophagosome (arrow) and LDs (yellow) of BV2 cells. Scale bar: 1 μm. (F and G) Validation of LC3B-I/II, SQSTM1 and PLIN2 expressions in BV cells treated with glucose and Baf (F) or RAPA (G) via western blotting. ACTB was used as control. *P < 0.05, ** P < 0.01, *** P < 0.001.
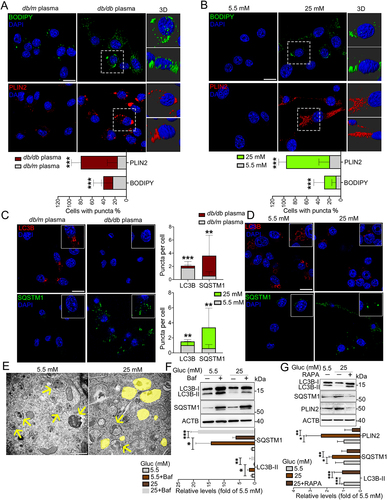
Impaired lipophagy inspired us to explore in which stage it occurred. To probe this question, autophagy inhibitor bafilomycin A1 (Baf) and activator rapamycin (RAPA) was utilized to induce BV2 cells. Addition of Baf significantly induced the expression levels of LC3B-II and SQSTM1, suggesting that HG dampened the initiation of lipophagy, rather than the autophagy-lysosome fusion stage (). Addition of RAPA reversed HG-impaired lipophagy (increased LC3B-II and decreased SQSTM1) and LDs accumulation (decreased PLIN2) (), suggesting that HG-dampened lipophagy was responsible for accumulation of LDs in BV2 cells.
Plasma of aged T2DM patients induced LDs accumulation and inhibited lipophagy in human microglia HMC3 cells.
We next perform in vitro experiment using plasma of elderly T2DM patients and corresponding health controls for the treatment of HMC3 cells. Serum glycated ALB (albumin), a glycemic monitoring indicator representing the average level of blood glucose in the past 2–4 weeks, was significantly higher in T2DM patients than that in healthy controls (). Upon treatment with hyperglycemic plasma, significantly increased percentage of PLIN2+ HMC3 cells, as well as increased SQSTM1 puncta and decreased LC3B puncta in HMC3 cells were observed (). Notably, the number of PLIN2+ HMC3 cells was negatively correlated with digit symbol substitution test (DSST) score (P = 0.029) (), while the number of LC3B (P = 0.152) and SQSTM1 puncta (P = 0.855) showed no correlation with DSST score (Fig. S2G and S2H).
Figure 3. Plasma of aged T2DM patients induced accumulation of LDs and inhibited lipophagy in human HMC3 cells. (A) Level of plasma glycated ALB (albumin) in healthy controls (n = 14) and T2DM patients (n = 15) (The normal reference value of serum glycated ALB is 11–17%). (B) Representative micrographs of HMC3 cells treated with plasma of healthy controls and T2DM patients. Lipophagy was both visualized using LC3B and SQSTM1, and LDs were visualized using PLIN2. Scale bar: 50 μm. (C) the number of LC3B puncta, SQSTM1 puncta and PLIN2+ cells were quantified. (D) the association between the number of PLIN2+ HMC3 cells and DSST score of all participants were analyzed. (E) Confocal images of HMC3 cells treated with glucose for 72 h. Lipophagy was both visualized using LC3B and SQSTM1, and LDs were visualized using PLIN2. The number of LC3B puncta, SQSTM1 puncta and PLIN2 puncta were quantified. Scale bar: 50 μm. (F) Validation of LC3B-I/II, SQSTM1 and PLIN2 expressions in HMC3 cells via western blotting. ACTB was used as control. *P < 0.05, ** P < 0.01, *** P < 0.001.
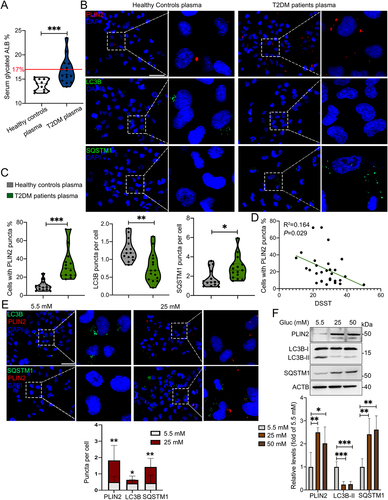
We further treated HMC3 cells with 5.5 mM and 25 mM glucose and observed significantly increased number of PLIN2+ LDs and SQSTM1 puncta as well as decreased number of LC3B puncta in HG-treated cells (). Moreover, HG induced the expression of PLIN2 and SQSTM1, and inhibited the expression of LC3B-II (). Collectively, the results indicated that HG impaired lipophagy and triggered accumulation of LDs in microglia in vitro and in vivo.
Buildup of TREM1 in HG- and hyperglycemic plasma-cultured microglia and hippocampal microglia of db/db mice and HFD/STZ mice.
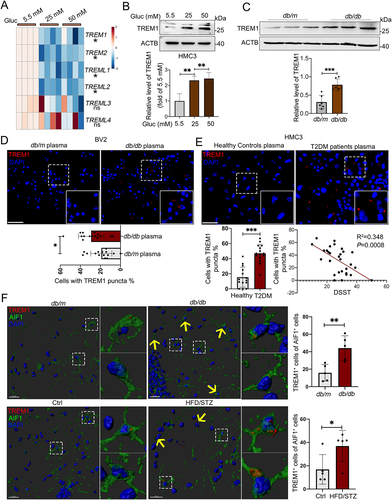
It is well-known that TREM and TREML (TREM-like) receptors in microglial cells are crucial receptors of modulating the inflammatory response [Citation27]. We then asked whether these receptors participated in accumulation of LDs and lipophagy under hyperglycemic conditions. Upon HG stimulation, TREM1 and TREM2 mRNA levels were both markedly decreased in HMC3 () and BV2 cells (Fig. S3A). In contrast to the decreased mRNA level, the TREM1 protein level was significantly induced by HG in HMC3 cells () and BV2 cells (Fig. S3B), while the protein level of TREM2 were consistently decreased in HG-treated BV2 cells (Fig. S3C). Next, we found that the Trem1 mRNA expression in the hippocampi of db/db mice and db/m mice showed no significant difference (Fig. S3D), while noticeably higher protein expression in the hippocampus of db/db mice were observed (). In the hippocampus of db/db mice, TREM1-positive cells were observed in DGs, CA1, and CA3 regions, with the majority locating in the CA3 region (Fig. S3E). Consistently, immunostaining further showed that the percentage of TREM1+ cells was significantly increased in BV2 cells () and in HMC3 cells treated with hyperglycemic plasma (). Moreover, the percentage of TREM1+ HMC3 cells was negatively correlated with DSST score (P = 0.0008) (). We next performed immunostaining on brain sections of T2DM and corresponding control mice, and found that robust TREM1 puncta were co-stained with AIF1+ microglia in the hippocampi of db/db and HFD/STZ mice, confirming a microglial autonomous increment of TREM1 ().
Figure 4. Increased protein level of TREM1 in hyperglycemic plasma or HG-cultured microglia and in the hippocampal microglia of db/db mice. (A) the mRNA expression levels of TREM and TREML receptors were analyzed by RT-Qpcr and TREM1 protein expressions was detected via western blotting (B). ACTB was used as control. (C) Western blotting analysis of TREM1 protein expressions and (D) confocal images of TREM1 in BV2 cells treated with plasma of db/db mice. Scale bar: 50 μm. (E) Confocal images of TREM1 in HMC3 cells treated with T2DM patients plasma. The number of TREM1+ cells were quantified. Scale bar: 50 μm. (F) Representative Imaris 3D reconstructions of TREM1-positive expression in IBA+ microglia of the hippocampi of db/db and HFD/STZ mice. TREM1-positive cells were quantified. Scale bar: 50 μm. *P < 0.05, ** P < 0.01, *** P < 0.001.
HG induced colocalization of TREM1 with LDs in microglia in vivo and in vitro
Given that microglial autonomous increment of TREM1 was surprisingly consistent with accumulated LDs in vivo and in vitro, we further investigate their correlation in microglia. Upon culture with T2DM patients plasma or HG, TREM1 puncta were mainly enriched or overlapped in PLIN2+ LDs of HMC3 cells (), BV2 cells (Fig. S4A) and primary microglia (Fig. S4B). These observations prompted us to detect TREM1 and LDs accumulation under other conditions. Therefore, HMC3 cells were cultured with LPS, palmitic acid (PA) or oleic acid (OA) to induce LDs accumulation, and the overlap of TREM1 and PLIN2+ LDs were still observed, suggesting that TREM1 was colocalized with LDs in activated microglia (Fig. S4C). Importantly, in HMC3 cells cultured with hyperglycemic plasma, the colocalization of TREM1 clusters and PLIN2+ LDs showed different morphologies. Representative morphologies were shown in , as TREM1 located in the adjacent area of PLIN2+ LDs (the top panel), or partially overlapped to PLIN2+ area (the second panel), or completely engulfed by PLIN2+ LDs (the third panel). Besides, enriched TREM1 clusters were also observed in LDs that were undergoing fusion (the bottom panel). These different morphologies were also observed in BV2 cells cultured with db/db mice plasma (). Notably, in the hippocampal microglia of db/db and HFD/STZ mice, colocalization of TREM1 with PLIN2+ LDs was also detected (, Video S3).
Figure 5. HG induced colocalization of TREM1 with LDs in microglial cells in vivo and in vitro. Representative immunostaining of TREM1 and PLIN2 in HMC3 cells cultured with plasma from T2DM patients (A) and HG (B). The number of TREM1+ cells in PLIN2− and PLIN2+ cells were quantified. Scale bar: 50 μm. (C and D) Representative micrographs of TREM1 and PLIN2 in different morphologies in HMC3 cells cultured with plasma from T2DM patients (C) and BV2 cells cultured with plasma from db/db mice (D). Scale bar: 10 μm. (E) Representative Imaris 3D reconstructions of colocalization of TREM1 and PLIN2 in the hippocampal microglia of db/db mice (upper panel) and HFD/STZ mice (lower panel). The number of TREM1+ cells in PLIN2− and PLIN2+ cells were quantified. (n = 5 mice per group, scale bar: 15 μm). (F) Co-IP validation of TREM1 and PLIN2 interaction in HMC3 cells cultured with HG. (G) Western blotting analysis of the expression of TREM1 and its downstream protein, phospho-SYK in HG and RAPA treated HMC3. ACTB was used as control. *P < 0.05, ** P < 0.01, *** P < 0.001.
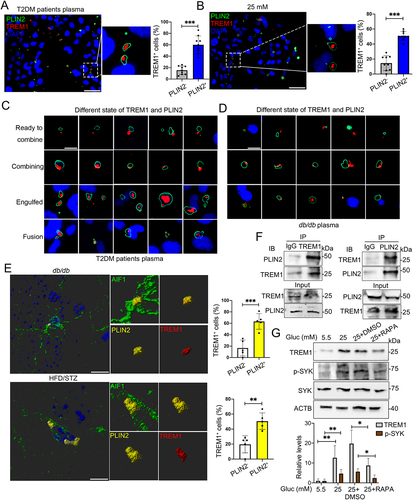
We next performed ZDOCK to investigate the interaction between TREM1 and PLIN3 (perilipin 3) (given that the PLIN2 structure was not analyzed in PDB website, PLIN3 and PLIN2 both belong to the perilipin family with similar structural domains). A stable protein docking model of PLIN3 into the V-type domain of TREM1 was revealed, with a ZDOCK score of 961.149 (Fig. S4D). TREM1 and PLIN3 formed a stable protein dock by hydrogen bond links at amino acid sites such as ALA21-ASP42, THR22-ASP127 and LYS23-LYS40. We further performed co-IP (co-immunoprecipitation) analysis in HMC3 cells, and confirmed the interaction between TREM1 and PLIN2 in HG environment (). Next, we examined whether the HG-induced lipophagy impairment was responsible for the buildup of TREM1 and the colocalization of TREM1 and LDs. Upon addition of RAPA, the expression of TREM1 and its downstream protein, phospho-SYK (spleen tyrosine kinase), were significantly reduced in HG-treated cells (). These findings suggested that HG induced colocalization of TREM1 to accumulated LDs may contribute to the buildup of TREM1 in microglia in vivo and in vitro.
Suppression of TREM1 pathway rescued lipophagy impairment and LDs accumulation in HG-stimulated microglia
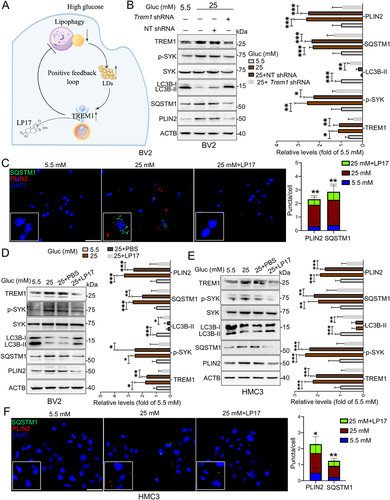
Emerging evidence suggests that TREM1 plays critical roles in autophagy [Citation28,Citation29]. We then asked if HG induced colocalization of TREM1 and subsequently higher TREM1 levels could in turn affect microglial lipophagy and LDs accumulation (). Knockdown of TREM1 in BV2 cells by specific shRNA significantly reduced the expression of phospho-SYK, and relieved HG-induced lipophagy impairment and LDs accumulation, as indicated by increased LC3B-II level and decreased levels of SQSTM1 and PLIN2 (). Next, HG-induced BV2 cells were co-treated with LP17, a TREM1 specific inhibitory peptide. As shown in , LP17 administration significantly alleviated HG-induced aggregation of SQSTM1 puncta and PLIN2 puncta, and reversed HG-induced expression of phospho-SYK, LC3B-II, SQSTM1 and PLIN2 in BV2 cells (). Similar effects of LP17 were observed in HG-induced HMC3 cells () and primary microglia (Fig. S4E), suggesting that suppression of TREM1 could recover lipophagy impairment and LDs accumulation in HG-stimulated microglial cells.
Figure 6. Suppression of TREM1 reversed impairment of lipophagy and accumulation of LDs in HG-stimulated microglia. (A) Schematic diagram for HG-impaired lipophagy, accumulation of LDs and TREM1 in microglia. (B) Western blotting analysis of TREM1, phospho-SYK, LC3B-I/II, SQSTM1 and PLIN2 expressions in Trem1-specific shRNA-infected BV2 cells. *P < 0.05, ** P < 0.01, *** P < 0.001. (C) Representative micrographs of BV2 cells co-treated with glucose and LP17. Lipophagy was visualized using SQSTM1 puncta, and LDs were visualized using PLIN2 puncta. The numbers of SQSTM1 puncta and PLIN2 puncta were quantified. Scale bar: 50 μm. ** P < 0.01: 25 mM vs 25 mM + LP17. (D and E) Western blotting analysis of phospho-SYK, LC3B-I/II, SQSTM1 and PLIN2 expressions in BV2 cells (D) and HMC3 cells (E) co-treated with glucose and LP17. ACTB was used as control. *P < 0.05, ** P < 0.01, *** P < 0.001. (F) Representative micrographs of lipophagy in HMC3 cells co-treated with glucose and LP17 via immunostaining with SQSTM1 and PLIN2. The number of SQSTM1 puncta and PLIN2 puncta were quantified. Scale bar: 50 μm. *P < 0.05, ** P < 0.01: 25 mM vs 25 mM + LP17.
Buildup of TREM1 promoted HG-induced neuroinflammatory and ROS production via NLRP3 inflammasome activation
One characteristic of microglia in neurodegeneration is the increased production of inflammatory cytokines following immune challenge, and recent studies have reported the correlation of age-associated lipid accumulation in microglia with proinflammatory response [Citation8,Citation11]. We then sought to test whether blockage of TREM1 by LP17 could restore the HG-induced microglial inflammation. As shown in Fig. S5A, LP17 significantly reversed HG-induced neuroinflammation in BV2 cells, as evidenced by decreased expression of NOS2/iNOS (nitric oxide synthase 2, inducible), TNF/TNF-α (tumor necrosis factor) and IL6 (interleukin 6), and increased expression of ARG1 (arginase 1) and IL4 (interleukin 4). In HMC3 cells, LP17 remitted HG-induced production of IL6, NOS2, TNF and IL1B/IL-1β (interleukin 1 beta) (Fig. S5B). Moreover, HG-induced reactive oxygen species (ROS) production in BV2 cells, HMC3 cells and primary microglia were also rescued by LP17 (Fig. S5C).
We next probed the involved pathways. In BV2 and HMC3 cells, LP17 addition significantly reduced HG-promoted expression of NLRP3 (Fig. S5D and S5E). However, the expression of phospho-RELA/p65 (RELA proto-oncogene, NF-kB subunit) was unchanged. In BV2 and HMC3 cells, pharmacological activation of lipophagy using RAPA showed similar effects on cellular ROS level (Fig. S5F) and NLRP3 expression (Fig. S5G and S5H) as LP17. These findings suggested that NLRP3, rather than NFKB/NF-κB (nuclear factor of kappa light polypeptide gene enhancer in B cells), was responsible for TREM1-mediated neuroinflammation in microglial cells.
Pharmacological blockade of TREM1 in db/db model and HFD/STZ model improved cognitive function
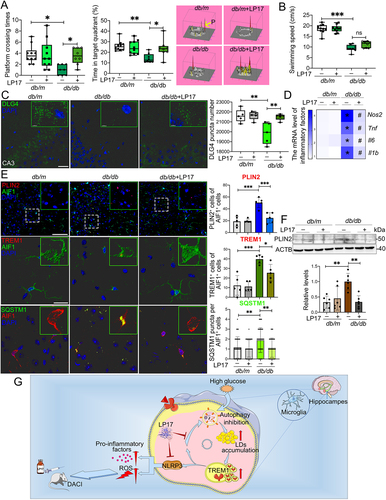
Given the in vitro findings of TREM1 in inflammation induction and lipophagy inhibition, we next determined the biological functions of TREM1 in db/db model and HFD/STZ model with cognitive impairment. LP17 was administrated to db/db and HFD/STZ mice via intraperitoneal injection. After 2 weeks of LP17 administration, cognitive function of each db/db mouse was evaluated by Morris Water Maze (MWM) test (Fig. S6A). LP17 administration remarkably improved platform crossing times and time spent in the target quadrant of db/db mice (). The average swimming speed showed no significant difference during LP17 injection (). We also evaluated the neuronal apoptosis and synaptic plasticity in the hippocampus. LP17 administration significantly reduced the number of TUNEL+ (terminal deoxynucleotidyl transferase-mediated dUTP-biotin nick end labeling) apoptotic neurons in the hippocampus of db/db mice (Fig. S6B). Synaptic plasticity was determined by the expression of SYP (presynaptic synaptophysin) and postsynaptic marker, DLG4/PSD95 (discs large MAGUK scaffold protein 4). Administration of LP17 significantly recovered the downregulation of DLG4 in the hippocampus of db/db mice ( and Fig. S6C), while hippocampal SYP expression in mice with or without LP17 administration showed no significant change (Fig. S6D). We then explored the effect of LP17 on neuroinflammation. In db/db mice that received LP17, the production of pro-inflammatory factors (NOS2, TNF, IL6, and IL1B) were significantly decreased (). Finally, we found that LP17 notably mitigated LDs accumulation and promoted cell lipophagy in microglia of the hippocampal CA3 region of db/db mice, which is congruent with our in vitro results ().
Figure 7. Pharmacological blockade of TREM1 in db/db model improved cognitive function, reduced hippocampal neuronal degeneration and inhibited microglial inflammation. db/m and db/db mice were administrated with or without LP17 injection. (A) Platform crossing times, time spent in the target quadrant (P, Platform) and (B) average swimming speed of the MWM test (n = 10 mice for db/m, n = 8 mice for db/db). (C) Representative Imaris reconstructions of DLG4 in hippocampus and quantification of DLG4 puncta in the hippocampus of mice from different groups. (D) mRNA expression of inflammatory factors in the hippocampus of mice from different groups. *P < 0.05: db/m vs. db/db; #P < 0.05: db/db vs. db/db + LP17. (E) Representative micrographs of PLIN2 (upper panel, scale bar: 50 μm) and representative Imaris 3D reconstructions of colocalization of TREM1 (middle panel, scale bar: 15 μm) or SQSTM1 (lower panel, scale bar: 15 μm) with AIF1 in the hippocampus of mice from different groups. The numbers of PLIN2+AIF1+, TREM1+AIF1+ and SQSTM1 puncta per AIF1+ cells were quantified. *P < 0.05, **P < 0.01, ***P < 0.001. (F) Western blotting analysis of PLIN2 expressions in the hippocampus of db/m and db/db mice with or without LP17. **P < 0.01. (G) Proposed series of events involved in HG-impaired microglia and the blockade of TREM1 pathway with LP17 administration as a new strategy for DACI therapy.
The effects of LP17 on cognitive function, synaptic plasticity and neuroinflammation in db/db mice were corroborated by HFD/STZ mice (Fig. S6E). LP17 injections in HFD/STZ mice significantly rescued the decreased explorations of new objects in novel object recognition (NOR) test (Fig. S6F), reversed the lower spontaneous alternation rate in the Y-maze test (Fig. S6G) and improved platform crossing times and time spent in the target quadrant (Fig. S6H and S6I). LP17 administration also significantly inhibited neurons apoptosis (Fig. S6J), recovered the downregulation of DLG4 (Fig. S7A and S7B), and inhibited neuroinflammation (Fig. S7C). Moreover, lipophagy inhibition and LDs diminution in hippocampal microglia was also found in HFD/STZ mice receiving LP17 (Fig. S7D). Taking together, these data indicated that administration of LP17 improved cognitive functions and synaptic plasticity, and inhibited neuroinflammation in T2DM mice.
Discussion
Clinically, a critical comorbidity of cognitive impairment in patients with diabetic mellitus is diminished or lost attention, memory, perceptual, and executive ability, leading to functional impairment and reduced quality of life. Disordered lipid metabolism, impaired autophagy and the resulting chronic neuroinflammation play a critical role during the occurrence and development of cognitive impairment. In the present study, we identify a more multifaceted role of LDs and TREM1 in DACI and explore the potential mechanism of this role in vitro and in vivo. Our results provide evidence that HG-dampened microglial lipophagy play critical roles in the accumulation of LDs in microglia in vivo and in vitro. Accumulated LDs colocalize with TREM1, which prevents TREM1 from degradation. The resultantly high TREM1 in turn aggravates HG-induced microglial neuroinflammation in vitro and exacerbates neuronal functions in vivo, facilitating a vicious cycle in deteriorating DACI. Blockade of TREM1 pathway with LP17 administration provides a new strategy for DACI therapy ().
We first observed accumulation of LDs in microglia of T2DM mice with cognitive dysfunction and in hyperglycemic plasma treated microglia. LDs have been recognized for their role as inflammatory organelles in peripheral myeloid cells [Citation30]. Immune cells containing LDs, such as foamy macrophages in atherosclerosis, are detrimental [Citation31]. Previous studies have reported the presence of LDs in the diseased brain with Alzheimer or aging, mainly concentrated in ventricle ependymal layer [Citation13]. In normal hypothalamus of both mouse and human brain, as well as in hypothalamus of mice with metabolic disturbances and human with T2DM, heterogeneous distribution of LDs has been reported, mainly concentrating in the wall of the 3 V [Citation16]. These reports indicate an important role for brain LDs in metabolism. As the principal immune cells in the CNS, microglia becomes progressively activated and age-related dysfunctional [Citation9,Citation10]. A striking accumulation of LDs in hippocampus microglia has also been reported in aging mouse and human brains [Citation25]. These microglia containing accumulated LDs showed defectiveness in phagocytosis and secretion of proinflammatory cytokines, contributing to age-related and genetic forms of neurodegeneration. Here, we are the first to show a major LDs accumulation in hippocampus microglia in T2DM mice with cognitive dysfunction and in HG-treated microglia. Our results are consistent with and complementary to the published reports, that LDs-containing microglia in hippocampus is modified in T2DM brain, opening possibilities for better understanding of diabetes in accelerating cognitive impairment during the aging process.
The roles of autophagy in immunity and inflammation have been widely studied in peripheral tissue macrophages and other types of cells [Citation32,Citation33]. Deregulated autophagy fects cellular clearance of protein aggregates and dysfunctional organelles, which are the main cause of neurodegenerative diseases. The roles of autophagy in the brain cognition have mainly focused on neurons [Citation34,Citation35]. Recently, growing attention has been paid to the effects and regulatory mechanisms of autophagy in microglia. However, the limited existing results are inconsistent. In LPS treated BV2 cells, a large reduction in BECN1 (beclin 1) and ATG3 (autophagy related 3) protein levels has been reported [Citation36]. In another in vivo study, autophagy impairment in the cortex and hippocampus was also reported in the brains of LPS-injected mice [Citation37]. The present study revealed that in HG-treated microglia and in the hippocampal microglia of T2DM mice, lipophagy, the selective autophagy of LDs, was dampened. Lipophagy impairment occurred after 24 h of HG culture, while LDs accumulation occurred after 72 h of HG culture. Moreover, pharmacological inhibition of LDs formation showed no influence on HG-induced lipophagy in microglia, and inhibition of lipophagy significantly rescued HG-induced accumulation of LDs, indicating a unique requirement for lipophagy in regulating lipid homeostasis in microglia. Besides, microglia incubated with glucose recapitulate the pathogenesis of damage of hyperglycemic plasma on hippocampus microglia, indicating that high glucose is a key factor which responsible for lipophagy impairment and LDs accumulation in T2DM. In addition, we found for the first time that LDs in microglia treated with plasma of aged participants were negatively correlated with the DSST scores. Although our sample sizes are relatively small given the complexity of human plasma, the particularly large magnitude of the effects enabled us to see statistically significant results.
Julia et al. reported that a buildup of microglial LDs in aging brain induced production of ROS and proinflammatory cytokines, but provided no mechanistic basis for this observation [Citation25]. Here, we tested the hypothesis that LDs may act as a “protector” to TREM1, preventing it from normal degradation, yielding an inconsistent trend in Trem1 mRNA and protein level. Along with HG-related LDs accumulation in microglia, we found different morphologies of colocalization between TREM1 and LDs. During LDs fusion, the engulfed TREM1 in merging LDs was still observed. The correlation between LDs and TREM1 level across our collection of healthy and T2DM plasma further supports this notion. Increased number of lipid bodies has been long reported as cellular cytoplasmic organelles during inflammatory processes [Citation38,Citation39]. The LDs constituted a major site of immunoreactivity for TNF in fibroblasts, eosinophils, macrophages, mast cells, colonic epithelial absorptive cells, and neutrophils in colonic Crohn. Our results, together with the published reports, suggest that in addition to storing neutral lipids and acting as hubs for metabolic processes, LDs may provide an additional vehicle for storage and transport of signaling proteins. In the hippocampal microglia of T2DM brain, increased LDs accumulation may wrap TREM1 either for storage, for transport, or both, resulting in buildup of TREM1 in microglia. Clearly, the precise molecular mechanisms underlying DACI development induced by accumulated LDs and TREM1 require further investigation. In this study, the effect of TREM1 comes from the whole TREM1 expressed in the cells, not only the TREM1 colocalized with LDs, as currently we still haven’t found a better way to separate the TREM1 accumulated in the LDs from the whole TREM1. Thus, an interesting question arising from our data is whether and how these LDs colocalized TREM1 exert precise roles as normal TREM1, and its downstream factors orchestrating neuroinflammation are required to be clarified. Besides, our results also show direct interaction between TREM1 and PLIN2. However, this direct interaction might be spatiotemporal existing during the engulf process. Yet, how TREM1 was engulfed by LDs is also an interesting and important future direction.
In age-related neurodegeneration, microglia undergo immune-phenotypic and morphological changes, proliferate, migrate and produce inflammatory cytokines [Citation40]. These responses are also observed in microglia of CA3 region of T2DM mice. Moreover, lipophagy impairment, LDs accumulation and TREM1 enrichment are also mainly concentrated in these microglia. These findings provide solid and sound evidence for microglia functions during DACI. TREM1 is constitutively expressed on peripheral blood monocytes, neutrophils, macrophages, endothelial cells, and fibrosarcoma cell lines [Citation18,Citation27]. Its stimulation induces the generation of pro-inflammatory mediators, myeloperoxidase release, and the upregulation of adhesion molecules. We found that HG-induced microglial TREM1 amplified the neuroinflammatory cascades and participated in neurodegeneration. Blockage of LP17 significantly reversed lipophagy reduction, LDs accumulation and neuroinflammation. A growing number of studies have reported the regulation of autophagy by TREM1. In Parkinson, attenuation of TREM1 could ameliorate neuroinflammatory responses via activation of autophagy and anti-inflammatory pathways. In an experimental mouse model of colitis, TREM1 inhibition modulated autophagy activity and endoplasmic reticulum stress, reducing colitis in mice [Citation41]. In LPS-stimulated HK-2 cells, TREM1 promoted apoptosis and inhibited autophagy [Citation42]. This dual effect of LP17 on neuroinflammation directly and on lipophagy indirectly may explain its strong therapeutic effects on cognitive impairment. Inhibition of TREM1 may represent a novel target for the treatment of T2DM associated lipophagy impairment and neuroinflammation. Based on these studies, and taken in conjunction with the promise TREM1 pathway inhibitor LP17 have shown as therapy agents for Alzheimer-related spatial cognitive impairments [Citation43], we posited that LP17 in DACI may be a unique synergistic approach to concurrently glycemic- and lipid-control.
Collectively, our studies are focused on explaining the molecular basis of the accumulated LDs and substantially increased neuroinflammation in DACI. The physiology of lipid metabolism and neuroinflammation is clearly complex, and the increased protein level of inflammation amplifier TREM1 plays an important mechanism during the process, as evidenced by the rigorous data in this study. Through a series of in vitro and in vivo studies, our results reveal a conventional mechanism of impaired lipophagy-induced TREM1 in microglia and neuroinflammation in DACI, and provide better understanding of diabetes in accelerating cognitive impairment during the aging process. We identify TREM1 as a potential target for T2DM mice with cognitive decline, as inhibition of TREM1 shows an exhilarating therapeutic effect on reducing hippocampal neuronal degeneration and improving cognitive performance in T2DM mice with cognitive impairment. Future studies on how LDs accumulate in microglia of DACI, and how LDs colocalized with TREM1 orchestrate neuroinflammation in T2DM patients with cognitive decline are needed. Moreover, targeting TREM1 may represent an attractive approach for DACI, and provide a novel strategy for delaying the cognitive decline.
Materials and methods
Study population
This study was approved by the human ethics committees of the participated hospitals (Approval No: ChiCTR1900021720). Clinical data and blood samples were collected from elderly T2DM patients [age, ≥65 years old, duration of T2DM, ≥10 years] and elderly healthy controls [age, ≥65 years old] after signing the written informed consent form by patients. The clinicopathological data of T2DM patients and healthy controls were shown in Table S1. Patients were diagnosed with T2DM based on the evaluation of their fasting and postprandial blood sugar level and disease history. T2DM patients with visual impairment, confusion and delirium, those suffering from hypothyroidism and hyperthyroidism, hypertension, human immunodeficiency virus, vitamin B12 deficiency, and those with kidney, liver, and other infectious diseases were excluded from the study. Baseline demographic and clinical data, including age, gender, body mass index, educational level, duration of T2DM, smoking and dietary habits, alcohol consumption, use of medications (e.g., insulin, anti-depressants, and statins), and disease history were then obtained through a questionnaire. At last, 15 elderly T2DM patients and 14 elderly Healthy controls were included for cognitive measures using DSST as previously described [Citation44].
Blood sample collection and biochemical analysis
After diagnosis with T2DM and cognitive measurements were performed, 2 mL of venous blood was collected from all participants after an overnight fast between 06:00 am and 07:00 am. EDTA plasma was collected by centrifugation at 1000 × g for 10 min at 4°C, and stored at −80°C for further analysis. Serum glycated ALB, a diagnostic parameter for recessive diabetes, was detected using a Siemens ADVIA 2400 automatic biochemical analyzer (Siemens, Munich, Germany) according to the manufacturer’s instructions [Citation45].
Animals and ethical statement
The experiment was conducted in accordance with the ethical guidelines presented by the Animal Care and Use Committee of Xi’an Jiaotong University (Xi’an, China) that approved the study protocol.
Male C57BL/6J mice (age, 8 weeks; body weight [BW], 24–28 g), homozygous male db/db mice and littermate control animals were purchased from the Model Animal Research Center of the Nanjing University (Nanjing, China). All the mice were housed in pathogen-free facilities under a 12–12 h light-dark cycle and permitted ad libitum access to food and water. Mice were housed in groups of 4 per cage, and acclimated for 1 week before experiments. All mice did not have congenital anomalies, as shown by behavioral abnormalities. Before and during the experiment, activities of mice, including moving, grooming, eating, drinking, defecation and urination, and interacting with cage mates were closely monitored. At least 5 mice were analyzed for each data point.
Mouse models of T2DM
Male db/db mice with obesity and hyperglycemia were used for the establishment of a mouse model of T2DM. Age and gender matched db/m mice were used as non-diabetic (control) mice. To inhibit TREM1, specific peptides LP17 (LQVTDSGLYRCVIYHPP) were employed (synthesized by GL Biochem [Shanghai]) [Citation46]. The db/db mice were randomly divided into 2 groups, either receiving the vehicle (db/db group) or LP17 (db/db + LP17 group) administration to inhibit TREM1. Vehicle control or LP17 (20 mg/kg) dissolved in saline was administered intraperitoneally once daily for 14 consecutive days (2 weeks) into 22-week-old db/db male. Matched db/m mice were grouped as db/m group and LP17 (db/m + LP17) group, receiving same operation as above. Cognitive performance was evaluated by MWM test at 25 week-old by two independent investigators who were blinded to the experimental groups [Citation47].
Another mouse model of T2DM was established using 8-week-old male C57BL/6J mice by a HFD and injection of STZ (Sigma-Aldrich, S0130; dissolved in 50 mM citric acid buffer, pH 4.5) [Citation48]. Briefly, after acclimation for 1 week, 9-week-old male C57BL/6J mice were randomly divided into two groups: control group and HFD/STZ group. Mice in the HFD/STZ group were deprived of food for 12 h, followed by daily intraperitoneal injection of low-dose STZ (30 mg/kg BW) for 5 days, and were fed with a HFD (60% calories from fat) throughout the whole procedure. Mice in the control group received the same volume of citric acid buffer, and were fed with a standard normal chow diet (10% of calories from fat). Nine days after the first STZ injection, blood samples were collected from the tail vein and fasting blood glucose level were detected via a glucometer (Yuwell, 580). The mouse model of HFD/STZ was considered successfully established if there were two consecutive fasting blood glucose levels higher than 16.7 mM. To inhibit TREM1, control mice and HFD/STZ mice were administered with vehicle control or LP17 (20 mg/kg) intraperitoneally once daily for 14 consecutive days (2 weeks) at the age of 22-week-old, and were divided into control group, control + LP17 group, HFD/STZ group, and HFD/STZ + LP17 group. For indicated experiment, at least 5 mice per group were included. Cognitive performance was evaluated by the Y maze, NOR test and MWM test in mice aging 24–26-week-old.
Behavioral tests (MWM test)
Cognitive function of db/db mice was tested with MWM as previously described with modifications [Citation49,Citation50]. A 120-cm circular pool, a platform (7 cm in diameter) and a camera were employed. The pool was filled with water, which was opacified with the milk powder and kept at 23 ± 1°C. The platform was hidden 1 cm beneath the surface of the water. The camera was connected to a tracking system for recording and analysis. Swimming paths were tracked and the average times to reach the platform were recorded by the ANY-maze video-tracking software (Stoelting). The platform tests were performed for 5 consecutive days and a probe test was performed on day 6 by two independent researchers who were blinded to the grouping. All behavioral tests were carried out under the same environmental conditions, such as temperature, humidity, and light intensity between 9:00 am and 5:00 pm. For indicated experiment, at least 8 mice per group were included. For acclimation, mice were transferred into the testing room at 2 days before the MWM test.
Tissue perfusion and collection
After cognitive performance was taken, mice were anesthetized and intracardially perfused with 0.9% sodium chloride (Sangon Biotech, A610476), followed by 4% paraformaldehyde (PFA; Sigma-Aldrich, 158127). The whole brains were harvested by decapitation, fixed in 4% PFA for 12 h, dehydrated in gradient sucrose solutions (Sangon Biotech, A610498) at 4°C and cut into 12 μm sections for immunofluorescence, Oil red O staining, and TUNEL. For qPCR and western blotting assays, fresh bilateral hippocampus tissues were collected after anesthetization, stored at −80°C for further RNA isolation and total protein extraction.
For plasma collection, blood samples were collected from the orbital plexus after anesthetization. EDTA plasma was collected by centrifugation as mentioned above, and stored at −80°C for further analysis. For indicated experiment, at least 5 mice per group were sacrificed for brain or plasma collection.
Electron microscopy
Mice brain tissues were immersed in 4% glutaraldehyde (Sangon Biotech, A600875), followed by fixation in 1% osmium tetroxide (Sigma-Aldrich, 142387). Then, the tissues were dehydrated in ethanol (Sangon Biotech, A500737), embedded in araldite (Sigma-Aldrich, 31185) and cut into 50-nm sections. Sections were stained with 3% uranyl acetate (Codow, CD106833) and lead citrate and scanned using H7500 Transmission Electron Microscope (Hitachi, Japan). To highlight the lipid droplet deposition in microglia, Adobe Photoshop CS were employed to mark the lipid droplets. The lipid droplets on the electron microscopy images were lassoed out and filled with yellow (hard light and 70% opacity).
Immunofluorescence and BODIPY staining of brain and cell sections
Brain and cell sections were used for immunofluorescent staining with the following primary antibodies were used: PLIN2 (1:100; Fitzgerald LLC, 20 R-AP002), AIF1 (1:200; wako, 019–19741), LC3B (1:100; ABclonal, A19665), SQSTM1 (1:100; Cell Signaling Technology [CST], 5114S), TREM1 (1:200; R&D Systems, MAB1187–100), RBFOX3 (1:200; Abcam, ab177487) GFAP (1:200; Genetex, GTX85454), MAP2 (1:100; CST, 4542S), and DLG4 (1:100; Abcam, ab238135). The following secondary antibodies were used: Alexa Fluor 488 donkey anti-goat (1:200; Thermo Fisher Scientific, A-11055), Alexa Fluor 488 donkey anti-rabbit (1:500; Invitrogen, A-21206), Alexa Fluor 488 donkey anti-chicken (1:200; Jackson ImmunoResearch Laboratories, 139424), Alexa Fluor 594 donkey anti-rabbit (1:1000; Thermo Fisher Scientific, A-21207), Alexa Fluor 594 donkey anti-guinea pig (1:500; Jackson ImmunoResearch Laboratories, 706-585-148), Alexa Fluor 594 donkey anti-rat (1:200; Invitrogen, A-21209), and Alexa Fluor 647 donkey anti-rat (1:200; Jackson ImmunoResearch Laboratories, 712-605-150). For brain sections, briefly, after thrice washing with phosphate-buffered saline (PBS; Sigma-Aldrich, P3813) and incubation with 10% donkey serum (absin, abs935; dissolved in PBS) for 2 h at room temperature (RT), sections were washed and incubated with 10% donkey serum as mentioned above. Then, the sections were incubated with the secondary antibodies for 2 h at RT. To stain LDs in the brain tissues, the sections were then washed and incubated with BODIPY 493/50 solution (1:1000 diluted with PBS; Thermo-Fisher Scientific, D3922) for 15 min at RT. Nucleus was counterstained with 4’,6-diamidino-2-phenylindole (DAPI; 1:500; SolelyBio, C0065) for 5 min at RT.
For cell immunofluorescence staining, after specific treatments, BV2 cells, primary microglia and HMC3 cells seeded into poly-l-lysine-coated glass coverslips (NEST, 801010) were fixed with 4% PFA for 20 min, washed with PBS again, and blocked with 10% donkey serum containing 0.1% Triton X-100 (Sangon Biotech, A600198) for 2 h at RT. The cells were then incubated with the primary antibodies. Next, cells were incubated with the secondary antibodies for 2 h at RT. BODIPY 493/50 solution and DAPI solution were then added to cells for 15 min to stain LDs and to counterstain nucleus, respectively.
Sections and cells were imaged (×63 or × 40 magnification) under a confocal scanning laser microscope (Leica, Frankfurt, Germany) by Z-stack scanning, or scanned using an automated whole-slide fluorescence scanning device (3DHISTECH, version: Pannoramic MIDI II) and visualized using SlideViewer (version: 2.5.0). At least 5 mice per group were included in the indicated experiment. For each section per animal, 5 visual fields were randomly photographed for quantitative analysis.
TUNEL assay
To detect neuronal apoptosis in the brain, TUNEL assay (Promega, G3250) was performed on brain sections according to the manufacturer’s instructions. The stained sections were observed and captured using an inverted fluorescence microscope. The number of TUNEL+ cells was counted.
Isolation and culture of primary mice microglia, neurons and astrocytes
Primary mice microglia was isolated from cerebral cortices of C57BL/6 mouse pups postnatal day 1–4 mice as previously described [Citation51]. Primary cultures of hippocampal neurons were isolated from prenatal mice as described by Seibenhener ML [Citation52]. Isolation and culture of astrocyte were performed according to the procedure provided by Güler BE [Citation53]. After achieving confluency, the obtained microglia, neurons and astrocyte were used for indicated experiment.
Cell culture
HMC3 were purchased from iCell Bioscience Inc. (iCell-h301; Shanghai, China), and were cultured in a DMEM medium (Gibco, 11995,065) supplemented with 10% fetal bovine serum (FBS; GEMINI LLC, 900–108) and 1% penicillin-streptomycin solution (PS; Sangon Biotech, B540732). BV2 murine microglial cells (National Collection of Authenticated Cell Cultures) were cultured in a DMEM supplemented with 10% FBS and 1% PS. Media was switched to low glucose (5.5 mM) DMEM with 5% FBS and 1% PS for treatments. To inhibit TREM1, cells were infected with Trem1 shRNA lentiviruses (OBiO Technology) according to the protocol, or treated with LP17 (10 μM) for the indicated time. For each indicated in vitro experiment, at least six independent experiments were performed.
Cell treatment
To mimic T2DM, HMC3 cells were treated with plasma from T2DM patients and control volunteers. BV2 and primary microglial cells were treated with plasma from db/m or db/db mice. For cell treatment, EDTA and lipid in plasma was removed as previously described [Citation25]. For cell culture, BV2 cells, primary microglia and HMC3 cells were culture in filtered medium (DMEM containing 5% FBS and 5% plasma) for 72 h.
In another experiment, the cells were seeded into different well plates or poly-l-lysine-coated glass coverslips accordingly. After cell attachment, the cell culture medium was replaced with DMEM containing 5% FBS and 25 or 50 mM glucose every day, and cultured for indicated time points (24, 48, and 72 h). Control cells were cultured in a DMEM containing 5% FBS and 5.5 mM glucose. As a positive control for LDs accumulations, cells were treated with 5 μg/mL LPS (Sigma-Alrich, L6143) for 18 h, or 100 μM OA (Sigma-Alrich, O1257) for 12 h or 500 μM PA (Sigma-Aldrich, P5585) for 24 h. Then, the cells were fixed or collected for further analysis.
To determine in which stage the abnormal autophagy occurred upon HG treatment, Baf (MCE, HY-100558), an autophagy inhibitor at the late-stage that blocks autophagosome-lysosome fusion, was applied to the cultured cells at 100 nmol/L. Briefly, the cells were cultured in a DMEM containing 5% FBS and 5.5 or 25 mM glucose for 60 h, with fresh medium replacement every day. Then, 100 nmol/L Baf was added to the fresh culture medium, and cultured for another 12 h.
To induce cell autophagy, cells were pretreated with an autophagy activator, RAPA (10 nM; MCE, HY-10219), in a DMEM +5% FBS for 30 min. After that, the old medium was replaced with a fresh DMEM +5% FBS containing 5.5 or 25 mM glucose and 10 nM RAPA, and cultured for 72 h.
Three-dimensional (3D) reconstruction of confocal images
Confocal image stacks of brain sections and cells were converted to 3D images with the surface-rendering feature of Imaris BitPlane 9.0 software.
Reverse transcription quantitative real-time polymerase chain reaction (RT-Qpcr)
Total RNA was extracted from hippocampus tissues and cells using TRIzol regent (Beyotime, R0016), and was reversely transcribed into cDNA using the Evo M-MLV RT kit with gDNA Clean for qPCR II (Accurate Biology, AG11711) according to the protocols. Then, RT-qPCR was performed using the SYBR® Green Premix Pro Taq HS qPCR kit (Accurate Biology, AG11701). The specific primers used in this study are listed in Table S2. ACTB (beta actin) was used as an internal control.
Performance of rigid protein-protein docking (ZDOCK)
ZDOCK for rigid protein-protein docking was performed between TREM1 (PDB: 1SMO) and PLIN3 (PDB: 1SZI) to study the relationships. The PDB format of the protein structural domain was downloaded from the Protein Data Bank PDB database http://www.rcsb.org/.The docking sites was identified and the ZDOCK scores were calculated by the ZDOCK module.
Western blotting and Co-IP
For western blotting, PVDF membranes (Roche, 3010040001) were incubated with primary antibodies against ACTB (1:1000; ABclonal, AC-026), PLIN2 (1:800; Abcam, ab52356), LC3B (1:1000; ABclonal, A19665), SQSTM1 (1:1000; CST, 5114S), TREM1 (1:800; Abcam, ab104413), DLG4 (1:1000; Abcam, ab238135), SYK (1:1000; CST, 13198S), phospho-SYK (1:500; CST, 2710S), BECN1 (1:1000; Proteintech, 11306–1-AP), NLRP3 (1:1000; Abcam, ab263899), phospho-RELA (1:500; CST, 3033T), and SYP (1:20000; Abcam, ab32127) overnight at 4°C. The corresponding secondary antibodies were used as following: horseradish peroxidase (HRP)-conjugated goat anti-mouse (Deeyee, DY602030) and HRP-conjugated goat anti-rabbit (Deeyee, DY60202).
BV2 cells or hippocampus were lysed in RIPA buffer (Beyotime, P0013K). Equal amounts of protein (30 μg) were separated by sodium dodecyl sulfate-polyacrylamide gel electrophoresis (SDS-PAGE; Sangon Biotech, C621110), and transferred onto PVDF membranes. PVDF membranes were then blocked with 5% milk at RT for 1 h, and incubated with primary antibodies overnight at 4°C. Then, membranes were incubated with corresponding secondary antibodies and visualized using enhanced chemiluminescence reagent (Affinity, KF8005) on a Gel Imaging System (Syngene, Frederick, MD, USA). ACTB was used as an internal control.
Human HMC3 cells were collected and lysed by addition of ice-cold IP Lysis/Wash Buffer from Immunoprecipitation Kit (Thermo Scientific, 26146). The obtained samples were co-IP with TREM1 antibody or PLIN2 antibody immobilized to agarose beads according to the default kit procedure. Upon elution, the samples were separated by 12% SDS-PAGE and western blotting using a standard protocol.
ROS assay
To detect ROS activity in the cells after indicated treatments, DCFDA-cellular ROS assay kit (Beyotime, S0033S) was used on HMC3 and BV2 cells after indicated treatment. Then, the cells were washed with PBS and incubated with DCFDA for 45 min according to the protocol. Images of ROS activity were taken by a fluorescence microscope (Life Technologies, Renfrewshire, UK).
Enzyme-linked immunosorbent assay (ELISA)
The levels of inflammatory cytokines in the culture supernatants secreted by the cells and in the plasma were determined by ELISA kits (Jingmei Biotechnology). Cells were cultured in 96-well plates for indicated treatments, and media were collected for ELISA of TNF (JM-03277H2), IL6 (JM-03204H2), IL1B (JM-03336H2), and NOS2 (JM-04670H2) according to the manufacturer’s instructions.
Statistical analysis
Statistical analysis was performed using GraphPad Prism 5.0 software (GraphPad Software Inc., San Diego, CA, USA). Data were presented as mean ± standard deviation (SD). Data collection was randomized for all experiments. Investigators responsible for data collection were blinded to imaging and data analysis. Data were tested for normality using the Kolmogorov-Smirnov test or the Shapiro-Wilk test, and equality of variance was confirmed using the F-test. Mean values between two groups were compared using the two-tailed unpaired Student’s t-test or Mann-Whitnet test. Data from multiple groups were analyzed by one-way ANOVA and two-way ANOVA, followed by Tukey’s post-hoc tests. Detailed information on sample size, number of replicates, and statistical test used for each experiment is provided in the figure legends. P < 0.05 was considered statistically significant.
Supplemental Material
Download MS Word (39.1 MB)Acknowledgements
We thank Ying Hao at Instrument Analysis Center at Xi’an Jiaotong University for her assistance during confocal microscope using.
Disclosure statement
No potential conflict of interest was reported by the author(s).
Supplementary material
Supplemental data for this article can be accessed online at https://doi.org/10.1080/15548627.2023.2213984.
Additional information
Funding
References
- Tinajero MG, Malik VS. An update on the epidemiology of Type 2 diabetes: a global perspective. Endocrinol Metab Clin North Am. 2021;50(3):337–355.
- Lovic D, Piperidou A, Zografou I, et al. The growing epidemic of diabetes mellitus. Curr Vasc Pharmacol. 2020;18(2):104–109.
- Rojas-Carranza CA, Bustos-Cruz RH, Pino-Pinzon CJ, et al. Diabetes-related neurological implications and pharmacogenomics. Curr Pharm Des. 2018;24(15):1695–1710.
- Taskinen MR. Type 2 diabetes as a lipid disorder. current Molecular medicine. 2005;5(3):297–308.
- Cole JB, Florez JC. Genetics of diabetes mellitus and diabetes complications. Nat Rev Nephrol. 2020;16(7):377–390.
- Bellia C, Lombardo M, Meloni M, et al. Diabetes and cognitive decline. Adv Clin Chem. 2022;108:37–71.
- Biessels GJ, Despa F. Cognitive decline and dementia in diabetes mellitus: mechanisms and clinical implications. Nat Rev Endocrinol. 2018;14(10):591–604.
- Shabab T, Khanabdali R, Moghadamtousi SZ, et al. Neuroinflammation pathways: a general review. Int J Neurosci. 2017;127(7):624–633.
- Leng F, Edison P. Neuroinflammation and microglial activation in Alzheimer disease: where do we go from here? Nat Rev Neurol. 2021;17(3):157–172.
- Subhramanyam CS, Wang C, Hu Q, et al. Microglia-mediated neuroinflammation in neurodegenerative diseases. Seminar Cell Dev Bio. 2019;94:112–120.
- Hickman S, Izzy S, Sen P, et al. Microglia in neurodegeneration. Nat Neurosci. 2018;21(10):1359–1369.
- Lam T, Harmancey R, Vasquez H, et al. Reversal of intramyocellular lipid accumulation by lipophagy and a p62-mediated pathway. Cell Death Discovery. 2016;2(1):16061.
- Shimabukuro MK, Langhi LG, Cordeiro I, et al. Lipid-laden cells differentially distributed in the aging brain are functionally active and correspond to distinct phenotypes. Sci Rep. 2016;6(1):23795.
- Liu L, Zhang K, Sandoval H, et al. Glial lipid droplets and ROS induced by mitochondrial defects promote neurodegeneration. Cell. 2015;160(1–2):177–190.
- Khatchadourian A, Bourque SD, Richard VR, et al. Dynamics and regulation of lipid droplet formation in lipopolysaccharide (LPS)-stimulated microglia. Biochim Biophys Acta. 2012;1821(4):607–617.
- Maya-Monteiro CM, Corrêa-da-Silva F, Hofmann SS, et al. Lipid droplets accumulate in the hypothalamus of mice and humans with and without metabolic diseases. Neuroendocrinology. 2021;111(3):263–272.
- Klesney-Tait J, Turnbull IR, Colonna M. The TREM receptor family and signal integration. Nat Immunol. 2006;7(12):1266–1273.
- Matos AO, Dantas P, Silva-Sales M, et al. TREM-1 isoforms in bacterial infections: to immune modulation and beyond. Crit Rev Microbiol. 2021;47(3):290–306.
- Xu P, Hong Y, Xie Y, et al. TREM-1 exacerbates neuroinflammatory injury via NLRP3 inflammasome-mediated pyroptosis in experimental subarachnoid hemorrhage. Transl Stroke Res. 2021;12(4):643–659.
- Xu P, Zhang X, Liu Q, et al. Microglial TREM-1 receptor mediates neuroinflammatory injury via interaction with SYK in experimental ischemic stroke. Cell Death Amp Dis. 2019;10(8):555.
- Boufenzer A, Lemarié J, Simon T, et al., P. Bruneval P, Marie Y, Cohen R, Danchin N, Silvestre JS, Ait-Oufella H, Gibot S. TREM-1 mediates inflammatory injury and cardiac remodeling following myocardial infarction. Circ Res. 2015;116(11):1772–1782.
- Zhou J, Chai F, Lu G, et al. TREM-1 inhibition attenuates inflammation and tumor within the colon. Int Immunopharmacol. 2013;17(2):155–161.
- Panagopoulos A, Samant S, Bakhos JJ, et al. Triggering receptor expressed on myeloid cells-1 (TREM-1) inhibition in atherosclerosis. Pharmacol Ther. 2022;238:108182.
- Zysset D, Weber B, Rihs S, et al. TREM-1 links dyslipidemia to inflammation and lipid deposition in atherosclerosis. Nat Commun. 2016;7(1):13151.
- Marschallinger J, Iram T, Zardeneta M, et al. Lipid-droplet-accumulating microglia represent a dysfunctional and proinflammatory state in the aging brain. Nat Neurosci. 2020;23(2):194–208.
- Sathyanarayan A, Mashek MT, Mashek DG. ATGL promotes autophagy/lipophagy via SIRT1 to control hepatic lipid droplet catabolism. Cell Rep. 2017;19(1):1–9.
- Pelham CJ, Pandya AN, Agrawal DK. Triggering receptor expressed on myeloid cells receptor family modulators: a patent review. Expert Opin Ther Patents. 2014;24(12):1383–1395.
- Kökten T, Gibot S, Lepage P, et al. TREM-1 inhibition restores impaired autophagy activity and reduces colitis in mice. J Crohn’s & Colitis. 2018;12(2):230–244.
- Prins MM, Verstockt B, Ferrante M, et al. Monocyte TREM-1 levels associate with anti-TNF responsiveness in IBD through autophagy and Fcγ-receptor signaling pathways. Front Immunol. 2021;12:627535.
- Schlager S, Goeritzer M, Jandl K, et al. Adipose triglyceride lipase acts on neutrophil lipid droplets to regulate substrate availability for lipid mediator synthesis. J Leukoc Biol. 2015;98(5):837–850.
- Ouimet M, Franklin V, Mak E, et al. Autophagy regulates cholesterol efflux from macrophage foam cells via lysosomal acid lipase. Cell Metab. 2011;13(6):655–667.
- Levine B, Mizushima N, Virgin HW. Autophagy in immunity and inflammation. Nature. 2011;469(7330):323–335.
- Deretic V, Levine B. Autophagy balances inflammation in innate immunity. Autophagy. 2018;14(2):243–251.
- Bourdenx M, Martín-Segura A, Scrivo A, et al. Chaperone-mediated autophagy prevents collapse of the neuronal metastable proteome. Cell. 2021;184(10):2696–2714.e25.
- Glatigny M, Moriceau S, Rivagorda M, et al. Autophagy is required for memory formation and reverses age-related memory decline. Curr Biol. 2019;29(3):435–448.e8.
- Han HE, Kim TK, Son HJ, et al. Activation of autophagy pathway suppresses the expression of iNOS, IL6 and cell death of LPS-Stimulated microglia cells. Biomolecules Ther. 2013;21(1):21–28.
- Ali T, Rahman SU, Hao Q, et al. Melatonin prevents neuroinflammation and relieves depression by attenuating autophagy impairment through FOXO3a regulation. J Pineal Res. 2020;69(2):e12667.
- Beil WJ, Weller PF, Peppercorn MA, et al. Ultrastructural immunogold localization of subcellular sites of TNF-α in colonic Crohn’s disease. J Leukoc Biol. 1995;58(3):284–298.
- Melo RC, Avila HD, Wan HC, et al. Lipid bodies in inflammatory cells: structure, function, and current imaging techniques. J Histochem Cytochem. 2011;59(5):540–556.
- Ramirez AI, de Hoz R, Salobrar-Garcia E, et al. The role of microglia in retinal neurodegeneration: alzheimer’s disease, parkinson, and glaucoma. Front Aging Neurosci. 2017;9:214.
- Feng CW, Chen NF, Sung CS, et al. Therapeutic effect of modulating TREM-1 via anti-inflammation and autophagy in parkinson’s disease. Front Neurosci. 2019;13:769.
- Pan P, Liu X, Wu L, et al. TREM-1 promoted apoptosis and inhibited autophagy in LPS-treated HK-2 cells through the NF-κB pathway. Int J Med Sci. 2021;18(1):8–17.
- Jiang T, Zhang YD, Gao Q, et al. TREM1 facilitates microglial phagocytosis of amyloid beta. Acta Neuropathol. 2016;132(5):667–683.
- Chakraborty A, Hegde S, Praharaj SK, et al. Age related prevalence of mild cognitive impairment in Type 2 diabetes mellitus patients in the indian population and association of serum lipids with cognitive dysfunction. Front Endocrinol (Lausanne). 2021;12:798652.
- Park S, Lee W, Chung HS, et al. Diagnostic utility of serum glycated albumin for diabetes mellitus and its correlation with hyperlipidemia. Ann Lab Med. 2016;36(4):306–312.
- Sun XG, Duan H, Jing G, et al. Inhibition of TREM-1 attenuates early brain injury after subarachnoid hemorrhage via downregulation of p38MAPK/MMP-9 and preservation of ZO-1. Neuroscience. 2019;406:369–375.
- Niedowicz DM, Reeves VL, Platt TL, et al. Obesity and diabetes cause cognitive dysfunction in the absence of accelerated β-amyloid deposition in a novel murine model of mixed or vascular dementia. Acta Neuropathol Commun. 2014;2(1):64.
- Piatkowska-Chmiel I, Herbet M, Gawronska-Grzywacz M. The role of molecular and inflammatory indicators in the assessment of cognitive dysfunction in a mouse model of diabetes. 2021;22. DOI:10.3390/ijms22083878
- Cassano V, Leo A, Tallarico M, et al. Metabolic and cognitive effects of ranolazine in Type 2 diabetes mellitus: data from an in vivo model. Nutrients. 2020;12(2):382.
- Bartolini L, Casamenti F, Pepeu G. Aniracetam restores object recognition impaired by age, scopolamine, and nucleus basalis lesions. Pharmacol Biochem Behav. 1996;53(2):277–283.
- Deierborg T. Preparation of primary microglia cultures from postnatal mouse and rat brains. Methods Mol Biol. 2013;1041:25–31.
- Seibenhener ML, Wooten MW. 2012. Isolation and culture of hippocampal neurons from prenatal mice. J Vis Exp. (65). DOI:10.3791/3634-v
- Güler BE, Krzysko J, Wolfrum U. Isolation and culturing of primary mouse astrocytes for the analysis of focal adhesion dynamics. STAR Protocols. 2021;2(4):100954.