
ABSTRACT
SARS-CoV-2 poses a substantial global threat owing to the emergence of several highly transmissible variants. Autophagy is an intracellular degradation process that maintains cellular homeostasis and combats the invading pathogens. SARS-CoV-2 can trigger autophagy and antagonize interferon production. However, the underlying mechanisms remain elusive, particularly for different variants. Here, we found that SARS-CoV-2 nonstructural protein (NSP) 6 inhibited interferon production by promoting macroautophagy/autophagy-mediated STING1 degradation. Mechanistically, NSP6 induced endoplasmic reticulum stress and bound to HSPA5/GRP78, leading to the activation of EIF2AK3/PERK-EIF2A/EIf2α pathway-mediated autophagy, which was associated with lysosomal degradation of STING1 and downregulation of interferon production. Moreover, the 81–120 amino acid (aa) region of NSP6 is critical for autophagy induction and STING1 degradation. Interestingly, NSP6 harboring a three aa deletion in the 81–120 aa region of some SARS-CoV-2 variants led to reduced autophagy, STING1 degradation, and increased host antiviral immunity. Collectively, this study demonstrated a major function of NSP6 in the SARS-CoV-2 evasion of host antiviral immunity by triggering endoplasmic reticulum stress-induced autophagy to degrade STING1 and that enhancement of host antiviral immunity induced by NSP6 variants with a three-aa deletion might be responsible for the attenuation of SARS-CoV-2 variants.
Abbreviations
aa: amino acid; ATF6: activating transcription factor 6; ATG5: autophagy related 5; CCPG1: cell cycle progression 1; CFTR: CF transmembrane conductance regulator; cGAMP: cyclic GMP-AMP; CGAS: cyclic GMP-AMP synthase; CHX: cycloheximide; Co-IP: co-immunoprecipitation; CQ: chloroquine; EIF2A/eIF2α: eukaryotic translation initiation factor 2A; EIF2AK3/PERK: eukaryotic translation initiation factor 2 alpha kinase 3; ER: endoplasmic reticulum; ERN1/IRE1: endoplasmic reticulum to nucleus signaling 1; GFP: green fluorescent protein; HSPA5/GRP78: heat shock protein family A (Hsp70) member 5; HSV-1: herpes simplex virus type 1; IFIT1: interferon induced protein with tetratricopeptide repeats 1; IFNB1/IFN-β: interferon beta 1; IRF3: interferon regulatory factor 3; ISG15: ISG15 ubiquitin like modifier; MAP1LC3B/LC3B: microtubule associated protein 1 light chain 3 beta; MAP3K7/TAK1: mitogen-activated protein kinase kinase kinase 7; MAVS: mitochondrial antiviral signaling protein; MOI: multiplicity of infection; NFKB/NF-κB: nuclear factor kappa B; NSP6: non-structural protein 6; Δ106–108: deletion of amino acids 106–108 in NSP6 of SARS-CoV-2; Δ105–107: deletion of amino acids 105–107 in NSP6 of SARS-CoV-2; RETREG1/FAM134B: reticulophagy regulator 1; RIGI/DDX58: RNA sensor RIG-I; SQSTM1/p62: sequestosome 1; STING1: stimulator of interferon response cGAMP interactor 1; TBK1: TANK binding kinase 1.
Introduction
Severe acute respiratory syndrome coronavirus 2 (SARS-CoV-2) is responsible for the ongoing coronavirus pandemic, which has become a major threat to public health and has had a profound impact on the global economy [Citation1]. The SARS-CoV-2 genome is an approximately 30 kb positive-sense single-strand RNA that contains 14 open reading frames that encode a large polyprotein, four structural proteins (spike [S], membrane [M], envelope [E], and nucleocapsid [N]), and nine accessory proteins (ORF3a, ORF3b, ORF6, ORF7a, ORF7b, ORF8, ORF9b, ORF9c, and ORF10) [Citation2–4]. This polyprotein is cleaved by papain-like protease (nonstructural protein [NSP] 3) and 3C-like protease (NSP5) to generate 16 NSPs (NSP1 to NSP16) that play important roles in suppressing the host antiviral response and promoting viral replication [Citation5,Citation6]. For example, SARS-CoV-2 NSP1 can downregulate the host immune response by shutting down host mRNA translation by binding to the 40S ribosomal subunit [Citation7,Citation8]. NSP8, NSP10, and NSP12 form an RNA-dependent RNA polymerase, which is responsible for the replication of the SARS-CoV-2 genome and the transcription of its genes [Citation9]. SARS-CoV-2 NSP6 binds to TBK1 (TANK binding kinase 1) to suppress IRF3 (interferon regulatory factor 3) phosphorylation, whereas NSP13 binds to and blocks TBK1 phosphorylation [Citation10].
The innate immune response is the first line of defense against invading microbial pathogens [Citation11–13]. It has been reported that SARS-CoV-2 infection could induce the expression of type I IFN (interferon) [Citation10]. SARS-CoV-2 has developed multiple strategies to antagonize the host antiviral immunity. For example, SARS-CoV-2 ORF6 targets KPNA2 (karyopherin subunit alpha 2) to inhibit IRF3 nuclear translocation. ORF6 also interacts with NUP98-RAE1 to disrupt the nuclear import of STAT1 and STAT2 and antagonizes IFN signaling [Citation14]. SARS-CoV-2 ORF9b suppresses type I IFN by interacting with translocase of outer mitochondrial membrane 70. The SARS-CoV-2 N protein represses IFN production by interfering with RIGI/DDX58 (RNA sensor RIG-I) [Citation15]. The interaction between the SARS-CoV-2 M protein and MAVS (mitochondrial antiviral signaling protein) impairs the activity of the RIGI-MAVS pathway, resulting in the attenuation of the innate immune response [Citation16]. In addition, the CGAS (cyclic GMP-AMP synthase)-STING1 (stimulator of interferon response cGAMP interactor 1) pathway plays an important role in RNA virus-mediated type I IFN induction [Citation17]. SARS-CoV-2 activates CGAS-STING1 signaling through mitochondrial DNA release, leading to cell death and type I IFN production [Citation18]. Several SARS-CoV-2 proteins, including ORF3a, 3CL, and ORF9b, have been reported to inhibit the CGAS-STING1 pathway [Citation19,Citation20]. However, the molecular mechanism by which SARS-CoV-2 suppresses CGAS-STING1-mediated type I IFN production requires further investigation.
Autophagy, which can be stimulated under stress, is a highly conserved cellular catabolic pathway involved in the degradation of various cytoplasmic components, including misfolded proteins, organelles, and infectious pathogens [Citation21]. Appropriate autophagy is a prerequisite for host defense and immune responses [Citation22]. Autophagy, which is regulated by viruses, is another strategy for defense against host immunity. It has been reported that SARS-CoV-2 regulates the autophagy pathway to defend innate immunity through different stages. SARS-CoV-2 ORF3a prevents fusion between autophagosomes and lysosomes, while ORF7a reduces the acidity of lysosomes [Citation23,Citation24]. Moreover, SARS-CoV-2 NSP13 inhibits type I IFN production by promoting TBK1 degradation via SQSTM1/p62 (sequestosome 1)-dependent selective autophagy [Citation25]. SARS-CoV-2 ORF10 suppresses the antiviral innate immune response by triggering MAVS degradation via mitophagy [Citation26]. SARS-CoV-2 NSP14 targets the type I IFN receptor IFNAR1 for lysosomal degradation [Citation27]. SARS-CoV-2 3CLpro inhibits autophagy by degrading LGALS8 (galectin 8), which recruits the autophagy receptor CALCOCO2 (calcium binding and coiled-coil domain 2) and subsequently activates autophagy for antiviral immune responses [Citation28]. These findings suggest that several SARS-CoV-2 proteins are involved in regulating autophagy and host immunity. However, the role of viral proteins in the activation of autophagy has rarely been reported.
NSP6, a common component of both α- and β-coronaviruses, is an M protein that locates to the endoplasmic reticulum (ER) [Citation29]. Previous studies have shown that the infectious bronchitis virus NSP6 activates omegasome and autophagosome formation independently of starvation [Citation29] and restricts autophagosome expansion by reducing the association of MTOR (mechanistic target of rapamycin kinase) with lysosomes [Citation30]. Recent evidence suggests that SARS-CoV-2 NSP6 plays important roles in virus replication and the host immune response. SARS-CoV-2 NSP6 mediates membrane fusion and interacts with NSP3 and NSP4, which are thought to provide a membrane platform for viral replication complex formation and mediate viral assembly and release [Citation31]. SARS-CoV-2 NSP6 has been identified as a major determinant of SARS-CoV-2 viral pathogenicity [Citation32]. Moreover, SARS-CoV-2 NSP6 induces proinflammatory cytokines through the activation of the NFKB/NF-κB (nuclear factor kappa B) pathway by interacting with MAP3K7/TAK1 (mitogen-activated protein kinase kinase kinase 7) [Citation33], and contributes to structural heart damage and functional defects by disrupting cardiac mitochondrial function [Citation34]. A recent study showed that SARS-CoV-2 NSP6 can induce autophagosome accumulation. However, the mechanism remains elusive [Citation35].
In this study, it was discovered that SARS-CoV-2 NSP6-triggered autophagy promoted lysosomal degradation of STING1 and decreased IFN production. The function of NSP6 in different SARS-CoV-2 variants was also investigated. The results indicate the mechanism by which SARS-CoV-2 utilizes the autophagy pathway to evade the host innate immune response by promoting STING1 degradation.
Results
SARS-CoV-2 NSP6 inhibits CGAS-STING1-mediated IFN production
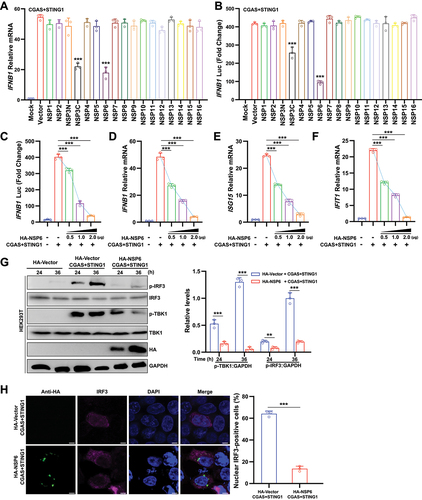
Previous studies have shown that some NSPs of SARS-CoV-2 play key roles in suppressing RIGI-mediated IFN production [Citation9,Citation10]. To identify whether SARS-CoV-2 NSP could inhibit CGAS-STING1-mediated IFN production, 16 expression clones encoding individual SARS-CoV-2 NSPs were first constructed. HEK293T cells were co-transfected with a SARS-CoV-2 NSP-expressing plasmid and stimulator plasmids Flag-CGAS and MYC-STING1. The results of the RT-qPCR assay showed that NSP3C and NSP6 significantly suppressed the mRNA levels of IFNB1/IFN-β (interferon beta 1) under CGAS-STING1 stimulation (). Similar results were obtained from the IFNB1 promoter reporter assay (). As NSP6 exhibited a stronger ability to antagonize immune activation induced by CGAS-STING1, NSP6 was the focus in this study. Further experiments showed that NSP6 overexpression inhibited the CGAS-STING1-triggered activation of IFNB1 luciferase activity () and the expression levels of IFNB1 ()D, ISG15 (ISG15 ubiquitin like modifier) (), and IFIT1 (interferon induced protein with tetratricopeptide repeats 1) () in a dose-dependent manner. The phosphorylation of TBK1 and IRF3 is a key step for IFNB1 production. Therefore, the effects of NSP6 on TBK1 and IRF3 phosphorylation were examined. The results showed that NSP6 reduced the CGAS-STING1-induced phosphorylation of TBK1 and IRF3 in HEK293T cells overexpressing CGAS, STING1, and NSP6 (). Therefore, the nuclear translocation of IRF3 was significantly impaired in NSP6 expressing HEK293T cells (). Taken together, these results suggest that SARS-CoV-2 NSP6 suppresses CGAS-STING1-mediated IFN production.
Figure 1. SARS-CoV-2 NSP6 inhibits CGAS-STING1-mediated IFN production. (A) Quantitative RT-PCR was performed to analyze IFNB1 mRNA levels in HEK293T cells co-transfected with SARS-CoV-2 HA-NSP or HA-vector plasmid, along with stimulator plasmids Flag-CGAS and MYC-STING1 for 24 h, and the findings were compared with those of the HA-vector control. (B) Luciferase reporter assays were carried out in HEK293T cells co-transfected with IFNB1 firefly luciferase reporter plasmid, stimulator plasmids Flag-CGAS and MYC-STING1, along with SARS-CoV-2 NSP-expressing plasmid or control plasmid for 24 h. Statistical significance values were determined by comparing the results with those of the HA-vector control. (C) Luciferase reporter assays from HEK293T cells co-transfected with IFNB1 firefly luciferase reporter plasmid, stimulator plasmids Flag-CGAS and MYC-STING1, along with different doses of NSP6-expressing plasmid (0, 0.5, 1.0, and 2.0 μg, respectively) for 24 h. (D – F) the mRNA levels of IFNB1 (D), ISG15 (E), and IFIT1 (F) were determined by RT-qPCR in HEK293T cells co-transfected with stimulator plasmids Flag-CGAS and MYC-STING1, along with different doses of NSP6-expressing plasmid, for 24 h. (G) the phosphorylation levels of TBK1 and IRF3 were determined by immunoblotting in HEK293T cells co-transfected with stimulator plasmids Flag-CGAS and MYC-STING1, along with HA-NSP6-expressing plasmid or HA-vector for 24 h (left). Band intensities were determined by ImageJ software (right). (H) the localization of IRF3 was checked by immunofluorescence microscopy in HEK293T cells co-transfected with stimulator plasmids Flag-CGAS and MYC-STING1, along with HA-NSP6-expressing plasmid or HA-vector, for 24 h (left). The proportion (%) of nuclear IRF3-positive cells was determined from three independent experiments (right). Scale bar: 5 µm. The data are representative of three independent experiments. Data are presented as mean ± SD. *P < 0.05, **P < 0.01, and ***P < 0.001 (unpaired, two-tailed Student’s t-test).
SARS-CoV-2 NSP6 promotes the lysosomal degradation of STING1
To determine the target of NSP6 in the CGAS-STING1 pathway, HEK293T cells were co-transfected with a luciferase reporter plasmid and HA vector or HA-NSP6 in the presence or absence of FLAG-CGAS, Flag-STING1, Flag-TBK1, or Flag-IRF3. The results showed that IFNB1 luciferase activity was significantly suppressed by NSP6 in CGAS- or STING1-expressing HEK293T cells, but not in TBK1- or IRF3-expressing HEK293T cells (), indicating that NSP6 inhibits the activation of the IFNB1 promoter by targeting the CGAS-STING1 pathway. Further experiments using confocal microscopy showed that NSP6 could co-localize with STING1 but not with CGAS, TBK1, or IRF3 (). HEK293T cells co-transfected with MYC-STING1 and different concentrations of HA-NSP6 were analyzed by immunoblotting. NSP6 downregulated STING1 in a dose-dependent manner (), indicating that NSP6 promoted STING1 degradation. Moreover, in HeLa cells expressing endogenous CGAS and STING1, NSP6 overexpression triggered endogenous STING1 degradation in a dose-dependent manner (), inhibited cyclic GMP-AMP (cGAMP)-induced STING1 phosphorylation (), but could not affect the mRNA level of STING1 ().
Figure 2. SARS-CoV-2 NSP6 promotes the lysosomal degradation of STING1. (A – D) Luciferase reporter assays in HEK293T cells co-transfected with IFNB1 Luc reporter plasmid together with HA-vector or HA-NSP6 in the presence or absence of CGAS (A), STING1 (B), TBK1 (C), or IRF3 (D) for 24 h. (E) Colocalization of NSP6 with STING1, CGAS, TBK1, or IRF3 was assessed by confocal microscopy in HEK293T cells co-transfected with GFP-NSP6 and MYC-STING1, Flag-CGAS, Flag-TBK1, or Flag-IRF3. Cells were fixed at 24 h after transfection and probed with Flag antibody (red) (left). Confocal images were analyzed for colocalization using ImageJ software (right). Scale bars: 5 µm. (F) the STING1 levels were determined by immunoblotting in HEK293T cells co-transfected with MYC-STING1 (0.5 μg) plasmid and increasing amounts of HA-NSP6-expressing plasmid (0, 0.5, 1.0, and 2.0 μg, respectively) for 24 h (left). Band intensities were determined by ImageJ software (right). (G) the expression of endogenous STING1 protein was determined by immunoblotting in HeLa cells (expressing endogenous CGAS and STING1) transfected with different doses of HA-NSP6-expressing plasmid (0, 0.5, 1.0, and 2.0 μg, respectively) at 24 h after transfection (left). Band intensities were determined by ImageJ software (right). (H) STING1 phosphorylation was determined by immunoblotting in HeLa cells (expressing endogenous CGAS and STING1) transfected with HA-NSP6 or HA-Vector plasmid for 24 h, followed by 2’,3’-cGAMP treatment for 8 h. (I) the endogenous STING1 mRNA levels were analyzed in HeLa cells (expressing endogenous CGAS and STING1) transfected with HA-NSP6 or HA-vector plasmid by RT-qPCR at 24 h post-transfection (n = 3). (J) the effects of inhibitors on the NSP6-mediated destabilization of STING1 were evaluated by immunoblot analysis in HEK293T cells co-transfected with MYC-STING1 and HA-NSP6-expressing plasmids for 24 h, followed by DMSO, MG132 (10 μM), or NH4Cl (25 mM), along with CHX (100 μg/mL) treatment for 9 h (left). Band intensities were determined by ImageJ software (right). The data are representative of three independent experiments. Data are presented as mean ± SD. *P < 0.05, **P < 0.01, and ***P < 0.001 (unpaired, two-tailed Student’s t-test).
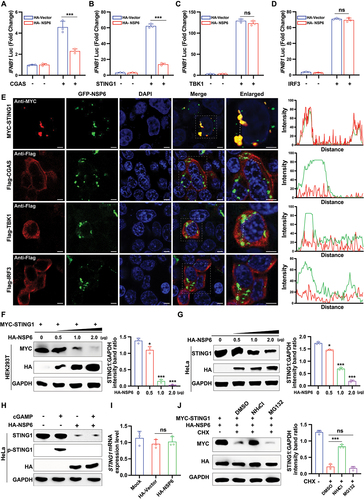
Two major systems control protein degradation in eukaryotic cells: the ubiquitin-proteasome and autophagy-lysosomal pathways [Citation36]. To investigate the pathways contributing to the role of SARS-CoV-2 NSP6 in STING1 degradation, HEK293T cells were co-transfected with MYC-STING1 and HA-NSP6-expressing plasmids, followed by treatment with inhibitors targeting different protein degradation pathways. Immunoblotting analysis revealed that NSP6-mediated degradation of STING1 was rescued by the autophagosome inhibitor NH4Cl but not by the proteasome inhibitor MG132 (), indicating that NSP6-mediated STING1 degradation is dependent on autophagy. These results revealed that NSP6 might promote the autophagy-dependent degradation of STING1.
SARS-CoV-2 NSP6 triggers autophagy
Since SARS-CoV-2 NSP6 promotes the lysosomal degradation of STING1, the effect of SARS-CoV-2 NSPs on autophagy activation was next investigated. HEK293T cells were co-transfected with the GFP (green fluorescent protein)-tagged autophagosome marker MAP1LC3B/LC3B (microtubule associated protein 1 light chain 3 beta) and an individual SARS-CoV-2 NSP-expressing plasmid. The aggregation of LC3B was investigated by immunofluorescence microscopy. GFP-LC3B puncta were observed in NSP6-overexpressing HEK293T cells () but not in cells expressing other NSPs at 24 h post-transfection (Figure S1A). Autophagic flux was further examined using mCherry-GFP-LC3B puncta formation assays. The results showed that NSP6 decreased the number of GFP-LC3B (green) puncta, but the mCherry signal (red) remained in HEK293T cells 24 h post-transfection, suggesting that NSP6 promoted the formation of autolysosomes (). In addition, the expression levels of LC3B and SQSTM1 were detected in HEK293T cells transfected with HA-NSP6 plasmid. The results showed that NSP6 significantly increased the expression of LC3B-II and promoted SQSTM1 degradation at 24 and 48 h post-transfection (). The induction of autophagy and autophagosome formation was observed in NSP6-overexpressing HEK293T cells by TEM imaging (). Similarly, the results of GFP-LC3B puncta detection by immunofluorescence (Figure S1B) and of LC3B and SQSTM1 expression detection by immunoblotting (Figure S1C) showed that NSP6 could also induce autophagy in HeLa and A549 cells.
Figure 3. SARS-CoV-2 NSP6 triggers autophagy. (A) the LC3B puncta were detected by immunofluorescence microscopy in HEK293T cells co-transfected with GFP-LC3B and HA-NSP6 or HA-vector plasmids for 24 h with anti-HA antibodies (left). The amount of autophagy was determined by quantification of GFP-LC3B puncta in 30 cells (right). Scale bars: 5 µm. (B) the colocalization of GFP-LC3B and mCherry-LC3B was visualized by immunofluorescence microscopy in HEK293T cells co-transfected with mCherry-GFP-LC3B and HA-NSP6 or HA-vector plasmids for the indicated time periods. Autophagic flux was evaluated by calculating the numbers of GFP-LC3B and mCherry-LC3B on 30 cells (right). Scale bars: 5 µm. (C) LC3B and SQSTM1 expression in HEK293T cells co-transfected with HA-NSP6 or HA-vector plasmid was detected by immunoblotting with anti-SQSTM1 and anti-LC3B antibodies at the indicated time points (top). Band intensities were determined by ImageJ software (bottom). (D) the autophagosomes (red arrows) were visualized in NSP6-expressing HEK293T cells by transmission electron microscopy (left). Scale bars: 200 nm. The number of autophagosomes per cell was quantified (right). (E) the expression of STING1 was detected by immunoblotting in WT and ATG5−/− HeLa cells (without endogenous CGAS and STING1) co-transfected with MYC-STING1 and HA-NSP6 plasmids for 24 h (left). Band intensities were determined by ImageJ software (right). (F) IFNB1 mRNA levels were measured using RT-qPCR in WT and ATG5–/– HeLa cells (without endogenous CGAS and STING1) co-transfected with MYC-STING1 and HA-NSP6 plasmids for 24 h. (G) the expression of STING1 was detected by immunoblotting in HEK293T cells co-transfected with MYC-STING1 and HA-NSP6 plasmids for 24 h and treated with or without CQ treatment (20 µM) 9 h after transfection until cells were harvested (left). Band intensities were determined by ImageJ software (right). (H) IFNB1 mRNA levels were measured using RT-qPCR in HEK293T cells co-transfected with MYC-STING1 and HA-NSP6 plasmids for 24 h with or without CQ treatment (CQ 20 µM) for 9 h. The data are representative of three independent experiments. Data are presented as mean ± SD. *P < 0.05, **P < 0.01, and ***P < 0.001 (unpaired, two-tailed Student’s t-test).
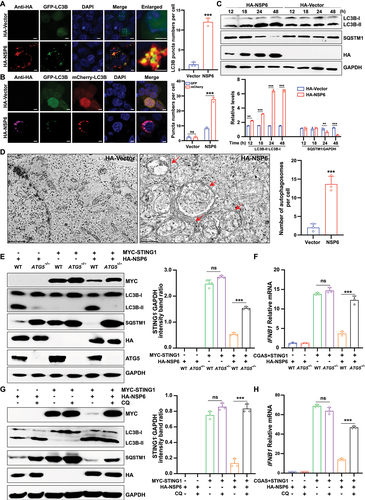
ATG5 (autophagy related 5) is specifically required for autophagy [Citation37]. To further examine whether the induction of autophagy is essential for NSP6-mediated STING1 degradation, STING1 expression and IFNB1 mRNA levels were determined in wild-type (WT) and ATG5−/− HeLa cells (without endogenous CGAS and STING1) co-transfected with HA-NSP6 and MYC-STING1 plasmids. ATG5 deficiency significantly impaired NSP6-induced STING1 degradation () and abolished the inhibitory effect of NSP6 on CGAS-STING1-stimulated IFNB1 mRNA expression (). Chloroquine (CQ), an inhibitor of the lysosome pathway, also significantly impaired the inhibitory effect of NSP6 on STING1 expression () and CGAS-STING1-stimulated IFNB1 expression in HEK293T cells (). Collectively, these results suggest that SARS-CoV-2 NSP6 triggers autophagy and potentiates STING1 degradation to inhibit IFN expression in an autophagy-dependent manner.
SARS-CoV-2 NSP6 81–120 is the key region for autophagy induction and STING1 degradation
The key regions of NSP6 that promoted autophagy and STING1 degradation were investigated. The topology of NSP6 was predicted using TMHMM [Citation38] and CCTOP [Citation39] tools, showing that full-length NSP6 (NSP6-FL) contained seven transmembrane domains (shaded gray), two main extracellular domains (pink; residues 81–120 and 231–290), and three main intracellular domains (blue) (). To identify the key region for inducing autophagy, nine truncated NSP6-expressing plasmids, TM1 (1–29), TM1–2 (1–60), TM1–3 (1–80), TM1–4 (1–120), TM1–5 (1–150), TM1–6 (1–180), TM1–7 (1–231), TM3–4 (81–120), and ∆TM1–4 (121–290), were constructed according to the transmembrane regions (). Plasmids were transfected into HEK293T cells for immunofluorescence microscopy. The GFP-LC3B puncta were observed in TM1–4-, TM1–5-, TM1–6-, and TM1–7-expressing cells, whereas TM1, TM1–2, TM1–3, and ∆TM1–4 [121–290] could not induce LC3B aggregation, indicating that NSP6 81–120 is critical for triggering autophagy ().
Figure 4. SARS-CoV-2 NSP6 81–120 is the key region for autophagy induction and STING1 degradation. (A) Prediction of transmembrane helices of NSP6 by the software TMHMM. Extracellular (pink lines), transmembrane (gray lines), and cytosolic regions (blue lines) of the encoded protein are shown. (B) Schematics of a working topology model of the truncated SARS-CoV-2 NSP6. (C) the GFP‐LC3B puncta were visualized by confocal microscopy in HEK293T cells co-transfected with GFP‐LC3B and the indicated truncated NSP6 plasmids for 24 h (left). The amount of autophagy was determined by quantification of GFP-LC3B puncta in 30 cells (right). Scale bars: 5 µm. (D) the LC3B expression was detected by immunoblotting in HEK293T cells transfected with the indicated truncated NSP6 plasmids for 24 h (left). Band intensities were determined by ImageJ software (right). (E) the STING1 expression was detected by immunoblotting in HEK293T cells co-transfected with MYC-STING1 and the indicated truncated NSP6 plasmids for 24 h (left). Band intensities were determined by ImageJ software (right). Data are representative of three independent experiments. Data are presented as mean ± SD. *P < 0.05, **P < 0.01, and ***P < 0.001 (unpaired, two-tailed Student’s t-test).
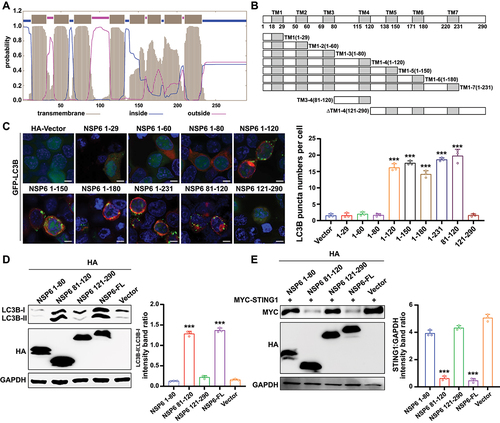
Consistently, immunoblotting analysis showed that NSP6-FL and NSP6 81–120 expression upregulated LC3B-II (). To further verify whether NSP6 81–120-mediated autophagy is necessary for STING1 degradation, STING1 levels were measured in HEK293T cells co-transfected with MYC-STING1 and NSP6-FL or differently truncated NSP6. NSP6-FL and NSP6 81–120, but not NSP6 1–80 and NSP6 121–290, promoted STING1 degradation, suggesting that NSP6 81–120 is critical for triggering STING1 degradation (). These results suggested that SARS-CoV-2 NSP6 81–120 is a key region for autophagy activation and STING1 degradation.
SARS-CoV-2 NSP6 localizes on the ER
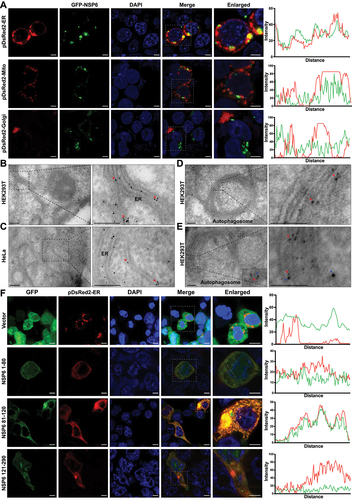
To investigate the cellular localization of SARS-CoV-2 NSP6, NSP6-GFP was co-expressed with pDsRed2-ER (ER marker), pDsRed2-Mito (mitochondrial marker), or pDsRed2-Golgi (Golgi marker) in HEK293T cells. As a result, GFP-NSP6 was found to be colocalized with pDsRed2-ER but not with pDsRed2-Mito or pDsRed2-Golgi under immunofluorescence microscopy (), suggesting that SARS-CoV-2 NSP6 localizes on the ER. Moreover, immunogold-labeled NSP6 was observed in the ER of both HEK293T and HeLa cells transfected with GFP-NSP6 ( red arrows) and even on double-membrane autophagosomes in NSP6-expressing HEK293T cells (, red arrow). Furthermore, NSP6 (labeled with 5-nm gold particles, red arrows) and LC3B (labeled with 10-nm gold particles, blue arrows) were observed on the double-membrane structure of autophagosomes in HEK293T cells transfected with NSP6 using double-label immunoelectron microscopy (). The key region for NSP6 localization in the ER was determined by immunofluorescence microscopy in HEK293T cells co-transfected with pDsRed2-ER and truncated NSP6 plasmids. The results showed that only NSP6 81–120 was localized to the ER (). Together, these findings suggest that NSP6 81–120 is critical for anchoring NSP6 to the ER, a major membrane source of autophagosomes.
Figure 5. SARS-CoV-2 NSP6 localizes on the ER. (A) the localization of SARS-CoV-2 NSP6 was investigated by immunostaining in HEK293T cells co-transfected with GFP-NSP6 plasmids along with pDsred2-ER (ER marker), pDsred2-Mito (mitochondria marker), or pDsred2-Golgi (Golgi marker) plasmid (left). The intensity distribution of the SARS-CoV-2 NSP6 protein and proteins indicated along the plotted lines was analyzed by ImageJ line scan analysis (right). Scale bars: 5 μm. (B–D) the localization of NSP6 in ER and autophagosomes was confirmed by immunoelectron microscopy. Ultrathin sections were prepared using NSP6-expressing HEK293T cells (B, D) and HeLa cells (without endogenous CGAS and STING1) (C), where gold particles (10 nm, red arrows) were found in the ER and autophagosomes with a double-membrane structure. Scale bars: 200 nm. (E) the colocalization of NSP6 and LC3B in autophagosomes was confirmed by immunoelectron microscopy. HEK293T cells were transfected with GFP-NSP6 and processed for immunoelectron microscopy with 15 nm gold particles against LC3B (blue arrows) and 5 nm gold particlesagainst GFP (red arrows). Scale bars: 200 nm. (F) the ER localization of truncated NSP6 was investigated by immunofluorescence in HEK293T cells co-transfected with pDsred2-ER and the indicated truncated NSP6 plasmids or GFP vector (left). The intensity distribution of the truncated NSP6 and pDsred2-ER along the plotted lines was analyzed by ImageJ line scan analysis (right). Scale bars: 5 μm. Data are representative of three independent experiments.
SARS-CoV-2 NSP6 triggers ER stress-induced autophagy by targeting HSPA5/GRP78
ER stress is a result of imbalanced protein homeostasis or proteostasis in the ER [Citation40–42]. HSPA5/GRP78 (heat shock protein family A (Hsp70) member 5) is an ER resident chaperone. In non-stressed cells, the ER sensors ATF6 (activating transcription factor 6), ERN1/IRE1 (endoplasmic reticulum to nucleus signaling 1), and EIF2AK3/PERK (eukaryotic translation initiation factor 2 alpha kinase 3) are maintained in an inactive state through interactions with HSPA5. Under ER stress, HSPA5 expression increases. Then, HSPA5 is released from activated ER sensors [Citation43]. Whether SARS-CoV-2 NSP6 is involved in the ER stress response was examined. NSP6 overexpression in HEK293T cells significantly upregulated the expression levels of HSPA5, indicating that NSP6 triggered the ER stress response. It was observed that NSP6 overexpression resulted in an increase of the phosphorylation levels of EIF2AK3 and EIF2A/eIF2α (eukaryotic translation initiation factor 2A), while the phosphorylation level of ERN1 remained unchanged. It was found that the ATF6 pathway was not activated as the expression levels of ATF6-FL and cleaved/active ATF6 (ATF6 p50) remained unchanged (). These results suggested that NSP6 selectively activated the EIF2AK3-EIF2A pathway, with no alterations in the ERN1 and ATF6 pathways.
Figure 6. SARS-CoV-2 NSP6 interacts with HSPA5 and enhances ER stress-induced autophagy by activating the EIF2AK3-EIF2A signaling pathway. (A) HEK293T cells were transfected with the HA-NSP6 or HA-vector plasmid. The cell lysates were harvested after 12, 24, 36, and 48 h and then were analyzed by immunoblotting with the indicated antibodies. (B) the interaction between NSP6 and the endogenous HSPA5 was detected by co-IP assays in HEK293T cells transfected with Flag vector or Flag-NSP6 plasmid for 24 h. (C) the interaction between HSPA5 and EIF2AK3 was analyzed by co-IP assay in 293T cells co-transfected with the indicated plasmids for 24 h. (D) the STING1 and LC3B expression levels were analyzed by immunoblotting in HEK293T cells pretreated with or without 10 μM 4PBA for 6 h, followed by co-transfection of the indicated plasmids for 24 h (left). Band intensities were determined by ImageJ software (right). (E-F) the mRNA levels of IFNB1 and ISG15 were measured using RT-qPCR in HEK293T cells pretreated with or without 10 μM 4PBA for 6 h, followed by co-transfection of the indicated plasmids for 24 h. (G) the STING1 expression levels were analyzed by immunoblotting in HeLa cells (expressing endogenous CGAS and STING1) transfected with HA-NSP6 or HA-Vector plasmid, along with either specific siRNA-RETREG1 or siRNA-CCPG1 for 24 h (left). Band intensities were determined by ImageJ software (right). (H) RT-Qpcr analysis of IFNB1 mRNA levels in HeLa cells (expressing endogenous CGAS and STING1) transfected with HA-NSP6 or HA-Vector plasmid, along with either specific siRNA-RETREG1 or siRNA-CCPG1 for 24 h, followed by 2’,3’-cGAMP treatment for 8 h. (I) RT-qPCR analysis of SARS-CoV-2 NP mRNA levels were determined in HeLa-ACE2 cells transfected with HA-NSP6 or HA-Vector plasmid, along with either specific siRNA-RETREG1 or siRNA-CCPG1 for 24 h, followed by 2’,3’-cGAMP treatment for 8 h, then SARS-CoV-2-WT (MOI = 0.01) infection for another 12 h. The viral RNA levels of NP gene were evaluated by RT-qPCR. The data are representative of three independent experiments. Data are presented as mean ± SD. *P < 0.05, **P < 0.01, and ***P < 0.001 (unpaired, two-tailed Student’s t-test).
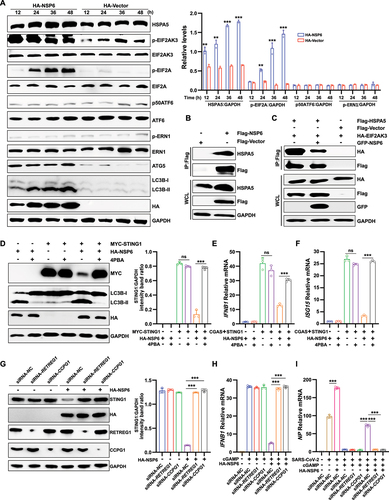
Under normal physiological conditions, the transmembrane receptor proteins EIF2AK3, ERN1, and ATF6 in the lumenal region of the ER bind to HSPA5 to form a stable complex that maintains them in an inactive state [Citation44]. Since NSP6 triggers the EIF2AK3-EIF2A signaling pathway, the interaction between NSP6 and HSPA5 was investigated. The co-immunoprecipitation (Co-IP) assay revealed a significant interaction between NSP6 and HSPA5 in HEK293T cells overexpressing NSP6 (). To investigate whether NSP6 could block HSPA5-EIF2AK3 interaction to activate the EIF2AK3-EIF2A signaling pathway, the interaction between HSPA5 and EIF2AK3 in the absence or presence of NSP6 was investigated by Co-IP assay in HEK293T cells. As expected, the HSPA5-EIF2AK3 interaction was decreased by NSP6 overexpression (), indicating that the HSPA5-EIF2AK3 interaction was blocked by the NSP6-HSPA5 interaction.
In addition, 4PBA, an effective inhibitor of ER stress [Citation45–47], was used to investigate whether NSP6 promotes STING1 degradation through ER stress-induced autophagy. The results showed that 4PBA inhibited NSP6-triggered autophagy, abolished the inhibitory effect of NSP6 on STING1 expression () and CGAS-STING1-triggered-IFNB1 () and ISG15 () expression in HEK293T cells. To further confirm the role of ER autophagy in NSP6-mediated STING1 degradation, siRNAs were used to knockdown the ER-specific autophagy receptors RETREG1/FAM134B (reticulophagy regulator 1) and CCPG1 (cell cycle progression 1) in HeLa cells. The knockdown of RETREG1 or CCPG1 abolished the inhibitory effect of NSP6 on STING1 expression () and cGAMP-stimulated IFNB1 expression (). Furthermore, we investigated the role of NSP6, RETREG1, and CCPG1 on the replication of SARS-CoV-2 in HeLa-ACE2 cells. As expected, pretreatment of overexpressed NSP6 significantly promoted SARS-CoV-2 NP expression, while cGAMP had the opposite effect. The knockdown of RETREG1 or CCPG1 impaired the positive role of NSP6 in viral replication (). ΔF508-CFTR (CF transmembrane conductance regulator) is a misfolded multi-spanning transmembrane protein in the ER that causes ER stress but is unable to induce autophagy [Citation48]. Therefore, the overexpressed ΔF508-CFTR was used as the control to detect the specific effect of overexpressed NSP6 on STING1 degradation and IFN production in cGAMP-stimulated HeLa cells. The results showed that overexpression of ΔF508-CFTR did not promote STING1 degradation (Figure S2A) or inhibit IFNB1 (Figure S2B) and ISG15 (Figure S2C) production as NSP6 did. Together, these results demonstrated that the SARS-CoV-2 NSP6-HSPA5 interaction triggers ER stress-induced autophagy through the EIF2AK3-EIF2A signaling pathway, which then promotes STING1 degradation and reduces IFN production, thereby promoting viral replication.
NSP6 of SARS-CoV-2 variants with a three-amino acids deletion attenuates autophagy and autophagy-dependent STING1 degradation
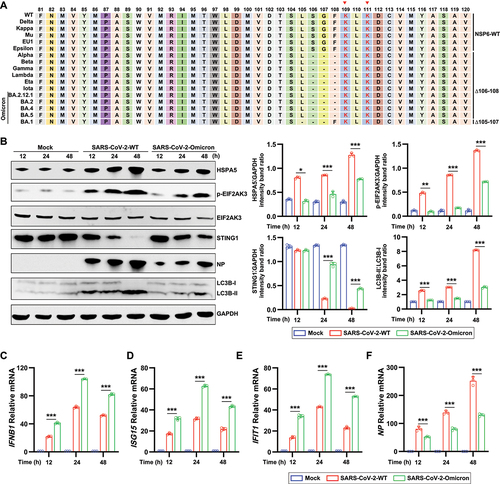
Analysis of the SARS-CoV-2 complete genome sequences deposited in the GISAID database showed that seven SARS-CoV-2 variant strains (Alpha, Lamma, Gamma, Beta, Eta, Lota, and Omicron) displayed a continuous three-amino acid (aa) deletion in NSP6, including deletion of aa at 106–108 (a prevalent 9-nt deletion at 11,285–11,293 nt, named NSP6 ∆106–108) in Alpha, Lamma, Gamma, Beta, Eta, Lota, Omicron BA2, Omicron BA.2.12.1, Omicron 4, and Omicron 5, and at 105–107 (11,282–11,291 nt, named NSP6 ∆105–107) in Omicron BA.1 variant strains (). A topology model of SARS-CoV-2 NSP6 was constructed using Protter [Citation49] (Figure S3A). It was found that the sequence of NSP6 81–120 harbors a double lysine localization signal (belonging to the ER protein localization return signal; red font with an asterisk), and the aa deletion of NSP6 in the mutant strain of SARS-CoV-2 was located just before the double lysine ER localization signal. Therefore, it was speculated that lysine residues 109 and 111 of NSP6 May be specific signals for ER retention.
Figure 7. SARS-CoV-2 variants with a three-amino acids deletion in NSP6 attenuates autophagy and autophagy-dependent STING1 degradation (A) Sequence alignment of NSP6 81–120 in SARS-CoV-2 WT and variants by the DNAMAN software. Red triangles indicate highly conserved double lysine signal sequences. (B) HeLa-ACE2 cells were infected with SARS-CoV-2 WT or Omicron variant (MOI = 0.01). The cell lysates were harvested after 12, 24, and 48 h and then were analyzed by immunoblotting with the indicated antibodies (left). Band intensities were determined by ImageJ software (right). (C–F) the mRNA levels of IFNB1 (C), ISG15 (D), IFIT1 (E), and NP (F) were determined by RT-qPCR in ACE2-HeLa cells infected with SARS-CoV-2 WT or Omicron for 12, 24, and 48 h. The data are representative of three independent experiments. Data are presented as mean ± SD. *P < 0.05, **P < 0.01, and ***P < 0.001 (unpaired, two-tailed Student’s t-test).
LSGF is located within the flexible outer loop of NSP6, which contains a double lysine ER-retention motif (Figure S3B, left). The tertiary structure modeling for NSP6 WT and NSP6 81–120 ∆106–106 by AlphaFold2 [Citation50] showed that the three-aa deletion resulted in the shortening of the residues 81–120 internal loop, which is unfavorable for protein folding (Figure S3B, right). The three-dimensional structures of NSP6 WT, NSP6 ∆106–108, and NSP6 ∆105–107 were determined using AlphaFold2 (Figure S3C), which showed that the 81–120 residues locate in the extracellular loop. NSP6 WT has a longer loop region (between TM3 and TM4) outer transmembrane helix than NSP6 ∆106–108 and NSP6 ∆105–107, indicating that the deletion of LSG or SGF may impact the structure, subcellular localization, and function of NSP6.
To investigate the role of three aa deletion of NSP6, we examined ER stress-induced autophagy, STING1 degradation, and IFN production in HeLa-ACE2 cells infected with SARS-CoV-2 WT or Omicron variant (Omicron BA.5.2.15, NSP6 ∆106–108). Compared to SARS-CoV-2 WT, the Omicron variant induced lower levels of HSPA5, p-EIF2AK3, and LC3B-II () and higher levels of STING1 (), IFNB1 (), ISG15 (), and IFIT1 (). Consistently, both the protein () and mRNA () levels SARS-CoV-2 NP were lower in Omicron variant-infected HeLa-ACE2 cells than those in SARS-CoV-2 WT-infected cells.
To further determine whether the three-aa deletion on NSP6 impacts its biological functions, the effects of NSP6-WT, NSP6 Δ105–107, and NSP6 Δ106–108 on autophagy were investigated. The LC3B puncta were investigated by fluorescence microscopy in HEK293T cells co-transfected with GFP-LC3B and NSP6 WT, NSP6 Δ105–107, or NSP6 Δ106–108 plasmids. A considerably lower amount of LC3B puncta was observed in NSP6 Δ105–107- and NSP6 Δ106–108-overexpressing cells than in NSP6 WT-overexpressing cells (), indicating the 105–107 aa or 106–108 aa deletion in NSP6 attenuated autophagy induction. The expression levels of LC3B-I and LC3B-II were also detected by immunoblotting in HEK293T cells by immunoblotting. The results showed that NSP6 WT expression promoted LC3B conversion, whereas NSP6 with a three-aa deletion showed less conversion (). Next, whether these three-aa deletions affected STING1 degradation in HEK293T cells co-transfected with MYC-STING1 and different NSP6 variants was investigated. The results showed that the three-aa deletion of NSP6 decreased the efficiency of STING1 degradation (). Furthermore, Δ106–108 or Δ105–107 significantly reduced the binding ability of NSP6 and HSPA5 ().
Figure 8. SARS-CoV-2 NSP6 with three-aa deletion leads to the attenuation of autophagy and STING1 degradation. (A) the LC3B puncta were investigated by fluorescence microscopy in HEK293T cells co-transfected with GFP-LC3B and NSP6 WT, NSP6 Δ105–107, or NSP6 Δ106–108 plasmid. The amount of autophagy was determined by quantification of GFP-LC3B puncta in 30 cells (right). Scale bars: 5 μm. (B–C) the expression levels of LC3B (B) and STING1 (C) were analyzed by immunoblotting in HEK293T cells co-transfected with the indicated plasmids for 24 h (left). Band intensities were determined by ImageJ software (right). (D) the interaction between HSPA5 and NSP6, NSP6 Δ106–108, or NSP6 Δ105–107 was detected by co-IP assays in HEK293T cells co-transfected with the indicated plasmids for 24 h. (E-G) the mRNA levels of IFNB1 (E), ISG15 (F), and IFIT1 (G) were determined by RT-qPCR in HeLa cells (expressing endogenous CGAS and STING1) transfected with HA-NSP6, NSP6 Δ106–108, NSP6 Δ105–107, or HA-Vector plasmid for 24 h, followed by 2’,3’-cGAMP treatment for 8 h. (H) RT-qPCR analysis of SARS-CoV-2 NP mRNA levels in HeLa-ACE2 cells transfected with HA-NSP6, NSP6 Δ106–108, NSP6 Δ105–107, or HA-Vector plasmid for 24 h, followed by 2’,3’-cGAMP treatment for 8 h, then SARS-CoV-2-WT (MOI = 0.01) infection for another 12 h. The data are representative of three independent experiments. Data are presented as mean ± SD. *P < 0.05, **P < 0.01, and ***P < 0.001 (unpaired, two-tailed Student’s t-test).
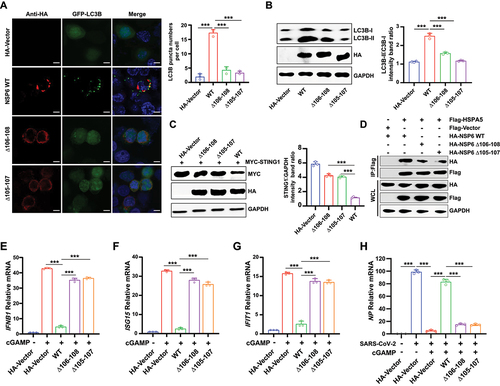
Given that NSP6 suppresses CGAS-STING1-mediated type I IFN production, IFN and ISG production was examined in HeLa cells (expressing endogenous CGAS and STING1) transfected with various NSP6 variants, followed by stimulation with cGAMP, which triggers the CGAS-STING1 signaling pathway. The results showed that NSP6 WT, but not NSP6 Δ105–107 or NSP6 Δ106–108, inhibited the IFNB1 (), ISG15 (), and IFIT1 () mRNA production. We further investigated the effect of different NSP6 variants on SARS-CoV-2 replication in cGAMP-stimulated HeLa-ACE2 cells. The results showed that only NSP6 WT abolished the inhibitory effect of cGAMP on SARS-CoV-2 NP expression (). In addition, we examined the effect of various NSP6 variants on the replication of HSV-1 (herpes simplex virus type 1), a DNA virus that stimulates CGAS-STING1 signaling pathway. The mRNA levels of IFNB1 (Figure S4A) and ISG15 (Figure S4B) were higher, and HSV-1 UL30 (Figure S4C) were lower in NSP6 Δ105–107 or NSP6 Δ106–108 overexpressing cells than those in NSP6 WT overexpressing cells. Moreover, overexpression of NSP6 WT enhanced HSV‐1 GD expression by immunoblotting analysis (Figure S4D and S4E), but this effect was relatively small for NSP6 Δ105–107 or NSP6 Δ106–108 (Figure S4E). These results demonstrated that some variant NSP6 with three-aa deletion (Δ105–107 or Δ106–108) leads to attenuated autophagy, decreased STING1 degradation, and the loss of most of its capacity to suppress the production of type I IFN, thereby inhibiting viral replication.
Discussion
The host innate immune response, which is the first line of defense against invading pathogens, is crucial for protecting the host against infections [Citation51,Citation52]. However, viruses have developed diverse mechanisms to evade the innate immune responses. In this study, the mechanism through which SARS-CoV-2 utilizes the autophagy pathway to evade the host innate immune response by promoting STING1 degradation was revealed. The data showed that SARS-CoV-2 NSP6 promoted STING1 degradation through the autophagy-lysosome pathway, leading to decreased CGAS-STING1 pathway-mediated IFN production. In addition, NSP6 localized to the ER and triggered the ER stress pathway to induce cellular autophagy, suggesting an important autophagy-inducing mechanism in SARS-CoV-2 infection. Notably, a three-aa deletion (Δ105–107 or Δ106–108) in NSP6 of SARS-CoV-2 Alpha, Lamma, Gamma, Beta, Eta, Iota, and Omicron variants led to the reduction of autophagy, STING1 degradation, and enhancement of IFN production (). These findings suggested that the loss of critical aa residues in NSP6 May be one of the main reasons for the attenuation of some SARS-CoV-2 variants.
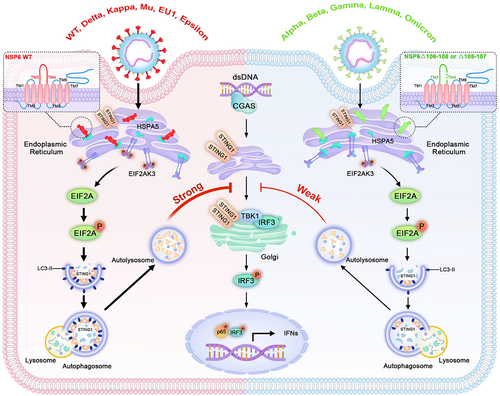
Figure 9. A model for how SARS-CoV-2 NSP6 triggers ER stress-induced autophagy to degrade STING1. NSP6 triggers ER stress and binds to HSPA5 to activate EIF2AK3, which induces EIF2AK3-EIF2A signaling pathway-mediated autophagy, leading to the lysosomal degradation of STING1 and downregulation of interferon production. These functions are diminished in NSP6 of SARS-CoV-2 variants with a three-aa deletion (Δ105–107 or Δ106–108).
The molecular mechanisms through which SARS-CoV-2 activates autophagy are poorly understood. Oligomerization of NSP6 in the ER can align ER cisternae into zippers that connect virus replication compartments [Citation31], which also provides a possible functional link between NSP6 and ER autophagy. ER stress activates three main signaling pathways (ATF6, ERN1, and EIF2AK3) that may induce autophagy, reduce ER stress, and restore homeostasis [Citation53,Citation54]. In the present study, it was shown that SARS-CoV-2 NSP6 localizes to the ER and triggers the ER stress pathway to induce cellular autophagy, suggesting an important autophagy-inducing mechanism for SARS-CoV-2. Overexpression of SARS-CoV-2 NSP6 enhanced ER stress-induced autophagy by activating the EIF2AK3 pathway, but not the ERN1 and ATF6 pathways. ER stress inhibition or ATG5 deletion suppressed NSP6-mediated autophagy and STING1 degradation. Moreover, the interaction between NSP6 and the chaperone protein HSPA5 blocked HSPA5 binding to EIF2AK3 and activated the EIF2AK3-mediated autophagy pathway, which supports previously published data showing that ER stress inhibitors suppress SARS-CoV-2 replication [Citation55]. SARS-CoV-2 viral protein ORF3a has also been reported to be involved in autophagy activation. ORF3a induces incomplete autophagy via the ERN1- and ATF6-mediated unfolded protein response [Citation56]. SARS-CoV ORF9b affects mitochondrial dynamics, induces fusion and autophagy, and promotes cell survival [Citation57]. It is worth noting that a recent study indicated that enforced expression of SARS-CoV-2 NSP6 led to the accumulation of non-digestive autophagosomes in Calu-3, A549, and BEAS2B cells [Citation35]. Here, the results demonstrated that SARS-CoV-2 NSP6 triggers obvious complete autophagy in HEK293T cells transfected with NSP6 for 48 h. This difference may be due to the different cell types or detection times after NSP6 transfection. It is recommended that autophagic flux be detected at a later time point because autophagy is a dynamic process [Citation58].
SARS-CoV-2 is a highly contagious virus, with a number of viral variants being continuously produced [Citation31]. Evolutionary analysis of more than 350 SARS-CoV-2 sequences revealed one aa mutation (L37F) in NSP6. Based on the ER localization and functions of NSP6 of both α- and β-coronaviruses, the authors speculated that the SARS-CoV-2 NSP6 L37F mutation should favor the affinity between NSP6 and the ER membrane and affect the autophagic lysosomal machinery [Citation59]. However, SARS-CoV-2 NSP6 L37F did not affect autophagy (data not shown). Another study showed that the SARS-CoV-2 L37F mutation reduces NSP6-induced inflammasome activation and pyroptosis [Citation35]. Further studies are required to confirm the effect of the SARS-CoV-2 NSP6 L37F mutation on virus replication and pathogenicity.
Recent evidence suggests that aa residues 91–112 are key functional regions of NSP6. A conformational dynamics simulation study showed that the helical conformation of residues 91–112 aa are prone to dynamic changes under different conditions (pH, solvents, and temperatures) [Citation60], which may explain the tolerance of aa deletions in this region. In addition, dextromethorphan forms H-bonds with its methoxy group at aa residues 93, 94, 97, and 98 of NSP6, thus, decreasing the flexibility of these residues [Citation61]. In this study, it was demonstrated that SARS-CoV-2 NSP6 81–120 is the key region for inducing autophagy and promoting STING1 degradation. Collectively, the results showed that NSP6 81–120, which has a flexible conformation and lies outside of the membrane region, is a key area that plays a central role in SARS-CoV-2 replication and regulation of host innate immunity.
It has been speculated that some people infected with SARS-CoV-2 are able to rapidly control the virus through innate immune pathways, therefore, do not become ill. However, few studies have investigated the differences in innate immune responses between individuals with symptomatic or asymptomatic SARS-CoV-2 infection. The innate immune determinants of asymptomatic presentation remain difficult to resolve in terms of the relative contribution of differential protection by intrinsic antiviral pathways and prior immune subsets, such as NK or T cells [Citation62]. Recent evidence suggests that S and NSP6 are key determinants of SARS-CoV-2 Omicron BA.1 attenuation [Citation32]. Moreover, NSP6 triggers NLR3-dependent pyroptosis, and the L37F NSP6 variant associated with asymptomatic COVID-19 exhibits reduced ability to induce pyroptosis [Citation35]. In this study, it was observed that NSP6 (Δ105–107 or Δ106–108) in some SARS-CoV-2 variants triggered weaker autophagy and STING1 degradation and induced stronger IFN production than the WT NSP6. Therefore, the recovery of innate immunity decreases the possibility of SARS-CoV-2 infection relapse, further reducing the virulence of the virus and extending damage to the organism. Furthermore, the replication of HSV-1 was reduced in NSP6 ∆105–107- and NSP6 ∆106–108-overexpressing cells, which supported that 105–107 aa or 106–108 aa deletion in NSP6 recovered the host immunity defense. It was speculated that the enhancement of host antiviral immunity induced by NSP6 variants with a three-aa deletion may be responsible for the attenuation of SARS-CoV-2 variants.
In summary, the results demonstrated that SARS-CoV-2 NSP6 suppressed IFN production by triggering ER stress-induced autophagy and STING1 degradation, and NSP6 81–120 is the key region for these functions. Moreover, NSP6 (Δ105–107 or Δ106–108) in some SARS-CoV-2 variants triggered inefficient autophagy and STING1 degradation, then induced greater IFN production, which might be one of the main reasons for the attenuation of these variant strains. Therefore, it is important to pay more attention to mutations in the NSP6 81–120 region when monitoring SARS-CoV-2 evolution.
Materials and methods
Cell culture and transfection
HEK293T (CRL-3216) and HeLa (ATCC CCL-2) cells were obtained from the American Type Culture Collection (ATCC). HEK293T and HeLa cells were cultured in Dulbecco’s modified Eagle’s medium (Gibco, c11965500BT) supplemented with 10% fetal bovine serum (FBS) and 1% (w:v) antibiotics (penicillin and streptomycin) at 37°C in 5% CO2. HeLa WT and ATG5 knockout (ATG5–/–) cells lacking endogenous cGAS and STING1 were kindly donated by Prof. Song-Dong Meng (Institute of Microbiology, Chinese Academy of Sciences, Beijing). HeLa cells expressing endogenous CGAS and STING1 were donated by Professor Hui Xiao (Institute Pasteur of Shanghai, Chinese Academy of Sciences, Shanghai, China). HeLa-ACE2 cells were provided by Professor Yuhai Bi (Institute of Microbiology, Chinese Academy of Sciences). Transient transfection with the indicated plasmids was performed using a transfection reagent (YEASEN, 40802) according to the manufacturer’s instructions at a ratio of 1:3 (1 µg plasmid to 3 µl transfection reagent).
Viruses and virus infection
SARS-CoV-2 (hCoV-19/China/CAS-B001/2020, GISAID No. EPI_ISL_514256–7) was provided by Prof. Yuhai Bi (Institute of Microbiology, Chinese Academy of Sciences). SARS-CoV-2 (Omicron BA.5.2.15, NMDC60046377) was provided by Prof. Minghua Li (Kunming Institute of Zoology, Chinese Academy of Sciences). All experiments with live SARS-CoV-2 were performed inside biosafety cabinets in the biosafety level 3 facility at the Institute of Microbiology, Chinese Academy of Sciences, and the Kunming National High-level Biosafety Research Center for Non-Human Primates, Center for Biosafety Mega-Science, Kunming Institute of Zoology, the Chinese Academy of Sciences. The culture medium was removed, and the cells were washed twice with PBS (Gibco, 10010072). Serum-free culture medium containing the virus (MOI [multiplicity of infection] = 0.01) was added for 2 h and the medium was replaced with 2% FBS culture medium.
Reagents and antibodies
Rabbit monoclonal antibody against TBK1 (38066), phospho-TBK1/NAK (Ser172) (5483), IRF3 (11904), phospho-IRF3 (Ser396) (4947), Flag (14793), MYC-Tag (2276), HA-Tag (2367), GFP (2955), RETREG1/FAM134B (61011), CCPG1 (80158), and GAPDH (97166) were purchased from Cell Signaling Technology. SARS-CoV-2 nucleocapsid antibody (40588-T62) were from Sino Biological. Mouse monoclonal antibodies against HSV-1 GD (sc -21,719) were obtained from Santa Cruz Biotechnology. Rabbit antibodies against SQSTM1/p62 (5114T), LC3B (2775S), EIF2AK3/PERK (5683), phospho-EIF2AK3/PERK (3179), ERN1/IRE1 (3294), STING1 (13647), and phospho-STING1 (50907) were purchased from Cell Signaling Technology. Rabbit antibodies against ATG5 (R23497), HSPA5/GRP78 (R24509), EIF2A (R24185), phospho-EIF2A (Ser51) (R22946), ATF6 (R26445), and phospho-ERN1/IRE1 (R24754) were purchased from ZenBio. HRP-conjugated anti-mouse secondary antibody (A0216) and HRP-conjugated anti-rabbit secondary antibody (A0208) were purchased from Beyotime Biotechnology. Fluorescein (FITC) donkey anti-mouse IgG (715-096-151), rhodamine donkey anti-mouse IgG (715-025-151), and FITC donkey anti-rabbit IgG (711-095-152) were obtained from Jackson Laboratory (Bar Harbor, ME, USA). The Double-Luciferase Reporter Assay Kit and the Transcriptase Kit were purchased from TransGen (FR201–01). The Plasmid Prep Purification Kit was purchased from GeneMark (DP01-Plus). Primary antibodies were used at a dilution of 1:1,000 and HRP-coupled anti-rabbit secondary antibodies were used at a dilution of 1:10,000 for western blotting. Primary antibodies were used at a dilution of 1:200 for immunofluorescence analysis.
Plasmid constructs
The IFNB1 promoter-luciferase reporter plasmid (IFNB1-Luc) was a gift from Dr. Chunfu Zheng (Fujian Medical University, Fuzhou, China). CGAS, TBK1, IRF3, and HSPA5 were synthesized using GENEWIZ and cloned into the pcDNA3.0-Flag vector (MiaoLingBio, P6921). ΔF508-CFTR were synthesized using GENEWIZ and cloned into the P×J40vector (MiaoLingBio, P10427) with HA-tag fusion at the N terminus. The PXJ40-HA-NSP3N and PXJ40-HA-NSP3C plasmids were gifts from Dr. Peihui Wang (Shandong University, Jinan, Shandong, China). The MYC-STING1 plasmid was provided by Prof. Yingli Shang (Shandong Agricultural University, Taian, China). NSP1, NSP2, NSP4, NSP5, NSP6, NSP7, NSP8, NSP9, NSP10, NSP11, NSP12, NSP13, NSP14, NSP15, and NSP16, derived from PCR using infectious cDNA clone plasmids, were separately cloned into the P×J40vector with HA-tag fusion at the N terminus in a biosafety level 3 laboratory. The NSP6-FL and its nine mutants (TM1 [1-29], TM1-2 [1-60], TM1-3 [1-80], TM1-4 [1-120], TM1-5 [1-150], TM1-6 [1-180], TM1-7 [1-231], TM3-4 [81-120], and deltaTM1-4 [121-290] were cloned into both pcDNA3.1-N-MYC and pcDNA3.1-GFP vectors. NSP6 Δ105–107 and NSP6 Δ106–108 were synthesized using GENEWIZ and cloned into the P×J40vector with HA-tag fusion at the N terminus. Gene encoding human EIF2AK3/PERK was synthesized and cloned into the PCAGGS-HA vector. pDsRed2-ER (P0141), pDsRed2-Mito (P0142), and pDsRed-Golgi (P0770) plasmids were purchased from MiaoLingBio.
Luciferase reporter assay
HEK293T cells were seeded into 24-well plates. The following day, cells were transfected with 200 ng of luciferase reporter plasmid and 100 ng of β-Gal plasmid, as well as other required expressing plasmids for different experiments. Twenty-four hours later, the cells were lysed in a lysis buffer. After centrifugation, the supernatant was stored at −80°C. Fluorophore assays were performed using a Fluorophore Assay Kit (TransGen, FR201).
RNA extraction and real-time PCR
Total RNA was extracted from the cells using TRIzol reagent (Invitrogen, 15596026CN) according to the manufacturer’s instructions. Each sample (2 μg) was digested with DNase I and reverse-transcribed into cDNA by using oligonucleotide (dT) primers. Mock reactions were performed in the absence of reverse transcriptase. Relative real-time PCR was performed to detect gene expression in HEK293T cells. SYBR Green (Takara, RR420A)-based real-time PCR was performed using an ABI 7500 instrument. The reaction was initiated at 95°C for 30 s, followed by 40 cycles of 95°C for 5 s and 60°C for 31 s. Each sample was amplified thrice. ACTB/β-actin was used as an internal control. Primer sequences used in this study were as follows (5’–3’): IFNB1-F, 5’-AACTGCAACCTTTCGAAGCC-3’; IFNB1-R, 5’-TGTCGCCTACTACCTGTTGTGC-3’; ISG15-F, 5’-GAGAGGCAGCGAACTCATCT-3’; ISG15-R, 5’-CTTCAGCTG ACACCGACA-3; IFIT1-F, 5’-CCTGAAAGGCCAGAATCAGGAAGCC-3’; IFIT1-R, 5’-GCACCTTTTCAAAGCAGGCCTTGGC-3’; HSV-1-UL30-F, 5’-CATCACCGACCCGGAGAGGGAC-3’; HSV-1-UL30-R, 5’-GGGCCAGGCGCTTGTTGGTGTA-3’. SARS-CoV-2-NP-F, 5’- TAATCAGACAAGGAACTGATTA-3’; SARS-CoV-2-NP-R, 5’- CGAAGG TGTGACTTCCATG-3’; GAPDH-F, 5’-TTGTCTCCTGCGACTTCAACAG-3’; GAPDH-R, 5’-GGTCTGGGATGGAAATTGTGAG-3’;
siRNA interference assay
All siRNA fragments were purchased from Tsingke (Tsingke Biotechnology Co., Ltd). The siRNA sequences were as follows: RETREG1 siRNA sense: 5’-CAG UGA CUGCAGCUAUCAA-3’ and RETREG1 siRNA-1 antisense: 5’-UUGAUAGCUGCAGUCACUG-3’. CCPG1 siRNA sense: 5’-GGCUAGUUGCUGAACAAGA-3’ and CCPG1 siRNA antisense: 5’-UCUUGUUCAGCAACUAGCC-3’. Scrambled siRNA (Invitrogen) was used as a negative control. The overexpression plasmid or siRNA was transfected into HeLa cells using Lipofectamine 2000 (Invitrogen, 11668019), according to the manufacturer’s instructions. The total protein was isolated 24 h after transfection. Protein expression levels were assessed by western blotting.
Coimmunoprecipitation assay
Cells were grown in a six-well plate and transfected with the transfection reagent (YEASEN, 40802) for 24 h. The cells were harvested using lysis buffer and centrifuged at 12,000 × g for 10 min to remove cell debris. The supernatants were incubated with ANTI-FLAG® M2 affinity gel (Sigma, A2220) at 4°C for 6 h. After five washes with wash buffer (0.5% NP40 [Macklin, N885725], 300 mM NaCl, 20 mM HEPES, pH 7.4, 10% glycerol, and 1 mM EDTA), bound proteins were eluted by boiling for 10 min in SDS protein loading buffer and analyzed by immunoblotting.
Immunofluorescence microscopy
HEK293T and HeLa cells were plated 1 day before transfection in 24-well plates at 5.0 × 10⁴ cells/well. When the cell density reached 70% confluency, a total of 1 μg of plasmids was transfected to each well of a 24-well plate. Before transfection, the medium was changed to warm Opti-MEM without phenol red (Life Technologies, 11058021). Plasmid transfection was performed using a transfection reagent (YEASEN, 40802) according to the manufacturer’s instructions. The cells were treated for 24 h after transfection, washed three times with PBS, fixed in 4% paraformaldehyde for 30 min at room temperature, permeabilized with 0.5% Triton X-100 (Solarbio, T8200) in PBS for 20 min, and stained with the appropriate antibodies. Nuclei were stained with 5 μg/mL DAPI (Sigma, D9542). After staining, coverslips were analyzed using a Leica SP8 confocal microscope.
Transmission electron microscopy
HEK293T or HeLa cells were transfected with the NSP6-expressing plasmid or control vector for 24 h. Then, the cells were trypsinized and centrifuged at 1,200 × g for 10 min at 4°C. Freshly prepared fixative (2.5% glutaraldehyde, 4% paraformaldehyde, 0.2 M phosphate buffer, pH 7.5) was added to the cells and incubated at room temperature for 2 h. Then, the cells were fixed in 2% glutaraldehyde for 24 h at room temperature. The fixed cells were treated with 1% osmium tetroxide for 2 h at 4°C, dehydrated in a graded ethanol series, and then embedded in epoxy resin. Ultra-thin sections were prepared and stained with uranyl acetate and lead citrate. The samples were examined using a transmission electron microscope (Hitachi H-7650, Japan).
CHX, MG132, and NH4Cl treatment
HEK293T cells were plated 1 day before transfection in 12-well plates at 1.0 × 10⁵ cells/well. When the cell density reached 70% confluency, a total of 1.5 μg of plasmids was transfected per well of a 12-well plate. At 24 h post-transfection, the cells were treated with 100 μg/mL cycloheximide (CHX; YEASEN, 40325ES03) for 6 h. The cells were then lysed and analyzed by immunoblotting. MG132 (10 μM; Sigma, C2211) and NH4Cl (10 μM) were used simultaneously with CHX and cells were harvested 6 h after treatment.
Statistical analysis
All results are presented as mean ± SD. Student’s t-test was used to determine statistical significance, with a P-value of < 0.05 considered to indicate significance (*P < 0.05, **P < 0.01, ***P < 0.001). Statistical analyses were performed using GraphPad Prism 7.
Supplemental Material
Download MS Word (8.5 MB)Disclosure statement
No potential conflict of interest was reported by the author(s).
Supplementary data
Supplemental data for this article can be accessed online at https://doi.org/10.1080/15548627.2023.2238579
Additional information
Funding
References
- Bradley BT, Maioli H, Johnston R, et al. Histopathology and ultrastructural findings of fatal COVID-19 infections in washington state: a case series. The Lancet. 2020;396(10247):320–332. doi: 10.1016/S0140-6736(20)31305-2
- Ma C, Sacco MD, Hurst B, et al. Boceprevir, GC-376, and calpain inhibitors II, XII inhibit SARS-CoV-2 viral replication by targeting the viral main protease. Cell Res. 2020;30(8):678–692. doi: 10.1038/s41422-020-0356-z
- Lee JH, Choi M, Jung Y, et al. A novel rapid detection for SARS-CoV-2 spike 1 antigens using human angiotensin converting enzyme 2 (ACE2). Biosensors And Bioelectronics. 2021;171:112715. doi: 10.1016/j.bios.2020.112715
- Ma X, Zou F, Yu F, et al. Nanoparticle vaccines based on the receptor binding domain (RBD) and heptad repeat (HR) of SARS-CoV-2 elicit robust protective immune responses. Immunity. 2020;53(6):1315–1330.e9. doi: 10.1016/j.immuni.2020.11.015
- Gordon DE, Jang GM, Bouhaddou M, et al. A SARS-CoV-2 protein interaction map reveals targets for drug repurposing. Nature. 2020;583(7816):459–468. doi: 10.1038/s41586-020-2286-9
- Lei X, Dong X, Ma R, et al. Activation and evasion of type I interferon responses by SARS-CoV-2. Nat Commun. 2020;11(1):3810. doi: 10.1038/s41467-020-17665-9
- Thoms M, Buschauer R, Ameismeier M, et al. Structural basis for translational shutdown and immune evasion by the Nsp1 protein of SARS-CoV-2. Science. 2020;369(6508):1249–1255. doi: 10.1126/science.abc8665
- Yuan S, Peng L, J PJ, et al. Nonstructural protein 1 of SARS-CoV-2 is a potent pathogenicity factor redirecting host protein synthesis machinery toward viral RNA. Mol Cell. 2020;80(6):1055–1066.e6. doi: 10.1016/j.molcel.2020.10.034
- Hillen HS, Kokic G, Farnung L, et al. Structure of replicating SARS-CoV-2 polymerase. Nature. 2020;584(7819):154–156. doi: 10.1038/s41586-020-2368-8
- Xia H, Cao Z, Xie X, et al. Evasion of Type I Interferon by SARS-CoV-2. Cell Rep. 2020;33(1):108234. doi: 10.1016/j.celrep.2020.108234
- Takeuchi O, Akira S. Pattern recognition receptors and inflammation. Cell. 2010;140(6):805–820. doi: 10.1016/j.cell.2010.01.022
- Rehwinkel J, Gack MU. RIG-I-like receptors: their regulation and roles in RNA sensing. Nat Rev Immunol. 2020;20(9):537–551. doi: 10.1038/s41577-020-0288-3
- Hoffmann HH, Schneider WM, Rice CM. Interferons and viruses: an evolutionary arms race of molecular interactions. Trends Immunol. 2015;36(3):124–138. doi: 10.1016/j.it.2015.01.004
- Miorin L, Kehrer T, Sanchez-Aparicio MT, et al. SARS-CoV-2 Orf6 hijacks Nup98 to block STAT nuclear import and antagonize interferon signaling. Proc Natl Acad Sci U S A. 2020;117(45):28344–28354. doi: 10.1073/pnas.2016650117
- Jiang HW, Zhang HN, Meng QF, et al. SARS-CoV-2 Orf9b suppresses type I interferon responses by targeting TOM70. Cell Mol Immunol. 2020;17(9):998–1000. doi: 10.1038/s41423-020-0514-8
- Fu YZ, Wang SY, Zheng ZQ, et al. SARS-CoV-2 membrane glycoprotein M antagonizes the MAVS-mediated innate antiviral response. Cell Mol Immunol. 2021;18(3):613–620. doi: 10.1038/s41423-020-00571-x
- Ishikawa H, Barber GN. STING is an endoplasmic reticulum adaptor that facilitates innate immune signalling. Nature. 2008;455(7213):674–678. doi: 10.1038/nature07317
- Domizio JD, Gulen MF, Saidoune F, et al. The Cgas-STING pathway drives type I IFN immunopathology in COVID-19. Nature. 2022;603(7899):145–151. doi: 10.1038/s41586-022-04421-w
- Rui Y, Su J, Shen S, et al. Unique and complementary suppression of Cgas-STING and RNA sensing- triggered innate immune responses by SARS-CoV-2 proteins. Signal Transduct Target Ther. 2021;6(1):123. doi: 10.1038/s41392-021-00515-5
- Han L, Zhuang MW, Deng J, et al. SARS-CoV-2 ORF9b antagonizes type I and III interferons by targeting multiple components of the RIG-I/MDA-5-MAVS, TLR3-TRIF, and Cgas-STING signaling pathways. J Med Virol. 2021;93(9):5376–5389. doi: 10.1002/jmv.27050
- Glick D, Barth S, Macleod KF. Autophagy: cellular and molecular mechanisms. J Pathol. 2010;221(1):3–12. doi: 10.1002/path.2697
- Gkikas I, Palikaras K, Tavernarakis N. The role of mitophagy in innate immunity. Front Immunol. 2018;9:1283. doi: 10.3389/fimmu.2018.01283
- Koepke L, Hirschenberger M, Hayn M, et al. Manipulation of autophagy by SARS-CoV-2 proteins. Autophagy. 2021;17(9):2659–2661. doi: 10.1080/15548627.2021.1953847
- Miao G, Zhao H, Li Y, et al. Orf3a of the COVID-19 virus SARS-CoV-2 blocks HOPS complex-mediated assembly of the SNARE complex required for autolysosome formation. Dev Cell. 2021;56(4):427–442.e5. doi: 10.1016/j.devcel.2020.12.010
- Sui C, Xiao T, Zhang S, et al. SARS-CoV-2 NSP13 Inhibits Type I IFN production by degradation of TBK1 via p62-dependent selective autophagy. J Immunol. 2022;208(3):753–761. doi: 10.4049/jimmunol.2100684
- Li X, Hou P, Ma W, et al. SARS-CoV-2 ORF10 suppresses the antiviral innate immune response by degrading MAVS through mitophagy. Cell Mol Immunol. 2022;19(1):67–78. doi: 10.1038/s41423-021-00807-4
- Hayn M, Hirschenberger M, Koepke L, et al. Systematic functional analysis of SARS-CoV-2 proteins uncovers viral innate immune antagonists and remaining vulnerabilities. Cell Rep. 2021;35(7):109126. doi: 10.1016/j.celrep.2021.109126
- Pablos I, Machado Y, Jesus H C R D, et al. Mechanistic insights into COVID-19 by global analysis of the SARS-CoV-2 3CL(pro) substrate degradome. Cell Rep. 2021;37(4):109892. doi: 10.1016/j.celrep.2021.109892
- Cottam EM, Maier HJ, Manifava M, et al. Coronavirus nsp6 proteins generate autophagosomes from the endoplasmic reticulum via an omegasome intermediate. Autophagy. 2011;7(11):1335–1347. doi: 10.4161/auto.7.11.16642
- Cottam EM, Whelband MC, Wileman T. Coronavirus NSP6 restricts autophagosome expansion. Autophagy. 2014;10(8):1426–1441. doi: 10.4161/auto.29309
- Ricciardi S, M GA, Giaquinto L, et al. The role of NSP6 in the biogenesis of the SARS-CoV-2 replication organelle. Nature. 2022;606(7915):761–768. doi: 10.1038/s41586-022-04835-6
- Chen DY, Chin CV, Kenney D, et al. Spike and nsp6 are key determinants of SARS-CoV-2 Omicron BA.1 attenuation. Nature. 2023;615(7950):143–150. doi: 10.1038/s41586-023-05697-2
- Nishitsuji H, Iwahori S, Ohmori M, et al. Ubiquitination of SARS-CoV-2 NSP6 and ORF7a Facilitates NF-κB Activation. MBio. 2022;13(4):e0097122. doi: 10.1128/mbio.00971-22
- Zhu JY, Wang G, Huang X, et al. SARS-CoV-2 Nsp6 damages Drosophila heart and mouse cardiomyocytes through MGA/MAX complex-mediated increased glycolysis. Commun Biol. 2022;5(1):1039. doi: 10.1038/s42003-022-03986-6
- Sun X, Liu Y, Huang Z, et al. SARS-CoV-2 non-structural protein 6 triggers NLRP3-dependent pyroptosis by targeting ATP6AP1. Cell Death Differ. 2022;29(6):1240–1254. doi: 10.1038/s41418-021-00916-7
- Chen C, Qin H, Tan J, et al. The Role of Ubiquitin-Proteasome Pathway and Autophagy-Lysosome Pathway in Cerebral Ischemia. Oxid Med Cell Longev. 2020;2020:5457049. doi: 10.1155/2020/5457049
- Codogno P, Meijer AJ. Atg5: more than an autophagy factor. Nat Cell Biol. 2006;8(10):1045–1047. doi: 10.1038/ncb1006-1045
- Krogh A, Larsson B, Von Heijne G, et al. Predicting transmembrane protein topology with a hidden Markov model: application to complete genomes. J Mol Biol. 2001;305(3):567–580. doi: 10.1006/jmbi.2000.4315
- Dobson L, Reményi I, Tusnády GE. CCTOP: a Consensus Constrained TOPology prediction web server. Nucleic Acids Res. 2015;43(W1):W408–12. doi: 10.1093/nar/gkv451
- Blackwood EA, Hofmann C, Santo Domingo M, et al. ATF6 Regulates Cardiac Hypertrophy by Transcriptional Induction of the mTORC1 Activator, Rheb. Circ Res. 2019;124(1):79–93. doi: 10.1161/CIRCRESAHA.118.313854
- Korfei M, Ruppert C, Mahavadi P, et al. Epithelial endoplasmic reticulum stress and apoptosis in sporadic idiopathic pulmonary fibrosis. Am J Respir Crit Care Med. 2008;178(8):838–846. doi: 10.1164/rccm.200802-313OC
- Takeda K, Nagashima S, Shiiba I, et al. MITOL prevents ER stress-induced apoptosis by IRE1α ubiquitylation at ER-mitochondria contact sites. Embo J. 2019;38(15):e100999. doi: 10.15252/embj.2018100999
- Ibrahim IM, Abdelmalek DH, Elfiky AA. GRP78: A cell’s response to stress. Life Sci. 2019;226:156–163. doi: 10.1016/j.lfs.2019.04.022
- Bhardwaj M, Leli NM, Koumenis C, et al. Regulation of autophagy by canonical and non-canonical ER stress responses. Semin Cancer Biol. 2020;66:116–128. doi: 10.1016/j.semcancer.2019.11.007
- Liu SH, Yang CC, Chan DC, et al. Chemical chaperon 4-phenylbutyrate protects against the endoplasmic reticulum stress-mediated renal fibrosis in vivo and in vitro. Oncotarget. 2016;7(16):22116–22127. doi: 10.18632/oncotarget.7904
- Boyce M, Bryant KF, Jousse C, et al. A selective inhibitor of eIf2alpha dephosphorylation protects cells from ER stress. Science. 2005;307(5711):935–939. doi: 10.1126/science.1101902
- Chiang CK, Wang CC, Lu TF, et al. Involvement of Endoplasmic Reticulum Stress, Autophagy, and Apoptosis in Advanced Glycation End Products-Induced Glomerular Mesangial Cell Injury. Sci Rep. 2016;6:34167. doi: 10.1038/srep34167
- Abdulrahman BA, Khweek AA, Akhter A, et al. Depletion of the ubiquitin-binding adaptor molecule SQSTM1/p62 from macrophages harboring cftr ΔF508 mutation improves the delivery of Burkholderia cenocepacia to the autophagic machinery. J Biol Chem. 2013;288(3):2049–2058. doi: 10.1074/jbc.M112.411728
- Omasits U, Ahrens CH, Müller S, et al. Protter: interactive protein feature visualization and integration with experimental proteomic data. Bioinformatics. 2014;30(6):884–886. doi: 10.1093/bioinformatics/btt607
- Senior AW, Evans R, Jumper J, et al. Improved protein structure prediction using potentials from deep learning. Nature. 2020;577(7792):706–710. doi: 10.1038/s41586-019-1923-7
- Koerner I, Kochs G, Kalinke U, et al. Protective role of beta interferon in host defense against influenza a virus. J Virol. 2007;81(4):2025–2030. doi: 10.1128/JVI.01718-06
- Mcnab F, Mayer-Barber K, Sher A, et al. Type I interferons in infectious disease. Nat Rev Immunol. 2015;15(2):87–103. doi: 10.1038/nri3787
- Ma WW, Zhao L, Yuan LH, et al. Elaidic acid induces cell apoptosis through induction of ROS accumulation and endoplasmic reticulum stress in SH‑SY5Y cells. Mol Med Rep. 2017;16(6):9337–9346. doi: 10.3892/mmr.2017.7830
- Maruvada R, Argon Y, Prasadarao NV. Escherichia coli interaction with human brain microvascular endothelial cells induces signal transducer and activator of transcription 3 association with the C-terminal domain of Ec-gp96, the outer membrane protein a receptor for invasion. Cell Microbiol. 2008;10(11):2326–2338. doi: 10.1111/j.1462-5822.2008.01214.x
- Rayner JO, Roberts RA, Kim J, et al. AR12 (OSU-03012) suppresses GRP78 expression and inhibits SARS-CoV-2 replication. Biochemical Pharmacology. 2020;182:114227. doi: 10.1016/j.bcp.2020.114227
- Su WQ, Yu XJ, Zhou CM. SARS-CoV-2 ORF3a Induces Incomplete Autophagy via the Unfolded Protein Response. Viruses. 2021;13(12):2467. doi: 10.3390/v13122467
- Madeddu E, Maniga B, Zaffanello M, et al. The SARS-CoV2 and mitochondria: the impact on cell fate. Acta Biomed. 2022;93(2):e2022199. doi: 10.23750/abm.v93i2.10327
- Guo S, Liang Y, Murphy SF, et al. A rapid and high content assay that measures cyto-ID-stained autophagic compartments and estimates autophagy flux with potential clinical applications. Autophagy. 2015;11(3):560–572. doi: 10.1080/15548627.2015.1017181
- Benvenuto D, Angeletti S, Giovanetti M, et al. Evolutionary analysis of SARS-CoV-2: how mutation of Non-Structural Protein 6 (NSP6) could affect viral autophagy. J Infect. 2020;81(1):e24–e27. doi: 10.1016/j.jinf.2020.03.058
- Kumar A, Kumar P, Saumya KU, et al. Investigating the conformational dynamics of SARS-CoV-2 NSP6 protein with emphasis on non-transmembrane 91-112 & 231-290 regions. Microb Pathog. 2021;161(Pt A):105236. doi: 10.1016/j.micpath.2021.105236
- Pandey P, Prasad K, Prakash A, et al. Insights into the biased activity of dextromethorphan and haloperidol towards SARS-CoV-2 NSP6: in silico binding mechanistic analysis. J Mol Med (Berl). 2020;98(12):1659–1673. doi: 10.1007/s00109-020-01980-1
- Boyton RJ, Altmann DM. The immunology of asymptomatic SARS-CoV-2 infection: what are the key questions? Nat Rev Immunol. 2021;21(12):762–768. doi: 10.1038/s41577-021-00631-x