
ABSTRACT
Adult stem cells are long-lived and quiescent with unique metabolic requirements. Macroautophagy/autophagy is a fundamental survival mechanism that allows cells to adapt to metabolic changes by degrading and recycling intracellular components. Here we address why autophagy depletion leads to a drastic loss of the stem cell compartment. Using inducible deletion of autophagy specifically in adult hematopoietic stem cells (HSCs) and in mice chimeric for autophagy-deficient and normal HSCs, we demonstrate that the stem cell loss is cell-intrinsic. Mechanistically, autophagy-deficient HSCs showed higher expression of several amino acid transporters (AAT) when compared to autophagy-competent cells, resulting in increased amino acid (AA) uptake. This was followed by sustained MTOR (mechanistic target of rapamycin) activation, with enlarged cell size, glucose uptake and translation, which is detrimental to the quiescent HSCs. MTOR inhibition by rapamycin treatment in vivo was able to rescue autophagy-deficient HSC loss and bone marrow failure and resulted in better reconstitution after transplantation. Our results suggest that targeting MTOR may improve aged stem cell function, promote reprogramming and stem cell transplantation.
List of abbreviations: 5FU: fluoracil; AA: amino acids; AKT/PKB: thymoma viral proto-oncogene 1; ATF4: activating transcription factor 4; BafA: bafilomycin A1; BM: bone marrow; EIF2: eukaryotic initiation factor 2; EIF4EBP1/4EBP1: eukaryotic translation initiation factor 4E binding protein 1; KIT/CD117/c-Kit: KIT proto-oncogene receptor tyrosine kinase; HSCs: hematopoietic stem cells; HSPCs: hematopoietic stem and progenitor cells; Kyn: kynurenine; LSK: lineage− (Lin−), LY6A/Sca-1+, KIT/c-Kit/CD117+; LY6A/Sca-1: lymphocyte antigen 6 family member A; MTOR: mechanistic target of rapamycin kinase; MTORC1: MTOR complex 1; MTORC2: MTOR complex 2; OPP: O-propargyl-puromycin; PI3K: phosphoinositide 3-kinase; poly(I:C): polyinosinic:polycytidylic acid; RPS6/S6: ribosomal protein S6; tam: tamoxifen; TCA: tricarboxylic acid; TFEB: transcription factor EB; PTPRC/CD45: Protein Tyrosine Phosphatase Receptor Type C, CD45 antigen.
Introduction
A fine balance of self-renewal and differentiation fate choices allows hematopoietic stem cells (HSCs) to maintain themselves and produce lineage restricted progenitors to fulfil the demands of the blood system. Evidence is accumulating that healthy HSCs only survive and function properly if they maintain a balanced metabolic state. This is achieved by restrained activation of the MTOR (mechanistic target of rapamycin kinase), which orchestrates catabolism (break-down) and anabolism (growth and building) [Citation1]. Regulation of downstream targets by MTOR signaling is mediated through the action of two complexes, MTOR complex 1 (MTORC1) and MTOR complex 2 (MTORC2). MTORC1 activity promotes cell growth, glycolysis, increased protein and lipid biosynthesis, but restricts macroautophagy/autophagy and lysosome biogenesis [Citation2]. Protein synthesis is regulated through the phosphorylation of RPS6/S6 (ribosomal protein S6) and the EIF4EBP1/4EBP1 (eukaryotic translation initiation factor 4E binding protein 1), and thereby controls the initiation of protein translation [Citation3]. Active MTORC1 inhibits autophagy by phosphorylation-dependent inhibition of ATG13 and ULK1 and by inhibiting the activity of TFEB (transcription factor EB) family members [Citation3]. Restrained PI3K (phosphoinositide 3-kinase)-AKT/PKB (thymoma viral proto-oncogene 1)-MTOR signaling promotes autophagy and is essential for maintaining functional and long-lived HSCs endowed with capacity to both differentiate and self-renew [Citation2]. In contrast, elevated MTORC1 activity is detrimental to stemness and is linked to HSC premature aging and depletion [Citation1,Citation3].
Adult HSCs are mostly quiescent with low energy requirements [Citation4]. They rely on glycolysis [Citation5,Citation6] and fatty acid oxidation [Citation7], as opposed to downstream progenitors that use mitochondrial oxidative phosphorylation [Citation8]. Lower protein synthesis rates in adult HSCs have been linked to their state of quiescence when compared to rapidly dividing progenitors [Citation9,Citation10]. Moreover, increased protein synthesis impairs stem cell function [Citation11].
Interestingly, several amino acids (AA) have emerged as key regulators of HSC function. AA are found in much higher concentrations in the bone marrow (BM) than in peripheral blood, which itself suggests they might play an important role in hematopoiesis [Citation12,Citation13]. Valine has been shown to be critical for mouse and human HSC proliferation and for retention in the BM [Citation14]. Glutamine uptake and metabolism allow hematopoietic stem and progenitor cell (HSPC) differentiation into erythroid lineage and for de novo nucleotide synthesis [Citation15]. The availability of leucine, an essential AAs, is believed to regulate nutrient sensing pathways, such as the MTOR pathway, in HSCs [Citation2]. Essential AAs are either recycled or acquired by means of dietary intake and transported into cells through the plasma membrane-spanning transporters [Citation16]. Free intracellular AAs not only serve as a source of metabolites for protein synthesis and energy, but also directly contribute to the tight regulation of two pathways, the MTORC1 and EIF2 (eukaryotic initiation factor 2) cascades that integrate anabolic and catabolic signals. Moreover, nutrient availability regulates the integrated stress response (ISR) pathways, which are believed to promote the survival of healthy HSPCs [Citation17].
Autophagy is one of the main catabolic pathways in the cell that degrades cellular constituents specifically to be re-used as building blocks. Together with synthesis, import and proteasomal degradation, autophagy contributes to intracellular AA availability. Considerable evidence has accumulated over the last years supporting a key role for autophagy in the maintenance and function of HSCs [Citation18,Citation19]. Conditional deletion of Atg7 in all hematopoietic lineages results in significantly reduced HSC numbers, accompanied by their excessive differentiation into lineage− (Lin−), LY6A/Sca-1 (lymphocyte antigen 6 family member A)+, KIT/CD117/c-Kit (KIT proto-oncogene receptor tyrosine kinase)+ (LSK) progenitor populations, enlarging that compartment [Citation18]. Additionally, LSK progenitor cells show a significant accumulation of mitochondria, reactive oxygen species (ROS), DNA damage and hallmarks of apoptosis [Citation18]. Similarly, inducible pan-hematopoietic Atg12 deletion results in increased mitochondrial content and changes in HSC metabolism [Citation19,Citation20]. Both atg7- and atg12- deficient HSCs exhibit impaired self-renewal and regenerative potential. However, the pan-hematopoietic deletion of Atg7 and Atg12 using VavCre and Mx1Cre-driven deletion, respectively, has important limitations. Pan-hematopoietic autophagy deletion by VavCre results in peripheral cytopenia since maintenance of mature blood cell lineages is also regulated by autophagy, which restricts the interpretation of the direct impact of autophagy in HSCs [Citation18]. Mx1Cre additionally targets other non-hematopoietic cell types, and requires treatment with polyinosinic:polycytidylic acid (poly(I:C)), which can additionally affect the HSC phenotype [Citation19].
Here, we show that depleting autophagy in non-cytopenic conditions led to a cell-intrinsic decline in HSC numbers. In contrast, the expansion of the early LSK multipotent progenitor compartment was found to be mediated cell-extrinsically. We then investigated which molecular pathways in autophagy-deficient HSCs lead to their depletion. We observed that autophagy-deficient HSCs showed higher expression of several AA transporters when compared to autophagy-competent cells, resulting in increased AA uptake and culminating in enhanced MTOR activation. This led to detrimental functional consequences within HSCs, mediating increased cell size, glucose uptake, and protein synthesis. Importantly, the numbers, reconstitution potential and metabolic health of HSCs could be restored upon rapamycin treatment in vivo. Together, this suggests that increased MTOR activation is a maladaptation of autophagy-deficient HSCs resulting from excessive influx of AAs.
Results
HSC homeostasis is dependent on cell intrinsic autophagy
We first confirmed the relevance of autophagy for HSC homeostasis. Autophagy was deleted by the Mx1Cre-driven Atg5 excision following poly(I:C) injection () [Citation19] or Atg7 was deleted using the pan-hematopoietic VavCre model [Citation18]. HSCs were defined as LSK, as well as CD48− SLAMF1/CD150+ (). In both models, we observed an increase in the LSK population containing primarily multipotent progenitors, whereas HSCs were dramatically reduced (), in agreement with previous studies [Citation18,Citation19]. In these models, genetic deletion is driven by Cre expression from strong promoters affecting all hematopoietic cells (VavCre or Mx1Cre). As loss of autophagy also results in extensive depletion of most mature blood cell lineages such as erythrocytes [Citation21], platelets [Citation22], and T cells [Citation23], leading to cytopenia in the periphery, HSCs and their progenitors will be activated to replenish these lineages. Hence, it remained unclear to what degree these and previously reported reductions in HSC numbers and changes in functional parameters such as metabolism, mitochondrial health, self-renewal, differentiation, and bone marrow failure, could be a consequence of peripheral cytopenia rather than due to a direct intrinsic effect of autophagy-deficiency in HSCs. Moreover, deleting autophagy in all IFNα-responsive cells using Mx1Cre [Citation24] also affects other cells such as bone marrow stromal cells [Citation25]. To avoid cytopenia and to be able to differentiate cell-extrinsic from HSC-intrinsic roles of autophagy, we therefore evaluated the impact of autophagy loss through inducible autophagy deletion in mixed BM chimera settings, or where deletion is restricted to HSCs.
Figure 1. HSC homeostasis is dependent on cell intrinsic autophagy. (A) Experimental setup for the inducible deletion of Atg5 in hematopoietic cells (Mx1Cre atg5fl/fl). (B) Gating strategy: representative dot plots of littermate controls (WT) and Mx1Cre atg5fl/fl SLAMF1/CD150+ CD48− (HSCs) gated on Lin− LY6A/Sca-1+ KIT/cKit+ (LSK) BM cells 2 weeks after poly(I:C) treatment. (C) Representative dot plots of WT and VavCre atg7fl/fl. (D) LSK frequency within the Lin− population (left panel), HSC frequency within LSK population (middle panel) and HSC frequency within Lin− population (right panel) in Mx1Cre atg5fl/fl (n = 8 mice/group). Data are represented as mean ± SEM with Mann-Whitney test. (E) LSK frequency within the Lin− population (left panel), HSC frequency within LSK population (middle panel) and HSC frequency within Lin− population (right panel) in VavCre atg7fl/fl (n = 45 mice/group). Data are represented as mean ± SEM with Mann-Whitney test. (F) Experimental setup of the tamoxifen-inducible deletion of Atg16l1 and Tomato reporter (Ai14) expression by Fdg5Cre. (G) Atg16l1 transcript levels in Tomato+ LSKs. (H) Total number of Tomato+ HSCs (left and right hip and leg bones) three weeks post-tamoxifen treatment. Data are represented as mean ± SEM with two-tailed unpaired Student’s t test. Representative data from 1 out of 2 experiments (nWT = 3, nKO = 5). (I) Experimental setup for the generation of mixed bone marrow chimeras inducible for deletion of Atg5 (Mx1Cre atg5fl/fl). Lethally irradiated PTPRCa/CD45.1 hosts reconstituted with a 1:1 mix of BM of Mx1Cre atg5fl/fl or WT BM (PTPRCb/CD45.2) and PTPRCa/CD45.1 WT BM. After 8 weeks, Atg5 deletion was induced by poly(I:C) and BM was analyzed at indicated times points after poly(I:C) administration. (J) Frequencies of PTPRCa/CD45.1 cells and PTPRCb/CD45.2 LSKs within Lin− cells from mice reconstituted with PTPRCa/CD45.1 WT:PTPRCb/CD45.2 WT (white/gray) or with PTPRCa/CD45.1 WT:PTPRCb/CD45.2 Mx1Cre atg5fl/fl (white/black) BM. (K) Frequencies of HSCs within LSK in BM chimera. (J, K) data represented as mean ± SEM. n = 3–4 mice. Two-way ANOVA with post hoc Sidak’s test.
Firstly, we decided to take advantage of the Fgd5CreERT2 model [Citation26], which drives tamoxifen-inducible Atg16l1 deletion specifically in HSCs (Fdg5CreERT2 atg16l1fl/fl Rosa26-stop-tdTomato, here after named Fdg5CreERT2 atg16l1fl/fl) without leading to cytopenia (, Fig. S1A). tdTomato/Tomato expression was used as an indicator of Atg16l1 deletion in this model. Tomato+ LSK cells from Fdg5CreERT2 atg16l1fl/fl mice showed a 40% reduction in Atg16l1 transcripts in comparison to Tomato− cells isolated from the same animals (). We also confirmed that this reflected in lower autophagy flux (Fig. S1B). This led to a 40–50% decrease in the absolute number of Tomato+ HSCs in Fgd5CreERT2 atg16l1fl/fl mice when compared to Fgd5CreERT2Atg16L1fl/+ littermates (), suggesting that autophagy plays a cell-intrinsic role in HSCs maintenance.
We next mixed PTPRCb/CD45.2 BM cells from Mx1Cre atg5fl/fl or Mx1Cre Atg5fl/+ littermate controls with PTPRCa/CD45.1 BM cells from WT mice (1:1) to reconstitute the hematopoietic system of an irradiated host mouse (). Efficient Atg5 deletion was confirmed by qPCR (Fig. S1C). Frequency of atg5-deficient LSK cells were reduced in chimeric mice (), demonstrating that the LSK expansion observed in the non-chimeric VavCre and Mx1Cre models () is mediated by HSC-extrinsic mechanisms. Importantly, atg5-deficient HSCs were reduced by week 2 following inducible deletion of Atg5 in the chimeric setting (), reinforcing the point that HSC homeostasis relies on intact autophagy. Taken together, these findings indicate that HSCs loss driven by autophagy deletion is a cell-autonomous mechanism.
Autophagy deletion leads to increased expression of AA transporters and AA uptake
Previous studies found an increased mitochondrial mass in autophagy-deficient HSCs, concluding that mitochondria are no longer degraded by autophagy, and suggesting that this contributes to HSC loss [Citation18,Citation19]. However, HSCs rely mostly on glycolysis with little contribution from mitochondrial respiration to meet their energetic demands [Citation5,Citation7,Citation8]. Given that AA are key for HSC function and survival [Citation12], we investigated the consequences on AA supply in HSCs when autophagy is deficient. We observed that both gene and protein surface expression of the major AA transporters of glutamine, leucine, and arginine (SLC1A5/ASCT2, SLC38A1/SNAT1, SLC38A2/SNAT2) were upregulated in atg5 KO HSCs isolated from BM chimeras (, B). This result was confirmed in HSCs in which Atg7 () or Atg16l1 were deleted (Fig. S1D and Fig. S2A-B). For the latter, in contrast to our observations in atg5 KO HSCs from BM chimeras and atg7 KO cells, we found SLC26A6/PAT1 to be upregulated in HSCs (Fig. S2B). Functionally, upregulation of surface expression of AA transporters resulted in an increase in AA uptake in autophagy-deficient HSCs (Atg5Mx1-Cre or Atg7Vav-Cre deletion) as measured by the flow cytometry-based kynurenine (Kyn) assay [Citation27] (). Overall, our data suggest that autophagy loss results in upregulation of AA transporters and increased influx of AA.
Figure 2. Autophagy deletion leads to increased expression of AA transporters and AA uptake in HSCs. (A) Real-time qPCR analysis of gene expression of amino acid transporters (AATs) in sorted LSKs from Mx1Cre atg5fl/fl chimera (as in ). Data are relative to Actb (n = 3–4/group). Two-way ANOVA with post hoc Sidak’s test. (B) The geometric mean of fluorescence (gMFI) of surface AAT in Mx1Cre LSK cells from chimeric mice was normalized and expressed in fold change to corresponding WT cells (n = 6–8 mice/group). Data are represented as mean ± SEM with Mann-Whitney test. (C) gMFI of SLC1A5/ASCT2, SLC38A2/SNAT2 and SLC26A6/PAT1 in HSCs from VavCre atg7fl/fl mice is normalized and expressed in fold change to littermate controls (WT). nWT = 17–20 and nKO = 8–19 per group). Data are represented as mean ± SEM with Mann-Whitney test. (D) Representative histograms and gMFI of Kyn uptake in HSCs from Mx1Cre atg5fl/fl mice (left, nwt = 9, nKO = 7) and VavCre atg7fl/fl mice (right, n = 4). Data are represented as mean ± SEM with Mann-Whitney test. FMO, fluorescence minus one.
Increased AA uptake results in MTOR activation, cell growth, upregulation of glycolysis and protein translation
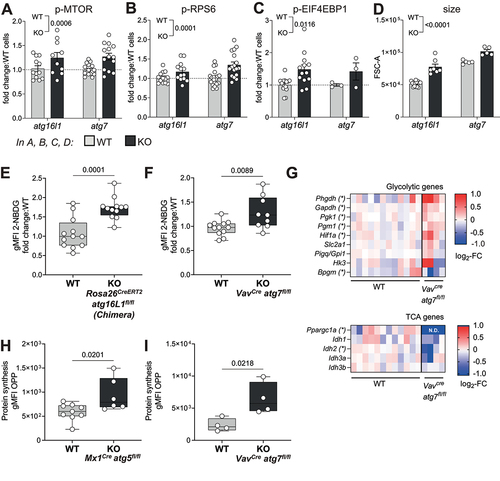
Sensing of high cellular AA content, in particular of leucine, arginine and glutamine, is known to activate the MTOR pathway [Citation28]. We found phosphorylation of MTOR, and its downstream targets EIF4EBP1 and RPS6 to be increased in autophagy-deficient HSCs, both atg7 KO or atg16l1 KO (). Because MTOR activation signals for cell growth, glycolysis and translation [Citation2], we further investigated whether these parameters were also altered in autophagy-deficient HSCs. Indeed, autophagy-deficient HSCs exhibited a significant increase in cell size compared to autophagy-sufficient HSCs (). Furthermore, uptake of glucose as measured by 2-NBDG staining (a fluorescent analogue of glucose) was elevated in autophagy-deficient HSCs (). This was corroborated by the expression profile of metabolic genes, showing increased transcript levels of classical glycolytic enzymes, but not tricarboxylic acid (TCA) cycle genes, in atg7-deficient HSCs when compared to WT counterparts (). Interestingly, enhanced MTOR activation in autophagy-deficient HSCs was also associated with an increase in protein synthesis measured by the incorporation of labeled puromycin (O-propargyl-puromycin (OPP) click assay) [Citation9] in both atg5 KO and atg7 KO mice (). We reproduced the same effects on MTOR activation, translation and Kyn uptake in a non-cytopenic context using Fgd5CreERT2 atg16l1fl/fl mice (Fig. S3A-C).
Figure 3. Increased AA uptake in HSCs results in MTOR activation, cell growth, upregulation of glycolysis and protein translation. (A-C) MTOR activity measured in HSCs from Rosa26CreERT2 atg16lfl/fl (as in fig. S2A) and VavCre atg7fl/fl mice. (A) Phosphorylation of MTOR (p-MTOR), (B) Phosphorylation of RPS6 (p-RPS6) and (C) Phosphorylation of EIF4EBP1 (p-EIF4EBP1) were assessed by flow cytometry. Fold change in gMFI compared with WT littermates is shown. n = 3–20 mice per group. Two-way ANOVA with post hoc Sidak’s test. (D) Relative HSC cell size was measured by forward scatter (FSC) by flow cytometry in Rosa26CreERT2 atg16l1fl/fl and VavCre atg7fl/fl mice. Two-way ANOVA with post hoc Sidak’s test. (E, F) Glucose uptake was assessed by fluorescent 2-NBDG using flow cytometry in HSCs from Rosa26CreERT2 atg16l1fl/fl mixed BM chimeras (E, n = 12) or VavCre atg7fl/fl mice (F, nwt = 12, nKO = 9). Data are represented as mean ± SEM with two-tailed unpaired Student’s t test. (G) Heatmap of TCA or glycolysis related genes measured by Fluidigm in HSCs from VavCre atg7fl/fl mice. Data represented as log2-fold change relative to WT. (H, I) Protein synthesis rate of HSCs was measured using the OPP-Click assay with flow cytometry in HSCs from Mx1Cre atg5fl/fl (H; (nWT = 9, nKO = 7) or VavCre atg7fl/fl (I; n = 4) mice. gMFI of OPP data are represented as mean ± SEM with two-tailed unpaired Student’s t test. WT=Cre− and/or fl/+ littermates.
As loss of autophagy correlates with higher proliferation rates in autophagy-deficient cells [Citation18], we evaluated whether any changes in HSC metabolism could also be caused by fluoracil (5FU)-induced cell cycling in cells from WT mice. We observed that 5FU treatment expectedly induced HSC proliferation (Fig. S3E) and that this was accompanied by higher expression of phosphorylated RPS6 (p-RPS6) and increased translation (Fig. S3F,G). Furthermore, HSCs from 5FU-treated animals exhibited higher expression of SLC3A2/CD98 (Fig. S3H), higher uptake of cystine (as an alternative method to measure AA uptake), but unchanged uptake of Kyn (Fig. S3 I,J). As cystine and Kyn are preferentially imported by SLC7A11/xCT and SLC7A5/LAT-1, AA transporters that dimerize with SLC3A2/CD98, this suggests that 5FU-driven proliferation selectively modulates AA uptake. We followed up analyzing whether proliferation is also increased in autophagy-deficient HSCs in a non-cytopenic context, using Fdg5CreERT2 atg16l1fl/fl mice. Similar to results previously obtained in VavCre atg7fl/fl mice, atg16l1 KO (Tomato+) were more proliferative than their WT counterparts (Tomato−, Fig. S3D), suggesting that autophagy-deficiency can induce HSC proliferation in a cell-intrinsic manner and might contribute to the observed metabolic changes. Overall, we detected robust activation of theMTOR pathway when autophagy is lost in HSCs, which led to typical downstream MTOR-mediated metabolic remodeling.
Rapamycin normalizes the metabolic status of autophagy deficient HSCs
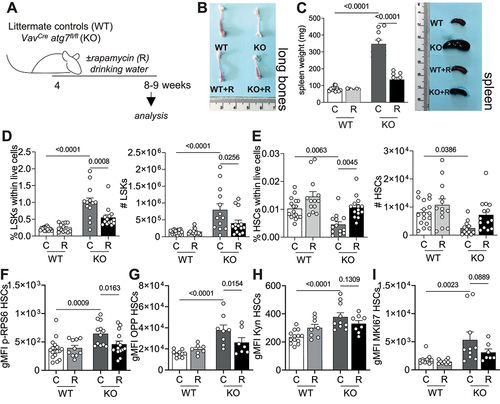
As MTOR activation and its downstream effects, in particular increased translation [Citation9], are detrimental to the long-term regeneration potential of HSCs, we sought to determine, by reversing MTOR activation with rapamycin [Citation1], whether this is a maladaptation involved in the autophagy deficiency-induced loss of HSCs. We treated VavCre atg7fl/fl mice with rapamycin [Citation1] in the drinking water from 4 to 8–9 weeks of age (). Notably, rapamycin treatment alleviated the key symptoms typically observed in atg7 KO mice [Citation18], such as anemia in long bones and splenomegaly (). Moreover, the enhanced frequencies and absolute numbers of LSKs and reduction in HSCs in autophagy-deficient mice were reversed upon rapamycin treatment (). As expected, rapamycin prevented excessive mTOR activation, measured by p-RPS6 () and translation (), in autophagy-deficient HSCs. However, uptake of AA was not significantly affected by rapamycin treatment (), suggesting that the increased uptake of AAs might be upstream of MTOR activation in these cells.
Figure 4. Rapamycin normalizes the metabolic status of autophagy deficient HSCs. (A) Experimental set-up of rapamycin (R) treatment in VavCre atg7fl/fl mice. (B) Representative images of long bones. (C) Weight and representative images of spleens. (D) LSK frequencies within live cells (left panel) and absolute numbers (right panel). (E) HSC frequencies within live (left panel) cells and absolute numbers (right panel). D-E: (nWT = 17, nWT+R = 13, nKO = 13, nKO+R = 14) (F) gMFI of p-RPS6 within HSCs (nWT = 17, nWT+R = 10, nKO = 13, nKO+R = 14). (G) gMFI of OPP within HSCs as a readout of translation (nWT = 10, nWT+R = 7, nKO = 8, nKO+R = 7). (H) gMFI of Kyn as a readout of AA uptake within HSCs (nWT = 13, nWT+R = 8, nKO = 10, nKO+R = 8). (I) gMFI of MKI67 within HSCs (nWT = 13, nWT+R = 10, nKO = 10, nKO+R = 7). D-E: pooled data from 3–5 independent experiments. Data are represented as mean ± SEM with two-way ANOVA with post hoc Tukey’s test.
We then addressed whether the beneficial effects of rapamycin could be explained by modulation of proliferation speed by assessing the proliferation profiles of HSCs from VavCre atg7fl/fl mice treated or not with rapamycin. As observed in Tomato+ HSCs from Fdg5CreERT2 atg16l1fl/fl mice and confirming previous reports, autophagy-deficient cells were more proliferative than their wild type counterparts (). However, rapamycin treatment was not able to revert this phenotype, which suggests that proliferation is not the determining cause of loss of stemness driven by exacerbated anabolism in HSCs (). Because MYC contributes to glycolysis, GLUT-1 expression, cell proliferation and has been shown to be upregulated in atg7-deficient T cells [Citation29], we also assessed the expression of Myc transcripts in LSKs from VavCre atg7fl/fl mice treated or not with rapamycin in drinking water. However, we did not observe any significant changes in Myc expression caused by autophagy-deficiency or rapamycin treatment in LSKs (Fig. S4A).
Moreover, we wanted to assess the impact of MTOR inhibition by rapamycin on the expression of AA transporters. As ATF4 (activating transcription factor 4) is known to regulate AA transporter expression [Citation30], we assessed the expression of Atf4 transcripts in LSKs from VavCre atg7fl/fl mice. Interestingly, Atf4 expression was higher in autophagy-deficient LSKs, a phenotype that was reversed upon rapamycin treatment (Fig. S4B). To evaluate whether autophagy-deficiency leads to a similar phenotype of SLC7A11/xCT and SLC7A5/LAT-1 selective modulation as observed in 5FU-driven proliferation, we determined the transcriptional expression of Slc3a2, Slc7a11 and Slc7a5 in LSKs sorted from VavCre atg7fl/fl mice (Fig. S4C). We took Slc1a5 as a positive control of autophagy regulation, as SLC1A5/ASCT2 was the AA transporter mostly upregulated in atg7-deficient cells in a similar experimental setup (). Autophagy-deficient cells showed an increased expression of all tested AA transporters. Intriguingly, MTOR inhibition by rapamycin promoted strong downregulation of transcripts for these transporters, opposed to its impact on AA uptake (Fig. S4C). These results suggest that MTOR contributes to the transcriptional regulation of expression of AA transporters in LSKs, but that this does not reflect on functional changes in AA uptake in autophagy-deficient cells.
Finally, to exclude any potential effects of rapamycin on progenitors and/or mature hematopoietic cells, we also treated mixed BM chimera with rapamycin (PTPRCb/CD45.2 Mx1Cre atg5fl/fl or Mx1Cre Atg5fl/+ BM mixed with PTPRCa/CD45.1 WT BM; ). Analysis of donor-derived PTPRCb/CD45.2 atg5 KO HSCs confirmed that inflation of the LSK compartment is not observed in a non-cytopenic setup and that rapamycin can rescue HSC loss (). Expectedly, rapamycin treatment reduced p-RPS6 levels in LSKs and HSCs () and also fully reversed translation to WT levels (). As observed in VavCre atg7fl/fl mice, rapamycin treatment had no impact on proliferation () or AA uptake (). We also performed the same experiment treating mice with rapamycin intraperitoneally (Fig. S5) and had comparable results. Corroborating our observations using a second non-cytopenic setup, rapamycin treatment also rescued the loss of HSCs in Fgd5CreERT2 atg16L1fl/fl mice (Fig. S6), highlighting the cell-intrinsic effects of rapamycin on HSC health.
Figure 5. The positive effect of MTOR inhibition on autophagy deficient HSCs is cell intrinsic. (A) Experimental setup of rapamycin treatment in Mx1Cre atg5fl/fl:WT (1:1) mixed BM chimeras. (B) Frequencies of PTPRCb/CD45.2 cells in the blood of chimeric mice 10 weeks after reconstitution, prior to poly(I:C) treatment. (C) Frequencies of PTPRCb/CD45.2 LSKs. (D) Frequencies of PTPRCb/CD45.2 HSCs. (E) MFI of p-RPS6 (PTPRCb/CD45.2: PTPRCa/CD45.1 ratio) in LSKs. (F) MFI of p-RPS6 (PTPRCb/CD45.2: PTPRCa/CD45.1 ratio) in HSCs. (G) MFI of OPP (PTPRCb/CD45.2: PTPRCa/CD45.1 ratio) in LSKs. (H) MFI of OPP (PTPRCb/CD45.2: PTPRCa/CD45.1 ratio) in HSCs. (I) MFI of MKI67 in PTPRCb/CD45.2 LSKs. (J) MFI of MKI67 in PTPRCb/CD45.2 HSCs. (K) MFI of cystine-FITC (PTPRCb/CD45.2: PTPRCa/CD45.1 ratio) in LSKs. (L) MFI of cystine-FITC (PTPRCb/CD45.2: PTPRCa/CD45.1 ratio) in HSCs. (M) MFI of Kyn in PTPRCb/CD45.2 LSKs. (N) MFI of Kyn in PTPRCb/CD45.2 HSCs. Pooled data from 2 experiments (n = 6 animals/group). Data are represented as mean ± SEM with two-way ANOVA with post hoc Tukey’s test.
Transplantation of VavCre atg7fl/fl HSCs to new hosts leads to complete loss of these cells within weeks [Citation18]. Aiming to evaluate whether rapamycin also improves hematopoietic reconstitution, we isolated BM cells from VavCreatg7fl/fl mice or wild type littermates treated or not with rapamycin in drinking water and transplanted them into new hosts (). To ensure the survival of the mice and that any outcomes would be cell-intrinsic, we performed this experiment in a chimeric setting. We found that rapamycin-treatment in autophagy-deficient HSCs led to an improved peripheral hematopoietic reconstitution (). Moreover, rapamycin-treated autophagy-deficient HSCs remained present at comparable frequencies to WT HSCs in the bone marrow (). These results suggest that rapamycin treatment improves metabolic health, stemness and multilineage reconstitution capacity of autophagy-deficient HSCs. Thus, we propose that the enhanced MTOR activation observed in autophagy-deficient HSCs is maladaptive and secondary to the loss of autophagy, thereby contributing to the exhaustion of autophagy-deficient HSCs.
Figure 6. Rapamycin has a positive impact on autophagy-deficient HSC function upon transplantation. (A) Experimental setup. (B) Ratios of PTPRCb/CD45.2: PTPRCa/CD45.1 WT cells prior to BM transplantation. (C) Contribution of WT (PTPRCa/CD45.1) and autophagy deficient VavCre atg7fl/fl or WT (PTPRCb/CD45.2) cells to the myeloid (ITGAM/CD11b+), B cell (CD19+) and T cell (TCRb+) compartments in recipient mice (n = 8–10/animals per group). (D) Frequencies of PTPRCb/CD45.2 LSKs and HSCs in the BM of recipient mice 12 weeks after transplantation (n = 3–5 animals/group). Data are represented as mean ± SEM with two-tailed unpaired Student’s t test.
Discussion
Previous studies of mice with autophagy-deficient hematopoiesis [Citation18,Citation19] could not establish to what degree the observed HSC loss and deficiencies were due to HSC-intrinsic or -extrinsic mechanisms. Here, using mice with bone marrow chimeric for normal and autophagy-deficient hematopoiesis, as well as through HSC-specific deletion of critical autophagy components, we are the first to definitely demonstrate that HSC homeostasis depends on HSC-intrinsic autophagy. Moreover, this study provides novel mechanistic insights into the intrinsic role of autophagy in HSCs. Until now, most studies pursued the hypothesis that autophagy’s role is to degrade unwanted material in stem cells, in particular mitochondria. While this makes sense as stem cells are typically quiescent cells, which therefore cannot dilute defunct material to daughter cells [Citation18,Citation19,Citation31], we here provide experimental evidence that autophagy also has an important role in regulating provision of macromolecules to stem cells. We showed that upon loss of autophagy, HSCs increased the expression of AA transporters on the cell surface, resulting in an excessive influx of AA into the cell. This was followed by MTOR activation, leading to increased cell size, glucose uptake, protein synthesis and, eventually, HSC loss. Autophagy-deficient HSCs could be rescued with rapamycin indicating that the observed increased MTOR activity in autophagy-deficient HSCs is a maladaptation to autophagy loss.
We observed increased expression of different amino acid transporters in autophagy-deficient LSKs (using different Atg deletions and Cre systems): SLC1A5/ASCT2, SLC38A1/SNAT1, SLC38A2/SNAT2, SLC7A11/xCT and SLC7A5/LAT-1. These amino acid transporters are antiporters and symporters of neutral and/or anionic amino acids across the plasma membrane. In atg16L1 KO cells, we also observed increased expression of SLC26A6/PAT1, which localizes to the lysosomes. Taken together this suggests that autophagy loss has a broad and nonselective impact on AA transporter expression, resulting in higher AA uptake (measured by both Kyn and cystine uptake). We reason that higher MTOR activation observed in autophagy-deficient HSCs, when compared to autophagy-competent cells, is a consequence of increased AA transporter expression and AA uptake. This is in line with several studies showing that influx of leucine, arginine or glutamine directly stimulates MTORC1 activity [Citation32–34]. Conversely and in support of this, in slc1a5-/-/asct2−/− leukemic cells, MTORC1 is inhibited as evidenced by decreased levels of p-RPS6 and 2-NBDG uptake [Citation35]. Similarly, in human hepatoma cells, SLC1A5/ASCT2 silencing inhibits MTORC1, which in turn signals to the translational machinery [Citation36]. Together with our study, where we observed that MTOR inhibition leads to decreased expressions of transcripts for AA transporters, this establishes a firm link between AA transporter expression and MTOR function. Our results also provide further evidence of AA transporter expression and uptake being upstream of MTOR activation, as autophagy-deficient cells can have MTOR activation inhibited by rapamycin treatment but exhibit unchanged levels of Kyn and cystine uptake.
Our data suggests that autophagy depletion leads to cell surface AA transporter upregulation and several mechanisms can contribute to this phenotype. Firstly, the increased glucose uptake could also be a MTOR-independent phenomenon, but rather a direct consequence of mitophagy loss to compensate for diminished ATP generation by mitochondrial respiration, as found in several hematopoietic cells [Citation37–39]. This would subsequently result in increased levels of intracellular lactate, which can stimulate SLC1A5/ASCT2 expression via HIF1A (hypoxia inducible factor 1 subunit alpha) and MYC/c-MYC [Citation40]. However, we did not observe significant changes in Myc expression (Fig. S4A). Secondly, a possible signaling mechanism was revealed in a cancer cell line in which AA transporter gene expression and AA uptake increased in autophagy-deficient cancer cells under conditions of glutamine deprivation [Citation30]. It involved the interaction between SIRT6 (sirtuin 6) and ATF4, a transcription factor that controls AA transporter expression. We observed higher expression of Atf4 transcripts in autophagy-deficient LSKs, a phenotype that was reversed upon rapamycin treatment (Fig. S4B). This suggests that MTORC1 may regulate transcriptional levels of AA transporters also via ATF4. In contrast to our findings in HSCs, however, in cancer lines the AA transporter upregulation is beneficial and feeding glutamine to the cells rescues their viability [Citation30]. We predict that these contrasting results might be explained by the fact that highly proliferative cancer cells thrive on activated MTORC1 whereas HSCs do not. Thirdly and most importantly based on our results, autophagy might play a role in AA transporter degradation. Indeed, an autophagic route for SLC38A2/SNAT2 degradation has recently been described [Citation41]. We found that MTOR inhibition by rapamycin treatment has an impact on the transcriptional regulation of AA transporters, but that this does not reflect in less AA uptake (measured by both Kyn and cystine import). These discrepancies between transcriptional and functional modulation of AA uptake support the hypothesis that autophagy plays a role in AA transporters’ degradation. Although MTOR inhibition resulted in lower transcripts for AA transporters and Atf4, a positive regulator of their expression, there was still a continuous influx of amino acids. In untreated autophagy-deficient cells, this culminated in exacerbated MTOR activation and translation. While upon rapamycin treatment the influx of AA was not changed, the detrimental effects downstream of MTOR on HSC stemness were neutralized, resulting in better HSC function.
In many tissues, such as white adipose tissue or muscle, the phenotypes of mice with hyperactive MTORC1 share several features with those of defective autophagy. These phenotypes can be largely rescued with rapamycin [Citation28]. This has been explained by the fact that inhibiting MTORC1 with rapamycin induces the early steps of autophagy. Similarly, a recent report revealed that MTOR-mediated regulation of HSC cell size is detrimental to HSC fitness and reconstitution potential, which can similarly be rescued by rapamycin treatment [Citation42]. Here we show that rapamycin reversed these phenotypes even in autophagy-deficient HSCs. Previous work suggested that the bidirectional transport of AAs, especially L-glutamine efflux in exchange for leucine, regulates MTOR, translation and autophagy [Citation35]. This is in line with our hypothesis that upregulation of AA transporters and AA uptake lead to MTOR activation.
Interestingly, in regulatory T (Treg) cells, another hematopoietic cell type in which autophagy plays a central role, autophagy deficiency also upregulates MTORC1, MYC and glycolysis, which contribute to defective Treg function. Exposure to rapamycin largely restores the expression of the Treg transcription factor FOXP3 in atg7-deficient Treg cells [Citation29]. Therefore, autophagy maintains Treg cell stability via limiting MTOR activity.
Evidence is increasing that impaired autophagic flux contributes to pathologies. For example, with age, autophagy levels decrease in a proportion of HSCs [Citation19] and autophagy prevents aging in immune cells [Citation43]. Interestingly, rapamycin improves HSC function in old mice [Citation1]. Patients with a germline mutation of Atg7 (and diminished autophagy) have recently been described but have not been analyzed for their HSC function and blood lineages [Citation44]. Other patients with mutations in autophagy-related genes (e.g LRBA, TTP2 and EPG5 in Vici syndrome) show variable immune system abnormalities [Citation45–47]. Our data suggest the tantalizing possibility that low dose rapamycin might improve immune deficiencies and pathological conditions in these patients.
Materials and methods
Mouse models
All animal work was reviewed and approved by Oxford Ethical committee and the UK Home office under the project licenses PPL30/3388 and P01275425. VavCre atg7fl/fl [Citation21], Mx1Cre atg5fl/fl [Citation20], Rosa26ERT2Cre atg16L1fl/fl Rosa26-stop-tdTomato (new model), Fgd5CreERT2atg16L1fl/fl Rosa26-stop-tdTomato [Citation26], and B6.SJL/J PTPRCa/CD45.1 mice were bred in-house and housed on a 12 h dark:light cycle and mouse were fed ad libitum, under specific pathogen-free (SPF) conditions. Littermate controls were either heterozygous for the floxed gene or Cre negative, as no obvious differences were found between these. For all inducible models, controls were also injected with Tamoxifen (Sigma-Aldrich, T5648-1 G) or poly(I:C) (Sigma-Aldrich, P9582-5 MG) respectively. For all experiments and phenotypic analyses, data from male and female mice were pooled as no obvious difference was found between sexes. Tamoxifen-induced deletion of Atg genes in Rosa26ERT2Cre atg16L1fl/fl and Fgd5CreERT2atg16L1fl/fl mice was performed from 8–10 weeks of age by oral gavage of tamoxifen (5 mg/mouse/day for 5 consecutive days). Mx1Cre atg5fl/fl mice were injected intraperitoneally every other day for 1 week with 250 μg poly(I:C) in 250 μL saline or 250 μL phosphate-buffered saline (PBS; Sigma-Aldrich, D8537) to induce deletion of Atg5. Mice were monitored over the period of indicated days or weeks and peripheral blood and BM cells were collected for analysis. Rapamycin (Alpha-Aesar, J62473.MC) treatment of Mx1Cre atg5fl/fl: PTPRCa/CD45.1 WT chimeras was intraperitoneally as previously described [Citation48]. VavCre atg7fl/fl rapamycin treatment was done from 4 weeks of age by diluting it into drinking water (50 ug/ml).
Bone marrow chimera
Bone marrow (BM) cells were collected by crushing the femur, tibia and hips of the donor mice (PTPRCa/CD45.1 or PTPRCb/CD45.2). The recipient B6.SJL/J PTPRCa/CD45.1 mice were lethally irradiated with a total of 11 Gy in two equal doses 4 h apart. 2 to 24 h after the second irradiation a total of 2 × 10⁶ BM cells (ratio of 1:1 or 1:10 of PTPRCa/CD45.1 WT and PTPRCb/CD45.2 genetically modified or WT cells) in a total volume of 200 μL PBS, were injected intravenously into recipient mice. Peripheral blood analyses were conducted post-transplantation to check the BM reconstitution.
Fluidigm gene expression analysis
HSCs from littermate controls or VavCre atg7fl/fl were flow-sorted (100 cells) into OneStep lysis buffer. RNA was reverse transcribed and cDNA was pre-amplified using the CellsDirect OneStep q-RT kit (Invitrogen, 10043982). The selected genes were amplified and analyzed for expression using a dynamic 48 × 48array (Biomark Fluidigm, BMK-M-48.48GT) as previously described [Citation49]. Data were analyzed using the 2-DDCt method, and all results were normalized to Actb, B2m and Hprt expression after which the best housekeeping gene was selected for further analysis. Biological replicates represent individual mice in each experiment.
Translation and amino acid uptake assessment
Protein synthesis rate was measured using the Click-iT Plus OPP Protein Synthesis Assay (Thermo Fisher, C10456) according to manufacturer’s protocol. Geometric mean fluorescence intensity (compared to vehicle) was used as an indicator of the relative translation rate. AA uptake in autophagy-deficient HSCs was measured by the flow cytometry-based kynurenine (Kyn) assay as previously described [Citation27], and cystine uptake was assessed using BioTracker Cystine-FITC Live Cell Dye (Sigma-Aldrich, SCT047).
RT qPCR
RNA was isolated using the RNeasy Micro kit (Qiagen, 74004) and reverse transcribed using the High Capacity cDNA Reverse Transcription kit (Applied Biosystems, 4368814). qRT-PCR was performed using Taqman Gene Expression Master Mix (Applied Biosystems, 4369016) on a ViiA 7 instrument (Thermo Fisher). Data were analyzed using the 2−ΔCt method, and all results were normalized to Actb.
Flow cytometry
BM cells were washed with ice-cold PBS. Cells were stained with fixable Live/Dead staining (Invitrogen, L34993 or L34957), FcR block (Biolegend, 101302), and surface marker antibodies at 4°C for 20–30 min. Antibodies used were: anti-PTPRC/B220 APC, clone RA36B2 (Biolegend, 103212), anti-ITGAM/CD11b BV785, clone M1/70 (Biolegend, 101243), anti-CD19 APC, clone 1D3 (eBioscience, 25-0193-82), anti-SLAMF1/CD150 BV785, clone TC15-12F12.2 (Biolegend, 115937), anti-CD4 BV605, clone RM4–5 (Biolegend, 100547), anti-PTPRCa/CD45.1 FITC, clone A20 (eBioscience, 11-0453-82), anti-PTPRCa/CD45.1 PerCPCy5.5, clone A20 (Biolegend, 110728), anti-PTPRCb/CD45.2 BV605, clone 104 (Biolegend, 109841), anti-PTPRCb/CD45.2 BV711, clone 104 (Biolegend, 109847), anti-BCM1/CD48 AF700, clone HM48–1 (Biolegend, 103426), anti-BCM1/CD48 APC, clone HM48–1 (Biolegend, 103411), α-CD8 AF700, clone 53–6.7 (Biolegend, 100730), anti-SLC3A2/CD98 AF647, clone 4F2 (Biolegend, 128210), anti-KIT/cKIT/CD117 PE-Cy7, clone 2B8 (eBioscience, 25-1171-82), anti-Lineage cocktail (Biolegend, 133303), anti-LY6C BV421, clone HK1.4 (Biolegend, 128031), anti-LY6G PE-Cy7, clone 1A8 (Biolegend, 127618), anti-LY6A/Sca-1 FITC, clone E13–161.7 (Biolegend, 122506), anti-LY6A/Sca-1 PerCP-Cy5.5, clone D7 (Invitrogen, 45-5981-82), anti-LY6A/Sca-1 PB, clone E13–161.7 (Biolegend, 122520), anti-Siglec-F PE, clone S17007L (Biolegend, 155506), anti-SLC1A5/ASCT2 (Cell Signaling Technology, 5345S), anti-SLC26A6/PAT1 (Novus Biologicals, NBP2–93440), anti-SLC38A1/SNAT1 (Novus Biologicals, NBP2–13336), anti-SLC38A2/SNAT2 (Novus Biologicals, NBP1–88872), anti-TCRb PerCPCy5.5, clone H57–597 (eBioscience, 17-5961-82). When staining included unconjugated antibodies, this was followed by incubation with goat anti-rabbit conjugated to PE (Invitrogen, A10542) at 4°C for 20–30 min. Glucose uptake was measured by incubating cells for 30 min measurements, cells were incubated in media containing 50 mg/ml 2-NBDG for 20 min at 37°C after surface antibody staining. When intracellular proteins were also analyzed, cells were fixed with BD™ Phosflow Fix Buffer (BD Biosciences, 558049), permeabilized with Permeabilization Buffer (Invitrogen, 00-8333-56) or BD™ Phosphow Perm/Wash I (BD Biosciences, 557885), followed by antibody staining at room temperature for 1 h or at 4°C overnight. Antibodies used were: anti-MKI67 FITC, clone SOIA15 (Invitrogen, 11-5698-82), anti-phospho-EIF4EBP1 PE, clone V3NTY24 (Invitrogen, 12-9107-42), anti-phospho-MTOR eF660, clone MRRBY (Invitrogen, 50-9718-42), anti-phospho-RPS6 eF450, clone cupk43k (Invitrogen, 48-9007-41), anti-phospho-RPS6 APC, clone cupk43k (Invitrogen, 17-9007-42). After washing with PBS, cells were acquired with four-laser LSR or Fortessa X-20 (BD Biosciences) and analyzed using FlowJo 10.8.0/10.8.1.
Statistical analysis
To test if data point values were in a Gaussian distribution, a normality test was performed before applying parametric or non-parametric statistical analysis. When two groups were compared, unpaired Student’s t test or Mann-Whitney test were applied. When comparisons were done across more than two experimental groups, analysis were performed using Two-Way ANOVA with post hoc Tukey’s test or Sidak multiple testing correction. P values were considered significant when < 0.05, and exact P values are provided in the figures. All analyses were done using GraphPad Prism 9 software. Identical or similar experiments were performed at least twice. If not indicated, data are represented pooled from at least two experiments.
Supplemental Material
Download MS Word (562.1 KB)Acknowledgements
We thank Patricia Cotta Moreira, Daniel Andrew and Mino Medghalchi (Kennedy Institute of Rheumatology animal facility) for their support. This work was funded by grants from the Wellcome Trust (Investigator award 103830/Z/14/Z and 220784/Z/20/Z to A.K.S., 220452/Z/20/Z to M.B. and PhD studentship award 203803/Z16/Z to F.C.R), and the European Union’s Horizon 2020 (under the Marie Sklodowska-Curie grant agreement number 893676 to M.B.).
Supplementary data
Supplemental data for this article can be accessed online at https://doi.org/10.1080/15548627.2023.2247310
Disclosure statement
No potential conflict of interest was reported by the author(s).
Additional information
Funding
References
- Chen C, Liu Y, Liu Y, et al. mTOR regulation and therapeutic rejuvenation of aging hematopoietic stem cells. Sci Signal. 2009;2:ra75. doi: 10.1126/scisignal.2000559
- Saxton RA, Sabatini DM. mTOR signaling in growth, metabolism, and disease. Cell. 2017;168(6):960–976. doi: 10.1016/j.cell.2017.02.004
- Meng D, Frank AR, Jewell JL. mTOR signaling in stem and progenitor cells. Development. 2018;145(1). doi: 10.1242/dev.152595
- Wilson A, Laurenti E, Oser G, et al. Hematopoietic stem cells reversibly switch from dormancy to self-renewal during homeostasis and repair. Cell. 2008;135(6):1118–1129. doi: 10.1016/j.cell.2008.10.048
- Simsek T, Kocabas F, Zheng J, et al. The distinct metabolic profile of hematopoietic stem cells reflects their location in a hypoxic niche. Cell Stem Cell. 2010;7(3):380–390. doi: 10.1016/j.stem.2010.07.011
- Takubo K, Nagamatsu G, Kobayashi CI, et al. Regulation of glycolysis by Pdk functions as a metabolic checkpoint for cell cycle quiescence in hematopoietic stem cells. Cell Stem Cell. 2013;12(1):49–61. doi: 10.1016/j.stem.2012.10.011
- Ito K, Carracedo A, Weiss D, et al. A PML–PPAR-δ pathway for fatty acid oxidation regulates hematopoietic stem cell maintenance. Nature Med. 2012;18(9):1350–1358. doi: 10.1038/nm.2882
- Vannini N, Girotra M, Naveiras O, et al. Specification of haematopoietic stem cell fate via modulation of mitochondrial activity. Nat Commun. 2016;7(1):13125. doi: 10.1038/ncomms13125
- Signer RA, Magee JA, Salic A, et al. Haematopoietic stem cells require a highly regulated protein synthesis rate. Nature. 2014;509(7498):49–54. doi: 10.1038/nature13035
- Buszczak M, Signer RJ, Morrison SJ. Cellular differences in protein synthesis regulate tissue homeostasis. Cell. 2014;159(2):242–251. doi: 10.1016/j.cell.2014.09.016
- Chua BA, Van Der Werf I, Jamieson C, et al. Post-transcriptional regulation of homeostatic, stressed, and malignant stem cells. Cell Stem Cell. 2020;26:138–159. doi: 10.1016/j.stem.2020.01.005
- Girotra M, Monnard C, Konz T, et al. Mineral and amino acid profiling of different hematopoietic populations from the mouse bone marrow. Int J Mol Sci. 2020;21(17):6444. doi: 10.3390/ijms21176444
- Richter FC, Obba S, Simon AK. Local exchange of metabolites shapes immunity. Immunology. 2018;155(3):309–319. doi: 10.1111/imm.12978
- Taya Y, Ota Y, Wilkinson AC, et al. Depleting dietary valine permits nonmyeloablative mouse hematopoietic stem cell transplantation. Science. 2016;354:1152–1155. doi: 10.1126/science.aag3145
- Oburoglu L, Tardito S, Fritz V, et al. Glucose and glutamine metabolism regulate human hematopoietic stem cell lineage specification. Cell Stem Cell. 2014;15(2):169–184. doi: 10.1016/j.stem.2014.06.002
- Poncet N, Taylor PM. The role of amino acid transporters in nutrition. Curr Opin Clin Nutr Metab Care. 2013;16(1):57–65. doi: 10.1097/MCO.0b013e32835a885c
- van Galen P, Kreso A, Mbong N, et al. The unfolded protein response governs integrity of the haematopoietic stem-cell pool during stress. Nature. 2014;510(7504):268–272. doi: 10.1038/nature13228
- Mortensen M, Soilleux EJ, Djordjevic G, et al. The autophagy protein Atg7 is essential for hematopoietic stem cell maintenance. J Exp Med. 2011;208:455–467. doi: 10.1084/jem.20101145
- Ho TT, Warr MR, Adelman ER, et al. Autophagy maintains the metabolism and function of young and old stem cells. Nature. 2017;543:205–210. doi: 10.1038/nature21388
- Warr MR, Binnewies M, Flach J, et al. FOXO3A directs a protective autophagy program in haematopoietic stem cells. Nature. 2013;494:323–327. doi: 10.1038/nature11895
- Mortensen M, Ferguson DJ, Edelmann M, et al. Loss of autophagy in erythroid cells leads to defective removal of mitochondria and severe anemia in vivo. Proc Natl Acad Sci U S A. 2010;107:832–837. doi: 10.1073/pnas.0913170107
- Feng W, Chang C, Luo D, et al. Dissection of autophagy in human platelets. Autophagy. 2014;10(4):642–651. doi: 10.4161/auto.27832
- Pua HH, Dzhagalov I, Chuck M, et al. A critical role for the autophagy gene Atg5 in T cell survival and proliferation. J Exp Med. 2007;204:25–31. doi: 10.1084/jem.20061303
- Kuhn R, Schwenk F, Aguet M, et al. Inducible gene targeting in mice. Science. 1995;269:1427–1429. doi: 10.1126/science.7660125
- Joseph C, Quach JM, Walkley CR, et al. Deciphering hematopoietic stem cells in their niches: a critical appraisal of genetic models, lineage tracing, and imaging strategies. Cell Stem Cell. 2013;13(5):520–533. doi: 10.1016/j.stem.2013.10.010
- Gazit R, Mandal PK, Ebina W, et al. Fgd5 identifies hematopoietic stem cells in the murine bone marrow. J Exp Med. 2014;211:1315–1331. doi: 10.1084/jem.20130428
- Sinclair LV, Neyens D, Ramsay G, et al. Single cell analysis of kynurenine and System L amino acid transport in T cells. Nat Commun. 2018;9(1):1981. doi: 10.1038/s41467-018-04366-7
- Deleyto-Seldas N, Efeyan A. The mTOR-Autophagy axis and the control of metabolism. Front Cell Dev Biol. 2021;9:655731. doi: 10.3389/fcell.2021.655731
- Wei J, Long L, Yang K, et al. Autophagy enforces functional integrity of regulatory T cells by coupling environmental cues and metabolic homeostasis. Nat Immunol. 2016;17(3):277–285. doi: 10.1038/ni.3365
- Zhang N, Yang X, Yuan F, et al. Increased amino acid uptake Supports autophagy-deficient cell survival upon glutamine deprivation. Cell Rep. 2018;23:3006–3020. doi: 10.1016/j.celrep.2018.05.006
- Guan JL, Simon AK, Prescott M, et al. Autophagy in stem cells. Autophagy. 2013;9(6):830–849. doi: 10.4161/auto.24132
- Jewell JL, Kim YC, Russell RC, et al. Metabolism. Differential regulation of mTORC1 by leucine and glutamine. Science. 2015;347:194–198. doi: 10.1126/science.1259472
- Chantranupong L, Scaria SM, Saxton RA, et al. The CASTOR proteins are arginine sensors for the mTORC1 pathway. Cell. 2016;165(1):153–164. doi: 10.1016/j.cell.2016.02.035
- Chen J, Ou Y, Luo R, et al. SAR1B senses leucine levels to regulate mTORC1 signalling. Nature. 2021;596(7871):281–284. doi: 10.1038/s41586-021-03768-w
- Nicklin P, Bergman P, Zhang B, et al. Bidirectional transport of amino acids regulates mTOR and autophagy. Cell. 2009;136(3):521–534. doi: 10.1016/j.cell.2008.11.044
- Fuchs BC, Finger RE, Onan MC, et al. ASCT2 silencing regulates mammalian target-of-rapamycin growth and survival signaling in human hepatoma cells. Am J Physiol Cell Physiol. 2007;293:C55–63. doi: 10.1152/ajpcell.00330.2006
- Stranks AJ, Hansen AL, Panse I, et al. Autophagy controls acquisition of aging features in macrophages. J Innate Immun. 2015;7(4):375–391. doi: 10.1159/000370112
- Riffelmacher T, Clarke A, Richter FC, et al. Autophagy-dependent generation of Free fatty acids is critical for normal neutrophil differentiation. Immunity. 2017;47(3):466–480 e465. doi: 10.1016/j.immuni.2017.08.005
- Puleston DJ, Zhang H, Powell TJ, et al. Autophagy is a critical regulator of memory CD8(+) T cell formation. Elife. 2014;3: doi: 10.7554/eLife.03706
- Perez-Escuredo J, Dadhich RK, Dhup S, et al. Lactate promotes glutamine uptake and metabolism in oxidative cancer cells. Cell Cycle. 2016;15(1):72–83. doi: 10.1080/15384101.2015.1120930
- Morotti M, Zois CE, El-Ansari R, et al. Increased expression of glutamine transporter SNAT2/SLC38A2 promotes glutamine dependence and oxidative stress resistance, and is associated with worse prognosis in triple-negative breast cancer. Br J Cancer. 2021;124:494–505. doi: 10.1038/s41416-020-01113-y
- Lengefeld J, Cheng CW, Maretich P, et al. Cell size is a determinant of stem cell potential during aging. Sci Adv. 2021;7:eabk0271. doi: 10.1126/sciadv.abk0271
- Zhang H, Puleston DJ, Simon AK. Autophagy and immune senescence. Trends Mol Med. 2016;22:671–686. doi: 10.1016/j.molmed.2016.06.001
- Collier JJ, Guissart C, Olahova M, et al. Developmental consequences of defective ATG7-mediated autophagy in humans. N Engl J Med. 2021;384(25):2406–2417. doi: 10.1056/NEJMoa1915722
- Lu W, Zhang Y, McDonald DO, et al. Dual proteolytic pathways govern glycolysis and immune competence. Cell. 2014;159(7):1578–1590. doi: 10.1016/j.cell.2014.12.001
- Lopez-Herrera G, Tampella G, Pan-Hammarstrom Q, et al. Deleterious mutations in LRBA are associated with a syndrome of immune deficiency and autoimmunity. Am J Hum Genet. 2012;90:986–1001. doi: 10.1016/j.ajhg.2012.04.015
- Finocchi A, Angelino G, Cantarutti N, et al. Immunodeficiency in Vici syndrome: a heterogeneous phenotype. Am J Med Genet A. 2012;158A:434–439. doi: 10.1002/ajmg.a.34244
- Bitto A, Ito TK, Pineda VV, et al. Transient rapamycin treatment can increase lifespan and healthspan in middle-aged mice. Elife. 2016;5. doi: 10.7554/eLife.16351.
- Tehranchi R, Woll PS, Anderson K, et al. Persistent malignant stem cells in del(5q) myelodysplasia in remission. N Engl J Med. 2010;363(11):1025–1037. doi: 10.1056/NEJMoa0912228