
ABSTRACT
Bevacizumab plays an important role in the first and second line treatment for metastatic colorectal cancer (CRC). And induction of hypoxia and the tumors response to it plays an important role in determining the efficacy of antiangiogenic therapy while the connection between them remains unclear. Here, we found that lactate accumulated in the tumor environment of CRC and acted as substrates for histone lactylation, and this process was further induced by cellular enhanced glycolysis in hypoxia. We determined that CRC patients resistant to bevacizumab treatment presented with elevated levels of histone lactylation and inhibition of histone lactylation efficiently suppressed CRC tumorigenesis, progression and survival in hypoxia. Histone lactylation promoted the transcription of RUBCNL/Pacer, facilitating autophagosome maturation through interacting with BECN1 (beclin 1) and mediating the recruitment and function of the class III phosphatidylinositol 3-kinase complex, which had a crucial role in hypoxic cancer cells proliferation and survival. Moreover, combining inhibition of histone lactylation and macroautophagy/autophagy with bevacizumab treatment demonstrated remarkable treatment efficacy in bevacizumab-resistance patients-derived pre-clinical models. These findings delivered a new exploration and important supplement of metabolic reprogramming-epigenetic regulation, and provided a new strategy for improving clinical efficacy of bevacizumab in CRC by inhibition of histone lactylation.
Abbreviations: 2-DG: 2-deoxy-D-glucose; BECN1: beclin 1; CQ: chloroquine; CRC: colorectal cancer; DMOG: dimethyloxalylglycine; H3K18la: histone H3 lysine 18 lactylation; MAP1LC3B/LC3B: microtubule associated protein 1 light chain 3 beta; Nala: sodium lactate; PDO: patient-derived orgnoid; PDX: patient-derived xenograft; RUBCNL/Pacer: rubicon like autophagy enhancer; SQSTM1/p62: sequestosome 1.
Introduction
Colorectal cancer (CRC) is the third most common malignancy worldwide, accounting for nearly 8.5% of all cancer deaths [Citation1]. Recurrence and distant metastasis are still the leading causes of treatment failure and death among CRC patients [Citation2,Citation3]. At diagnosis, 20%-30% of patients suffer from synchronous hepatic metastases and 50%-75% of all patients with CRC develop liver metastases [Citation4,Citation5]. An estimated 70–80% of cases with late-stage CRC are defined as initially unresectable, and their 5-year overall survival (OS) rate is less than 10% [Citation6–9].
Currently, the application of doublet or triplet chemotherapy regimens with targeted therapies including antiangiogenic therapy has increased response rates to 60%-70%, increasing the survival of patients with metastatic CRC [Citation10–12]. Bevacizumab, specifically targeting VEGFA (vascular endothelial growth factor A) to inhibit VEGF (vascular endothelial growth factor)-VEGFR (vascular endothelial growth factor receptor) signaling [Citation13], plays an essential role in the first-line and second-line treatment for metastatic CRC [Citation14,Citation15]. Despite the improvement in clinical outcomes for metastatic CRC as a result of antiangiogenic therapy, the majority of patients manifest intrinsic or acquired resistance to treatment and the overall benefit is limited eventually [Citation16,Citation17]. Therefore, it is critical to explore the mechanisms that underlie the resistance of CRC cells to antiangiogenic therapy, which may improve the prognosis of metastatic CRC.
In solid tumors, intratumoral hypoxic regions caused by antiangiogenic therapy were found to be implicated in treatment resistance [Citation18,Citation19]. Hypoxia induces metabolic alterations of cancer cells as an adaptive response to nutrient deprivation, which influences susceptibility to hypoxia induced cell death during antiangiogenic therapy [Citation20]. Enhanced glycolysis, One of the most critical metabolic alterations during hypoxia, resulting in augmented lactogenesis in cancer, is associated with diverse cellular processes [Citation21]. Lactate, an abundant oncometabolite in the tumor environment generated during Warburg effect, triggers histone lysine lactylation as a new epigenetic modification which directly stimulates gene transcription from chromatin [Citation22]. In recent years, histone lactylation, especially histone H3 lysine 18 lactylation (H3K18la), has been reported to regulate multitudinous biological processes such as oncogenesis [Citation23], progression [Citation24], tumor immune escape [Citation25] and cancer cellular metabolism reprogramming [Citation26].
In this study, we revealed that, induced by cellular enhanced glycolysis and consequent lactogenesis, histone lactylation levels were upregulated in CRC patients resistant to bevacizumab treatment. Inhibition of histone lactylation efficiently suppressed CRC tumorigenesis, progression and survival in hypoxia. Mechanistically, histone lactylation promoted the transcription of RUBCNL/Pacer (rubicon like autophagy enhancer), which was recognized as a promoter of autophagosome maturation through interaction with BECN1/Beclin 1, one of the main components of this pathway. We revealed that inhibition of histone lactylation enhanced the sensitivity of CRC cells to bevacizumab treatment in cell-based xenografts, patient-derived xenografts (PDXs) and patient-derived orgnoids (PDOs) models. Thus, our study suggested that inhibition of histone lactylation may be a novel strategy for improving clinical efficacy of bevacizumab in CRC.
Results
Colorectal cancer (CRC) resistance to bevacizumab treatment exhibited increased lactylation levels which was associated with poor survival in CRC patients
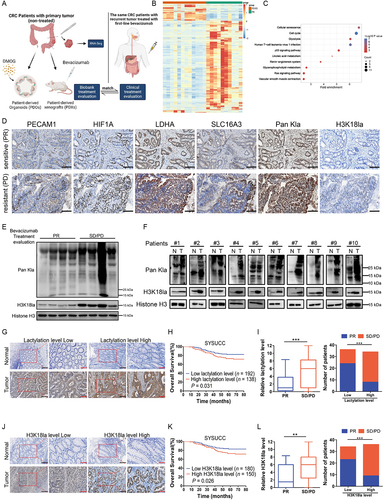
In order to explore the mechanisms that underlie the resistance of CRC cells to bevacizumab treatment, we collected CRC tissue specimens from fresh primary surgical specimens without any systemic treatment in the cohort previously described [Citation27] and built up a biobank containing paraffin-embedded tumor section, extracted RNA, PDXs, PDOs and etc. (). Among them, patients with recurrent or metastatic tumors treated with first-line bevacizumab treatment whose clinical therapeutic response matched with the treatment evaluation in biobank (PDXs treated with bevacizumab, and PDOs treated with Dimethyloxalylglycine (DMOG) [Citation28,Citation29], an inhibitor of HIF prolylhydroxylase stabilizing and accumulating HIF1A/HIF-1α (hypoxia inducible factor 1 subunit alpha) protein in the nucleus under conditions of normoxia, which could mimic hypoxic environment caused by antiangiogenic therapy) were included (Table S1) and transcriptome sequencing was performed using pre-retained RNA (). Kyoto Encyclopedia of Genes and Genomes (KEGG) analysis of upregulated genes of bevacizumab treated stable disease (SD)/progressive disease (PD) versus partial response (PR) revealed a significant enrichment in glycolysis signaling (). In the TCGA database, the genes associated with lactate production and secretion are highly expressed and positively correlated with VEGFA expression in CRC (Figure S1A-B), which suggested that bevacizumab resistance may be related to enhanced glycolysis and follow-by lactogenesis of cancer cells. To further investigate, enhanced glycolysis and lactogenesis were also found in paraffin-embedded tumor section derived from PDXs with bevacizumab resistance (, Figure S1C-D). Interestingly, the levels of lactylation and H3K18la, which were recognized as oncogenesis markers, obviously increased in patients with bevacizumab treated SD/PD compared with PR (, Figure S1C-D). And the increased levels of lactylation and H3K18la were further reflected in fresh surgical tumor tissues compared with the matched adjacent normal tissues from 10 random stage I-III CRC patients (). We examined the levels of lactylation and H3K18la in the CRC cohort and their conceivable clinical significance. Immunohistochemistry (IHC) staining showed higher levels of lactylation () and H3K18la () in CRC tissues than in adjacent normal tissues and high levels of lactylation (, Figure S1E) and H3K18la (, Figure S1F) were associated with shorter overall survival in patients with CRC. Moreover, in the SYSUCC cohort, based on the clinical response assessment, response rates were adversely associated with levels of lactylation () and H3K18la (). These clinical data suggested that increased lactylation and H3K18la levels might confer resistance to bevacizumab and were associated with poor survival for patients with CRC.
Figure 1. Colorectal cancer (CRC) resistance to bevacizumab treatment exhibited increased lactylation levels which was associated with poor survival in CRC patients.
Effects of histone lactylation inhibition on colorectal cancer cells proliferation and survival in hypoxia
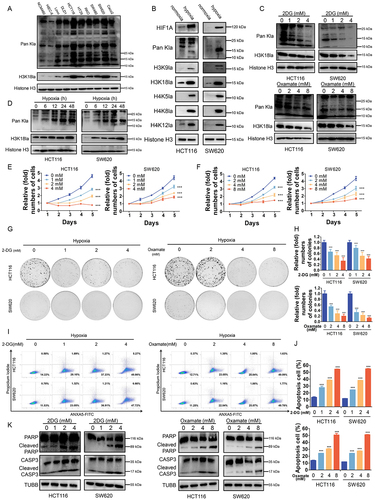
Next, we set out to explore the biological functions of histone lactylation in CRC cell lines. Much higher levels of lactylation and H3K18la levels were observed in CRC cell lines compared with normal colon epithelial cell lines, especially in HCT116 and SW620 cells (). Then, HCT116 and SW620 cells were cultured in hypoxia (1% oxygen) compared with in normoxia and followed by western blotting analysis with antibodies against diverse forms of histone lactylation, which showed a certain level of H3K18la in normoxia and significantly increased level of H3K18la in hypoxia (). Combined with the fact that H3K18la is known to be an important cancer-related marker, we identified that H3K18la was a key histone lactylation modification in CRC cell lines. Herein, intracellular lactate production and histone lactylation were blocked by glycolytic inhibitors (2-deoxy-D-glucose [2-DG] and oxamate) or siRNAs for LDHA (lactate dehydrogenase A) (Figure S2A). Notably, glycolysis inhibitors achieved a significant dose-dependent decrease in intracellular lactate (Figure S2B), as well as global lactylation and H3K18la levels in CRC cells in hypoxia () or in normoxia (Figure S2C). The same phenomenon was found after LDHA silencing, which could be partially restored by supplementing with sodium lactate (Nala) (Figure S2C). Next, we found that inhibition of lactylation and H3K18la levels suppressed CRC cells proliferation (Figure S2E-F) and colony formation ability (Figure S2G-H). At the meantime, hypoxia induced intracellular lactate production and increased lactylation and H3K18la in HCT116 and SW620 cells (Figure S2D, ). In hypoxia, inhibition of lactylation and H3K18la levels also suppressed proliferation () and colony formation () ability of CRC cells and increased hypoxia induced apoptosis () of CRC cells. Taken together, these results revealed that histone lactylation and H3K18la play a role in tumorigenesis and progression of CRC and inhibition of lactylation and H3K18la levels suppressed CRC cells proliferation and survival in hypoxia.
Figure 2. Effects of histone lactylation inhibition on colorectal cancer cells proliferation and survival in hypoxia.
Histone lactylation activated RUBCNL transcription in colorectal cancer
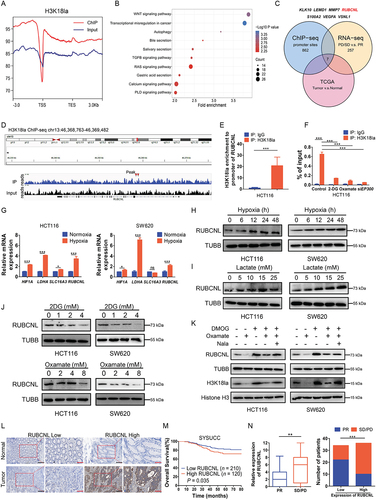
To reveal the regulatory role of histone lactylation in gene expression, we performed chromatin immunoprecipitation sequencing (ChIP-seq) using anti-H3K18la antibodies and found obvious enrichment in promoter regions (, Figure S3A). KEGG analysis of H3K18la-specific genes enriched in tumor-related and Macroautophagy/autophagy pathways (). By overlapping the gene sets among ChIP-seq, RNA-seq () and TCGA database, 7 differentially expressed genes were identified (). Among them, RUBCNL, an autophagy enhancer gene, was identified to have a marked enrichment of H3K18la peaks in the promoter position () and was positively correlated with the genes associated with lactate production and secretion in CRC in TCGA database (Figure S3C). Moreover, ChIP-qPCR assays confirmed that H3K18la was enriched at the RUBCNL promoter, which was reduced by glycolytic inhibitors or siRNA for EP300, a histone lactylation writer (). As expected, mRNA level of HIF1A, LDHA and SLC16A3 (solute carrier family 16 member 3) expression were significantly increased followed by increased mRNA level of RUBCNL expression in hypoxia (). Increased protein level of RUBCNL expression was also found in hypoxia or in cells cultured in different concentrations of lactate (). On the contrary, decreased protein level of H3K18la and RUBCNL expression were found after treated with siRNA for EP300 (E1A binding protein p300) or EP300 inhibitor, A-485 (Figure S3D). Both mRNA (Figure S3E-F) and protein () levels of RUBCNL expression were increased after treated with DMOG and were decreased after treated with glycolysis inhibitors, which could be partially restored by supplementing with Nala. IHC staining also showed that RUBCNL was highly expressed in cancer and a poor prognostic factor for CRC (, Figure S3G), and its expression was negatively correlated with the efficacy of bevacizumab (). Moreover, expression levels of RUBCNL were positively associated with levels of lactylation and H3K18la (Figure S3H). Collectively, these data suggested that the transcription of RUBCNL is positively regulated by H3K18la.
Figure 3. Histone lactylation activated RUBCNL transcription in colorectal cancer.
RUBCNL, as a novel oncogene in colorectal cancer, plays a crucial role in cancer cells proliferation and survival in hypoxia in vitro and in vivo
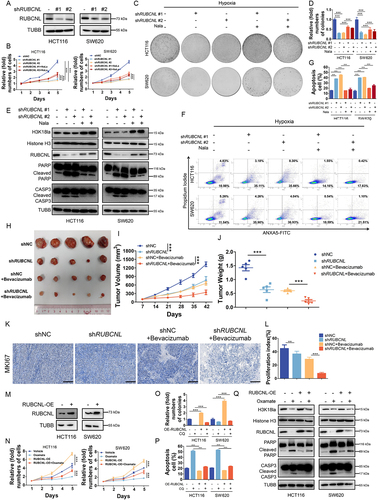
In light of our above findings, since RUBCNL can be up-regulated by H3K18la, we next explored its function in CRC. We first established stable RUBCNL knockdown and over expressing cells from the HCT116 and SW620 CRC cell lines (). We found that RUBCNL acted as an oncogene in CRC cell lines (Figure S4A-C) and silencing RUBCNL expression suppressed proliferation () and colony formation () ability of CRC cells in hypoxia and increased hypoxia induced apoptosis () of CRC cells. To further verify the role of RUBCNL, we subcutaneously injected stable shNC and shRUBCNL HCT116 cell lines into nude mice to establish xenograft mouse models. When tumors reached about 100 mm3, mice were randomized into four groups and treated with or without bevacizumab. The tumors with shRUBCNL were smaller and weighed less than those with shNC and the efficacy of bevacizumab was significantly enhanced in the shRUBCNL group compared with that in the shNC group (). Silencing RUBCNL expression combined with bevacizumab treatment significantly reduced the growth rate of CRC tumors, as shown by IHC staining (). While RUBCNL overexpression enhanced the ability of proliferation () and colony formation (, Figure S4G) treated with oxamate in hypoxia and decreased hypoxia induced apoptosis (Figure S4H, ) of CRC cells. To further determine whether RUBCNL increased the survival of CRC cells in hypoxia through enhancing autophagy pathway, CRC cells with RUBCNL overexpression were treated with chloroquine (CQ), a classic autophagy inhibitor, and showed a decreased ability of proliferation (Figure S4I) and colony formation (Figure S4J-K). Taken together, these data indicated that RUBCNL acts as an oncogene and confers to bevacizumab resistance in CRC.
Figure 4. Histone lactylation promoted colorectal cancer cells survival and proliferation in hypoxia through RUBCNL.
RUBCNL promoted autophagasome maturation through mediating the recruitment and function of the PtdIns3K complex
Next, we set out to investigate exactly how RUBCNL increases the survival of cancer cells in hypoxia and confers bevacizumab resistance through autophagy pathway in CRC. CRC cells with stable RUBCNL knockdown showed a decreased ratio of MAP1LC3/LC3 (microtubule associated protein 1 light chain 3 beta)-II:I and accumulation of SQSTM1/p62 (sequestome 1), indicating a suppression of autophagic flux (Figure S5A), which could be partially restored by supplementing with Nala (). While CRC cells with stable RUBCNL overexpression showed an increased ratio of LC3-II:I and degradation of SQSTM1, indicating a promotion of autophagic flux (Figure S5B), which could be suppressed by adding oxamate (Figure S5C, ). Combined with the results of expression levels of RUBCNL and H3K18la shown in we considered that H3K18la promoted autophagy mainly by facilitating the expression of RUBCNL, rather than directly regulated by H3K18la. To further assess the role of RUBCNL in autophagy, we tested the effects of RUBCNL on autophagic flux using the mRFP-GFP-LC3 adenovirus with or without DMOG in RUBCNL knockdown or overexpressing CRC cells. The data showed that RUBCNL knockdown cells significantly blocked autophagosome maturation, as measured by the mRFP+ GFP− puncta in both DMOG treated and untreated cells, while RUBCNL overexpression enhanced autophagosome maturation (). Furthermore, using transmission electron microscopy, we observed significant accumulation of autophagosome in RUBCNL knockdown cells while autolysosome in RUBCNL overexpression cells, under both DMOG treated and untreated conditions, confirming that RUBCNL mediates autophagasome maturation.
Figure 5. RUBCNL promoted autophagasome maturation through mediating the recruitment and function of PtdIns3K complex.
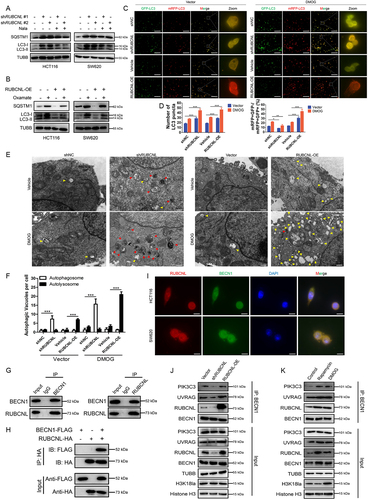
We searched for RUBCNL-interacting proteins by immunoprecipitation (IP) with anti-RUBCNL beads (Figure S5A). Mass spectrometry from the BioGRID database showed that RUBCNL may interact with BECN1, a component of the class III phosphatidylinositol 3-kinase (PtdIns3K) complex which mediates vesicle-trafficking processes, and that was confirmed by western blotting analysis after IP. A Co-IP assay was performed using endogenous proteins in HCT116 cells or exogenous proteins in HEK 293T cells transfected with BECN1-FLAG and RUBCNL-HA. And an interaction between BECN1 and RUBCNL was detected (). In addition, immunofluorescence was used to observe the colocalization status of BECN1 and RUBCNL (). We further examined their association by immunoprecipitating endogenous BECN1 complexes in RUBCNL wild type, knockdown and overexpression HCT116 cells. As shown in , RUBCNL knockdown decreased the association among BECN1, UVRAG (UV radiation resistance associated), and PIK3C3/VPS34 (phosphatidylinositol 3-kinase catalytic subunit type 3) while RUBCNL overexpression increased the association. Moreover, the association between the RUBCNL and PtdIns3K complex was enhanced in CRC cells treated with DMOG or rapamycin (an autophagy agonist) (). Collectively, the data suggested that RUBCNL promoted autophagasome maturation through mediating the recruitment and function of PtdIns3K complex and H3K18la promoted autophagy mainly by facilitating the expression of RUBCNL and subsequent cellular processes.
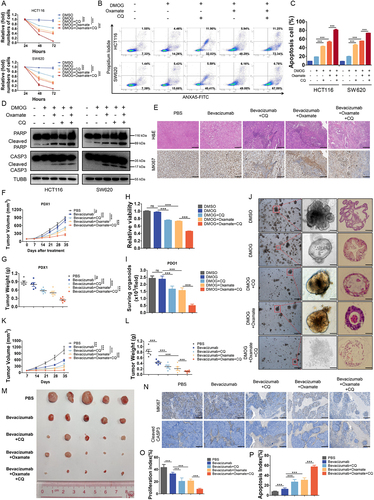
Histone lactylation inhibition enhanced antitumor effects of bevacizumab in colorectal cancer
Previously, several studies implicated autophagy as an essential mechanism of resistance to antiangiogenic therapies and autophagy inhibitors may help prevent resistance to anti-angiogenic therapy in cancer [Citation19,Citation30,Citation31]. However, the efficacy of autophagy inhibitors is still limited. Herein, we found that either target inhibition of histone lactylation by oxamate or inhibition of autophagy by CQ could significantly suppress proliferation () and induce apoptosis () of CRC cells treated with DMOG, and these effects were reinforced by combination. To further verify, we tested the effects of inhibition of histone lactylation or autophagy in PDXs and PDOs resistant to bevacizumab. In PDXs, we found that inhibition of histone lactylation or autophagy combined with bevacizumab treatment significantly reduced the growth of CRC tumors than bevacizumab treatment alone, as shown by H&E and MKI67/Ki 67 IHC staining () and significant reduced PDX tumor growth and tumor weight (, Figure S6A-B). The same results were found in bevacizumab resistant PDOs. When the combination was assessed on matrix-embedded human colorectal cancer-derived organoid cultures, synergy between DMOG and oxamate, CQ or both was maintained (, Figure S6C). Bright field images and paraffin-embedded tumor sections stained with H&E of PDOs showed an outstanding synergistic antitumor effect (). Furthermore, HCT116 cell lines were injected into nude mice to establish xenograft mouse models and also showed a synergistic antitumor effect of combining bevacizumab with inhibition of histone lactylation and autophagy, which was evident by significantly reduced tumor growth and tumor weight (). The combination of bevacizumab with inhibition of histone lactylation and autophagy resulted in proliferation suppression and more apoptosis by comparison with bevacizumab treatment alone, as determined by IHC (). These data collectively showed that inhibition of histone lactylation enhanced antitumor effects of bevacizumab in colorectal cancer.
Figure 6. Histone lactylation inhibition enhanced antitumor effects of bevacizumab in colorectal cancer.
Discussion
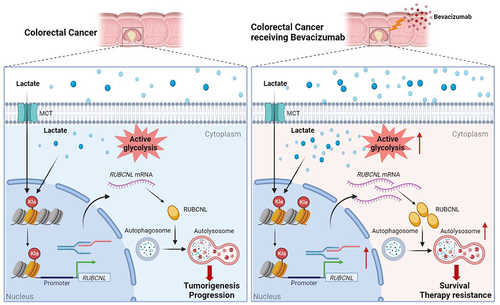
It is well known that cancer cells reprogram metabolic processes in order to support rapid proliferation, invasion and several cellular processes, as one of the key hallmarks of cancer. Lactate, an abundant energy source and metabolic byproduct in the tumor environment generated during Warburg effect, has been identified to be associated with tumorigenesis and multiple biological functions [Citation32] and has recently been found to trigger histone lysine lactylation as a novel epigenetic modification stimulating gene transcription directly [Citation22]. In the present study, we found that lactate accumulated in the tumor environment of CRC and acted as substrates for histone lactylation, and this process was further induced by cellular enhanced glycolysis in hypoxia. We identified that CRC patients resistant to bevacizumab treatment presented with elevated level of histone lactylation and inhibition of histone lactylation efficiently suppressed CRC tumorigenesis, progression and survival in hypoxia (). These results were further confirmed in several pre-clinical models. These findings might provide a new strategy for improving clinical efficacy of bevacizumab in CRC by inhibition of histone lactylation.
Figure 7. In colorectal cancer cells, high histone lactylation level induced by aerobic glycolysis promotes the transcription of RUBCNL, which enhances autophagy through promoting autophagasome maturation, and contributes to colorectal cancer tumorigenesis and progression. When receiving bevacizumab, the glycolysis of cancer cell in hypoxic regions may be further enhanced, followed by higher levels of histone lactylation and RUBCNL is transcriptionally upregulated by histone lactylation, which contributes to colorectal cancer cells survival and therapy resistance.
Post-translational modifications of histones act as a key role in regulating gene expression modulating a variety of biological processes by acting as docking sites for recruiting chromatin modulators [Citation33,Citation34]. Dysregulation of various histone modifications is frequently identified in several human diseases including cancer [Citation35], highlighting the importance of histone-based gene regulation. In recent years, lactate-triggered histone lysine lactylation, serving as a novel type of histone modification, has been identified to induce the expression of genes related to tumorigenesis, progression and proliferation of cancer cells and the expression of homeostatic genes during M1 macrophage polarization caused by infection or hypoxia [Citation36]. Here, we for the first time revealed that histone lactylation could drive tumorigenesis and progression of CRC and, in hypoxia, facilitate cancer cell survival, conferring resistance to bevacizumab treatment. Our study delivered a new exploration and important supplement of metabolic reprogramming-epigenetic regulation and provided a new tract for dealing with clinical treatment failure in cancer.
In solid tumors, the contribution of hypoxia to the resistance to antiangiogenic therapy has been established in decades [Citation37,Citation38]. And induction of hypoxia and the tumors response to it plays an important role in determining the efficacy of antiangiogenic therapy [Citation39–41]. A clinical trial showed outstanding treatment efficiency of a hypoxia-activated prodrug (Evofosfamide) combined with bevacizumab in patients with bevacizumab-refractory glioblastoma [Citation42,Citation43]. However, the connection between hypoxia and resistance to antiangiogenic therapy is still unclear. Both hypoxic cancer cells stimulate blood vessel sprouting (angiogenesis) and hypoxia-inducible factors (HIFs)-mediated cellular responses that favor the selection of resistant cells adapted to the hypoxic microenvironment were identified to be the two most promising mechanisms [Citation44,Citation45].
Cancer cells induce multiple oncogenic signaling pathways to survive when the tumor microenvironment rapidly changes, such as in hypoxia, under chemotherapy, and under nutrient deprivation. Autophagy, an intracellular lysosomal-dependent degradation system for cell survival in response to extracellular and intracellular stress [Citation46], was reported as one of the key properties of cancer cells to maintain cellular homeostasis [Citation47–49]. However, the role of autophagy in tumorigenesis and drug resistance remains controversial and the precise molecular mechanisms remain unclear. Researchers found that efficacy of antiangiogenic therapy is partially dependent on the ability of cancer cells survival in hypoxic stress [Citation19], which could be augmented by cancer-related autophagy [Citation20,Citation50,Citation51]. Autophagy inhibition was found to be a novel way of increasing the efficacy of antiangiogenic agents [Citation30,Citation31,Citation52]. Here, we revealed that histone lactylation promoted the transcription of RUBCNL, facilitating autophagosome maturation through interacting with BECN1 and mediating the recruitment and function of PtdIns3K complex, which played a crucial role in cancer cell proliferation and survival in hypoxia. Inhibition of histone lactylation enhanced the sensitivity of CRC cells to bevacizumab treatment, owning comparable treatment efficiency to autophagy inhibitor. Moreover, inhibiting RUBCNL expression through inhibition of histone lactylation has a synergistic inhibitory effect on autophagy together with CQ. Combining inhibition of histone lactylation and autophagy with bevacizumab treatment demonstrated remarkable treatment efficacy in bevacizumab-resistance patients-derived pre-clinical models (PDXs, PDOs).
In summary, in colorectal cancer cells, high histone lactylation level induced by aerobic glycolysis promotes the transcription of RUBCNL, which enhances autophagy through promoting autophagasome maturation, and contributes to colorectal cancer tumorigenesis and progression. When receiving bevacizumab, the glycolysis of hypoxic cancer cells may be further enhanced, followed by higher levels of histone lactylation and RUBCNL is transcriptionally upregulated by histone lactylation, which contributes to colorectal cancer cells survival and therapy resistance. Our study suggested that inhibition of histone lactylation may be a novel strategy for increasing the efficacy of bevacizumab in CRC, which demonstrated remarkable treatment efficacy in bevacizumab-resistance PDXs and PDOs.
Materials and methods
Patients and specimens
We obtained 330 CRC tissue specimens from fresh surgical specimens between November 2007 and May 2015 at Sun Yat-sen University Cancer Center (SYSUCC) and 150 CRC tissue specimens between October 2015 and October 2019 at The Sixth Affiliated Hospital of Sun Yat-sen University (SYSU-6thAH). And 70 patients among them received bevacizumab as first-line systemic therapy at SYSUCC after tumor progression. Bevacizumab (5 mg/kg) was administered intravenously on the first day every 2 weeks combined with chemotherapy. All patients underwent an assessment of tumor status at baseline and every 6 weeks after chemotherapy by abdominal/pelvic/chest computerized tomography (CT) or magnetic resonance imaging (MRI) and the best response was classified as a complete response (CR), partial response (PR), stable disease (SD), or progressive disease (PD) according to response evaluation criteria in solid tumors (RECIST) standard 1.1 as previously described [Citation27]. Overall survival was defined as the time from the date of surgery to the date of death from any cause or latest follow-up. Informed consent for the use of the imaging and clinical data was obtained from the patients before first-line treatment. The study was approved by the Institutional Research Ethics Committee of Sun Yat-sen University Cancer Center (Guangzhou, China, approval number: B2022-025-01) and The Sixth Affiliated Hospital of Sun Yat-sen University (Guangzhou, China, approval number: 2022ZSLYEC–116).
Cell lines and cell cultures
The CRC cells (SW480, SW620, RKO, Caco2, DLD1, Lovo, HT29 and HCT116), normal colon epithelial cells (NCM460 and HIEC-6) and HEK293T were purchased from American Type Culture Collection (CCL-228, CCL-227, CRL-2577, HTB-37, CCL-221, CCL-229, HTB-38, CCL-247, CRL-1831, CRL-3266, CRL-3216) and cultured in complete medium as recommended, supplemented with 100 μg/mL streptomycin, 100 IU/mL penicillin, and 10% fetal bovine serum (Gibco, 10099141) at 37°C in 5% CO2. All cell lines used in our study were authenticated by STR profiling and negatively tested for mycoplasma contamination before experiments.
Quantification of lactate
Lactate levels were measured by using a colorimetric lactate assay according to the manufacturer’s protocol (Solarbio, YZ-K-LATE).
Western blot analysis
Cells and tissues were lysed with RIPA buffer (50 mM Tris-HCl, pH 7.4, 150 mM NaCl, 1% NP-40 [Beyotime, P0013F], 0.1% SDS, 0.5% sodium deoxycholate [Sigma-Aldrich, 302-95-4], 1 mM EDTA, and 10% glycerol) and centrifuged at 13,000 × g for 30 min at 4°C. Equal amounts of total protein lysates were subjected to 10% SDS-PAGE and transferred to PVDF membranes. Membranes were blocked in 5% BSA (Biosharp, BS114-500 g) in TBS (Biosharp, BL602A) containing 0.1% Tween-20 (Beyotime, ST825-100 ml) for 1 h and then probed with the appropriate specific primary antibody overnight at 4°C. Primary antibodies used in this study are used in this study are anti-Pan Kla (Jingjie, PTM-1401RM), anti-H3K18la (Jingjie, PTM-1406RM), anti-H3K9la (Jingjie, PTM-1419RM), anti-H4K8la (Jingjie, PTM-1415RM), anti-H4K12la (Jingjie, PTM-1411RM), anti-HIF1A (Abcam, ab179483), anti-Histone H3 (Cell Signaling Technology, 4499), anti-LDHA (Proteintech, 19987–1-AP), anti-PARP (Cell Signaling Technology, 9532), anti-CASP3 (Cell Signaling Technology, 9662), anti-RUBCNL (Abcam, ab246954), anti-EP300 (Abcam, ab275378), anti-SQSTM1 (Cell Signaling Technology, 8025), anti-LC3 (Cell Signaling Technology, 3868), anti-FLAG tag (Proteintech, 60002–1-Ig), anti-HA tag (Proteintech, 51064–2-AP), anti-BECN1 (Proteintech, 11306–1-AP), anti-PIK3C3/VPS34 (Cell Signaling Technology, 4263), anti-UVRAG (Cell Signaling Technology, 13115) and anti-TUBB/β-tubulin (Proteintech, 10068–1-AP). Membranes were washed and incubated for 1 h at room temperature with certain HRP-linked secondary antibodies (Cell Signaling Technology, 7076).
Immunohistochemistry
Immunohistochemistry (IHC) analysis using paraffin embedded CRC specimens was conducted following standard manufacturer’s protocols as described previously. Primary antibodies anti-PECAM1/CD31 (Proteintech, 11265–1-AP), anti-HIF1A (Abcam, ab179483), anti-LDHA (Proteintech, 19987–1-AP), anti-SLC16A3 (Abcam, ab244385), anti-Pan Kla (Jingjie, PTM-1401RM), anti-H3K18la (Jingjie, PTM-1406RM) and anti-RUBCNL (Abcam, ab246954) were used for IHC staining. IHC staining was evaluated by two independent gastrointestinal pathologists blinded to the patients’ characteristics and clinical outcomes. Final IHC score was calculated based on both the extent and the intensity of staining. The staining extent that scored according to the percentage of positively stained cells ranged from 0 to 3 (0, 0–5%; 1, 5–25%; 2, 26–50%; 3, 51–75%; and 4, 76–100%), although the intensity of staining was scored as 0 (negative staining), 1 (weak staining), 2 (moderate staining), and 3 (strong staining). The Cutoff Finder program was used to determine the optimal cutoff for Pan Kla, H3K18la and RUBCNL expression. Specimens with the final scores ≥ 4 were defined as high expression, and specimens with the final scores < 4 were defined as low expression.
Immunofluorescent staining
Adherent cells were fixed with methanol and then gently washed with PBS (Biosharp, BL-601A) twice. Then, the cells were incubated with permeabilization buffer (eBioscience, 00-8333-56) for 10 min at 4°C. After blocking in 5% BSA in TBS/Tween-20 for 1 h at room temperature, the cells were incubated with primary antibodies against RUBCNL and BECN1 at 4°C overnight. The secondary antibody was marked with fluorescence (Abcam, ab150080 and ab150113) in the dark, and DAPI was applied. The images were captured using an Olympus® Fluoview FV1000 microscope (Japan), and the microscope software FV10-ASW 4.0 was used to separate each multispectral image.
The primary CRC cells prepared as described were transiently transfected with mRFP-GFP-LC3 adenovirus (Hanbio Co. Ltd., HBAP2100001) according to the manufacturer’s protocol. Subsequently, the treated cells were observed under Olympus® Fluoview FV1000 microscope.
Cell transfection and lentivirus production
The small interfering RNA (siRNA) targeting LDHA and EP300 were synthesized by RiboBio (Guangzou, China). Transfection was conducted using jetPRIME reagent (Polyplus, 101000046) as recommended. For knockdown or overexpression of RUBCNL, negative control or target gene shRNAs or over expressing plasmids were co-transfected into HEK293T with pHelper and pEnv. The virus was harvested from the transfected HEK293T cells, and the target cells were then infected with the viral supernatants for 2 consecutive days. Stable CRC cell lines were selected by treating with puromycin (2 μg/mL) for 10 days.
CCK-8 assay
For the proliferation assay, cells were seeded in 96-well plates (2000 cells per well during normoxia or 1 × 10⁴ cells per well during hypoxia) and treated with corresponding processes. At the indicated time point, CCK8 (DOJINDO, CCK8) was added into the wells and incubated with cells according to the product manual. The absorbance was detected at a wavelength of 450 nm, and growth curves were generated to determine the growth rates.
Colony formation assay
Cells were seeded in 6-well plates (1000 cells per well) with 3 replicates and were then cultured for 14 days with complete medium at 37°C with 5% CO2. Cells were then fixed with methanol and stained with crystal violet, and the colonies of each well were counted.
Apoptosis assay
For cell apoptosis assay, CRC cells treated with corresponding processes were harvested and stained with ANXA5/annexin V-FITC and propidiumiodide (PI) using an Annexin V-FITC/PI staining kit (BD Pharmingen™, 556547). After incubation at room temperature for 15 min, the cells were analyzed by flow cytometry.
Coimmunoprecipitation
Coimmunoprecipitation was carried out with the Pierce™ Classic Magnetic IP/Co-IP kit (Thermo, 88804) according to the manufacturer’s protocol. Cells were lysed in lysis buffer (50 mM HEPES, pH 7.4, 150 mM NaCl, 1% Triton X-100, 10% glycerol, 2 mM MgCl2, 2 mM EGTA) with protease inhibitor and phosphatase inhibitor cocktail (Thermo, 78446) on ice. Cell lysates were centrifuged to remove insoluble materials. Antibodies incubated with beads overnight at 4°C. The beads were washed repeatedly, and bound proteins were analyzed by western blotting.
Chromatin immunoprecipitation sequencing
The ChIP assay was performed using a Pierce™ Magnetic ChIP Kit (Thermo Fisher Scientific, 26157) according to the manufacturer’s instructions. Briefly, after cross-linking and chromatin digestion, digested chromatin was incubated with 5 μg anti-H3K18la-ChIP Grade (Jingjie, PTM-1427RM) or anti-IgG (Cell Signaling Technology, 3900) antibodies at 4°C overnight. Protein A/G magnetic beads (MCE, HY-K0202) were then added into the lysate the following morning and incubated for another 4 h. Purified DNA fragments were constructed and added to ChIP-seq libraries, amplified, and sequenced on an HiSeq 2500 platform (Illumina). The primers used for the qPCR analysis in this study are listed in supplementary materials Table S3.
RNA isolation, quantitative real-time PCR (RT-qPCR) and RNA sequencing
Total RNA was extracted using TRIzol reagent (Invitrogen, 15596026). The RNA purity was assessed using the ND-1000 Nanodrop. Each RNA sample had an A260:A280 ratio above 1.8 and an A260:A230 ratio above 2.0. Complementary DNA (cDNA) was generated using the PrimeScript RT reagent kit (TaKaRa Bio, RR037A) according to the manufacturer’s instructions. The cDNA was used for qPCR using SYBR Green PCR master mix (Life Technologies) on a CFX96 real-time PCR detection system (Bio-Rad). The libraries were paired-end sequenced (PE150, sequencing reads were 150 bp) on an Illumina HiSeq3000 at Guangzhou RiboBio Co., Ltd. (Guangzhou, China). The clean reads were obtained after removal of reads containing adapter, ploy-N and at low quality from raw data. HISAT2 was used to align the clean reads to the human reference genome hg19 with default parameters. HTSeq was subsequently employed to convert aligned short reads into read counts for each gene model. Differential expression was assessed by DE sequencing read counts as input. The Benjamini-Hochberg multiple test correction method was enabled. Differentially expressed genes were chosen according to the criteria of p-value <0.05. KEGG analysis was used for gene functional annotation.
Transmission electron microscopy
The treated CRC cells were incubated with a pre-chilled 2% glutaraldehyde solution for 2 h at 4°C to fix the cell pellet. The cells were stained with 2% uranyl acetate solution for 2 h and then dehydrated in 50%, 70%, 90%, and 100% acetone. The cells were embedded in spurr embedding kit (KYD bio, 14300), and ultrathin sections were prepared for observation under an electron microscope (HITACHI).
Organoid culture
Tumors were obtained by surgical resection and processed for organoid culture within 24 h. Tumor tissue was cut into small pieces and enzymatically digested using digestion buffer (RPMI 1640 medium, 10% FBS, 1% penicillin-streptomycin, 4 mg/mL collagenase (Sigma-Aldrich, C5138) and 2 mg/mL deoxyribonuclease (Sigma-Aldrich, 18047019) before embedding in Matrigel (Corning, 356231). After solidification for 30 min at 37°C, cells embedded in Matrigel were overlaid with IntestiCult OGM Human (Stem Cell, 06010) supplemented with penicillin (100 U/mL), streptomycin (100 μg/mL) and 10 mM Y-27632 (Sigma-Aldrich, 5092280001) at 37°C supplemented with 5% CO2. Organoids were passaged approximately every week by incubating in TrypLE Express (Gibco, 12604013) for 30 min at 37°C to dissociate organoids into single cells and replating them in fresh Matrigel. Organoids < passage 30 were used in experiments. On the second day after seeding organoids were drugged. At 10 d after drugging, organoids were imaged with the Olympus® I×73microscope. After image acquisition, organoid viability was accessed with Cell Titer Glo 3D Cell Viability assay (Promega, G9682–1) according to the manufacturer’s protocol on the SpectraMax i3× plate reader.
In vivo therapeutic study
CRC cell line-based xenograft (CDX) and patient-derived xenograft (PDX) models were performed. All mice were housed in specific-pathogen-free conditions. All procedures, following the National Institutes of Health Guide for the Care and Use of Laboratory Animals (NIH Publications No. 8023, revised 1978), were approved by the Sun Yat-sen University Animal Care and Use Committee (L102012022050E, Guangzhou, China). Six to 8-week-old female BALB/c nude mice were purchased from The Vital River Laboratory (Beijing, China). RUBCNL-knockdown or control HCT116 cells (5 × 10⁵) were suspended in 100 μl PBS and subcutaneously injected to the left flank of each nude mouse (5 mice/group, randomly divided into indicated groups). One week later, the mice were intraperitoneally injected with indicated treatment.
Immunocompromised NOD.SCID mice were obtained from GemPharmatech (China) and used to establish patient-derived xenograft models. The PDX models were initially generated using fresh tumor samples from patients with CRC that were subcutaneously implanted into the dorsal flank of mice as the first generation (F0). Once an appropriate volume was reached, the tumors were excised, divided into equal pieces, and subcutaneously implanted into mice as the second generation (F1). When the tumors became palpable, the tumor-bearing mice were divided randomly into 5 groups with indicated treatment. Tumor growth curve was measured every 3 days for 4–5 weeks and the volume of tumor was calculated as length × Width2 ×1/2. At the end of the study, we surgically removed the tumors from the sacrificed mice.
Statistical analysis
Statistical analyses were performed using SPSS version 24.0 software. All data were presented as the mean ± SD. Statistical tests used in this study included the two-tailed Student’s t test, χ2 test and log-rank test. P value < 0.05 was considered statistically significant.
Supplemental Material
Download Zip (1.4 MB)Acknowledgements
We greatly appreciate the help from all of our colleagues in the Department of Colorectal Surgery at Sun Yat-sen University Cancer Center who were involved in administering the treatments in the current study.
Disclosure statement
No potential conflict of interest was reported by the author(s).
Supplementary data
Supplemental data for this article can be accessed online at https://doi.org/10.1080/15548627.2023.2249762
Data availability statement
The datasets used and analyzed during the current study are available from the corresponding author on reasonable request. The authenticity of this article has been validated by uploading the key raw data onto the Research Data Deposit public platform (www. researchdata.org.cn).
Additional information
Funding
References
- Sung H, Ferlay J, Siegel RL, et al. Global cancer Statistics 2020: GLOBOCAN estimates of incidence and mortality worldwide for 36 cancers in 185 countries. CA Cancer J Clin. 2021;71(3):209–249. doi: 10.3322/caac.21660
- Siegel RL, Miller KD, Goding Sauer A, et al. Colorectal cancer statistics, 2020. CA A Cancer J Clin. 2020;70(3):145–164. doi: 10.3322/caac.21601
- Van Cutsem E, Cervantes A, Adam R, et al. ESMO consensus guidelines for the management of patients with metastatic colorectal cancer. Ann Oncol. 2016;27(8):1386–1422. doi: 10.1093/annonc/mdw235
- Jönsson K, Gröndahl G, Salö M, et al. Repeated liver resection for colorectal liver metastases: a comparison with primary liver resections concerning perioperative and long-term outcome. Gastroenterol Res Pract. 2012;2012:568214. doi: 10.1155/2012/568214
- Rahbari NN, Reissfelder C, Schulze-Bergkamen H, et al. Adjuvant therapy after resection of colorectal liver metastases: the predictive value of the MSKCC clinical risk score in the era of modern chemotherapy. BMC Cancer. 2014;14(1):174. doi: 10.1186/1471-2407-14-174
- Tzeng CW, Aloia TA. Colorectal liver metastases. J Gastrointest Surg. 2013;17(1):195-201; quiz p.201–2. doi: 10.1007/s11605-012-2022-3
- Chiche L. Prise en charge chirurgicale des métastases hépatiques des cancers colorectaux [Surgical management of hepatic metastases from colorectal cancer]. J Chir (Paris). 2003;140(2):77–89.
- Maeda Y, Shinohara T, Nagatsu A, et al. Long-term outcomes of conversion hepatectomy for initially unresectable colorectal liver metastases. Ann Surg Oncol. 2016;23 Suppl 2(S2):S242–8. doi: 10.1245/s10434-015-4460-0
- Maughan TS, Adams RA, Smith CG, et al. Addition of cetuximab to oxaliplatin-based first-line combination chemotherapy for treatment of advanced colorectal cancer: results of the randomised phase 3 MRC COIN trial. Lancet. 2011;377(9783):2103–2114. doi: 10.1016/S0140-6736(11)60613-2
- Van Cutsem E, Köhne CH, Láng I, et al. Cetuximab plus irinotecan, fluorouracil, and leucovorin as first-line treatment for metastatic colorectal cancer: updated analysis of overall survival according to tumor KRAS and BRAF mutation status. J Clin Oncol. 2011;29(15):2011–2019. doi: 10.1200/JCO.2010.33.5091
- Venook AP, Niedzwiecki D, Lenz HJ, et al. Effect of first-line chemotherapy combined with cetuximab or bevacizumab on overall survival in patients with KRAS wild-type advanced or metastatic colorectal cancer: arandomized clinical trial. JAMA. 2017;317(23):2392–2401. doi: 10.1001/jama.2017.7105
- Tomasello G, Petrelli F, Ghidini M, et al. FOLFOXIRI plus bevacizumab as conversion therapy for patients with initially unresectable metastatic colorectal cancer: a systematic review and pooled analysis. JAMA Oncol. 2017;3(7):e170278. doi: 10.1001/jamaoncol.2017.0278
- Hurwitz H. Integrating the anti-VEGF-A humanized monoclonal antibody bevacizumab with chemotherapy in advanced colorectal cancer. Clin Colorectal Cancer. 2004;4(Suppl 2):S62–8. doi: 10.3816/CCC.2004.s.010
- Botrel TEA, Clark LGO, Paladini L, et al. Efficacy and safety of bevacizumab plus chemotherapy compared to chemotherapy alone in previously untreated advanced or metastatic colorectal cancer: a systematic review and meta-analysis. BMC Cancer. 2016;16(1):677. doi: 10.1186/s12885-016-2734-y
- Benson AB, Venook AP, Al-Hawary MM, et al. Colon cancer, version 2.2021, NCCN clinical practice guidelines in oncology. J Natl Compr Canc Netw. 2021;19(3):329–359. doi: 10.6004/jnccn.2021.0012
- Vasudev NS, Reynolds AR. Anti-angiogenic therapy for cancer: current progress, unresolved questions and future directions. Angiogenesis. 2014;17(3):471–494. Erratum in: Angiogenesis 17(3):495-7. doi: 10.1007/s10456-014-9420-y
- Garcia J, Hurwitz HI, Sandler AB, et al. Bevacizumab (avastin®) in cancer treatment: a review of 15 years of clinical experience and future outlook. Cancer Treat Rev. 2020;86:102017. doi: 10.1016/j.ctrv.2020.102017
- Cao D, Hou M, Guan YS, et al. Expression of HIF-1alpha and VEGF in colorectal cancer: association with clinical outcomes and prognostic implications. BMC Cancer. 2009;9(1):432. doi: 10.1186/1471-2407-9-432
- Hu YL, DeLay M, Jahangiri A, et al. Hypoxia-induced autophagy promotes tumor cell survival and adaptation to antiangiogenic treatment in glioblastoma. Cancer Res. 2012;72(7):1773–1783. doi: 10.1158/0008-5472.CAN-11-3831
- Selvakumaran M, Yao KS, Feldman MD, et al. Antitumor effect of the angiogenesis inhibitor bevacizumab is dependent on susceptibility of tumors to hypoxia-induced apoptosis. Biochem Pharmacol. 2008;75(3):627–638. doi: 10.1016/j.bcp.2007.09.029
- Tennant DA, Durán RV, Gottlieb E. Targeting metabolic transformation for cancer therapy. Nat Rev Cancer. 2010;10(4):267–277. doi: 10.1038/nrc2817
- Zhang D, Tang Z, Huang H, et al. Metabolic regulation of gene expression by histone lactylation. Nature. 2019;574(7779):575–580. doi: 10.1038/s41586-019-1678-1
- Yu J, Chai P, Xie M, et al. Histone lactylation drives oncogenesis by facilitating m6A reader protein YTHDF2 expression in ocular melanoma. Genome Biol. 2021;22(1):85. doi: 10.1186/s13059-021-02308-z
- Yang J, Luo L, Zhao C, et al. A positive feedback loop between inactive VHL-triggered histone lactylation and PDGFRβ signaling drives clear cell renal cell carcinoma progression. Int J Biol Sci. 2022;18(8):3470–3483. doi: 10.7150/ijbs.73398
- Xiong J, He J, Zhu J, et al. Lactylation-driven METTL3-mediated RNA m6A modification promotes immunosuppression of tumor-infiltrating myeloid cells. Mol Cell. 2022;82(9):1660–1677.e10. doi: 10.1016/j.molcel.2022.02.033
- Yang Z, Yan C, Ma J, et al. Lactylome analysis suggests lactylation-dependent mechanisms of metabolic adaptation in hepatocellular carcinoma. Nat Metab. 2023;5(1):61–79. doi: 10.1038/s42255-022-00710-w
- Lu ZH, Peng JH, Wang FL, et al. Bevacizumab with preoperative chemotherapy versus preoperative chemotherapy alone for colorectal cancer liver metastases: a retrospective cohort study. Medicine (Baltimore). 2016;95(35):e4767. doi: 10.1097/MD.0000000000004767
- Cummins EP, Berra E, Comerford KM, et al. Prolyl hydroxylase-1 negatively regulates IkappaB kinase-beta, giving insight into hypoxia-induced NFkappaB activity. Proc Natl Acad Sci U S A. 2006;103(48):18154–18159. doi: 10.1073/pnas.0602235103
- Milkiewicz M, Pugh CW, Egginton S. Inhibition of endogenous HIF inactivation induces angiogenesis in ischaemic skeletal muscles of mice. J Physiol. 2004;560(Pt 1):21–26. doi: 10.1113/jphysiol.2004.069757
- Selvakumaran M, Amaravadi RK, Vasilevskaya IA, et al. Autophagy inhibition sensitizes colon cancer cells to antiangiogenic and cytotoxic therapy. Clin Cancer Res. 2013;19(11):2995–3007. doi: 10.1158/1078-0432.CCR-12-1542
- Guo XL, Li D, Sun K, et al. Inhibition of autophagy enhances anticancer effects of bevacizumab in hepatocarcinoma. J Mol Med (Berl). 2013;91(4):473–483. doi: 10.1007/s00109-012-0966-0
- Feng Y, Xiong Y, Qiao T, et al. Lactate dehydrogenase A: a key player in carcinogenesis and potential target in cancer therapy. Cancer Med. 2018;7(12):6124–6136. doi: 10.1002/cam4.1820
- Strahl BD, Allis CD. The language of covalent histone modifications. Nature. 2000;403(6765):41–45. doi: 10.1038/47412
- Dunn RK, Kingston RE. Gene regulation in the postgenomic era: technology takes the wheel. Mol Cell. 2007;28(5):708–714. doi: 10.1016/j.molcel.2007.11.022
- Chi P, Allis CD, Wang GG. Covalent histone modifications–miswritten, misinterpreted and mis-erased in human cancers. Nat Rev Cancer. 2010;10(7):457–469. doi: 10.1038/nrc2876
- Chen AN, Luo Y, Yang YH, et al. Lactylation, a novel metabolic reprogramming code: current status and prospects. Front Immunol. 2021;12:688910. doi: 10.3389/fimmu.2021.688910
- Minchinton AI, Tannock IF. Drug penetration in solid tumours. Nat Rev Cancer. 2006;6(8):583–592. doi: 10.1038/nrc1893
- Sorensen AG, Emblem KE, Polaskova P, et al. Increased survival of glioblastoma patients who respond to antiangiogenic therapy with elevated blood perfusion. Cancer Res. 2012;72(2):402–407. Erratum in: Cancer Res;72(2). doi: 10.1158/0008-5472.CAN-11-2464
- Brown JM, Wilson WR. Exploiting tumour hypoxia in cancer treatment. Nat Rev Cancer. 2004;4(6):437–447. doi: 10.1038/nrc1367
- Höckel M, Vaupel P. Tumor hypoxia: definitions and current clinical, biologic, and molecular aspects. J Natl Cancer Inst. 2001;93(4):266–276. doi: 10.1093/jnci/93.4.266
- Keunen O, Johansson M, Oudin A, et al. Anti-VEGF treatment reduces blood supply and increases tumor cell invasion in glioblastoma. Proc Natl Acad Sci U S A. 2011;108(9):3749–3754. doi: 10.1073/pnas.1014480108
- Brenner A, Zuniga R, Sun JD, et al. Hypoxia-activated evofosfamide for treatment of recurrent bevacizumab-refractory glioblastoma: a phase I surgical study. Neuro Oncol. 2018;20(9):1231–1239. doi: 10.1093/neuonc/noy015
- Brenner AJ, Floyd J, Fichtel L, et al. Phase 2 trial of hypoxia activated evofosfamide (TH302) for treatment of recurrent bevacizumab-refractory glioblastoma. Sci Rep. 2021;11(1):2306. doi: 10.1038/s41598-021-81841-0
- Rey S, Schito L, Wouters BG, et al. Targeting hypoxia-inducible factors for antiangiogenic cancer therapy. Trends Cancer. 2017;3(7):529–541. doi: 10.1016/j.trecan.2017.05.002
- Méndez-Blanco C, Fondevila F, García-Palomo A, et al. Sorafenib resistance in hepatocarcinoma: role of hypoxia-inducible factors. Exp Mol Med. 2018;50(10):1–9. doi: 10.1038/s12276-018-0159-1
- Klionsky DJ. Autophagy: from phenomenology to molecular understanding in less than a decade. Nat Rev Mol Cell Biol. 2007;8(11):931–937. doi: 10.1038/nrm2245
- Monkkonen T, Debnath J. Inflammatory signaling cascades and autophagy in cancer. Autophagy. 2018;14(2):190–198. doi: 10.1080/15548627.2017.1345412
- Levine B, Kroemer G. Autophagy in the pathogenesis of disease. Cell. 2008;132(1):27–42. doi: 10.1016/j.cell.2007.12.018
- Xie Z, Klionsky DJ. Autophagosome formation: core machinery and adaptations. Nat Cell Biol. 2007;9(10):1102–1109. doi: 10.1038/ncb1007-1102
- Wu HB, Yang S, Weng HY, et al. Autophagy-induced KDR/VEGFR-2 activation promotes the formation of vasculogenic mimicry by glioma stem cells. Autophagy. 2017;13(9):1528–1542. doi: 10.1080/15548627.2017.1336277
- Sun L, Xiong H, Chen L, et al. Deacetylation of ATG4B promotes autophagy initiation under starvation. Sci Adv. 2022;8(31):eabo0412. doi: 10.1126/sciadv.abo0412
- Shi YH, Ding ZB, Zhou J, et al. Targeting autophagy enhances sorafenib lethality for hepatocellular carcinoma via ER stress-related apoptosis. Autophagy. 2011;7(10):1159–1172. doi: 10.4161/auto.7.10.16818