
ABSTRACT
A growing number of studies have shown that melatonin is a potent agonist of SIRT3 (sirtuin 3) and effectively protects mitochondria, suggesting melatonin as a promising therapeutic drug to treat sepsis-induced acute kidney injury (SAKI). In this study, we first included 48 sepsis patients for cross-sectional analysis and the result revealed that plasma melatonin levels are inversely proportional to the mitochondrial injury of renal tubular epithelial cells and directly proportional to the acute kidney injury recovery in sepsis patients. We further explored the effects of exogenous melatonin on SAKI and its mechanism in animal model of cecal ligation and puncture-treated mice, and cellular model of LPS-challenged HK-2 cells. The results demonstrate that the protective effect of melatonin on the progression of SAKI depends on SIRT3 activation as well as mitophagic flux. Mechanistically, TFAM (transcription factor A, mitochondrial)-K154 site deacetylation via SIRT3 is indispensable for melatonin-enhanced mitophagic flux on SAKI. Together, our study unveils a previously unappreciated mechanism of melatonin as agonists of SIRT3 to hold promise for treatment of patients with SAKI.
Abbreviations
AKI: acute kidney injury; ATP: adenosine triphosphate; BUN: blood urea nitrogen; CLP: cecal ligation and puncture; eGFR: estimated glomerular filtration rate; H&E: hematoxylin and eosin staining; LCN2/NGAL: lipocalin 2; LPS: lipopolysaccharide; LTL: lotus tetragonolobus lectin; mKeima: mitochondria-targeted Keima; mtDNA: mitochondrial DNA; PAS: periodic acid – Schiff staining; RTECs: renal tubular epithelial cells; SAKI: sepsis-induced acute kidney injury; Scr: serum creatinine; SIRT3: sirtuin 3; TFAM: transcription factor A, mitochondrial; TMRE: tetramethylrhodamine.
Introduction
Acute kidney injury (AKI) is one of the most frequent complications in septic patients [Citation1]. Sepsis-induced acute kidney injury (SAKI) would result in an especially high morbidity and mortality [Citation2]. There is no effective treatment in clinic for SAKI and only symptomatic treatments for options. Therefore, searching for effective target and therapeutic strategies is a top priority for the management of SAKI.
Melatonin was initially presumed to be a neurohormone exclusively produced in the pineal gland at night with a clear effect on circadian rhythm regulation [Citation3]. Different from “classic” view, melatonin was recently recognized as an antioxidant to protect mitochondria [Citation4]. It is now widely accepted that mitochondrial injury in renal tubular epithelial cells (RTECs) plays a key role in the development of SAKI [Citation5], suggesting exogenous melatonin could be a promising therapeutic drug to treat SAKI. Indeed, our previous study demonstrated that melatonin alleviates SAKI in mice [Citation6]. Therefore, the present study was further investigated underlying mechanisms of melatonin’s therapeutic effect on SAKI.
Macroautophagy/autophagy is a dynamic process to degrade or eliminate damaged organelles and proteins depending on lysosomes, and mitophagy is a main type of the autophagy to selectively degrade damaged mitochondria. Recent studies have confirmed that mitophagy in RTECs is known to exert protective effects against SAKI [Citation7]. Additionally, our previous study also demonstrated that the activation of autophagy attenuates SAKI [Citation8,Citation9], indicating that mitophagy activation in RTECs may contribute to mitochondrial quality control of SAKI.
The increased protein acetylation has been shown to induce autophagy inhibition [Citation8,Citation9] and mitochondrial injury [Citation10] during the development of SAKI [Citation11]. SIRT3 (sirtuin 3) is a major mitochondrial deacetylase involved in mitochondrial protein deacetylation [Citation12]. Full-length 44-kD SIRT3 is enzymatically inactive, but it becomes activated when it is translocated into mitochondria and cleaved as a 28-kD smaller SIRT3 [Citation13]. SIRT3 knockout or silencing could significantly aggravate mitochondrial injury and suppressed mitophagy in diabetic cardiomyopaphy [Citation14] and senile osteoporosis [Citation15]. Moreover, SIRT3 deficiency facilitated PINK1-PRKN/parkin acetylation and impaired mitophagy, thus accelerating hypertensive cardiac remodeling [Citation14]. Our previous study also showed that SIRT3 activation attenuated SAKI [Citation10], indicating that targeted activation of SIRT3 could be a promising therapeutic strategy for clinical SAKI.
Various studies have shown that melatonin is a potent agonist of SIRT3 [Citation16]. Exogenous melatonin administration protected mitochondria and activated autophagy to attenuates sepsis-induced small intestine injury by upregulating SIRT3 [Citation17]. SIRT3 deletion abolished the protective effects of melatonin in contrast-induced acute kidney injury [Citation18]. These findings suggest that the effect of melatonin as an agonist of SIRT3 on attenuating SAKI may depend on the activation of mitophagy to mitigate mitochondrial damage. Besides, the potential mechanism for melatonin-induced SIRT3 activation in promoting mitophagy also needs further investigation.
TFAM (transcription factor A, mitochondrial) is a major regulator of mitochondrial function and its expression is responsible for mtDNA transcription initiation [Citation19]. Additionally, TFAM deficient induced impairment of mitophagic flux due to lysosomal dysfunction [Citation20]. Another study revealed that the activity of TFAM is decreased while it is acetylated at K154 and its activity was promoted by SIRT3-induced deacetylation at K154 site [Citation21]. In present study, we supposed that the underlying mechanism by which the therapeutic effect of melatonin on SAKI might associate with promotion of mitophagy through SIRT3-mediated TFAM deacetylation.
Results
Higher plasma melatonin level resulted in shorter recovery time and less renal mitochondrial damage in patients with SAKI
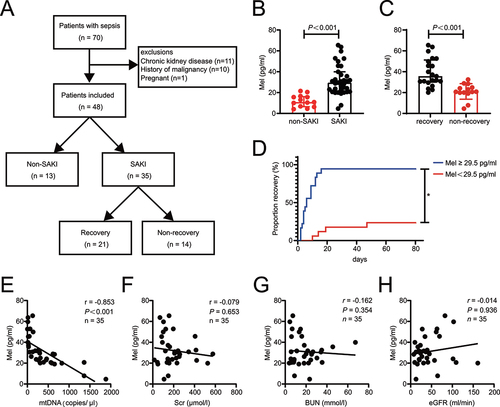
To evaluate the role of melatonin in SAKI, we conducted a cross-sectional analysis of 70 adult patients who met the diagnostic criteria of Sepsis 3.0, 48 enrolled patients were stratified into the SAKI and non-SAKI groups, and SAKI patients were stratified into the SAKI recovery and non-recovery (). Tables S1 and S2 shows patient clinical characteristics. Septic patients with AKI had higher plasma levels of melatonin (). SAKI patients with recovery had higher plasma levels of melatonin compared to those with non-recovery (). SAKI Patients were dichotomized into low- and high-level of melatonin groups using as a cutoff the median of the plasma melatonin values (29.5 pg/ml). High-level melatonin group had faster recovery after AKI (). Previous study has shown that urinary mtDNA is recognized as a marker for renal mitochondrial injury in SAKI [Citation22]. Correlation analysis showed that plasma melatonin level was negatively correlated with urinary mtDNA in SAKI patients (). However, plasma melatonin level did not correlate with Scr, BUN or eGFR (). To sum up, these data suggest that plasma melatonin responsively increases in sepsis patients after AKI, while higher melatonin level resulted in shorter recovery time and less renal mitochondrial damage.
Figure 1. Higher plasma melatonin level resulted in shorter recovery time and less renal mitochondrial damage in patients with SAKI. (A) Flowchart of the enrolled patients. (B) the plasma melatonin level in non-SAKI patients (n = 13) and SAKI (n = 35). (C) the plasma melatonin level in SAKI recovery (n = 21) and non-recovery SAKI patients (n = 14). The data of (B and C) are presented as the median ± IQR. Statistical significance was assessed by Mann-Whitney U test and P < 0.001. (D) SAKI recovery analyses ratified by melatonin median (29.5 pg/ml) in SAKI cohort (melatonin ≥29.5 pg/ml, n = 18, melatonin <29.5 pg/ml, n = 17). Statistical significance was assessed by log-rank test and *P < 0.05. (E) the level of plasma melatonin was negatively correlated with urinary mtDNA in SAKI patients, n = 35. (F) the level of plasma melatonin did not correlate with Scr, n = 35. (G) the level of plasma melatonin did not correlate with BUN, n = 35. (H) the level of plasma melatonin did not correlate with eGFR, n = 35. Statistical significance of (E-H) was assessed by Spearman’s rank correlation analysis. We present P and r in those figures. SAKI: sepsis-induced acute kidney injury, Mel: melatonin, mtDNA: mitochondrial DNA, Scr: serum creatinine, BUN: blood urea nitrogen, eGFR: estimated glomerular filtration rate.
Melatonin attenuates SAKI via activating SIRT3
To define the agonist action of melatonin on SIRT3, we firstly examined the expression and activity of SIRT3 protein in LPS-treated HK-2 cells. Compared to HK-2 cells treated with LPS alone, melatonin treatment significantly increased the expression of SIRT3, particularly 28-kD active form SIRT3 (Figure S1A). In a cell-free system, melatonin treatment alone did increased the enzyme activity of recombinant SIRT3 in a dose-dependent manner (Figure S1B). Likewise, melatonin enhanced SIRT3 activity in HK-2 cells and mouse kidney in either the in presence or absence of LPS stimulation or CLP (Figure S1C and D). The immunohistochemistry analysis of SIRT3 in mouse kidney tissue showed that SIRT3 is predominantly expressed in renal tubules, and melatonin treatment did increase the expression of SIRT3 (Figure S1E).
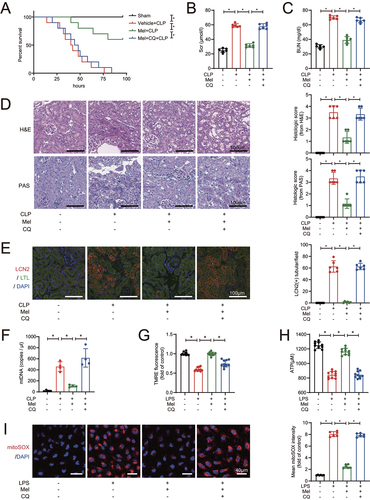
To examine whether the protective effect of melatonin on SAKI depends on SIRT3, we administered the SIRT3-specific inhibitor 3-TYP and melatonin simultaneously in CLP-induced sepsis mice. The effectiveness of SIRT3 inhibitor 3-TYP and siRNA on the expression of SIRT3 total protein and active form were first confirmed (Figure S2A and B). The results revealed that melatonin administration improved the survival rate and time of CLP mice, but the beneficial effect of melatonin was blocked by 3-TYP (). Melatonin decreased both Scr and BUN levels after CLP, whereas the application of 3-TYP considerably removed the melatonin’s protective effect on kidney function (). Consistently, histopathlogical examination showed that melatonin decreased the pathology scores from both H&E and PAS stainings, as well as the number of LCN2/NGAL-positive renal tubules in kidney tissues from CLP mice, but the addition of 3-TYP reversed these protective effects of melatonin on kidney injury (). Also, melatonin decreased the urinary mtDNA from CLP mice, while the application of 3-TYP attenuated this effect (), implying that the inhibition of STIR3 aggravated renal mitochondrial injury, and subsequently reversed the protective effects of melatonin on kidney function in CLP mice. Compared with LPS treatment alone, melatonin restored mitochondrial membrane potential as the fluorescence of TMRE () increasing and restored ATP levels () in HK-2 cells after LPS-stimulation. It was further revealed that melatonin reduced the content of mitoROS as the fluorescence of mitoSOX decreasing (). But, siRNA-medicated SIRT3 knockdown blocked these melatonin-induced mitoprotective actions. Taken together, these data indicate that melatonin ameliorated RTECs mitochondrial injury in SAKI by activating SIRT3.
Figure 2. Melatonin attenuates SAKI via activating SIRT3. (A) effects of melatonin and SIRT3 inhibitor 3-TYP on the survival times in CLP-induced septic mice; n = 10; statistical significance was assessed by log-rank test and *P < 0.0167. (B) Scr level; n = 6. (C) BUN level; n = 6. (D) Pathological observation of kidney tissue (upper panel: H&E staining of kidney cortex; lower panel: PAS staining of kidney cortex; scale bar: 100 μm) and histologic scores were evaluated based on H&E and PAS staining (n = 6). (E) tubular injury was analyzed by LCN2-positive staining with RTECs marker LTL (green), injury marker LCN2 (red), and cell nuclei marker DAPI (blue) (scale bar: 100 μm); n = 6. (F) the urinary mtDNA level from mice; n = 4. (G) the mitochondrial membrane potential of HK-2 cells was measured by TMRE fluorescence; n = 10. (H) ATP levels of HK-2 cells; n = 10. (I) the mitoROS of HK-2 cells were measured by mitoSOX staining (red) with DAPI (blue) (scale bar: 40 μm), and mtROS was statistically quantified by mtSOX fluorescence (n = 6). These data are presented as the mean ± SD and *P < 0.05. Statistical significance was assessed by one-way ANOVA. CLP: cecal ligation and puncture, LPS: lipopolysaccharide, Mel: melatonin, Scr: serum creatinine, BUN: blood urea nitrogen, H&E: hematoxylin and eosin staining, PAS: periodic acid–Schiff staining, LCN2: lipocalin 2, LTL: lotus tetragonolobus lectin, mtDNA: mitochondrial DNA, TMRE: tetramethylrhodamine, ATP: adenosine triphosphate.

Melatonin promotes mitophagic flux to attenuate SAKI via SIRT3 activation
The results of mitophagy accumulation by mKeima analysis in HK-2 cells revealed that overexpression of SIRT3 increased acidic mKeima fluorescence signals, indicating SIRT3 promoted mitophagic flux in LPS-treated HK-2 cells (Figure S3A). SIRT3 was also over-expressed in kidney tissue by adenoviral injections and the results revealed that the expression of mitophagosome markers (PINK1, PRKN, MAP1LC3/LC3-II) was increased and the content of protein substrate for mitophagy (SQSTM1) was decreased, indicating the enhancing effect of SIRT3 on mitophagy in CLP-induced septic mouse kidney (Figure S3B and C).
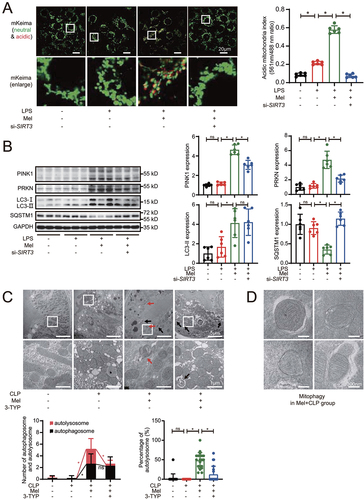
Moreover, melatonin administration induced mitochondrial engulfment into lysosomes, but siRNA-medicated SIRT3 knockdown blocked mitophagic flux as compared to melatonin treatment alone in LPS-treated HK-2 cells (). As shown by western blot, with melatonin treatment, we observed that the expression of PINK1, PRKN, LC3-II was increased and SQSTM1 was decreased in LPS-stimulated HK-2 cells (), indicating the enhancing effect on mitophagy by melatonin. However, SIRT3 knockdown by siRNA resulted in reverse of those melatonin-induced mitophagy promotion effects, implying that melatonin promoted HK-2 cells mitophagy in a SIRT3-dependent manner in response to LPS administration. The results of mitophagosome marker protein expression in kidney tissue were consistent with the about-mentioned data in cellular model (Figure S3D). Moreover, melatonin decreased mitochondrial mass, but the simultaneous administration of melatonin and SIRT3 inhibitor 3-TYP increased mitochondrial mass (Figure S3E), implying that melatonin-promoted the mitophagic clearance of defective mitochondria depends on SIRT3. As expected, melatonin attenuated CLP-induced mitochondria swelling characterized by damaged cristae (). Ultrastructural photographs revealed that the double-membrane autophagosomes often had enveloped mitochondria (mitophagosomes), and the numbers of autophagosomes and autolysosomes were increased after melatonin treatment (). The simultaneous administration of melatonin and SIRT3 inhibitor 3-TYP aggregated mitochondrial damage and impaired mitophagy by decreasing the numbers of autolysosomes (). These results strongly indicated that melatonin-enhanced activation of SIRT3 promotes mitophagic flux.
Figure 3. Melatonin-induced activation of SIRT3 promotes mitophagic flux. (A) mKeima was expressed in HK-2 cells and live cell was imaged by confocal microscopy (mKeima-561 nm: red; mKeima-488 nm: green; scale bar: 20 μm); 561 nm/488 nm mKeima was statistically quantified (n = 6). (B) representative western blot with densitometric analysis of protein expression of PINK1, PRKN, LC3-II and SQSTM1 in HK-2 cells; and the protein expression levels were standardized relative to the level of GAPDH; n = 6. (C) the representative ultrastructure images of mouse renal epithelial cells observed by transmission electron microscopy; and the number of autophagosomes (black arrow) or autolysosomes (red arrow) was calculated in 20 randomly selected 20,000× fields (upper panel: scale bar: 5 μm; lower panel: scale bar: 1 μm, n = 20). (D) the representative ultrastructure images of mitophagosomes in Mel+CLP group observed by transmission electron microscopy; (scale bar: 300 nm). The data are presented as the mean ± SD. Statistical significance was assessed by one-way ANOVA and *P < 0.05. CLP: cecal ligation and puncture, LPS: lipopolysaccharide, Mel: melatonin.
In order to further examine whether the promotion of mitophagic flux affects SAKI, chloroquine was added to inhibit the fusion of autophagosome (mitophagosome) with lysosomes. We first confirmed the effectiveness of chloroquine and the results showed that the expression of PINK1, PRKN, LC3-II and SQSTM1 were increased, implying that chloroquine treatement impaired the mitophagic flux (Figure S4). Compared with melatonin-treated SAKI mice, chloroquine diminished the protective effect of melatonin on prolong survival of CLP-induced sepsis mice (). Chloroquine administration counteracted the melatonin-lowering effects on Scr and BUN in CLP mice (). Similarly, histopathological examination demonstrated that septic mice subjected to chloroquine treatment developed more severe AKI even in the presence of melatonin treatment, confirmed by the result of H&E staining and PAS staining (), and the LCN2-positive staining in renal tubular (). Also, melatonin decreased the urinary mtDNA from CLP mice, but chloroquine treatment reversed this effect (). In HK-2 cells, chloroquine antagonized the melatonin-induced mitochondrial protective effects on membrane potential maintenance (), ATP generation () and mitoROS elimination (). These data suggest that melatonin-induced attenuation of SAKI depends on the promotion of mitophagic flux, and melatonin promotes mitophagic flux to attenuate SAKI via SIRT3 activation.
Figure 4. Melatonin attenuates SAKI via promoting mitophagic flux. (A) effects of melatonin and chloroquine-blocked mitophagy on the survival times in CLP-induced septic mice; n = 10; statistical significance was assessed by log-rank test and *P < 0.0167. (B) Scr level; n = 6. (C) BUN level; n = 6. (D) Pathological observation of kidney tissue (upper panel: H&E staining of kidney cortex; lower panel: PAS staining of kidney cortex; scale bar: 100 μm) and histologic scores were evaluated based on H&E and PAS staining (n = 6). (E) tubular injury was analyzed by LCN2-positive staining with RTECs marker LTL (green), injury marker LCN2 (red), and cell nuclei marker DAPI (blue) (scale bar: 100 μm); n = 6. (F) the urinary mtDNA level from mice; n = 4. (G) the mitochondrial membrane potential of HK-2 cells was measured by TMRE fluorescence; n = 10. (H) ATP levels of HK-2 cells; n = 10. (I) the mitoROS of HK-2 cells were measured by mitoSOX staining (red) with DAPI (blue) (scale bar: 40 μm), and mtROS was statistically quantified by mtSOX fluorescence (n = 6). These data are presented as the mean ± SD and *P < 0.05. Statistical significance was assessed by one-way ANOVA. CLP: cecal ligation and puncture, LPS: lipopolysaccharide, Mel: melatonin, CQ: chloroquine, Scr: serum creatinine, BUN: blood urea nitrogen, H&E: hematoxylin and eosin staining, PAS: periodic acid–Schiff staining, LCN2: lipocalin 2, LTL: lotus tetragonolobus lectin, mtDNA: mitochondrial DNA, TMRE: tetramethylrhodamine, ATP: adenosine triphosphate.
Melatonin-induced SIRT3 activation results in TFAM-K154 deacetylation
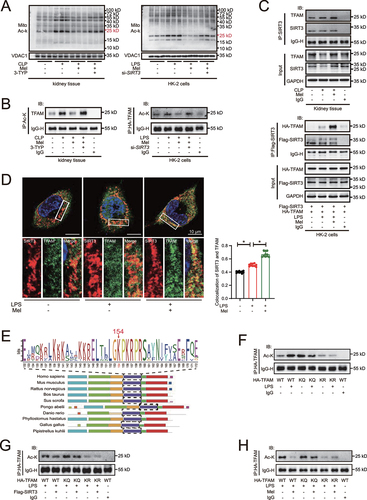
To explore the underlying mechanism of melatonin-promoted mitophagic flux, the acetylation of mitochondrial proteins were screened at first. Melatonin administration decreased the acetylation levels of mitochondrial proteins () but not non-mitochondrial proteins (Figure S5A) in kidney tissue of CLP mice and in LPS-treated HK-2 cells. However, the effects were reversed by addition of 3-TYP. According to the mitochondrial localization and molecular mass of protein, as well as previous literature screening, from the result of co-IP/MS, we speculated that the band with the most pronounced acetylation levels and near the molecular mass of 24 kD was TFAM (Figure S5B, C and D). We further confirmed that the acetylation levels of TFAM were decreased after melatonin treatment but were reversed after SIRT3 deficiency or inhibition, indicated by immunoprecipitation (IP) in mouse kidney tissue and HK-2 cells (). Co-IP analysis revealed that melatonin was likely to induce the physically interaction of SIRT3 with TFAM in both mouse kidney tissue and HK-2 cells (). Also, immunofluorescence analysis showed that melatonin increased SIRT3 colocalized with TFAM after LPS stimulated (). Previous study has shown that TFAM-K154 site was a major deacetylation target of SIRT3 [Citation21]. Using the MEME suite [Citation23], we conducted a sequence alignment of TFAM and the result showed that K154 site (in human species) was highly conserved among multiple species (). We created TFAM-K154 site mutations by replacing Lys (K) with Gln (Q) to mimic an acetylated lysine, whereas Lys (K) with Arg (R) to mimic a deacetylated lysine. These mutations did not affect the physically interaction of SIRT3 with TFAM (Figure S5E). The administration of LPS increased the acetylation of WT TFAM but neither in TFAMK154Q nor in TFAMK154R in HK-2 cells (), suggesting that TFAM-K154 was the major acetylation site upon LPS challenge. Additionally, the IP results showed that the overexpression of SIRT3 () and the administration of melatonin () in HK-2 cells decreased LPS-induced acetylation of WT TFAM but neither in TFAMK154Q nor in TFAMK154R, indicating that TFAM-K154 was the major deacetylation site after SIRT3 overexpression and melatonin administration. Moreover, LPS stimulation decreased TFAM’ mitochondrial translocation and promoted nuclear translocation. However, melatonin enhanced the mitochondrial translocation of TFAM, and attenuated its nuclear translocation at the same time, while these effects was blocked by 3-TYP application (Figure S5F). All these data demonstrates that melatonin-induced SIRT3 activation results in TFAM-K154 deacetylation.
Figure 5. Melatonin-induced SIRT3 activation results in TFAM-K154 deacetylation. (A) acetylation on mitochondrial protein was determined by western blots using pan-acetylated lysine antibody. (B) the acetylation of TFAM in kidney tissue of mice and HK-2 cells were examined by immunoprecipitation and western blot. (C) the physical interaction between SIRT3 and TFAM in kidney tissue of mice and HK-2 cells were determined by co-immunoprecipitation. (D) the immunofluorescence analysis showed that SIRT3 colocalized with TFAM (SIRT3: red, TFAM: green, DAPI: blue, scale bar: 10 μm, n = 10). The data are presented as the mean ± SD and *P < 0.05. Statistical significance was assessed by one-way ANOVA. (E) sequence alignment of TFAM among multiple species was analyzed by the MEME suite. (F) the acetylation of TFAM in HK-2 cells with or without LPS-stimulation was examined by immunoprecipitation and western blot. (G) the acetylation of TFAM in HK-2 cells with or without SIRT3 overexpression was examined by immunoprecipitation and western blot. (H) the acetylation of TFAM in HK-2 cells with or without melatonin administration was examined by immunoprecipitation and western blot. Mito: mitochondria, Ac-K: acetylated lysine, LPS: lipopolysaccharide, Mel: melatonin, CLP: cecal ligation and puncture.
SIRT3-induced TFAM deacetylation is indispensable for melatonin to promote mitophagic flux
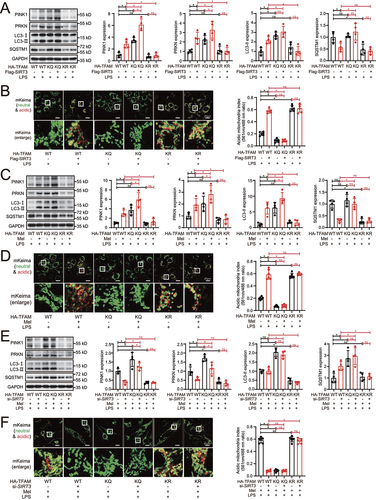
The results of western blot showed that TFAMK154Q mutation to mimic TFAM acetylation evidently increased the expression of PINK1, PRKN, LC3-II, and SQSTM1 in LPS-treated HK-2 cells, even after SIRT3 overexpression (). The same result was obtained in mKeima analysis in which red mKeima fluorescence was almost completely loss in LPS-treated TFAMK154Q HK-2 cells even with SIRT3 overexpression (). On the contrary, TFAMK154R mutation to mimic TFAM deacetylation significantly decreased the expression of PINK1, PRKN, LC3-II, and SQSTM1 in both with and without SIRT3 overexpression in LPS-treated HK-2 cells. Again, mKeima analysis revealed that the red mKeima fluorescence was well preserved (). These results suggest that the deacetylation of TFAM is on downstream of SIRT3, and more importantly, is critical for promotion of mitophagic flux. Moreover, shown by western blot and mKeima analysis, melatonin treatment also promoted mitophagic flux in WT TFAM but not in TFAMK154Q mutation HK-2 cells, while TFAMK154R mutation preserved the mitophagic flux with or without melatonin in LPS-treated HK-2 cells (). These indicate that TFAM-K154 deacetylation is equally required for melatonin to promote mitophagic flux. We further explored the role of melatonin-activated SIRT3 in TFAM deacetylation-mediated promotion of mitophagic flux. SIRT3 knockdown blocked melatonin-activated mitophagic flux in WT TFAM but not in TFAMK154Q mutation by western blot and mKeima analysis, while the SIRT3 knockdown did not affect melatonin-induced preservation of mitophagic flux in TFAMK154R mutation (). Collectively, all these results suggested that SIRT3-induced TFAM-K154 deacetylation is required for melatonin to promote mitophagic flux.
Figure 6. SIRT3-induced TFAM deacetylation is indispensable for melatonin to promote mitophagic flux. (A) representative western blot with densitometric analysis of protein expression of PINK1, PRKN, LC3-II and SQSTM1 in HK-2 cells with or without SIRT3 overexpression; and the protein expression levels were standardized relative to the level of GAPDH; n = 4. (B) mKeima was expressed in HK-2 cells with or without SIRT3 overexpression, and live cell was imaged by confocal microscopy (mKeima-561 nm: red; mKeima-488 nm: green; scale bar: 20 μm); 561 nm/488 nm mKeima was statistically quantified; n = 6. (C) representative western blot with densitometric analysis of protein expression of PINK1, PRKN, LC3-II and SQSTM1 in HK-2 cells with or without melatonin administration; and the protein expression levels were standardized relative to the level of GAPDH; n = 4. (D) mKeima was expressed in HK-2 cells with or without melatonin administration, and live cell was imaged by confocal microscopy (mKeima-561 nm: red; mKeima-488 nm: green; scale bar: 20 μm); 561 nm/488 nm mKeima was statistically quantified; n = 6. (E) representative western blot with densitometric analysis of PINK1, PRKN, LC3-II and SQSTM1 in HK-2 cells with or without SIRT3 knockdown; and the protein expression levels were standardized relative to the level of GAPDH; n = 4. (F) mKeima was expressed in HK-2 cells with or without SIRT3 knockdown, and live cell was imaged by confocal microscopy (mKeima-561 nm: red; mKeima-488 nm: green; scale bar: 20 μm); 561 nm/488 nm mKeima was statistically quantified; n = 6. The data are presented as the mean ± SD. Statistical significance was assessed by one-way ANOVA and *P < 0.05. LPS: lipopolysaccharide, Mel: melatonin.
Neither application of melatonin nor intervention of TFAM acetylation changed the transcription levels of genes related to mitophagy (PINK1, PRKN, LC3, SQSTM1) and lysosomal biogenesis (LAMP2, CTSB and ATP6V0) (Figure S6A and B). Previous literature suggested that acetylation of TFAM at K154 impaired mitochondrial biogenesis [Citation21]. Besides, mtDNA release and mitochondrial damage promoted inflammatory responses in AKI [Citation24]. As expected, melatonin treatment or TFAM-K154 deacetylation promoted mitochondrial biogenesis and reduced inflammatory responses (Figure S6C and D).
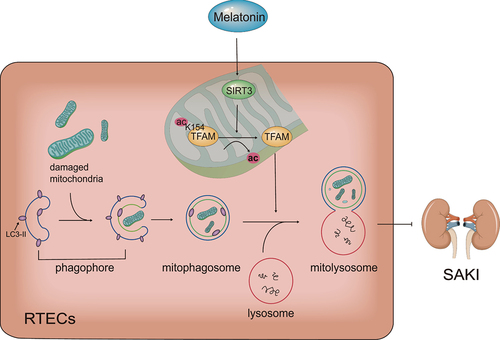
Collectively, our main results show that melatonin attenuates sepsis-induced acute kidney injury by promoting mitophagy through SIRT3-mediated TFAM deacetylation ().
Figure 7. Schematic diagram of the mechanism: Melatonin promotes SIRT3-induced deacetylation of TFAM-K154, thereby improve mitophagic flux to attenuate SAKI. SIRT3: Sirtuin 3, TFAM: transcription factor A, mitochondrial, ac: acetylation, SAKI: sepsis-induced acute kidney injury, RTECs: renal tubular epithelial cells.
Discussion
We have been focused on the clinical application of melatonin [Citation25]. Melatonin as clinical agents is guaranteed in security even far beyond supraphysiological dose [Citation26]. A randomized clinical trial found that melatonin helped to reduce the development of sepsis in patients with COVID-19 infection [Citation27]. A case-control study revealed that melatonin has beneficial effect on neonatal sepsis with reduction in the inflammation response and mortality [Citation28]. A retrospective cohort study showed that melatonin had renoprotective effects in vancomycin-related AKI [Citation29]. We confirmed that septic patients with AKI had higher plasma levels of melatonin. It is reported that melatonin not only secreted from pineal gland but also synthesized by mitochondria in many other organs in response to mitochondrial injury [Citation30]. Furthermore, plasma levels of melatonin in patients with AKI recovery were higher than that in patients without AKI recovery, and patients with high plasma melatonin level had faster recovery after SAKI. Therefore, we speculate that the increase of plasma melatonin is a compensatory response to SAKI. Additionally, plasma melatonin level was associated with the content of urinary mtDNA but not strongly associated with levels of Scr, BUN and eGFR on the day of sample acquisition. The indicator of Scr, BUN and eGFR have been more or less associated with glomerular function, but urinary mtDNA has been directly associated with renal mitochondrial injury. This suggests that melatonin level might be correlated with renal mitochondrial injury but not necessarily present with clinical indicator of renal dysfunction. It is also suggested that elevated plasma melatonin in response to SAKI can attenuate mitochondrial injury of renal tubular epithelial cells. Hence, exogenous melatonin administration may to be a potential therapeutic strategy for SAKI. Further confirmation by randomized clinical trial is required to evaluate the beneficial effect of melatonin on SAKI patients.
We have been working on exploring the potential pathophysiologic mechanisms and the treatment of SAKI. Our previous studies confirm that autophagy activation can attenuate SAKI [Citation8,Citation9]. While mitochondrial injury plays a key role in development of SAKI, mitophagy, a cell self-protective mechanism, could alleviate mitochondrial injury. Both mitochondrial injury and mitophagy could be regulated by acetylation/deacetylation of mitochondrial protein, whereas SIRT3 is the major mitochondrial deacetylase. Previous study found that, in CLP-induced sepsis mice, SIRT3 activity was decreased, accompanying by mitochondrial damage, but SIRT3 activation by agonists improved mitochondrial function in RTECs [Citation10]. However, its mechanism is not fully explored. Present study further unveils that SIRT3 activation protects mitochondria function by preserving mitophagic flux in CLP mice and in LPS-treated renal tubular epithelial cells and its specific mechanisms.
Melatonin has been regarded as a potent agonist of SIRT3 [Citation16] with protective effect on mitochondria [Citation17]. In this study, we demonstrate that melatonin increases the expression of 28-kD SIRT3 and its protein activity. It has generally been assumed that melatonin could quickly penetrate the membranes of both the cell and the mitochondria due to its high lipophilicity [Citation31]. It is also reported that melatonin could enter both cells and mitochondria via active transport of SLC2A1/GLUT1 transporter [Citation32] or SLC15A1/PEPT1 and SLC15A2/PEPT2 oligopeptide transporters [Citation33]. In this study, melatonin activates recombinant SIRT3 activity in a cell-free system and enhance mitochondrial SIRT3 activity in HK-2 cells, indicating melatonin may act directly on SIRT3 after enter mitochondria. However, our study does not exclude the possibility that melatonin enhance SIRT3 activity through cytoplasmic SIRT3 translocation to the mitochondria or proteolytic processing in the mitochondria. It needs a lot more work to define whether SIRT3 serves as a direct target of melatonin.
As a major mitochondrial deacetylase, SIRT3 involved in the deacetylation of multiple mitochondrial proteins. As we have shown, the band of mitochondrial protein near the molecular mass of 24 kD has the most apparent changes in acetylation level after melatonin administration or SIRT3 downregulation. Previous study showed that SIRT3 decreased the acetylation of TFAM (24 kD) at K154 site to enhance mitochondrial biogenesis in kidney tumor cells [Citation21]. We further confirmed that melatonin promoted SIRT3-induced TFAM-K154 deacetylation. As analyzed in our study, K154 site of TFAM was highly conserved among multiple species, suggesting the deacetylation of TFAM-K154 by SIRT3 are likely to be widespread existence. Although we confirmed the physically interaction between SIRT3 and TFAM, we did not further interrogate the specific details of structural connections between SIRT3 and TFAM, which is worthy of further investigation.
It is reported that the function of lysosomes affects the fusion of mitophagosomes-lysosomes, thereby affecting the integrity of mitophagy flux [Citation34]. It has been found that TFAM deficiency leads to lysosome damage, thereby hindering mitophagic flux [Citation20]. TFAM deficiency can cause the impairment of mitochondrial respiratory chain and the imbalance of NAD/NADH [Citation35,Citation36]. A recent study suggested that local ATP production near the lysosome is necessary for lysosomal function, and NAD around lysosomes is essential for local ATP production [Citation37]. We speculate that the mechanism of TFAM affecting lysosomal function to regulate mitophagic flux relies on NAD/NADH balance. However, further evidence is needed to support this hypothesis.
SIRT3 is implicated in numerous mitophagy processes, e.g., mitophagy initiation [Citation38], mitophagosomes formation [Citation39], mitophagosomes-lysosomes fusion [Citation40]. Specifying to this area for a deeper exploration, the present study further confirms that TFAM acts as a bridge between SIRT3 activation and mitophagic flux preservation. Firstly, we substantiated that down-regulation of SIRT3 with inhibitor or siRNA resulted in subsequent increase of TFAM-K154 acetylation in kidney tissue of CLP mice or in LPS-treated HK-2 cells. Furthermore, as TFAM activity was decreased by K154 acetylation, mitophagic flux was blocked; while TFAM activity was increased by K154 deacetylation, mitophagic flux was enhanced. This suggests that TFAM-K154 deacetylation induced by SIRT3 plays a determining role in mitophagic flux integrity.
It is reported that melatonin-activated autophagy or mitophagy depends on SIRT3 in atherosclerosis [Citation39] and anoxia/reoxygenation injury [Citation41,Citation42]. Not limited in SIRT3, melatonin might regulate mitophagy via multi-targets, such as through AMPK pathway in myocardial ischemia-reperfusion injury [Citation43], through the NR4A1-DNA-PKCS-TP53 pathway in fatty liver disease [Citation44], through EIF2AK4/GCN2-ATF4-BNIP3 in fetal growth [Citation45], etc. The present study found that melatonin increased the expression of PINK1 and PRKN, suggesting enhancement of upstream mitophagic signaling. The results also demonstrated that the melatonin enhanced the degradation of cargo protein SQSTM1, as well as the increase of mKeima-red signaling by inhibiting acetylation of TFAM via SIRT3 activation, suggesting the promotion of mitophagic flux integrity. This suggest that melatonin not only promotes mitophagy initiation but also enhances late mitophagy stage. The TFAM-K154 site deacetylation via SIRT3 is the most central and crucial link in melatonin-enhanced mitophagic flux. And we look forward to using genetically engineered mouse models with TFAM-K154 site mutations in our follow-up research to further confirm SIRT3 activation in mice exerts protective effects through a TFAM-induction of mitophagy.
In summary, we found a new signaling pathway of melatonin in mitigating SAKI, in which TFAM is deacetylated on K154 by melatonin-induced SIRT3 activation. As a clinical drug, melatonin shows great potential for clinical translation in SAKI management. This study also provides rationale for clinical application of melatonin, shedding light on promising treatment of patients with SAKI.
Methods and materials
Patients’ cohort
We identified 70 patients with newly diagnosed sepsis from the intensive care unit of Nanfang hospital (Guangzhou, China). After exclusion of previous cancer diagnoses, chronic kidney disease and pregnant, 48 patients were included in our analysis. AKI was diagnosed according to the KDIGO clinical practice guidelines [Citation46]. Recovery from SAKI was defined as a decrease in Scr below 1.5 times the baseline value and normal urine output (>0.5 ml/kg/h) [Citation47]. Clinical characteristics of the patients at baseline are shown in supplementary table S1–2. Samples were taken within 24 h after diagnosis of sepsis. The human samples used in the study were approved by the Board. The observation study of patients’ cohort was performed in compliance with the Declaration of Helsinki and approved by the Ethics Commission of Nanfang Hospital (Guangzhou, China). All of the study participants provided written informed consent.
Measurement of plasma melatonin in sepsis patients
In 48 patients, the blood was collected at 01:00 to 03 :00 AM within 1–2 h after lights out. After separation, the plasma specimens was stored at − 80°C before test. Plasma melatonin in sepsis patients were measured by human melatonin ELISA kit (Elabscience, E-EL-H2016c). This kit used the competitive-ELISA principle. The micro ELISA plate provided in this kit has been pre-coated with human melatonin. During the reaction, melatonin in samples or standard competes with a fixed amount of melatonin on the solid phase supporter for sites on the biotinylated detection Ab specific to melatonin. Excess conjugate and unbound sample or standard were washed from the plate, and avidin conjugated to HRP were added to each microplate well and incubated. Then a TMB substrate solution was added to each well. The enzyme-substrate reaction is terminated by the addition of stop solution and the color change is measured spectrophotometrically at a wavelength of 450 nm. Then, the concentration of melatonin in the samples was determined by comparing the OD of the samples to the standard curve.
Measurement of urinary mtDNA
Urine from septic patients and mice were centrifuged at 1,000 × g for 5 min to remove intact cells and cellular debris, then was collected and stored at − 80°C before DNA extraction. DNA was isolated from urine samples (200 μl) using serum/plasma DNA circulating kit (TIANGEN, DP339). Seven ng DNA from each sample was put into PCR reactions. PCR was done on Q×200ddPCR System (Bio-Rad) using the following conditions: 95°C for 5 min, 40 cycles of 95°C for 30 s and 57°C for 1 min, and 90°C for 2 min. The results were expressed as copies/µl. Primers of urinary mtDNA for ddPCR detection are:
human MT-ND1 (forward sequence 5’-GGCTATATACAACTACGCAAAGGC-3’ and reverse sequence 5’-GGTAGATGTGGCGGGTTTTAGG-3’);
mouse Mt-Nd1 (forward sequence 5’-GCCAGCCTGACCCATAGCCATAAT-3’ and reverse sequence 5’-GCCGGCTGCGTATTCTACGTTA-3’).
Animal models and survival analysis
C57BL/6 male mice (7–8 weeks) weighing 18–22 g were obtained from the animal lab center of Southern Medical University (Guangzhou, China). The animal experiments were complied with the ARRIVE guidelines and conducted in strict accordance with the recommendations in the Guidelines for the Care and Use of Laboratory Animals (National Institutes of Health, Bethesda, MD, USA). The research programme was approved by the Ethics Committee of Animal Experiments of Southern Medical University. The sepsis mice was established using CLP method as described before [Citation48]. All mice were anesthetized with pentobarbital (50 mg/kg) before the procedure. The chemical reagents with doses of 30 mg/kg melatonin (MCE, HY-B0075), 5 mg/kg 3-TYP (Selleck, S8628) and 50 mg/kg chloroquine (Selleck, S6999) were administered by intraperitoneal injection for consecutive 3 days before CLP. Mice were sacrificed 24 h after CLP for samples of blood and kidney tissue.
For survival study, mice were returned to their cages after awakening from anesthesia. 10 mice were included in each group and recorded every 2 h over a 5-day period. Apnea for more than 1 min was considered to indicate death. Mice that survived for more than 5 days were sacrificed by cervical dislocation.
Renal function and pathology assessment
Renal function was assessed by the levels of Scr and BUN. Both kits for determining Scr and BUN were obtained from Nanjing Jiancheng Bioengineering Institute (CO11-2-1 and C013-2-1). Blood samples were centrifuged at 3500 g for 15 min to obtain the serum. According to the manufacturer’s instructions, Scr and BUN levels were determined colorimetrically.
Renal pathology was assessed by H&E and PAS staining. Mouse kidney tissues were sectioned and fixed with 4% paraformaldehyde overnight. Sections were observed under light microscope after H&E and PAS staining. Six sections were selected for each group. Two researchers blinded to the experiment scored kidney injury from ten random 400× fields from each section based on the percentage of cortical tubular damage: 0 for no damage, 1 for 1–25%, 2 for 26–50%, 3 for 51–75% and 4 for 76–100%.
Kidney sections were stained with lotus tetragonolobus lectin (LTL, Vector laboratories, FL-1321-2) for label renal proximal tubules, DAPI for label nuclei (Bestbio, BB-4133), and LCN2 for RTECs injury. LCN2-positive tubular cells were counted from 200× fields from six section of each group (two random fields of each section).
Cell study
HK-2 cells (human renal proximal tubular epithelial line) were purchased from Kunming Cell Bank (KCB200815YJ) and cultured in DMEM/F12 with 10% FBS in 37°C and 5% CO2 cell incubator. The cells were negative for mycoplasma contamination tests. 10 μg/ml LPS (Sigma, L2630) was used to treat HK-2 cells to mimic SAKI cellular model. 100 μM melatonin and 5 μM 3-TYP or 20 μM chloroquine were administered respectively at the time of LPS stimulation. HK-2 cells were transfected with control small interfering RNA (siRNA), si-SIRT3 (GenePharma), empty plasmid vectors, Flag-SIRT3 plasmid (GeneChem) for 6 h by using opti-MEM and lipofectamine 2000. Cells were transfected with an adenoviral vector expressing HA-TFAM (WT), HA-TFAM K154Q (KQ), HA-TFAM K154R (KR) (GeneChem). The cells were used in experiments after transfection for 36 h.
Antibodies
Anti-LCN2/NGAL/lipocalin 2 (Abcam, ab125075), anti-GAPDH (Proteintech, 60004–1-Ig), anti-SIRT3 (Cell Signaling Technology, D22A3), anti-PINK1 (Cell Signaling Technology, D8G3), anti-PRKN/parkin (Cell Signaling Technology, Prk8), anti-LC3A/B (Cell Signaling Technology, 4108), anti-SQSTM1 (Proteintech, 18420–1-AP), anti-TFAM (Santa Cruz Biotechnology, SC166965), anti-TOMM20 (Cell Signaling Technology, D8T4N), anti-VDAC1 (Beijing Ray Antibody Biotech, MD10), anti-Flag (Beijing Ray Antibody Biotech, MA4), anti-HA (Beijing Ray Antibody Biotech, MG10), anti-acetyl lysine (ABclonal, A2391), HRP-conjugated anti-mouse (Beijing Ray Antibody Biotech, RM3001) and HRP-conjugated anti-rabbit (Beijing Ray Antibody Biotech, RM3001) antibodies.
Mitochondrial function assessment
Mitochondrial ROS (mitoROS) was measured by mitoSOX Red mitochondrial superoxide indicator (Invitrogen, M36008). For the fluorescence intensity assay, HK-2 cells were incubated with mitoSOX for 30 min at 37°C and stained with DAPI for 5 min. Cells were imaged using Zeiss LSM780 confocal microscope and analyzed for mean fluorescence intensity of each 400× fields using ImageJ.
Mitochondrial membrane potential was measured by TMRE probe (Beyotime, C2001). 5 × 10³ cells were seeded in each well of a 96-well plate and incubated with TMRE for 45 min at 37°C. Fluorescence intensity was measured using a multifunctional microplate reader (excitation = 550 nm and emission = 575 nm).
Cell ATP content was measured with CellTiter-Lumi™ plus luminescent assay kit (Beyotime, C0068). According to the manufacturer’s instructions, 100 μl CellTiter-Lumi™ reagent was added to the each well of a 96-well plate and mixed for 2 min. Luminescence was detected with multifunctional microplate reader.
Ultrastructural observation with transmission electron microscopy
Kidney tissues were cryosectioned in 2% formaldehyde and 2.5% glutaraldehyde in 0.1 M sodium cacodylate buffer for 1 h and then washed in PBS for 2 days. The tissues were then fixed in 1% osmic acid, dehydrated with ethanol and acetone gradients, embedded in epoxy resin, and cut into ultrathin sections. The sections were stained with uranyl acetate and lead citrate, and then observed under an H-7500 transmission electron microscope (Hitachi, Tokyo, Japan). The number of autophagosomes and autolysosomes were counted in 20 randomly selected 20,000× fields in each group.
Mitophagic flux analysis
HK-2 cells were infected with mitochondria-targeted Keima (mKeima) adenovirus (GeneChem) for 6 h. Forty-eight hours after mKeima transfection, mKeima fluorescence density was observed using a Zeiss LSM780 confocal microscope. The mKeima protein can be used to detect lysosomal mitochondrial degradation as an indicator to evaluate mitophagic flux. The sensitivity of mKeima to pH can be examined whether the mitochondria is in acidic lysosome (excitation: 561 nm, red) or neutral compartments (excitation: 488 nm, green). Pairs of images for ratiometric analysis of mKeima fluorescence were sequentially collected in 488 nm (green) and 561 nm (red) excitation. Fluorescence density of mKeima was calculated as the ratio of e× 561 nm/488 nm fluorescence integrated density in each 630× fields using ImageJ.
Western blot analysis
Kidney tissue and HK-2 cells were lysed in RIPA buffer containing 1× protease inhibitor cocktail. The protein sample was separated by SDS-PAGE and transferred to PVDF membranes. The membranes were blocked in 5% BSA (GBCBIO, 9048-46-8) for 1 h and incubated with primary antibodies overnight. After secondary antibodies incubation for 1 h, protein bands were visualized via chmiluminescence and quantified by ImageJ.
Immunoprecipitation and co-immunoprecipitation assays
The enriched protein was incubated with 2 μg of antibodies (anti-acetyl lysine, anti-HA, anti-SIRT3, anti-Flag) overnight at 4°C. Then, 20 μl of protein A + G agarose beads (Beyotime, P2012) was added to the mixture and centrifuged at 4°C for 4 h. The beads heated at 100°C for 5 min until protein were separated from beads. The protein amounts were analyzed by western blot.
Immunofluorescence staining
The cells were fixed with 4% paraformaldehyde for 15 min at room temperature, and permeabilized with 0.25% Triton X-100 (GBCBIO, 9002-93-1) for 10 min. Then, the cells were blocked with BSA for 1 h before incubated with primary antibodies overnight at 4°C and secondary antibodies for 1 h at room temperature. DAPI was used to stain the nuclei for 10 min at room temperature. Finally, the cells were observed under confocal laser-scanning microscopy (Zeiss LSM 880, Carl Zeiss) with a 100× oil immersion objective. The results were analyzed using Fiji software.
Statistical analysis
The results were analyzed with SPSS 20.0. The number of samples per group is indicated in the corresponding figure legends as n. Normally distributed continuous variables in the present study were expressed as means ± SD, and the differences between groups were identified with one-way ANOVA or student’s t-test. Non-normal distribution continuous variables were expressed as median [IQR] and the differences between groups were compared using the Mann-Whitney U test. Categorical variables were expressed as the number and percentage, and comparisons between groups were made using the chi-square test or Fisher’s exact test as appropriate. Correlational analyses was used Spearman’s rank correlation analysis for estimating the relationships between melatonin and mtDNA, or Scr, or BUN, or eGFR. Correlational analyses were performed using Spearman’s rank correlation analysis. Survival analysis was performed using Kaplan-Meier plots and compared using the log-rank test. For multiple comparisons of survival analysis, significance were adjusted to P < 0.0167 using the Bonferroni’s correction. In other cases, Differences were considered statistically significant when P < 0.05.
Supplemental Material
Download MS Word (1 MB)Acknowledgements
We thank GeneChem Co. Ltd. (Shanghai, China) for technical assistance with plasmid constructions, GenePharma Co. Ltd. (Suzhou, China) for technical assistance with the design of the siRNA, and PTM Bio Co. Ltd. (Hangzhou, China) for technical assistance with co-IP/MS.
Disclosure statement
No potential conflict of interest was reported by the author(s).
Supplementary material
Supplemental data for this article can be accessed online at https://doi.org/10.1080/15548627.2023.2252265
Additional information
Funding
References
- Uchino S, Kellum JA, Bellomo R, et al. Acute renal failure in critically ill patients: a multinational, multicenter study. JAMA. 2005 Aug 17;294(7):813–818. doi: 10.1001/jama.294.7.813
- Poston JT, Koyner JL. Sepsis associated acute kidney injury. BMJ. 2019 Jan 9;364:k4891. doi: 10.1136/bmj.k4891
- Hoffman RA, Reiter RJ. Pineal gland: influence on gonads of male hamsters. Science. 1965 Jun 18;148(3677):1609–1611. doi: 10.1126/science.148.3677.1609
- Shen M, Cao Y, Jiang Y, et al. Melatonin protects mouse granulosa cells against oxidative damage by inhibiting FOXO1-mediated autophagy: Implication of an antioxidation-independent mechanism. Redox Biol. 2018 Sep;18:138–157.
- Parikh SM, Yang Y, He L, et al. Mitochondrial function and disturbances in the septic kidney. Semin Nephrol. 2015 Jan;35(1):108–119. doi: 10.1016/j.semnephrol.2015.01.011
- Qiu W, An S, Wang T, et al. Melatonin suppresses ferroptosis via activation of the Nrf2/HO-1 signaling pathway in the mouse model of sepsis-induced acute kidney injury. Int Immunopharmacol. 2022 Sep 5;112:109162. doi: 10.1016/j.intimp.2022.109162
- Wang Y, Zhu J, Liu Z, et al. The PINK1/PARK2/optineurin pathway of mitophagy is activated for protection in septic acute kidney injury. Redox Biol. 2021 Jan;38:101767.
- Deng Z, Sun M, Wu J, et al. SIRT1 attenuates sepsis-induced acute kidney injury via Beclin1 deacetylation-mediated autophagy activation. Cell Death Dis. 2021 Feb 26;12(2):217. doi: 10.1038/s41419-021-03508-y
- Sun M, Li J, Mao L, et al. p53 deacetylation alleviates sepsis-induced acute kidney injury by promoting autophagy. Front Immunol. 2021;12:685523. doi: 10.3389/fimmu.2021.685523
- Xu S, Gao Y, Zhang Q, et al. SIRT1/3 activation by resveratrol attenuates acute kidney injury in a septic rat model. Oxid Med Cell Longev. 2016;2016:7296092. doi: 10.1155/2016/7296092
- Wei S, Gao Y, Dai X, et al. SIRT1-mediated HMGB1 deacetylation suppresses sepsis-associated acute kidney injury [journal article]. Am J Physiol Renal Physiol. 2019 Jan 01;316(1):F20–F31.
- Kim SC, Sprung R, Chen Y, et al. Substrate and functional diversity of lysine acetylation revealed by a proteomics survey. Mol Cell. 2006 Aug;23(4):607–618. doi: 10.1016/j.molcel.2006.06.026
- Jin L, Galonek H, Israelian K, et al. Biochemical characterization, localization, and tissue distribution of the longer form of mouse SIRT3. Protein Sci. 2009 Mar;18(3):514–525. doi: 10.1002/pro.50
- Yu W, Gao B, Li N, et al. Sirt3 deficiency exacerbates diabetic cardiac dysfunction: role of foxo3A-Parkin-mediated mitophagy. Biochim Biophys Acta Mol Basis Dis. 2017 Aug;1863(8):1973–1983. doi: 10.1016/j.bbadis.2016.10.021
- Guo Y, Jia X, Cui Y, et al. Sirt3-mediated mitophagy regulates AGEs-induced BMSCs senescence and senile osteoporosis. Redox Biol. 2021 May;41:101915.
- Reiter RJ, Tan DX, Rosales-Corral S, et al. Melatonin mitigates mitochondrial meltdown: interactions with SIRT3. Int J Mol Sci. 2018 Aug 18;19(8):2439. doi: 10.3390/ijms19082439
- Xu S, Li L, Wu J, et al. Melatonin attenuates sepsis-induced small-intestine injury by upregulating SIRT3-mediated oxidative-stress inhibition, mitochondrial protection, and autophagy induction. Front Immunol. 2021;12:625627. doi: 10.3389/fimmu.2021.625627
- Zhang C, Suo M, Liu L, et al. Melatonin alleviates contrast-induced acute kidney injury by activation of Sirt3. Oxid Med Cell Longev. 2021;2021:1–21. doi: 10.1155/2021/6668887
- Bonekamp NA, Jiang M, Motori E, et al. High levels of TFAM repress mammalian mitochondrial DNA transcription in vivo. Life Sci Alliance. 2021 Nov;4(11):e202101034. doi: 10.26508/lsa.202101034
- Baixauli F, Acin-Perez R, Villarroya-Beltri C, et al. Mitochondrial respiration controls lysosomal function during inflammatory T Cell responses. Cell Metab. 2015 Sep 1;22(3):485–498. doi: 10.1016/j.cmet.2015.07.020
- Liu H, Li S, Liu X, et al. SIRT3 overexpression Inhibits growth of kidney tumor cells and enhances mitochondrial biogenesis. J Proteome Res. 2018 Sep 7;17(9):3143–3152. doi: 10.1021/acs.jproteome.8b00260
- Hu Q, Ren J, Ren H, et al. Urinary mitochondrial DNA Identifies renal dysfunction and mitochondrial damage in sepsis-induced acute kidney injury. Oxid Med Cell Longev. 2018;2018:8074936. doi: 10.1155/2018/8074936
- Bailey TL, Johnson J, Grant CE, et al. The MEME suite. Nucleic Acids Res. 2015 Jul 1;43(W1):W39–49. doi: 10.1093/nar/gkv416
- Maekawa H, Inoue T, Ouchi H, et al. Mitochondrial damage causes inflammation via cGAS-STING signaling in acute kidney injury. Cell Rep. 2019 Oct 29;29(5):1261–1273 e6. doi: 10.1016/j.celrep.2019.09.050
- Han Y, Wu J, Qin Z, et al. Melatonin and its analogues for the prevention of postoperative delirium: a systematic review and meta-analysis. J Pineal Res. 2020 May;68(4):e12644. doi: 10.1111/jpi.12644
- Galley HF, Lowes DA, Allen L, et al. Melatonin as a potential therapy for sepsis: a phase I dose escalation study and an ex vivo whole blood model under conditions of sepsis. J Pineal Res. 2014 May;56(4):427–438. doi: 10.1111/jpi.12134
- Hasan ZT, Atrakji D, Mehuaiden DAK. The effect of melatonin on thrombosis, sepsis and mortality rate in COVID-19 patients. Int J Infect Dis. 2022 Jan;114:79–84. doi: 10.1016/j.ijid.2021.10.012
- El-Gendy FM, El-Hawy MA, Hassan MG. Beneficial effect of melatonin in the treatment of neonatal sepsis. J Matern Fetal Neonatal Med. 2018 Sep;31(17):2299–2303. doi: 10.1080/14767058.2017.1342794
- Hong TS, Briscese K, Yuan M, et al. Renoprotective effects of melatonin against vancomycin-related acute kidney injury in hospitalized patients: a retrospective cohort study. Antimicrob Agents Chemother. 2021 Aug 17;65(9):e0046221. doi: 10.1128/AAC.00462-21
- Suofu Y, Li W, Jean-Alphonse FG, et al. Dual role of mitochondria in producing melatonin and driving GPCR signaling to block cytochrome c release. Proc Natl Acad Sci U S A. 2017 Sep 19;114(38):E7997–E8006. doi: 10.1073/pnas.1705768114
- Jou MJ, Peng TI, Hsu LF, et al. Visualization of melatonin’s multiple mitochondrial levels of protection against mitochondrial Ca(2+)-mediated permeability transition and beyond in rat brain astrocytes. J Pineal Res. 2010 Jan;48(1):20–38. doi: 10.1111/j.1600-079X.2009.00721.x
- Hevia D, Gonzalez-Menendez P, Quiros-Gonzalez I, et al. Melatonin uptake through glucose transporters: a new target for melatonin inhibition of cancer. J Pineal Res. 2015 Mar;58(2):234–250. doi: 10.1111/jpi.12210
- Huo X, Wang C, Yu Z, et al. Human transporters, PEPT1/2, facilitate melatonin transportation into mitochondria of cancer cells: an implication of the therapeutic potential. J Pineal Res. 2017 May;62(4):e12390. doi: 10.1111/jpi.12390
- Osellame LD, Rahim AA, Hargreaves IP, et al. Mitochondria and quality control defects in a mouse model of gaucher disease–links to parkinson’s disease. Cell Metab. 2013 Jun 4;17(6):941–953. doi: 10.1016/j.cmet.2013.04.014
- Santidrian AF, Matsuno-Yagi A, Ritland M, et al. Mitochondrial complex I activity and NAD+/NADH balance regulate breast cancer progression. J Clin Invest. 2013 Mar;123(3):1068–1081. doi: 10.1172/JCI64264
- Larsson NG, Wang J, Wilhelmsson H, et al. Mitochondrial transcription factor a is necessary for mtDNA maintenance and embryogenesis in mice. Nat Genet. 1998 Mar;18(3):231–236. doi: 10.1038/ng0398-231
- Yagi M, Toshima T, Amamoto R, et al. Mitochondrial translation deficiency impairs NAD(+) -mediated lysosomal acidification. EMBO J. 2021 Apr 15;40(8):e105268. doi: 10.15252/embj.2020105268
- Wei T, Huang G, Gao J, et al. Sirtuin 3 deficiency accelerates hypertensive cardiac remodeling by impairing angiogenesis. J Am Heart Assoc. 2017 Aug 19;6(8). doi: 10.1161/JAHA.117.006114
- Ma S, Chen J, Feng J, et al. Melatonin ameliorates the progression of atherosclerosis via mitophagy activation and NLRP3 inflammasome inhibition. Oxid Med Cell Longev. 2018;2018:9286458. doi: 10.1155/2018/9286458
- Kim TS, Jin YB, Kim YS, et al. SIRT3 promotes antimycobacterial defenses by coordinating mitochondrial and autophagic functions. Autophagy. 2019 Aug;15(8):1356–1375. doi: 10.1080/15548627.2019.1582743
- Wu J, Yang Y, Gao Y, et al. Melatonin attenuates anoxia/reoxygenation injury by inhibiting excessive mitophagy through the MT2/SIRT3/FoxO3a signaling pathway in H9c2 cells. Drug Des Devel Ther. 2020;14:2047–2060. doi: 10.2147/DDDT.S248628
- Bai Y, Yang Y, Gao Y, et al. Melatonin postconditioning ameliorates anoxia/reoxygenation injury by regulating mitophagy and mitochondrial dynamics in a SIRT3-dependent manner. Eur J Pharmacol. 2021 Aug 5;904:174157. doi: 10.1016/j.ejphar.2021.174157
- Zhang Y, Wang Y, Xu J, et al. Melatonin attenuates myocardial ischemia-reperfusion injury via improving mitochondrial fusion/mitophagy and activating the AMPK-OPA1 signaling pathways. J Pineal Res. 2019 Mar;66(2):e12542. doi: 10.1111/jpi.12542
- Zhou H, Du W, Li Y, et al. Effects of melatonin on fatty liver disease: The role of NR4A1/DNA-PKcs/p53 pathway, mitochondrial fission, and mitophagy. J Pineal Res. 2018 Jan;64(1):e12450. doi: 10.1111/jpi.12450
- Zhu HL, Shi XT, Xu XF, et al. Melatonin protects against environmental stress-induced fetal growth restriction via suppressing ROS-mediated GCN2/ATF4/BNIP3-dependent mitophagy in placental trophoblasts. Redox Biol. 2021 Apr;40:101854.
- Ostermann M, Bellomo R, Burdmann EA, et al. Controversies in acute kidney injury: conclusions from a kidney disease: improving global outcomes (KDIGO) conference. Kidney Int. 2020 Aug;98(2):294–309. doi: 10.1016/j.kint.2020.04.020
- Zhao GJ, Xu C, Ying JC, et al. Association between furosemide administration and outcomes in critically ill patients with acute kidney injury. Crit Care. 2020 Mar 4;24(1):75. doi: 10.1186/s13054-020-2798-6
- Rittirsch D, Huber-Lang MS, Flierl MA, et al. Immunodesign of experimental sepsis by cecal ligation and puncture. Nat Protoc. 2009;4(1):31–36. doi: 10.1038/nprot.2008.214