
 ?Mathematical formulae have been encoded as MathML and are displayed in this HTML version using MathJax in order to improve their display. Uncheck the box to turn MathJax off. This feature requires Javascript. Click on a formula to zoom.
Abstract
We use Census microdata for 2016 to investigate migrants’ labor market outcomes in Ireland, a ‘new’ country of immigration. EEA migrants can live and work in Ireland without restriction: for non-EEA migrants, immigration is strictly managed. EEA East European men and women have low unemployment rates but very low rates of professional/managerial employment. Non-EEA migrants tend to have higher unemployment rates but also high rates of work in professional/managerial occupations. Migrants from countries with high asylum flows are especially disadvantaged in the labor market, particularly men. Black respondents have poorer labor market outcomes than Whites, regardless of origin country or migration motive, but not Asians. We reflect how policies governing migration and asylum in Ireland affect who comes to Ireland and their labor market outcomes.
1. Introduction
Many EU countries struggle with persistently high unemployment rates among migrant groups (Heath & Cheung, Citation2007; Yaojun & Heath, Citation2020). Authors have highlighted both origin and destination country factors contributing to this effect (Fleischmann & Dronkers, Citation2010; Van Tubergen et al., Citation2004). Ireland is a ‘new country of immigration’, and its migrant population differs from many other EU countries. One distinctive feature is that most migrants from other EU countries can come to live and work in Ireland without restriction, and many do: EU migrants made up around three-quarters of residents born abroad in 2019. EU migrants primarily come to Ireland for work, while non-EU migrants come to Ireland primarily to study or to work (McGinnity et al., Citation2020b). International protection is another relevant source of Ireland’s migrant population, though prior to 2022, the number of displaced persons in Ireland is lower than in many other EU countries.
Another distinctive feature of Ireland’s migrant population is that in general migrants are highly skilled. Many have higher educational qualifications than Irish-born, particularly those from Western Europe and Asian countries (McGinnity et al., Citation2020b). Many migrants are also English-speaking, and indeed many migrants from non-EEA countries such as the United States, Nigeria and India have excellent English language skills: East Europeans tend to have lower self-report English language skills (ibid.). A final distinctive feature of migrants in Ireland is that a significant minority of those of non-EU origin are now Irish citizens, just under 45 per cent (ibid.). This paper uses complete Census microdata on all first-generation immigrants living in Ireland in April 2016 to explore how some of these features are associated with unemployment and occupational attainment. Previous research has shown that voluntary surveys can understate the migrant population, due to non-response (Aichberger et al., Citation2013): research on migrants is often hampered by low numbers. Social surveys do not survey people living in communal accommodation, such as direct provision centers for asylum seekers. Using a full population census allows us to overcome some of these limitations.
First, we look at how unemployment and occupational attainment vary by some channels that migrants might use to arrive in Ireland. These are the European free movement of people (using their country of birth), the restricted mobility channels for migrants outside of the EU used for employment, study or family reunification reasons, with a particular focus on those who come from outside the EU who are likely seeking asylum. To do this we use a measure designed to capture the likelihood that migrants came to Ireland seeking political asylum (asyratio). Second, we consider how migrants from different regions of origin vary according to gender. Third, we consider the importance of ethnicity. Given previous evidence of ethnic discrimination based on ethnicity in the Irish labor market (McGinnity et al., Citation2018), we also consider migrants’ ethnicity as a factor associated with labor market outcomes. Data on the ethnicity of workers is rarely available in Ireland and the Census is one of the few sources for such data.
Although census data is limited in the number and scope of measures it collects, it contains data on all migrants living in Ireland in April 2016. As a result, we can distinguish non-EEA regions of origin to an extent not possible in previous research in Ireland, given the diverse range of countries of origin. As an in-depth analysis of one country using a Census of population, this paper contributes to a body of literature on the role of origin in understanding migrant labor market integration (Kogan, Citation2006; Peters et al., Citation2018).
2.1. Migration to Ireland: Policy and flows
State-level policies and laws shape access channels and purposes of migration—which migrants can come to Ireland, and under what conditions they can work or study when they arrive.
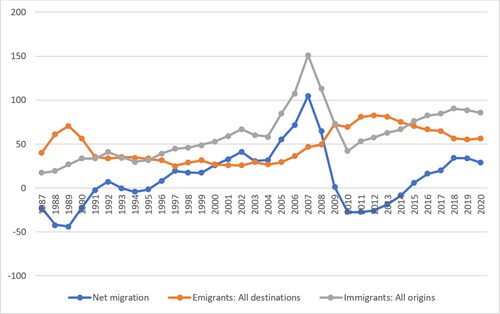
Ireland is typically characterized as a ‘new country of immigration’ (OECD., Citation2018) Indeed for most of the twentieth century, Ireland was a country of net emigration, until the economic boom known as the ‘Celtic Tiger’, along with the eastward expansion of the European Union in 2004, helped to bring about much greater diversity in the population. shows that in the recession of the late 1980s, net migration was negative but that during the 1990s levels of immigration increased slowly, and by 1996 net migration became positive, continuing to increase during the economic boom (from the mid-1990s to 2007). A major peak of immigration occurred after 2004, when ten new Member States joined the EU, before falling during the Great Recession (2008–2011) and recovering after 2015.
Figure 1. Estimated immigration, emigration, and net migration, Ireland (in thousands). Source: CSO Statbank figures, series PEA03. Note: Year to April of reference year.
EEA nationals may move to Ireland and take up employment without restriction.Footnote1 Most migration to Ireland is from within the EEA. UK-born migrants—treated here as EEA as the analysis predates Brexit—are particularly important in Ireland, given their importance in terms of size, their longer history of migration to Ireland and the common travel area. One-third of all migrants born abroad living in Ireland in 2016 were born in the UK (including Northern Ireland).Footnote2 An additional 28 per cent were born in EEA countries of Eastern Europe, dominated by Polish migrants (13.6 per cent of all migrants).Footnote3 Favell (Citation2008) argues that EU freedom of movement results in different patterns of migration in Europe, more flexible and complex than before. Polish migration to Ireland has been substantial: by 2016 Polish nationals made up 2.7 per cent of the total population in Ireland.
Reyneri and Fullin (Citation2008) found that in old Northern and Central Europe, East European migrants have high unemployment but when employed, relatively skilled jobs. In ‘new immigration countries’ in Southern Europe, East European migrants have low unemployment rates but also very low-skilled jobs. Previous research in Ireland has found East European migrants—mainly Poles—to be concentrated in low skilled jobs (McGinnity et al. , Citation2018), with evidence of overeducation, occupational downgrading, and a significant wage penalty among this group (Barrett et al., Citation2016; Voitchovsky, Citation2014).
Non-EEA nationals are subject to managed migration policy and require permission to work. Employment permits differ but as most are for high-skilled occupations, this influences who comes to work in Ireland from outside the EEA: these migrants are typically highly educated because of employment permit restrictions, and often have work arrangements agreed upon arrival.
Hypothesis 1: EEA migrant groups will have higher employment and lower unemployment rates, though when employed, non-EEA migrants will have better quality jobs.
Previous literature has highlighted how migrant women may be doubly disadvantaged by both gender and migration status, though this varies considerably by country of origin (Fleischmann & Höhne, Citation2013; Donato et al., Citation2014). For some migrant groups, employment rates are more linked to their gender norms and family employment in their country of origin (ibid.). In addition, to the extent that women may be ‘tied movers’, women in couples may make choices that maximize the couple’s or family’s earnings, but results in them having lower employment rates and reduced earnings (Cooke et al., Citation2009). In Ireland, for non-EU women, this may be linked to work permissions, if they have come with a spouse.
Previous research has also tended to find lower occupational attainment among migrant women than both native women and migrant men (Powers & Seltzer, Citation1998; Raijman & Semyonov, Citation1997). Analysis by Kogan and Weißmann (Citation2013) found consistent gender inequalities in the German migrant labor market, where female migrants are concentrated in occupations of lower status, and earn lower wages than their male counterparts. Kingston (Citation2016) examining gender differences in occupational attainment of recent Polish migrants to Ireland in 2011, finds lower attainment among migrant women than men in Germany, the UK and the Netherlands. However she finds no occupational disadvantage for Polish female migrants in Ireland, and attributes this to the effect of the recession in Ireland being particularly severe for men and especially male migrants (see also Barrett & Kelly, Citation2012). For this reason we analyze both unemployment and the probability of being in a high-skilled job for men and women separately.
Another migration channel relates to those seeking international protection. Non-EEA nationals fleeing persecution may be granted international protection in Ireland and numbers grew sharply in the late 1990s. While the process was intended to be a short one, in practice some applicants wait years to receive a decision (Arnold et al., Citation2018). In 2016, the year of the Census data, protection applicants were not permitted to enter the labor market while they waited for a decision.
International research has highlighted the potential detrimental effect of protracted asylum procedures on subsequent employment (Bakker et al., Citation2016). O’Connell (Citation2019) suggests that this extended period out of the labor market led to a negative effect on the future employment prospects of those granted international protection, particularly for those born in Africa.
Hypothesis 2: Migrants who have come through the protection system will have poorer labour market outcomes, even after accounting for language, education, duration in Ireland and ethnicity.
2.2. Host country response: Discrimination and the role of ethnicity
Often differences in education, experience, language and duration do not adequately explain the labor market disadvantage observed for some migrants (McGinnity et al., Citation2020b). Labor market integration may be influenced by the host country response to migrants and immigration, as well as the channels used to arrive in the host country.
Whether discrimination is due to the employer preference for ethnic majority group (‘taste based’), or statistical discrimination, where employers use migrant/ethnic minority status as a proxy for productivity, discrimination implies that despite having the same level of education, experience and labor market skills, some groups will always have poorer outcomes in the labor market (OECD., Citation2013). The presence of discrimination is a powerful counter to theories of assimilation; in the presence of discrimination, certain groups will not achieve their potential and integrate fully into the labor market without further intervention. The literature on discrimination has centered on racial or ethnic discrimination, showing that while White migrants can experience discrimination, nonwhite migrants in predominantly White societies experience higher levels of discrimination (Zschirnt & Ruedin, Citation2016).
For example, Dustmann et al. (Citation2003) report an employment gap between migrants and non-migrants using UK data. Controlling for compositional and geographical factors explained the difference between white migrants and UK-born workers. However, the gap remained significant between nonwhite migrants and UK-born workers, which suggests additional penalties for nonwhite workers of a similar background.
In Ireland McGinnity et al. (Citation2018) find Black adults are significantly less likely to be employed than White Irish adults, controlling for a range background characteristics. The Asian non-Irish group does not differ from White Irish in terms of overall employment rates, and Asian Irish is actually more likely to be working in professional managerial occupations than White Irish (ibid.). When questioned about their experience, Black non-Irish respondents also reported much higher rates of discrimination in both recruitment and in the workplace: this group was five times more likely to report recruitment discrimination than White Irish (ibid.) Joseph (Citation2017), using a mixed-methods study, finds evidence of a racial hierarchy in Ireland, with a ‘White ascendency’ among the migrant groups considered. These findings suggest that people of different ethnicities will have different integration outcomes in Ireland, with Black migrants likely experiencing the worst outcomes. Not all ethnic differences are due to discrimination, of course—cultural factors and religion and social networks may also play a role. We are interested in whether differences remain between different ethnic groups, when region of origin, language and duration living in Ireland is accounted for.
Hypothesis 3: The ethnic composition of migrants will affect labour market chances, with non-White ethnic minority groups faring worse than White ethnic groups.
2.3. Individuals’ characteristics as explanatory variables
Many of the differences and hypotheses above could be explained by group differences in skill and productivity like human capital (primarily education, skills and experience) (Becker, Citation1975). Poorer labor market outcomes among migrants may be due in part to lower educational attainment, so we control for education throughout. Further, language skills are an important part of human capital and efficiency (Geurts & Lubbers, Citation2017; O’Connell, Citation2019). Migrants from English-speaking countries may fare better in the Irish labor market than those from non-English-speaking countries (Barrett and McCarthy Citation2007; O’Connell, Citation2019). While many European countries do not have English as a dominant language, learning in school or exposure to English-language media may lead to high English-speaking ability. Proficiency in the host country language is also important for migrants to be able to leverage their educational qualifications and work experience (Esser, Citation2004).
Further, the longer migrants reside in a host country, the more they will ‘assimilate’ (Borjas, Citation1999). Duration in the country not only increases opportunities to acquire skills and work experience; but also increases social networks and knowledge of ‘how things work’ (Esser, Citation2004). Time spent in the host country has a significant impact on migrant differences in employment, with recent migrants especially vulnerable to occupational attainment penalties (Barrett & Duffy, Citation2008).
We still expect migrants to differ in outcomes after controlling for these measures. Employers in Ireland may not rate migrant educational qualifications as highly as they rate Irish qualifications. Education obtained in less developed countries is often less valued in western countries, which can harm integration, especially for educated migrantsFootnote4 (Duleep & Regets, Citation1999). Further, an Irish field experiment found that with identical CVs, Irish job applicants were twice as likely to be called for interview as applicants of non-Irish ethnicity (McGinnity & Lunn, Citation2011).
3. Materials and methods
3.1. Data source
Migrants have higher chances of survey non-response, especially migrants from Non-EU countries (Aichberger et al., Citation2013, Deding et al., Citation2008). Among migrants, non-response is also more common among lower income migrants and those with less formal education (Aichberger et al., Citation2013). Given the voluntary nature of participating in randomly sampled social surveys, these results show the importance of Census data in measuring integration among migrants.
The Census provides the most thorough data on Ireland’s migrant population through extensive follow-ups, survey translation options, and vast resources. We utilize these benefits in this paper. We use Ireland’s 2016 Census data provided by the Central Statistics Office which contains 4.7 million responses, of which 3.8 million are from respondents born in Ireland, who we include as a reference category throughout. We drop respondents from residual category countries of birth (Other Africa, other Asia, etc.) and focus on migrants from listed countries (789,525 people born outside of Ireland including Northern Ireland). We consider first-generation migrants throughout, as the Census provides no information on parents’ country of birth. As mentioned, we hold respondents born in Ireland in the reference category, comparing all migrants to this non-migrant group.
A significant strength of the Census is the wider array of resources available to enumerators when sampling migrants. This facilitates higher response rates which would not be available with voluntary social surveying techniques. In 2016, translations of the census form were available in 21 languages,Footnote5 which assisted those whose first language was not English. Although the form could only have been completed in English or Irish, the translations provided were of a high standard and were additionally verified by relevant embassies and national statistical bodies before reaching respondents.
3.2. Measures
We consider two indicators of labor market integration which appear regularly in the literature; unemployment and occupational attainment. On the first measure, we consider only labor market participants, those who are working for payment or profit and those who are unemployed. We exclude those whose principal economic status is inactive (students, pensioners and others not looking for or not eligible for work). Although these measures are not mutually exclusive, the respondent chooses one ‘principal’ category in the Census.Footnote6 We consider only those of working age (aged between fifteen and sixty-four) in our analysis.Footnote7 To compare the gender effect between migrant groups, we estimate these models separately for men and women.
Regarding occupational attainment, we restrict the sample to those who are employed. We consider the occupation of their main job to capture those in professional/managerial occupations, semi-skilled, and unskilled manual jobs. There are 26 occupational categories in the data, captured using standard occupational classifications (SOC2010). We focus on 11 occupational subgroups from the top three major occupational groups who are in professional/managerial jobs. For the semi-skilled group, we consider occupational codes 12–21 (for example secretarial and related occupations or skilled construction and building trades) and for the unskilled group we consider the final three categories 23–25 (for example, elementary trades and related occupations). Once again, when estimating the effect, we run the models separately by gender.
There are over 120 countries of origin in the data, we use this information to create two measures. The first is a combined measure for region of birth, which distinguishes respondents from the UK, Poland, Other Western EEA countries, and Other Eastern EEA countries. Outside the EEA we distinguish North America, Australia and New Zealand; Central and South America (dominated by Brazilians) Middle East and North Africa (including the Gulf states, Middle East and North Africa); Sub-Saharan and Southern Africa (for example Nigerians); South Asia (including Pakistan); East Asia (dominated by the Philippines and China), India (as a distinct category), and a Rest of the World category.Footnote8
The second is a respondent’s likelihood of arriving through an international protection channel.
We noted above that Irish migration policy likely has an impact on labor market outcomes. While the Census does not collect information on the person’s reason for arriving in Ireland, we follow the approach of O’Connell (Citation2019) who separates potential refugees from other migrant groups by dividing the number of asylum applications from a given country by the number of respondents from that country in Ireland’s 2016 Census. We refer to this variable as ‘asyratio’:
where subscript
refers to a country of origin and N refers to the total number of people enumerated in the Census from that country.
This ratio is not a measure of whether migrants are asylum seekers.Footnote9 Rather it is a measure of applications lodged, while the Census data refers to the stock of migrants. It is not clear from the UNHCR data what portion of applications is successful.Footnote10 Focusing on applications, rather than the grants themselves comes closer to capturing the migration motive as many applicants may have been granted stay without being recognized as a refugee (Groarke and Brazil, Citation2020).
We also noted that group differences in ethnicity likely have an impact beyond measures like human capital. Measuring ethnicity is difficult (Burton et al., Citation2010). King-O’Riain (Citation2007) highlights the limitations of the Irish Census measure, which is a compromise between the need for simple categories to measure diversity that are easy to understand for respondents, and the complex lived reality of race and ethnicity in Ireland. The resulting self-defined ethnicity measure, which is used here, is a combination of racial and ethnic ‘meta-categories’: White Irish, White non-Irish, Black/Black Irish; Asian/Asian Irish; Other or Mixed ethnicity. Although the measure is not ideal, its coverage is unique.
Finally, we noted that demographic measures—such as age and gender—likely contribute to labor market outcomes. Further these measures may explain differences between migrants and non-migrants, the latter being more likely to be younger. We also include educational attainment, and self-reported English language skills, which are important mechanisms in signaling or proving efficiency to employers. While we do not know whether the education was acquired in Ireland or abroad, McGinnity et al. (Citation2020b) estimate that almost 80 per cent of adult non-Irish nationals were educated abroad, suggesting most migrants secured educational credentials in their home countries. Since self-reported language is a subjective assessment, it may not be an entirely accurate assessment of a respondent’s language ability, and there may be country-specific biases that influence a respondent’s answer (Edele et al., Citation2015).Footnote11
Lastly, we expect some of the differences between migrants to be explained by duration of residence in the host country (Ireland). The measure capturing duration in Ireland is also not ideal. It is based on a question which asks, “Have you ever lived outside of the Republic of Ireland for a continuous period of one year or more?,” followed by the year in which migrants became “usually resident” in Ireland. We subtract this year from the year of the census, and recode the resulting values into categories (0–5, 6–10, 11–15, 16–20, >20) Approximately half of all migrants do not answer these questions, so we include ‘duration missing’ as a category in the regression models which follow.Footnote12 Regarding the most established or the most integrated groups, we include an indicator of whether a migrant is an Irish citizen or not. Importantly, people born abroad to Irish parents may be Irish citizens despite never going through the naturalization process. As many Irish citizens born abroad to Irish parents were born in the UK, we also estimate models excluding those born in the UK as a robustness check. Finally, given the younger nature of certain migrant groups, we analyze the unemployment models by considering only those aged 20 and over as a second robustness check.Footnote13 Neither of these checks alters our results.
We summarize our main measures of interest in and . lists the unemployment rate, our measure of asyratio and the proportion of Irish citizens by our regions of interest, these measures are further split by gender. only considers those who are either employed or unemployed, it does not consider respondents who are inactive. For men, the lowest unemployment rate is recorded for those born in Western EEA countries (7 per cent) and those born in East Asia (9 per cent). The highest unemployment rate is recorded for those born in Sub-Saharan Africa (26 per cent) and Middle Eastern and Northern African countries (24 per cent). Regarding the rate of asylum applicants, the rate is greatest among those born in Sub-Saharan African countries (1.02) and those born in MENA countries (0.66). The rate is consistently low for many western regions. Finally, being an Irish citizen varies substantially across migrant groups. It is most common among men born in the UK (66 per cent) and men from North America (58 per cent), while the lowest rate is recorded among those born in Poland (3 per cent) and Other Western EEA countries (5 per cent).
Table 1. Descriptive statistics for unemployment model.
Table 2. Predicted probability of unemployment by region of birth, citizenship, ethnicity, and duration in Ireland (census 2016).
Among women, the lowest unemployment rate is recorded for those born in Western EEA countries (9 per cent) and those born in North America (11 per cent). The highest unemployment rate is recorded for those born in MENA (46 per cent) and those born in Sub-Saharan Africa (29 per cent). Regarding the rate of asylum applicants, the rate is greatest among women born in Sub-Saharan African countries (1.02) and those born in MENA countries (0.62). The rate is again consistently low for many western regions. Finally, Irish citizenship is most common among women born in the UK (0.70) and women born in Sub-Saharan Africa (0.64), while the lowest rate is recorded among those born in Poland (0.03) and Other Western EEA countries (0.05).
3.3. Estimation
We use binary logistic regression to estimate migrant differences in unemployment. Since the outcome is binary, ordinary least squares estimation is inappropriate. Binary logistic regression relies on estimating the log odds of an event, the formula for this is shown below.
where the log odds of an event occurring
, are calculated using an intercept (
), an estimated effect for a measure like region of birth (
), and a value attached to the estimate (
). This is repeated for n number of controls (
). We use Stata’s logit command throughout.
We use multinomial logistic regressionFootnote14 to estimate differences in occupational attainment. Multinomial logistic regression relies on estimating the log odds of an event, the formula for this is shown below.
where the log odds of an event occurring (
), relative to a reference category (
) are calculated using an intercept (
), an estimated effect for a measure like region of birth (
), and a value attached to the estimate (X1). This is repeated for n number of controls. We use Stata’s mlogit command throughout.
As we use information about the population of migrants, not a sample of migrants, conventional tests of statistical significance are not meaningful. For this reason, we instead present the predicted probability of each outcome,Footnote15 controlling for a range of measures. The full model coefficients are presented in the Appendix for information ( for unemployment and for professional/managerial jobs). As mentioned, we run all models twice, for separate gender groups, to capture the gendered experiences of migrants.
Table 3. Predicted probability of professional/managerial job by region of birth, citizenship, ethnicity, and duration in Ireland (census 2016).
4. Results
4.1. Migrants’ unemployment risk
This section considers group differences in unemployment between migrants. We list the predicted probability of unemployment by region of birth, citizenship, ethnicity, and duration in Ireland in . These estimates are calculated using a model which controls for the person’s region of origin, Irish citizenship, ‘asyratio’, education, language, age, sex, ethnicity, household composition and duration in Ireland. As noted, we consider the model for men and women separately.
We note five estimates in particular. First, is the broad set of differences in unemployment between country groups. Men from the EEA have lower levels of unemployment when compared to men from non-EEA countries, with the notable exception of men from the UK and Northern Ireland. Men from Western EEA countries (9 per cent), Poland (9 per cent), and other Eastern EEA countries (9 per cent) report significantly lower unemployment, when compared to men from non-EEA groups, like MENA (18 per cent), Sub-Saharan Africa (16 per cent), South Asia (15 per cent), and North America (16 per cent). However, men from the UK have a high unemployment rate (19 per cent), which is surprising but has been found in previous research on migrant integration (McGinnity et al., Citation2020b; McGinnity & Lunn, Citation2011).
Among non-EEA men, unemployment rates are higher than for EEA migrants, the highest being those from the MENA group (18 per cent), with many other groups in the range of 11 per cent (Other Europe) to South Asia (15 per cent). It is notable that for some groups (MENA, Sub-Saharan Africa) the predicted unemployment rate in the model is lower than in the descriptive table (), which suggests some of the gaps are explained by factors like ethnicity and international protection system effects. A notable exception to higher non-EEA unemployment is East Asian unemployment (8 per cent) which is similar to EEA groups.
These results are different for women. Although women from East and West EEA report lower unemployment than women born in Ireland (10 to 12 per cent), unemployment for women from MENA countries is exceptionally high (34 per cent), as is unemployment for women born in South Asia (28 per cent) and India (18 per cent). Although these country groups have higher unemployment among men, they suggest that women from these countries face an added penalty in terms of unemployment. The findings may be related to being a ‘tied mover’ (Cooke et al., Citation2009): some of these non-EEA women may not have permission to work if they came with a spouse. In general, we accept hypothesis 1a for both men and women, EEA migrants typically experience lower unemployment rates for both genders, this is especially true for East European migrant groups.
Second, we present the predicted probability of unemployment among men and women with different values of our asylum variable ‘asyratio’. It shows that higher values in ‘asyratio’ are associated with higher chances of unemployment, controlling for the other controls in our model (see ). Results suggest that those who have a very low probability of having come through the protection system (a value of 0 on ‘asyratio’) have the lowest predicted probability of unemployment (13 per cent), holding constant the other measures in the model. In contrast, those with the highest values for ‘asyratio’ have a significantly higher probability of unemployment (37 per cent), holding constant the other measures in the model.
Figure 2. Predicted probability of unemployment for values of asyratio by gender. Source: Census (2016). Authors’ calculations. Labor market participants aged 15–64 years. Notes: Predicted probabilities controlling for region of origin, Irish citizenship, ‘asyratio’, education, language, age, sex, ethnicity, household composition, and duration in Ireland. Model estimates are listed in the Appendix, .
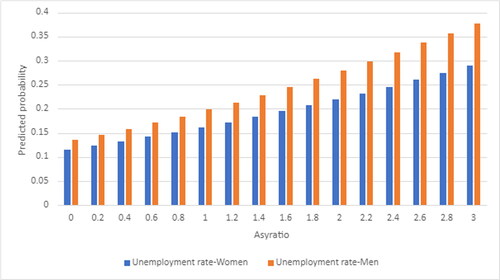
The results for women are similar though, the effect of asyratio is not as strong, when compared to the estimate in male models. For women, not coming through the international protection system is associated with a predicted probability for unemployment of 11 per cent, while those who come from countries with high flows of international protection have much higher predicted probabilities (29 per cent). This effect is independent of a woman’s other characteristics like human capital, language ability and ethnicity. Previous research has found that the scarring effect of labour market absence may have more of an impact on the subsequent employment outcomes of men than women: both men and women experience skills depreciation, but the stigma effect of non-employment is greater for men (Mooi-Reci & Ganzeboom, Citation2015). It may be that the scarring effect of having spent a prolonged period out of the Irish labour market is greater for male than female asylum seekers. This supports hypothesis 2a, those who likely came through the protection system have poorer labour market outcomes, independent of individual characteristics, we accept this hypothesis.
Third, there are differences in unemployment between different ethnic groups, even after we control for region of birth, the chance of coming to Ireland through the protection system, and other compositional measures (see ). Men who are ethnically Black have significantly higher unemployment (21 per cent), when compared to men who are white (14 per cent). This difference does not emerge for Asian men (15 per cent). This effect also emerges for women, with white women (12) reporting lower unemployment rates compared to black women (0.18). Once again, the predicted effect for Asian women (0.13) is closer to white women than to black women. We confirm hypothesis 3a for the Black ethnic group, but not for the Asian group. Once again, we confirm the hypothesis for both genders, but note the lower levels of unemployment among women.
Finally, being an Irish citizen is not associated with lower unemployment for men (). Men who are Irish citizens have similar levels of unemployment (14 per cent) when compared to non-Irish citizens (14 per cent). Our results for women are somewhat stronger, we find that women who are Irish citizens report lower unemployment rates on average (11 per cent) than women who are not Irish citizens (15 per cent), despite controlling for region of birth, likelihood of coming through the international protection system, and other demographic measures.
Migrants differ in their rates of unemployment and neither human capital nor ethnicity and region of origin can explain these differences fully. More specifically, migrants with a high likelihood of having come through the protection system are more likely to be unemployed: while the association between Irish citizenship and unemployment differs depending on the respondent’s region of birth, with those born in non-EEA countries benefiting both. While we find gender effects in these estimates, with migrant women reporting higher unemployment, migrant differences persist in a similar way for both genders, with the exception of certain non-EEA migrant women reporting exceptionally high unemployment rates.
4.2. Occupational attainment among migrants
This section considers occupational attainment as an outcome. We use a multinomial logistic regression model estimating group differences in occupational attainment, controlling for region of origin, ‘asyratio’, education, language ability, age, sex, ethnicity, and duration in Ireland. The model estimates are available in Appendix . These models list the estimated odds ratios of holding either a professional/managerial or an unskilled job, compared to holding a semi-skilled job.
We make five conclusions about migrant groups using predicted probabilities from our model below. Importantly, we consider a different sample to the previous section, since we only focus on employed respondents. As before, we discuss the results for men and women in turn.
First, men born in Ireland have relatively high rates of working in professional or managerial jobs (41 per cent) while Polish and East EEA men have the lowest probability of skilled employment from all migrants considered (23 per cent and 24 per cent respectively for both) (despite having the lowest unemployment ()). Western European men (48 per cent) and UK men (41 per cent) have higher predicted probabilities of holding such jobs when compared to Eastern Europeans. Men from outside the EEA have comparable rates of holding such jobs, with MENA men having the highest probability of having a professional/managerial job (51 per cent), followed by Indian men (43 per cent) and North American and Australian men (47 per cent).
Our results from women are also complex, while occupational attainment was high for women born in Ireland (44 per cent), it was again lower for East EEA women (29 per cent) and Polish women (28 per cent). However, this rate was extremely high for Indian women (70 per cent) and as before was quite high for women from MENA countries (52 per cent). Broadly, non-EEA working women reveal high rates of occupational attainment, similar to men, with migrant women from North America and Oceania (45 per cent), South Asia (47 per cent), and East Asia (43 per cent) reporting higher levels of working in professional/managerial occupations compared to many European migrants.
We reject hypothesis 1b in this instance for both men and women. This is consistent with previous evidence which revealed low levels of unemployment among people born in EEA countries, but also low levels of occupational attainment from some country-of-origin groups, particularly those from Eastern Europe. As such these findings are consistent with those of Reyneri and Fullin (Citation2008) for the ‘new immigration countries’ of Southern Europe. Some country groups combine both high unemployment with high occupational attainment when in work, in particular the MENA group, and other non-EEA groups. This is likely to be linked to Ireland’s migration policy, which limits work permits for non-EEA nationals to highly skilled jobs (see Sec. 2.1).
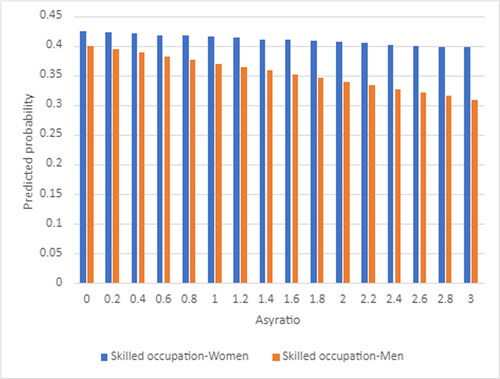
Second, shows that being from a country of origin with a high volume of protection applicants is associated with lower occupational attainment, but only for working men. Men who are unlikely to have come through the international protection system have a higher predicted probability of being in a professional/managerial occupation (40 per cent), when compared to men with the highest value ‘asyratio’ (30 per cent). This suggests the channel used by men has lasting effects on their ability to find high-skilled work, even among those who are working. This effect does not emerge for women. Women who are unlikely to be associated with the protection system report lower predicted probabilities of professional/managerial employment (42 per cent) than women who have come through the system (39 per cent). We accept hypothesis 2b for men but not for women, though the effect of having come through the protection system is much stronger for unemployment risk (not having a job at all) compared to occupational attainment (the probability of having a high-quality job, when employed).
Figure 3. Predicted probability of Skilled Occupation for values of asyratio. Source: Census (2016). Authors’ calculations. Employed aged 15–64 years. Notes: Predicted probabilities controlling for region of origin, Irish citizenship, ‘asyratio’, education, language, age, ethnicity, household composition and duration in Ireland. Model estimates are listed in the Appendix, .
Third, we consider the role of ethnicity in occupational attainment (). We find that a significant difference between white men and men from other ethnicity groups, but this effect operates in different ways for different ethnic groups. White men in employment have higher rates of occupational attainment (40 per cent) when compared to Black men in employment (32 per cent). However, ethnic Asian men in employment (42 per cent) have a similar predicted probability of holding such positions when compared to white men. Looking at the results for women, we again see high rates of attainment among women in employment (42 per cent) and low rates of attainment for Black women in employment (33 per cent). Here too we see high rates of such attainment for Asian women (45 per cent in professional/managerial occupations).
As a result, we cautiously accept hypothesis 3b for the Black ethnic group, but not the Asian ethnic group. These results remain even when we control for migrant’s channel of entry and their education and language skills and duration in Ireland.
5. Discussion
Migration in Ireland is a relatively recent phenomenon, and now closely linked to membership of the EU, as EU migrants can come and live in Ireland without restriction. This paper has shown several important findings tied to the labor market integration of migrants. First, by using Census microdata, we can distinguish labor market outcomes of different region-of-origin groups to an extent previously not possible in Ireland. We show that having a job and job quality are not the same. Some groups have low unemployment but also low occupational attainment (both men and women from EEA East) consistent with findings from other ‘new immigration countries’, albeit in Southern Europe (Reyneri & Fullin, Citation2008)). Some groups have high unemployment but once in work, they are more likely to work in professional or managerial jobs (both men and women from MENA countries or India are important examples here). Others have low unemployment and high occupational attainment (EEA West Europeans, who again report similar results for both genders). And finally, some region-of-origin groups (non-EEA Eastern Europe and Central and South America) hold intermediate positions on both outcomes and for both genders. These are just two, albeit important, labor market outcomes. Further analysis could distinguish occupational position in more detail, in a similar way to Kingston (Citation2016) in her analysis of new Polish migrants, using ISEI. Alternatively, future research using a different data source could analyze earnings differences between migrants and the extent to which occupational sorting helps to explain inequality in wages between migrants and between migrants within different gender groups.
Secondly, the evidence suggests that migrants—especially men—who likely came through the protection system have significantly worse labor market outcomes, regardless of their human capital, the time they have spent in Ireland, their self-rated English language skills or their ethnicity, compared to migrants who did not come through this system. It is important to further explore the mechanisms underlying this effect: is it linked to the duration in the protection system excluded from the labor market, or rather the trauma and disruption prior to and during migration to Ireland, or the stigma attached to being an asylum seeker? The fact that the effect is more salient for men suggests it may be related to the time spent out of the labor market: ideally future research would use work life histories from asylum seekers to investigate whether longer spells of non-work are linked to worse outcomes. Current planned reforms of the Irish asylum system are designed to reduce the time spend in the system (Department of Children, Equality, Disability, Integration and Youth, Citation2021).
Thirdly, we show that even after controlling for education, skills, region of origin and likelihood of having come through the protection system, men and women who are Black have poorer outcomes than White men and White women. In contrast ethnically Asian men and women do not differ from White men and women in their chance of unemployment or high skilled work. This is consistent with higher self-reported discrimination seeking work among the Black ethnic group in Ireland (McGinnity et al., Citation2018), and suggests that measures to combat racial discrimination in hiring may need to be strengthened. While we separately model the effect of ethnicity, region of origin and whether the applicant came through the protection system, we do acknowledge that these measures may not be so easily distinguished by hiring employers or other labor market actors.
The finding that East European migrants have high employment rates but are overrepresented in low-skilled jobs in Ireland is consistent with previous research (Voitchovsky, Citation2014) and for other ‘new’ immigration countries in Southern Europe (Reyneri & Fullin, Citation2011). It is somewhat puzzling that (relatively) highly educated East Europeans accept low-skilled jobs. Using qualitative interview Krings et al. (Citation2013) argue that young, highly educated Polish migrants move to Ireland not only for work realted reasons, but also for broader aspirations like self-development. Some of these factors may help to explain our results. Migration to Ireland may also be viewed as more transitory for many East Europeans, though this would benefit from further investigation of migrant motives and intentions to stay among this group.
Is there evidence of a ‘double disadvantage’ for migrant women in these indicators? For EEA women, unemployment and rates of professional/managerial employment are actually rather similar to those of their male peers (with the exception of higher rates of professional/managerial work among West EEA men than women in this group). Among non-EEA migrants, some groups of women have higher unemployment rates, particularly those from MENA and South Asia, but when they are at work, women from South Asia (including India) and East Asia have very high rates of managerial/professional work. Yet analysis did not examine the labor market participation rates of these groups, and how they vary according to employment rates in the region of origin, or by presence of children for migrant men and women. Employment may have even more non-financial benefits for migrant women than for native-born women, in terms of language acquisition and integrating into social networks, so investigating gender differences in participation and employment rates would be a promising avenue for future research using census microdata.
We acknowledge integration is a process, rather than an end point, and work is just one, albeit important, aspect of life in Ireland. Future research could consider more comprehensive measures of integration, one that is less dependent on migrants’ economic well-being, as Gilmartin and Dagg (Citation2021) suggest. Gilmartin and Dagg (Citation2021) also highlight the role of space and place in integration in Ireland, which is also not investigated here. Given substantial refugee flows to Ireland since the war in Ukraine, and the recent rapid rise in protection applicants (McGinnity et al., Citation2022), considering the reason people come to Ireland and how this influences their labor market outcomes seems even more pressing than ever.
Acknowledgements
We would like to acknowledge the contribution of our former colleague, Eamonn Fahey, to the report on which this paper is based. We would also like to thank Deirdre Lynch, from the Central Statistics Office, for her help with census microdata.
Additional information
Funding
Notes
1 The EEA comprises the countries of the EU plus Iceland, Liechtenstein and Norway.
2 If we focus on citizenship, rather than place of birth, this gives a lower proportion of UK (and EU) in the total non-Irish, as a significant proportion of the UK-born are Irish citizens.
3 Census of Population. CSO Statbank tables E7050 and C0428. EU-East refers to the Member States that joined the EU in 2004, primarily in Eastern Europe.
4 From the Census data, we are unable to differentiate between migrants who have completed qualifications in Ireland from those who have completed them abroad.
5 More information is available here https://www.cso.ie/en/media/csoie/methods/censusofpopulation/Census_2016_Quality_Report_rev_0918.pdf
6 So for example full-time students working for a few hours per week will count as students, as this is their principal economic status. The ILO classification of labour market status is different, as a person doing any hours of paid work counts as employed, and people only count as unemployed if they have done no hours of paid work in the week preceding the survey, have actively sought work in the month prior to the survey and are available for work in the next two weeks.
7 We also test any potential effect of the 15–19 age group (as those in the labour market are a highly select group) by estimating the models for 20–64. See Appendix Table A.4.A.
8 See appendix for a breakdown of region of birth categories.
9 This data, as well as the corresponding information are available here https://www.unhcr.org/refugee-statistics/download/?url=LnhM21
10 There are similar data available on the number of recognitions of refugee status in Ireland. However, using this measure would be misleading as it would not count people that arrived seeking international protection who were refused but were subsequently granted leave to remain.
11 Respondents are asked ‘how well do you speak English’, with 4 response categories ranging from very well to not at all.
12 Omitting this category did not alter our results, estimates available on request
13 These estimates are listed in appendix Table A.4.A (age 20 and over) and Table A.5.A (excluding UK nationals) .
14 The models for occupational attainment were also run using Heckman binary probit models. We used this approach to correct for the fact that occupational attainment models are made up of respondents who are already employed. We found no difference in effects between the Heckman approach and a binary logistic regression, and for this reason we do not consider this form of estimation. Results are available on request.
15 We use Stata’s margin command to calculate the predicted probability of each outcome by our groups of interest. These values are calculated with the other controls held at their observed values.
References
- Aichberger, M. C., Yesil, R., Rapp, M. A., Schlattmann, P., Temur-Erman, S., Bromand, Z., Montesinos, A. H., Mundt, A., Mösko, M., Heinz, A., & Schouler-Ocak, M. (2013). Surveying migrant populations–methodological considerations: An example from Germany. International Journal of Culture and Mental Health, 6(2), 81–95. https://doi.org/10.1080/17542863.2011.642981
- Arnold, S., Ryan, C., & Quinn, E. (2018). Ireland’s response to recent trends in international protection applications, European migration network. Economic and Social Research Institute.
- Bakker, L., Dagevos, J., & Engbersen, G. (2016). Explaining the refugee gap: A longitudinal study on labour market participation of refugees in the Netherlands. Journal of Ethnic and Migration Studies, 43(11), 1–17.
- Barrett, A., & Y. McCarthy (2007). Immigrants in a booming economy: Analysing their earnings and welfare dependence. Labour, 21(4-5), 789–808.
- Barrett, A., & Duffy, D. (2008). Are Ireland’s immigrants integrating into its labor market? International Migration Review, 42(3), 597–619. https://doi.org/10.1111/j.1747-7379.2008.00139.x
- Barrett, A., & Kelly, E. (2012). The impact of Ireland’s recession on the labour market outcomes of its immigrants. European Journal of Population/Revue Européenne de Démographie, 28(1), 91–111. https://doi.org/10.1007/s10680-011-9249-7
- Barrett, A., Bergin, A., Kelly, E., & McGuinness, S. (2016). Ireland’s recession and the immigrant-native earnings gap. In M. Kahanec & K. F. Zimmermann (Eds.), Labor migration, Eu enlargement, and the great recession (pp. 103–122). Springer.
- Barrett, A., McGinnity, F., & Quinn, E. (Eds.). (2017). Monitoring report on integration 2016. ESRI/The Department of Justice and Equality.
- Becker, G. S. (1975). Human capital: A theoretical and empirical analysis, with special reference to education. University of Chicago Press.
- Borjas, G. J. (1999). The economic analysis of immigration. In O. Ashenfelter & D. Card (Eds.), Handbook of labor economics (Vol. 3). North-Holland.
- Burton, J., Nandi, A., & Platt, L. (2010). Measuring ethnicity: Challenges and opportunities for survey research. Ethnic and Racial Studies, 33(8), 1332–1349. https://doi.org/10.1080/01419870903527801
- Cooke, T. J., Boyle, P., Couch, K., & Feijten, P. (2009). A longitudinal analysis of family migration and the gender gap in earnings in the United States and Great Britain. Demography, 46(1), 147–167. https://doi.org/10.1353/dem.0.0036
- Deding, M., Fridberg, T., & Jakobsen, V. (2008). Non-response in a survey among immigrants in Denmark. Survey Research Methods, 2(3), 107–121.
- Department of Children, Equality, Disability, Integration and Youth. (2021). A white paper to end direct provision and to establish a new international protection support service. Government of Ireland.
- Donato, K. M., Piya, B., & Jacobs, A. (2014). The double disadvantage reconsidered: Gender, immigration, marital status, and global labor force participation in the 21st century. International Migration Review, 48(1_suppl), 335–376. https://doi.org/10.1111/imre.12142
- Duleep, H. O., & Regets, M. C. (1999). Immigrants and human-capital investment. American Economic Review 89(2), 186–191.
- Dustmann, C., Fabbri, F., Preston, I., & Wadsworth, J. (2003). Labour market performance of immigrants in the UK labour market. Research Development and Statistics Directorate, London, UK.
- Edele, A., Seuring, J., Kristen, C., & Stanat, P. (2015). Why bother with testing? The validity of immigrants’ self-assessed language proficiency. Social Science Research, 52, 99–123. https://doi.org/10.1016/j.ssresearch.2014.12.017
- Esser, H. (2004). Does the “new” immigration require a “new” theory of intergenerational integration? International Migration Review, 38(3), 1126–1159. https://doi.org/10.1111/j.1747-7379.2004.tb00231.x
- Favell, A. (2008). The new face of East–West migration in Europe Journal of Ethnic and Migration Studies, 34, 701–716.
- Fleischmann, F., & Dronkers, J. (2010). Unemployment among immigrants in European labour markets: An analysis of origin and destination effects. Work, Employment and Society, 24(2), 337–354. https://doi.org/10.1177/0950017010362153
- Fleischmann, F., & Höhne, J. (2013). Gender and migration on the labour market: Additive or interacting disadvantages in Germany? Social Science Research, 42(5), 1325–1345. https://doi.org/10.1016/j.ssresearch.2013.05.006
- Geurts, N., & Lubbers, M. (2017). Dynamics in intention to stay and changes in language proficiency of recent migrants in the Netherlands. Journal of Ethnic and Migration Studies, 43(7), 1045–1060. https://doi.org/10.1080/1369183X.2016.1245608
- Gilmartin, M., & Dagg, J. (2021). Integration as making place. Journal of Immigrant & Refugee Studies, 1–15. https://doi.org/10.1080/15562948.2021.1974148
- Groarke, S., & Brazil, P. (2020). National statuses granted for protection reasons in Ireland (European Migration Network, ESRI Research Series No. 96). The Economic and Social Research Institute.
- Heath, A., & Cheung, S. Y. (Eds.). (2007). Unequal chances: Ethnic minorities in western labour markets. Oxford University Press.
- Joseph, E. (2017). Whiteness and racism: Examining the racial order in Ireland. Irish Journal of Sociology. 26(1):46-70. https://doi.org/10.1177/0791603517737282
- King-O’Riain, R. C. (2007). Counting on the “Celtic Tiger”: Adding ethnic census categories in the Republic of Ireland. Ethnicities, 7(4), 516–542.
- Kingston, G. (2016). An analysis of the labour market integration of immigrants: Examining the role of gender, ethnicity, discrimination and recession [PhD thesis]. Trinity College Dublin.
- Kogan, I. (2006). Labor Markets and Economic Incorporation among Recent Immigrants in Europe. Social Forces, 85(2), 697–721. https://doi.org/10.1353/sof.2007.0014
- Kogan, I., & Weißmann, M. (2013). Immigrants’ initial steps in Germany and their later economic success. Advances in Life Course Research, 18(3), 185–198. https://doi.org/10.1016/j.alcr.2013.04.002
- Krings, T., Bobek, A., Moriarty, E., Salamońska, J., & Wickham, J. (2013). Polish migration to Ireland: ‘Free movers’ in the new European mobility space. Journal of Ethnic and Migration Studies, 39(1), 87–103. https://doi.org/10.1080/1369183X.2012.723250
- McGinnity, F., & Gijsberts, M. (2018). The experience of discrimination among newly arrived Poles in Ireland and the Netherlands. Ethnic and Racial Studies, 41(5), 919–937. https://doi.org/10.1080/01419870.2017.1332376
- McGinnity, F., & Lunn, P. D. (2011). Measuring discrimination facing ethnic minority job applicants: An Irish experiment. Work, Employment and Society, 25(4), 693–708. https://doi.org/10.1177/0950017011419722
- McGinnity, F., Enright, S., Quinn, E., Maitre, B., Privalko, I., Darmody, M., & Polakowski, M. (2020a). Monitoring report on integration 2020. Economic and Social Research Institute (ESRI) Research Series.
- McGinnity, F., Grotti, R., Sarah, G., & Coughlan, S. (2018). Ethnicity and nationality in the Irish labour market. ESRI Research Series.
- McGinnity, F., Privalko, I., Fahey, É., Enright, S., & O’Brien, D. (2020b). Origin and integration: A study of migrants in the 2016 Irish Census. Economic and Social Research Institute/Department of Justice and Equality
- McGinnity, F., Privalko, I., Russell, H., Curristan, S., Stapleton, A. and Laurence, J. (2022) Origin and Integration: Housing and Family among migrants in the 2016 Irish Census. Dublin: Economic and Social Research Institute/Department of Children, Equality, Disability, Integration, Youth. https://doi.org/10.26504/bkmnext422
- Mooi-Reci, I., & Ganzeboom, H. B. (2015). Unemployment scarring by gender: Human capital depreciation or stigmatization? Longitudinal evidence from the Netherlands, 1980–2000. Social Science Research, 52, 642–658. https://doi.org/10.1016/j.ssresearch.2014.10.005
- O’Connell, P. J. (2019). Why are so few Africans at work in Ireland? Immigration policy and labour market disadvantage. Irish Journal of Sociology, 27(3), 273–295. https://doi.org/10.1177/0791603519853767
- OECD. (2013). Discrimination against immigrants – Measurement, incidence and policy instruments. In International migration outlook 2013. OECD Publishing. https://doi.org/10.1787/migr_outlook-2013-7-en
- OECD. (2018). Settling in 2018: Indicators of immigrant integration. OECD Publishing, Paris/European Union.
- Raijman, R., & Semyonov, M. (1997). Gender, Ethnicity and Immigration- Double Disadvantage and Triple Disadvantage among Recent Immigrant Women in the Israeli Labor Market. Gender & Society, 11(1), 108–125.
- Peters, F., Vink, M., & Schmeets, H. (2018). Anticipating the citizenship premium: Before and after effects of immigrant naturalisation on employment. Journal of Ethnic and Migration Studies, 44(7), 1051–1080. https://doi.org/10.1080/1369183X.2017.1367650
- Powers, M. G., & Seltzer, W. (1998). Occupational status and mobility among undocumented immigrants by gender. International Migration Review, 32(1), 21–55. https://doi.org/10.1177/019791839803200102
- Reyneri, E., & Fullin, G. (2008). New immigration and labour markets in Western Europe: A trade-off between unemployment and job quality? Transfer: European Review of Labour and Research, 14(4), 573–588. https://doi.org/10.1177/102425890801400405
- Reyneri, E., & Fullin, G. (2011). Ethnic penalties in the transition to and from unemployment: A West European perspective. International Journal of Comparative Sociology, 52(4), 247–263. https://doi.org/10.1177/0020715211412114
- Van Tubergen, F., Maas, I., & Flap, H. (2004). The economic incorporation of immigrants in 18 western societies: Origin, destination, and community effect. American Sociological Review, 69(5), 704–727. https://doi.org/10.1177/000312240406900505
- Voitchovsky, S. (2014). Occupational downgrading and wages of new Member States immigrants to Ireland. International Migration Review, 48(2), 500–537. https://doi.org/10.1111/imre.12089
- Yaojun, L., & Heath, A. (2020). Persisting disadvantages: A study of labour market dynamics of ethnic unemployment and earnings in the UK (2009–2015). Journal of Ethnic and Migration Studies, 46(5), 857–878.
- Zschirnt, E., & Ruedin, D. (2016). Ethnic discrimination in hiring decisions: A meta-analysis of correspondence tests 1990–2015. Journal of Ethnic and Migration Studies, 42(7), 1115–1134. https://doi.org/10.1080/1369183X.2015.1133279
Appendix
Table A.1.A. Region of birth categories.
Table A.2.A. Logistic regression models for unemployment - Men & Women (Census 2016).
Table A.3.A. Logistic regression models for occupation - men & women (census 2016).
Table A.4.A. Robustness check- unemployment (men and women aged 20 and over) (Census 2016).
Table A.5.A. Robustness check- unemployment (UK origin removed) (Census 2016).
Table A.6.A. Brief explanation of key measures.