
Abstract
Context: No kinetic models presently exist which simulate the effect of chelation therapy on lead blood concentrations in lead poisoning.
Objective: Our aim was to develop a kinetic model that describes the kinetics of dimercaptosuccinic acid (DMSA; succimer), a commonly used chelating agent, that could be used in developing a lead chelating model.
Material and methods: This was a kinetic modelling study. We used a two-compartment model, with a non-systemic gastrointestinal compartment (gut lumen) and the whole body as one systemic compartment. The only data available from the literature were used to calibrate the unknown model parameters. The calibrated model was then validated by comparing its predictions with measured data from three different experimental human studies.
Results: The model predicted total DMSA plasma and urine concentrations measured in three healthy volunteers after ingestion of DMSA 10 mg/kg. The model was then validated by using data from three other published studies; it predicted concentrations within a factor of two, representing inter-human variability.
Conclusions: A simple kinetic model simulating the kinetics of DMSA in humans has been developed and validated. The interest of this model lies in the future potential to use it to predict blood lead concentrations in lead-poisoned patients treated with DMSA.
Introduction
Human exposure to lead has diminished substantially over recent years but lead poisoning continues to occur, mainly due to occupational and non-occupational (hobby/recreational) exposures, and ingestion of (contaminated) food, water, or other lead-containing materials.[Citation1–3]
Chelation therapy in the management of lead poisoning is practised for over five decades but adjustments to the dosing regimen of DMSA are sometimes not straightforward because lead kinetics are complex. The duration of lead exposure strongly influences the body burden of lead and its distribution. After prolonged exposure lead accumulates in bones and teeth, which accounts for over 90% of the body burden. Cessation of chelation is followed by redistribution of lead, mainly from the bone, which is reflected in a rebound increase in the blood lead concentration. As a result, several courses of chelation are usually required in order to substantially diminish the body lead burden. Dimercaptosuccinic acid (succimer; DMSA) is an effective chelator of lead.[Citation4] A typical course of oral DMSA consists of 30 mg/kg body weight/day, for 5 days, often followed by 20 mg/kg/day for 14–21 days. Other regimens exist; however, e.g., repeated 5-day courses of DMSA.[Citation5]
Several kinetic models to describe the behavior of lead in man are available.[Citation6–8] However, no models exist which simulate the effect of chelation therapy on lead concentrations in tissues. Predicting the possible benefit of a chelation therapy with DMSA would facilitate physicians’ decision making on starting a treatment and the estimation of the duration of chelation therapy. To answer these questions, knowledge of the pharmacokinetics of DMSA in the human body is available.
DMSA pharmacokinetics have been assessed in a number of experimental studies, both in animals and humans.[Citation9–13] These have shown that after oral administration to healthy adult volunteers, “total” DMSA is distributed in the body’s extracellular fluid and in blood. In the latter, total DMSA is almost entirely distributed in the plasma and does not penetrate erythrocytes.[Citation10,Citation12] Very little “unaltered” DMSA is found in plasma.[Citation10,Citation12] Unaltered DMSA is the unbound, parent compound; total DMSA consists of unaltered DMSA plus oxidized (disulfide) DMSA; altered DMSA is the difference between total DMSA and unaltered DMSA.[Citation10] DMSA is extensively metabolised to mixed disulfides of cysteine.[Citation9] Ninety-two to ninety-seven percent of the metabolites are bound to albumin with the remainder free in plasma.[Citation10] The formation of DMSA-cysteine mixed disulfides is assumed to occur in the kidney. The percentages of metabolites in urine depend on the time elapsed after administration of DMSA. Of the mixed disulfides found in urine 4 to 6 h after oral administration, 97% are formed of 2:1 mixed disulfide and 3% of 1:1 mixed disulfide.[Citation9] After 14 h, about 13% of DMSA excreted in urine in volunteers given DMSA 10 mg/kg per os is the parent compound.[Citation9] The remaining 87% are metabolites, with the majority (90%) in the form of mixed disulfide cysteine. This knowledge of the pharmacokinetics of DMSA could be used to develop a kinetic model.
Our aim was to develop a simple kinetic model that could describe dimercaptosuccinic acid (DMSA or succimer) kinetics.
Materials and methods
Modelling approach
As the exact nature of the chelating agent remains unknown, we did not distinguish between the DMSA parent compound and its metabolites. So, in this study, whenever the term “DMSA” is used, it should be interpreted as “total DMSA” (bound and unbound parent compound, plus albumin-bound and unbound metabolites).
As DMSA is distributed mainly to extracellular fluid,[Citation14,Citation15] we assumed that a one-compartment model would suffice to describe DMSA kinetics. However, as Asiedu et al. [Citation16] observed enterohepatic recirculation, the inclusion of a gastrointestinal compartment seemed to be mandatory. It should be mentioned that, in humans, the bile is released during and after a meal, in contrast to e.g. rats.
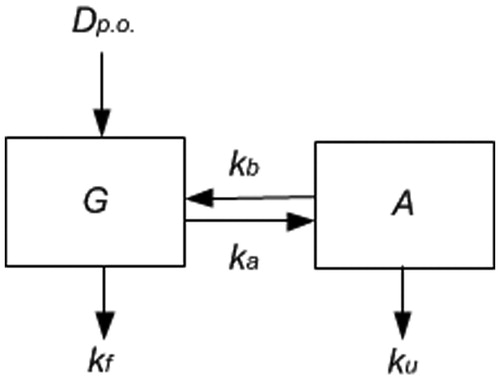
Our model involves two compartments: the first compartment represents only the gastrointestinal tract content, which is a non-systemic compartment. The second compartment represents the internal body system, including plasma, liver and continuous bile flow. As shown in , an oral dose (Dp.o., mg/kg body weight) enters the gut, part of which is excreted at rate kf (h−1) in the faeces and another part is absorbed into the system at rate ka (h−1). DMSA is excreted from the system through the bile at rate kb (h−1) and through the urine at rate ku (h−1). The model’s equations are given in the Appendix. Note that ka incorporates both dissolution and absorption processes: the rates of these processes cannot be identified separately; either the dissolution rate of the capsule content or the subsequent absorption rate may be limiting. However, that be, the resulting apparent absorption rate can be identified. Also note that absorption from the gut and bile release into the gut determines the enterohepatic cycle of DMSA. As an additional parameter, the distribution volume (L/kg body weight) should be known to relate the amount of systemic DMSA to its plasma concentration. The parameter Dp.o. denotes the administration of DMSA and the volume of distribution, VD, relates the amount in the system compartment (A) to the observed systemic plasma concentration (C). This model contains five unknown parameters (four kinetic rates and the distribution volume VD).
Figure 1. Scheme of the two-compartment model. Dp.o. is the oral dose given. G is the gut. A is the rest of the body; kf is the rate of removal of DMSA from the gut into the faeces; ka is the rate of absorption from the gut into the rest of the body; kb is the rate of removal of DMSA from the body into the gut; ku is the rate of removal of DMSA from the body into urine. Note that ks = kb + ku and kg = ka + kf are parameters to be fitted.
Information found in another study [Citation17] permitted us to reduce the number of unknown parameters from 5 to only 3: the total elimination rate from the gut kg = ka + kf, the total elimination rate from the system ks = kb + ku, and the volume of distribution VD. This parameter reduction is based on the fact that the relative excretion of DMSA in urine is assumed to be approximately 20% after oral administration and 81% after intravenous administration.[Citation17] We have assumed the latter percentage to be 80%, for convenience. Detailed equations can be found in the Appendix.
Parameter optimisation
The predictions of the model were compared to DMSA concentration-time curves present in the article of Asiedu et al. [Citation16] In this study, individual plasma and urine DMSA concentrations were reported for three healthy adult volunteers after oral administration of a single DMSA dose of 10 mg/kg (). All volunteers received the same high-fat lunch and dinner 5 h and 10 h after DMSA administration to induce bile flow. In the original article, individual data for only three of the nine volunteers are reported. DMSA was determined by a fluorometric method with precolumn derivatization and column liquid chromatography. The precolumn derivatization was performed with DTT (dithiolthrieitol) for the determination of DMSA in plasma and with MBB (monobromobimane) for the determination of DMSA in urine. The detection limit of the assay for the determination of DMSA in plasma was 0.25 μM and within-run variation and the day-to-day variation was approximately 3–5%.[Citation16]
Table 1. Characteristics of the healthy volunteers used for model calibration and model verification.
The parameter estimation process was performed using the acslX software.[Citation18] In this software, the loglikelihood was optimised to obtain the maximum probability of the observed data given the estimated parameter values. This parameter optimisation procedure was repeated for each volunteer from the Asiedu et al. study.[Citation16] The volume of distribution (VD in L/kg) was assumed to be proportional to body weight (W in kg), while the relative volume of distribution RVD = VD/W was estimated. Predictions were made for a standard weight of 70 kg because the exact weight and gender of the three subjects were not mentioned in the original article.
Model verification data
Subsequently, we verified the accuracy of our model’s predictions by using data from experimental studies,[Citation10,Citation13,Citation17] different from the one used in the parameter optimisation process.[Citation16] One of these studies included lead-poisoned patients (children and adults) and healthy adult volunteers [Citation13] but we used only the data obtained from the healthy volunteers. In these studies, oral DMSA 10 mg/kg body weight was given to healthy volunteers and DMSA blood or plasma concentrations were measured at several time-points. Urine excretion of DMSA was also determined. DMSA plasma concentrations resulting from an oral dose of 10 mg/kg body weight were simulated (median, 2.5 and 97th percentile values) and compared to the observations from the three human volunteers studies mentioned above. We calculated the median, 2.5 and 97.5th percentile predicted values by repeated simulations varying parameter values within their uncertainty intervals.
When blood DMSA concentrations were provided in the experimental study (instead of plasma concentrations), we converted the blood mean DMSA concentrations into plasma mean DMSA concentration using the formula: plasma [DMSA] = blood [DMSA]/CF. The conversion factor “CF” was calculated using the values of DMSA concentrations (in plasma and blood) in of the Maiorino article.[Citation10] The CF equalled 1 at 0.5 h, 0.7 at 1 h, 0.6 between 2 h and 4 h, 0.7 at 6 h and 0.8 at 8 h.[Citation10]
The model’s predictions were evaluated using two criteria: (a) a curve shape of the predicted values similar to the one of the observed values, and (b) predicted AUC’s and Cmax values within a factor 2 of the observed data.[Citation19] This factor 2 represents the inter-human variability.
The performance of the model was assessed by calculating the ratio between the AUCs of the predicted and observed curves. When individual data were available, we used the mean of the different individuals AUC ratios. Observed (mean curve) and predicted (median curve) AUC values for the DMSA plasma and urine concentrations were calculated using the trapezoidal rule. We interpreted the ratio as “the closer the value is to 1, the better the agreement between observation and model prediction”. We also calculated the observed and predicted Cmax values for the DMSA plasma and urine concentrations and assessed the performance of the model in the same way as for the AUCs.
Results
The geometric means of the DMSA total elimination rate (sum of excretion through urine and bile) from the system, ks, the DMSA total elimination rate from the gut (sum of excretion to faeces and absorbed into the system), kg and the relative volume of distribution, RVd, are presented in . The gut total elimination of DMSA was 5 to 6 times faster than the total systemic clearance. The corresponding exponential rates of excretion to faeces, of absorption, of renal and of biliary excretion were 0.4, 1.2, 0.043 and 0.13 (h−1), respectively. Initial distribution phase half-life was about 25 min and elimination phase half-life was about 4.3 h. As a result of the enterohepatic circulation, the effective fraction of dose absorbed was 0.25. The relative volume of distribution ranged between 0.17 and 0.34 L/kg, indicating that the distribution volume of DMSA is mainly restricted to extracellular fluid.
Table 2. Computer fitted model parameters (geometric mean and 95% confidence interval).
shows the model predictions of DMSA plasma concentrations compared to the experimental data from the Asiedu study (for three subjects: 1, 2 and 3). The observed data showed an apparent postprandial peak in plasma DMSA at approximately 11 h after DMSA administration, due to a fat rich dinner activating an enterohepatic cycle. For the three healthy volunteers, the total DMSA concentration-time profiles in plasma were, on average, well predicted with our model: predicted plasma concentrations were within a factor of 2 of experimental data. The median AUC and Cmax of the observed data were 335 μM-h (min–max: 177–444) and 55.9 μM (min–max: 47–72), respectively, versus 316 μM-h (min–max: 179–394) and 41.4 μM (min–max: 32–56), respectively, for the predicted data. Further, the shape of the plasma time-concentration curve resembled the shape of the observed data, except for the postprandial peak.
Figure 2. Model simulations of the individual experimental data from the Asiedu’s study [Citation16] (N = 3 subjects: 1, 2 and 3). The measured total DMSA concentrations in plasma are represented by symbols and the predicted ones by a continuous line.
![Figure 2. Model simulations of the individual experimental data from the Asiedu’s study [Citation16] (N = 3 subjects: 1, 2 and 3). The measured total DMSA concentrations in plasma are represented by symbols and the predicted ones by a continuous line.](/cms/asset/4999ecbd-407d-43c0-a451-58429e40914c/ictx_a_1221508_f0002_b.jpg)
shows the calculated and measured plasma and urine DMSA concentrations in three studies.[Citation10,Citation13,Citation17] In the Dart et al. [Citation13] study, observed blood DMSA concentrations were provided and had to be converted into plasma DMSA concentrations for comparison purpose (upper panel). Observed DMSA concentrations in plasma were available only in the Maiorino et al. [Citation10] study (upper panel). Observed urine data were reported only in the Aposhian et al. [Citation17] and Maiorino et al. [Citation10] studies (lower panel). As the predicted values were calculated for the same DMSA dose (oral administration of 10 mg/kg DMSA) and standard weight, both predicted curves of the upper panel are similar. The absorption rate of DMSA from the gut into the body was overestimated by the model (first ascending part of the curves). Cumulative urine excretion of total DMSA was available in Aposhian et al. [Citation17] and total urine DMSA concentrations in Maiorino et al. [Citation10] The total DMSA concentrations in urine were slightly underestimated by the model but still within reasonable limits. shows that the ratios of AUC and Cmax were within a factor two for plasma and urine concentrations. No Cmax ratio was calculated with the Aposhian data as Cmax was unavailable in this study.
Figure 3. Simulated versus observed plasma concentrations and urine excretion of DMSA following oral administration of 10 mg/kg bodyweight in healthy human volunteers. Observed data are presented as mean ±95% CI.
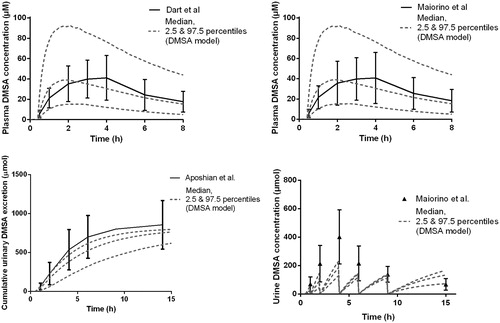
Table 3. Comparison of the predicted values with the experimental data for DMSA plasma and urine concentrations (ratios of AUC and ratios of Cmax values).
Discussion
In this study, we developed a simple model able to predict the kinetics of DMSA in humans after oral administration. The model has been validated by using data from three other published studies. The ratios of observed values and predicted values for AUC and Cmax were within a factor two for plasma and urine concentrations. Our goal was to develop a kinetic model for DMSA, which would be combined with an existing physiologically based toxicokinetic lead model for lead.[Citation7] The combination of both models would allow the simulation of the effect of chelation therapy on lead concentrations in tissues.
Whether a kinetic model is “to be preferred”, or not, depends on the use one wishes to make of it. In the case of DMSA, two constraints exist: on the one hand, much about DMSA kinetics remains unknown and, on the other, the patient’s information (about his exposure to lead, his lifestyle, details of his therapy) is usually only partially available in practice. Thus, the model we developed had to include as few parameters as possible and require as few inputs as possible. Moreover, the kinetic model for lead we intend to use is quite complex.[Citation7] Therefore, as simple a DMSA model as possible, that accounts for the main characteristics of DMSA kinetics (absorption after oral administration, distribution, metabolism and excretion) was necessary.
Even though a drug like DMSA is used in clinical practice, there are still many unknowns about its pharmacokinetics and pharmacodynamics. For instance, the percentage of DMSA absorbed after oral administration is unknown, as the DMSA eliminated via faeces has never been measured. Furthermore, the precise moiety of lead chelating DMSA is not known. It has been suggested that DMSA-cysteine mixed disulfides are the active agents and that chelation takes place in the kidney, based on an association of lead in urine with altered DMSA.[Citation16] However, other studies in animals suggested that the unaltered drug or another metabolite might chelate lead.[Citation20] Finally, some authors found that the DMSA mixed disulfides can be reduced to DMSA in the kidney, before excretion, and could act as pro-drugs.[Citation11] Whatever the precise nature of the chelating agent, the blood and urine lead concentrations are the most widely used “biomarkers” to assess DMSA chelation for efficacy. The blood lead concentration assesses the concentration of lead in the vascular compartment and may be considered a continuum of the soft tissues.[Citation21] A study in rats demonstrated that DMSA chelation significantly increased the urinary excretion of labile soft tissue lead.[Citation22] In occupational workers exposed to lead, 4-h DMSA chelated urinary lead excretion was significantly correlated with blood lead concentrations after administration of 10 mg/kg body weight DMSA.[Citation23]
Another difficulty when modelling the DMSA kinetics is the relative scarcity of usable individual kinetic data on humans. The model calibration of the unknown model parameters was based on experimental human data.The data reported in Asiedu et al. [Citation16] were the best described and most valuable data we could find, i.e., individual data with a follow-up of 16 h post-administration, which is a minimum period of time after DMSA administration to characterise the kinetics of DMSA. However, the exact weight and gender of the three subjects were not mentioned in the original article, so predictions were made for a standard weight of 70 kg. As long as kinetic processes are not saturated and body composition does not vary substantially with body weight, this approach will not introduce substantial errors.
Our model predicted that ka, the absorption rate of DMSA into the system, equalled 1.2 h−1 with a Tmax of 2 h for the plasma DMSA concentration whereas the Tmax for the actual data in the healthy volunteers studies used to check the model predictions equalled 4 h (). In , where the predicted and Asiedu’s data are compared, the absorption rate appears to be well estimated. The experimental results disagree between Asiedu’s experimental results and those from the other studies (Maiorino and Dart’s studies) but we do not know why there is a difference. For instance, we checked that all healthy volunteers were fasted for 11 h in Asiedu, Maiorino and Dart’s studies. The same odd difference was observed in another context, between seemingly equivalent experiments, with experimental data for model verification about half of the reference experiment.[Citation24]
The fitted parameters (e.g., RVd) had values that were similar to those already known of the human body, indicating that our model’s structures were sufficiently comparable to real life situations. The parameter values we used had some uncertainties, because human kinetic data on DMSA are scarce. Therefore, we verified our model predictions with experimental data from several healthy volunteer studies, different from the data used for the model calibration. Due to the natural variation in physiological and kinetic parameters within a population, it would be surprising if a model that is based on specific individuals predicted precisely the results for another group. Furthermore, precise basic individual information (such as gender or weight) were unavailable in the graphs of the human experimental studies. Yet, our model provided predictions that were within reasonable limits, even though predictions of the total urine DMSA concentrations were somewhat underestimated.
In the study used to fit our model parameters,[Citation16] the observed data suggest a decrease of total plasma DMSA concentrations, slower than predicted by our model (). This is probably due to intermittent bile flow after consuming a meal. Our model assumed a continuous flow when in reality the flow is not continuous in humans, as bile is secreted during digestion only. In the Asiedu study,[Citation16] healthy volunteers were given a heavy meal 10 h after the administration of DMSA. A reduction in the decrease of total plasma DMSA concentrations was observed after 10 h, especially in Subject 2 (), with the dots above the fitted line.
We, therefore, considered an alternative to our model that would be able to simulate the intermittent bile flow, so as to check whether this change would improve the predictions. This alternative model contains three compartments: the gut compartment, the systemic compartment, and an auxiliary bile storage compartment to simulate discontinuous bile flow into the gut. However, using this model required estimating two additional parameters, whereas available observed data are already scarce.
The two extra parameters that had to be fitted were: first, the lag time necessary for DMSA to enter the gut after an oral DMSA administration and second, the lag time necessary for the DMSA contained in the bile to enter the gut after a meal. These lag times vary within and between individuals, due to possible differences in upper gastrointestinal motility, fat content of food, or individual absorption characteristics.[Citation25] Furthermore, in clinical practice, when patients are treated with chelation, detailed information regarding the exact times of meals and their contents is unavailable. So, its applicability in chelation therapy is questionable. Since our goal was to develop the simplest model possible and combine it with an existing physiologically based toxicokinetic model for lead,[Citation7] we kept the simplest version, more suitable for use in clinical practice.
In monkeys (Macaca mulatta) of 3–4 years old, with a weight of 2.7–3.7 kg, Tillotson et al. [Citation26] observed bi-phasic kinetics of 14C-radiolabelled DMSA (i.e., parent and metabolites) and mono-phasic kinetics of unaltered DMSA. Therefore, we also considered a second alternative of our model, a 3-compartment model with two systemic compartments and a gut compartment with continuous bile flow. Its predictions were quite similar to the three-compartment version of the model above. This suggests that the observed bi-phasic kinteics may be of an apparent nature only, caused by the additional release of DMSA after a meal. This variant of our model (with three compartments) also predicted a very slow decrease of the total plasma DMSA concentration 11 h after DMSA administration, leading to DMSA body storage. As this third variant of our model did not lead to a clear improvement in prediction with respect to the second variant that was abolished, it was abolished too.
Note that the discussion in the two paragraphs above introduces models that show apparent bi-exponential behaviour or real bi-exponential behaviour, and describe the disposition of total DMSA. Another model could have been introduced: the combined models of parent DMSA and its metabolites, e.g., by coupling two systemic compartments, the first describing DMSA parent kinetics only and the second describing the kinetics of its metabolites. The coupling consists of metabolised DMSA in the first compartment as an instantaneous source of the second. However, DMSA’s metabolism and whether parent DMSA, its metabolites or both are chelating lead, is not clear, yet. Moreover, there is a lack of such detailed data. Therefore, such a model was not elaborated ab initio. Nevertheless, differences in kinetics of parent DMSA and its metabolites are another possible explanation of the bi-exponential behaviour.
Renal clearance of DMSA has been reported to be greater in healthy adults than in children or adults with lead poisoning.[Citation13] The data we used for the parameter fitting process as well as for the verification of the model predictions, concerned adults only. Nevertheless, we believe our model could also be used for children treated with DMSA chelation. According to Asiedu et al., [Citation16] there are few differences in DMSA kinetics between children and adults. The most prominent difference found by these authors was, that in children, lead exposure may slow down renal elimination of DMSA. The author himself acknowledged that this is just a hypothesis, since the study was not designed to test differences between children and adults.
Unfortunately enough, the duration of the healthy volunteers studies used to verify the model predictions [Citation10,Citation13,Citation17] were too short (8 hours) to make a reliable comparison of decreasing rates of plasma DMSA concentration between the predicted rates and the experimental data. The group of healthy volunteers used for validation purpose was quite homogenous concerning the age, body weight and organ function. The next step is therefore to use the DMSA model with data from a less homogenous population. We plan to combine our DMSA kinetic model with an existing physiologically based toxicokinetic (PBTK) lead model, resulting in a “Chelation Therapy Model”(CTM) and to verify the predictions with experimental data of patients intoxicated with lead and treated by DMSA.
Conclusion
In conclusion, a simple kinetic model simulating the kinetics of DMSA in humans has been developed and verified. The interest of this DMSA model lies in the future potential to use it to predict blood lead levels in lead-poisoned patients treated with DMSA.
Disclosure statement
The authors report no declarations of interest.
References
- Pirkle JL, Brody DJ, Gunter EW, et al. The decline in blood lead levels in the United States. The National Health and Nutrition Examination Surveys (NHANES). JAMA. 1994;272:284–291.
- Virji MA, Woskie SR, Pepper LD. Task-based lead exposures and work site characteristics of bridge surface preparation and painting contractors. J Occup Environ Hyg. 2009;6:99–112.
- Araujo J, Beelen AP, Lewis LD, et al. Lead poisoning associated with ayurvedic medications — five states, 2000–2003. MMWR Morb Mortal Wkly Rep. 2004;53:582–584.
- Bradberry S, Vale A. A comparison of sodium calcium edetate (edetate calcium disodium) and succimer (DMSA) in the treatment of inorganic lead poisoning. Clin Toxicol (Phila). 2009;47:841–858.
- Bradberry S, Vale A. Dimercaptosuccinic acid (succimer; DMSA) in inorganic lead poisoning. Clin Toxicol (Phila). 2009;47:617–631.
- Leggett RW. An age-specific kinetic model of lead metabolism in humans. Environ Health Perspect. 1993;101:598–616.
- O'Flaherty EJ. Physiologically based models for bone-seeking elements. IV. Kinetics of lead disposition in humans. Toxicol Appl Pharmacol. 1993;118:16–29.
- U.S. EPA. Technical support document: parameters and equations used in the Integrated Exposure Uptake Biokinetic (IEUBK) model for lead in children. Washington (DC): Office of Solid Waste and Emergency Response U.S. Environmental Protection Agency, 1994. Available at: https://nepis.epa.gov/Exe/ZyNET.exe/P100MECY.TXT?ZyActionD=ZyDocument&Client=EPA&Index=1991+Thru+1994&Docs=&Query=&Time=&EndTime=&SearchMethod=1&TocRestrict=n&Toc=&TocEntry=&QField=&QFieldYear=&QFieldMonth=&QFieldDay=&IntQFieldOp=0&ExtQFieldOp=0&XmlQuery=&File=D%3A%5Czyfiles%5CIndex%20Data%5C91thru94%5CTxt%5C00000031%5CP100MECY.txt&User=ANONYMOUS&Password=anonymous&SortMethod=h%7C-&MaximumDocuments=1&FuzzyDegree=0&ImageQuality=r75g8/r75g8/x150y150g16/i425&Display=hpfr&DefSeekPage=x&SearchBack=ZyActionL&Back=ZyActionS&BackDesc=Results%20page&MaximumPages=1&ZyEntry=1&SeekPage=x&ZyPURL.
- Maiorino RM, Bruce DC, Aposhian HV. Determination and metabolism of dithiol chelating agents: VI. Isolation and identification of the mixed disulfides of meso-2, 3-dimercaptosuccinic acid with L-cysteine in human urine. Toxicol Appl Pharmacol. 1989;97:338–349.
- Maiorino RM, Akins JM, Blaha K, et al. Determination and metabolism of dithiol chelating agents: X. In humans, meso-2,3-dimercaptosuccinic acid is bound to plasma proteins via mixed disulfide formation. J Pharmacol Exp Ther. 1990;254:570–577.
- Maiorino RM, Aposhian MM, Xu ZF, et al. Determination and metabolism of dithiol chelating agents. XV. The meso-2,3-dimercaptosuccinic acid-cysteine (1:2) mixed disulfide, a major urinary metabolite of DMSA in the human, increases the urinary excretion of lead in the rat. J Pharmacology Exp Ther. 1993;267:1221–1226.
- Aposhian HV, Maiorino RM, Gonzalez-Ramirez D, et al. Mobilization of heavy metals by newer, therapeutically useful chelating agents. Toxicology. 1995;97:23–38.
- Dart RC, Hurlbut KM, Maiorino RM, et al. Pharmacokinetics of meso-2,3-dimercaptosuccinic acid in patients with lead poisoning and in healthy adults. J Pediatr. 1994;125:309–316.
- Liang Y-Y, Marlowe C, Waddell WJ. Disposition of [14C]dimercaptosuccinic acid in mice. Fundam Appl Toxicol. 1986;6:532–540.
- Castellino N, Castellino P, Sannolo N, editors. Inorganic lead exposure: metabolism and intoxication. Boca Raton (FL): Lewis Publishers; 1995.
- Asiedu P, Moulton T, Blum CB, et al. Metabolism of meso-2,3-dimercaptosuccinic acid in lead-poisoned children and normal adults. Environ Health Perspect. 1995;103:734–739.
- Aposhian HV, Maiorino RM, Dart RC, et al. Urinary excretion of meso-2,3-dimercaptosuccinic acid in human subjects. Clin Pharmacol Ther. 1989;45:520–526.
- Aegis. Acsl Extreme (Version 3.0.2.1.). 2015; [cited 2016 Jan 12]. Available at: http://www.acslx.com/.
- IPCS, 2010. Characterization and application of physiologically based pharmacokinetic models in risk assessment [Internet]; [cited 2016 Jan 12]. Available at: http://www.inchem.org/documents/harmproj/harmproj/harmproj9.pdf.
- Aposhian HV, Aposhian MM. Meso-2, 3-dimercaptosuccinic acid: chemical, pharmacological and toxicological properties of an orally effective metal chelating agent. Annu Rev Pharmacol Toxicol. 1990;30:279–306.
- Lowry JA. Oral chelation therapy for patients with lead poisoning [Internet]. 2010; WHO; [cited 2015 Nov 11]. Available at: http://www.who.int/selection_medicines/committees/expert/18/applications/4_2_LeadOralChelators.pdf.
- Smith DR, Flegal AR. Stable isotopic tracers of lead mobilized by DMSA chelation in low lead-exposed rats. Toxicol Appl Pharmacol. 1992;116:85–91.
- Khan DA, Qayyum S, Saleem S, Khan FA. Evaluation of lead body burden in occupational workers by lead mobilization test. J Pak Med Assoc. 2009;59:350–354.
- Bos PM, Zeilmaker MJ, van Eijkeren JC. Application of physiologically based pharmacokinetic modeling in setting acute exposure guideline levels for methylene chloride. Toxicol Sci. 2006;91:576–585.
- Martinez MN, Amidon GL. A mechanistic approach to understanding the factors affecting drug absorption: a review of fundamentals. J Clin Pharmacol. 2002;42:620–643.
- Tillotson JA, Boswell G, Kincannon L, et al. The biological fate of 14C-dimercaptosuccinic acid in monkeys and rabbits. Mil Med. 1989;154:444–449.
Appendix
Model equations
expresses the discontinuous jump of DMSA to the remaining gut-content at the kth administration.
Parameter reduction
In modelling DMSA, use has been made of the relative excretion percentages mentioned in Bradberry & Vale [Citation5]. Note that the fractions absorbed from the gut into the system and excreted into the gut are:
(1)
Here, ka is the rate of systemic uptake from the gut and kf is the rate of fecal excretion; kb is the rate of excretion through bile, and ku is the rate of excretion into the urine. If a unit dose enters the gut, then from this dose a fraction F enters the system. However, a fraction G of this re-enters the gut, and again a fraction F re-enters the system, continuously. Therefore, ultimately, the fraction taken up to be excreted into the urine and known from Bradberry & Vale [Citation5] is:
(2)
and, likewise, the fraction of a unit dose that is applied intravenously to be excreted into the urine is:
(3)
Note that 0≤α≤β≤1 always applies. From these two equations one can derive:
(4)
Substituting these relations in EquationEquation (1)(2) one obtains:
(5)
where kg is the total elimination rate of applied dose to faeces and system; ks is the total elimination rate of DMSA from the system through the bile and the urine. At the extreme values 0 and 1 both for α and β as well as for F and G, these equations should be interpreted carefully. In this study it is assumed that α = 0.2 (20% in urine after oral dosing) and β = 0.8 (80% in urine after intravenous dosing), resulting in a fraction absorbed F = 0.25 and a fraction excreted G = 0.25. In this way, the number of four kinetic model parameters ka, kf, kb, ku is reduced to two: kg, ks.