
Abstract
Introduction
Myotoxicity is an important toxidrome that can occur with envenoming from multiple Australian snake types. Early antivenom administration is an important strategy to reduce the incidence and severity of myotoxicity. The current gold standard biomarker, serum creatine kinase activity, does not rise early enough to facilitate early antivenom administration. Several other skeletal muscle biomarkers have shown promise in other animal models and scenarios. The aim of this study was to examine the predictive values of six skeletal muscle biomarkers in a rat model of Australian snake myotoxicity.
Methods
Sprague-Dawley rats were anaesthetised and administered either Pseudechis porphyriacus (red-bellied black snake) or Notechis scutatus (tiger snake) venom, or normal saline via intramuscular injection. Blood samples were collected. Assays were performed for serum creatine kinase skeletal muscle troponin-I concentration, skeletal muscle troponin-C concentration, myoglobin activity, skeletal muscle myosin light chain-1 concentration, and creatine kinase-MM activity. Serum markers were plotted against time, with comparison of area under the concentration (or activity)-time curve. The predictive values of six skeletal muscle biomarkers were examined using receiver operating characteristic curves.
Results
There was no difference in area under the serum creatine kinase activity-time curve between venom and control groups. Serum creatine kinase-MM activity rose early in the venom treated rats, which had a significantly greater area under the serum activity-time curve. No difference in area under the serum concentration-time curve was demonstrated for the other biomarkers. Creatine kinase-MM activity had a superior predictive values than creatine kinase activity at 0–4 hours and 0–10 hours after venom administration, as indicated by area under the receiver operating characteristic curves (95 per cent confidence intervals) of 0.91 (0.78–1.00) and 0.88 (0.73–1.00) versus 0.79 (0.63–0.95) and 0.66 (0.51–0.80).
Discussion
The limitations of serum creatine kinase activity in early detection of myotoxicity were demonstrated in this rat model.
Conclusion
Serum creatine kinase-MM activity was superior for early detection of Australian myotoxic snake envenoming.
Introduction
Australia has a uniquely diverse venomous snake fauna [Citation1]. Envenoming from snakebite is rare in Australia, but often severe when it occurs [Citation2,Citation3]. Myotoxicity is an important clinical toxidrome of Australian snakebite, occurring relatively frequently from envenoming by a number of groups of snakes [Citation2,Citation3]. Australian snake venom myotoxicity is characterised by local bite site effects, non-specific systemic symptoms (such as nausea, vomiting, diarrhoea and headache), specific symptoms and signs of myotoxicity (i.e., myalgia, muscle tenderness and trismus), generalised skeletal muscle damage (as indicated by elevated serum creatine kinase (CK) activity) and, in rare instances, acute kidney injury, overwhelming rhabdomyolysis, hyperkalaemia and death [Citation3].
The primary treatment of Australia snake envenoming is antivenom therapy [Citation4]. In vitro data has demonstrated that antivenom can attenuate, but not reverse, myotoxicity [Citation5]. Early administration of antivenom is reported to reduce the frequency and/or severity of myotoxicity in human cases of Oxyuranus spp. (taipan) [Citation6], Pseudechis australis (mulga snake) [Citation7], Pseudechis porphyriacus (red-bellied black snake) [Citation8], and Notechis scutatus (tiger snake) [Citation3] envenoming. Importantly, the benefit of early antivenom therapy was most evident in those given antivenom before the serum CK activity increased [Citation3]. There is a clear need for early indicators of envenoming and myotoxicity to facilitate an early antivenom administration strategy [Citation4].
Measurement of serum CK activity is the most common method of assessing for the presence and severity of snakebite associated myotoxicity [Citation3] and is recommended as part of snakebite clinical care pathways [Citation9]. Elevations in serum activity of CK are widely accepted as a good marker of severity of skeletal muscle injury [Citation10]. However, there are several limitations to the use of CK activity in the assessment of myotoxic snake envenoming. Different isoenzymes of CK exist, and each is found predominately in different source tissues [Citation11]. Thus, the measurement of serum total CK activity lacks specificity for skeletal muscle damage [Citation10]. In addition, a rise in serum CK activity is known to be delayed after skeletal muscle injury [Citation10], a phenomenon that has also been demonstrated in rat models of Australian snake myotoxicity [Citation12]. This delay has also been described in human cases of Australian snake envenoming, with a median time to the first abnormal serum CK activity of 13 h, making early risk assessment of myotoxicity difficult using serum CK activity alone [Citation3]. Urine myoglobin concentration has also occasionally been performed in cases of snakebite, with similar predictive value to CK activity [Citation3]. Serum myoglobin concentration has also been measured in some studies [Citation7].
Biomarkers have previously shown promise for the early detection of Australian snake envenoming, with D-dimer concentration and phospholipase A2 activity shown to be good predictors [Citation13,Citation14]. A number of skeletal muscle biomarkers have been studied in non-venom muscle injury models and diseases that cause myotoxicity, some of which have demonstrated improved specificity for skeletal muscle injury over the current biomarkers in common use [Citation15].
Creatine kinase is a dimeric intracellular enzyme made up of the B and M subunits, with different isoenzymes found in different parts of the body: CK-MM in skeletal muscle, CK-BB in the brain and CK-MB in cardiac muscle [Citation11]. Standard total CK measurement does not differentiate between the different isoforms [Citation11], but specific measurement of CK-MM activity is possible [Citation16]. Myoglobin is a haem-protein found in both cardiac and skeletal muscle [Citation17,Citation18], the urinary clearance of which leads to the characteristic red-brown discoloration of the urine associated with muscle injury [Citation19]. Myoglobin is rapidly and unpredictably eliminated by hepatic metabolism. Therefore, tests for myoglobin concentration in plasma or urine are not a sensitive diagnostic procedure [Citation19]. Troponin is a globular protein complex involved in the regulation of contraction of striated muscle and exists as a complex of three subunits: C (calcium binding), T (tropomyosin binding) and I (inhibitory protein) [Citation17,Citation20]. Myosin light chain-1 is a subunit of myosin, a contractile protein found in muscle, with specific isoforms found in skeletal and cardiac muscle [Citation21,Citation22]. Creatine kinase, troponin and myosin light chain-1 have isozymes that are skeletal muscle specific, whilst myoglobin has been shown to be an accurate marker of skeletal muscle injury in the absence of cardiac muscle injury [Citation17,Citation19], which is rare in Australian snake envenoming [Citation2].
The aim of this study was to examine the predictive values of several skeletal muscle biomarkers in the early detection of Australian snakebite associated myotoxicity in a rat model compared with the established method of detection.
Materials and methods
Materials
Notechis scutatus (tiger snake) and Pseudechis porphyriacus (red-bellied black snake) venom was purchased from Venom Supplies Pty Ltd., Tanunda, South Australia. Skeletal muscle biomarker ELISA kits (skeletal muscle troponin-I, fast twitch skeletal muscle troponin-C, myoglobin, skeletal muscle myosin light chain-1 and CK-MM) were purchased from Life Diagnostics, PA. The CK-NAC reagent kits were purchased from Thermo Scientific Ltd, VA. Rabbit IgG to N. scutatus and P. porphyriacus were obtained from Rajarata University of Sri Lanka. Rats were obtained from Monash University.
Animal model of myotoxic envenoming
Male Sprague-Dawley rats weighing 300–375 g were obtained. The rats were housed with free access to food and water. Rats were anaesthetised with 600–100 mg/kg (intraperitoneal) of pentobarbital, with additional doses given throughout the procedure as required. Right jugular vein (for blood sampling) and carotid artery cannulation (for blood pressure monitoring) and tracheal intubation (for mechanical ventilation, if required) were carried out through a cervical region incision. Blood pressure was monitored using a Gould Statham P23 pressure transducer. Body temperature was monitored with a rectal thermometer, with temperature control provided using a heat lamp.
Venom doses were estimated using known average venom yields and venom serum concentrations in previously published human cases of P. porphyriacus and N. scutatus envenoming [Citation23,Citation24]. Rats were administered either P. porphyriacus venom 200 µg/kg in 50 µL of sodium chloride 0.9%, N. scutatus venom 200 µg/kg in 50 µL of sodium chloride 0.9% or 50 µL of sodium chloride 0.9% via intramuscular injection into the gastrocnemius muscle. Animals were observed for 14 h unless they died earlier.
Sample collection for biomarker and venom assays
Blood samples (approximately 0.3 mL) were collected into MiniCollect Z serum separation tubes via the carotid artery cannula. Samples were collected at baseline before venom injection, and at 2 h intervals until 10 h (Supplementary Figure 1). Samples were spun in a centrifuge (Eppendorf 5414) for 15 min at 6,500 rpm, frozen and stored at −80 °C for later venom and biomarker analysis.
Venom enzyme immunoassay
Specific P. porphyriacus and N. scutatus enzyme immunoassay was performed on all available samples using previously validated methods [Citation25]. Greiner Microlon 96-well plates were coated with 100 µL of 1 µg/mL rabbit anti-P. porphyriacus or N. scutatus IgG (depending on which sample assayed) in carbonate buffer, stored for 1 h at room temperature and refrigerated (4 °C) overnight. Each plate was washed using Tween 20 0.02% in phosphate buffered saline and blocking solution of 300 µL 0.5% bovine serum albumin added. The plates were washed again 1 h later, and 100 µL of test sample added (diluted rat sample or spiked sample for standard curve calculation), with all samples performed in triplicate. After 1 h, plates were washed three times. One hundred µL of biotinylated anti-P. porphyriacus or N. scutatus (0.15 µg/mL in 0.5% bovine serum albumin in phosphate-buffered saline) was then added. One hour later, the plate was washed a further three times. One hundred microliters of streptavidin-conjugated horseradish peroxidase 0.15 µg/mL in 0.5% bovine serum albumin in phosphate-buffered saline was then added, followed by three further washes. One hundred µL of tetramethylbenzidine was added to each of the wells to develop colour, and after 2 min sulfuric acid 50 µL of 1 M solution was added to halt the reaction. Plates were then read in a plate reader, with averaged absorbances for the triplicate samples converted to venom concentration based upon the standard curve using a linear equation.
Skeletal muscle biomarker assays
Manufacturer instructions were followed for all skeletal muscle biomarker assays, which were similar for each of the biomarkers. In summary, each of the kits consisted of a 96 well plate coated with antibodies to the specific biomarker, stock solution of that biomarker, diluent, wash buffer, horseradish-peroxidase conjugate, tetramethylbenzidine reagent and stop solution. Standards were prepared by taking stock solution and making serial dilutions. Rat serum samples were also diluted 10-fold. Plates were washed six times with the wash solution and a plate washer. One hundred microliters of diluted standards and samples were added into the wells. One hundred µL of diluted horse radish-peroxidase conjugate was then added. Plates were incubated in a microplate shaker at 25 °C at 150 rpm for 1 h. Plates were then emptied and washed six times. One hundred microliters of tetramethylbenzidine was then added, and the plate was then added to the plate shaker at 25 °C at 150 rpm for 20 min. One hundred microliters of the stop solution was then added and gently mixed. Plates were then read at 450 nm with a plate reader. Standard curves were plotted using stock solution results, with absorbances converted to biomarker concentrations or activities as indicated using a linear equation.
Creatine kinase assay
Greiner Microlon 96-well plates were prepared by adding 15 µL of serum and 300 µL of provided reagent. After a 120 s delay, samples were read in a plate reader (340 nm at 37 °C) for 3 min. Creatine kinase activity was then calculated with a linear equation provided by the manufacturer.
Data analysis
All statistical analysis and graphical representations were performed using GraphPad Prism version 10.0.2 (GraphPad Software, San Deigo, CA, United States). Area under the concentration (or activity)-time curves (AUC) were calculated using the trapezoidal rule. A one-way ANOVA was performed on the AUC for each biomarker followed by a Bonferonni post-hoc test. Statistical significance was reached if P < 0.05. Comparison of predictive value of biomarkers was compared using area under the receiver operating characteristic (ROC) curves.
Results
A total of 30 rats were used in the experiment. Five rats died during the surgical procedure. Of the remaining rats, a total of 11 survived until at least 10 h post-venom/saline administration, four administered P. porphyriacus venom, three administered N. scutatus venom and four control rats (Supplementary Table 1).
Venom assays
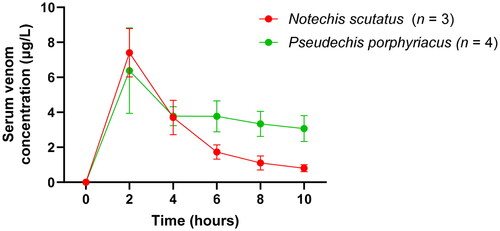
Serum venom concentrations were measured over 10 h with peak mean venom concentrations occurring at 2 h post-intramuscular injection for both snake venoms (). The mean ± SEM peak venom concentration for rats injected with N. scutatus venom was 7.4 ± 1.39 μg/L and 6.0 ± 2.19 μg/L for rats injected with P. porphyriacus venom. Serum venom concentrations in both groups of snakes then decreased.
Figure 1. Plot of serum venom concentrations (mean ± SEM) over time (0–10 h) in rats after Notechis scutatus venom or Pseudechis porphyriacus venom administration.
Biomarker assay results
Creatine kinase activity
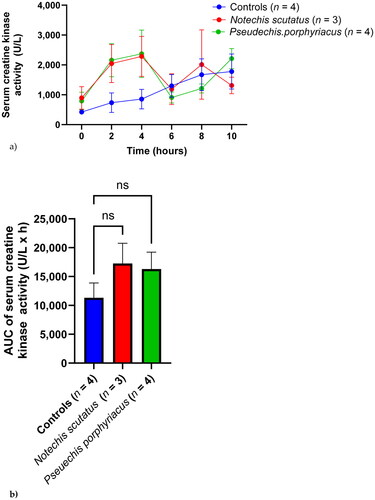
Both venom treated rat groups had an early peak serum CK activity at 4 h, with a subsequent decrease and second peak (). Serum CK activity in the control group rose gradually over time. There was no significant difference in AUC between the control group and the two venom groups ().
Figure 2. (a) Plot of serum creatine kinase activity (mean ± SEM) over time (0–10 h) and (b) area under the activity-time curve (AUC) of serum creatine kinase in rats administered Notechis scutatus venom, Pseudechis porphyriacus venom or normal saline (controls). ns = not significant compared to controls (one-way ANOVA, followed by Bonferroni t-test).
Creatine kinase-MM activity
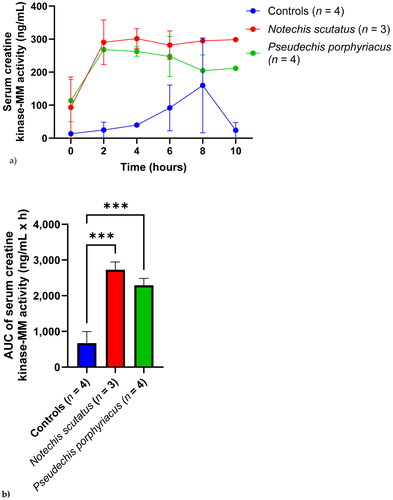
Serum CK-MM activity rose rapidly (on first measurement post venom injection at 2 h) and plateaued for both groups administered snake venom (). The control group had a rise in serum activity that was delayed and lower in magnitude until 8 h. There was a significant difference in CK-MM activity AUC between the control group and the groups injected with N. scutatus (P = 0.001) or P. porphyriacus (P = 0.003) venoms ().
Figure 3. (a) Plot of serum creatine kinase-MM activity (mean ± SEM) over time (0–10 h) and (b) area under the activity-time curve (AUC) of serum creatine kinase-MM in rats administered Notechis scutatus venom, Pseudechis porphyriacus venom or normal saline (controls). ***P < 0.05 compared to controls (one way ANOVA, followed by Bonferroni t-test).
Skeletal muscle troponin-I concentration
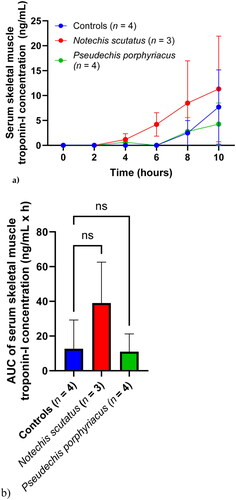
Compared to the other biomarkers, there was a delayed rise in serum concentrations of skeletal muscle troponin-I (). Mean serum concentrations were greater after 4 h for rats treated with N. scutatus venom, but mean serum concentrations in the rats treated with P. porphyriacus venom were similar to the the control group throughout (). There was no significant difference in AUC between the groups ().
Figure 4. (a) Plot of serum skeletal muscle troponin-I concentrations (mean ± SEM) over time (0–10 h) and (b) area under the concentration-time curve (AUC) of serum skeletal muscle troponin-I in rats administered Notechis scutatus venom, Pseudechis porphyriacus venom or normal saline (controls). ns = not significant compared to controls (one-way ANOVA, followed by Bonferroni t-test).
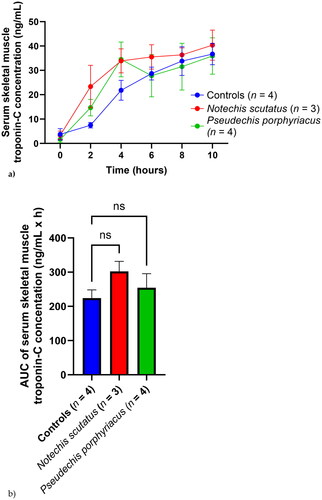
Skeletal muscle troponin-C concentration
Serum skeletal muscle troponin-C concentrations in all three groups rose gradually over the 10 h time period (). Mean serum concentrations were greater for the rats treated with N. scutatus venom than saline at all time points, and higher in rats treated with P. porphyriacus venom than saline at 2 h and 4 h (). There was no significant difference in AUC between the groups ().
Figure 5. (a) Plot of serum skeletal muscle troponin-C concentrations (mean ± SEM) over time (0–10 h) and (b) area under the concentration-time curve (AUC) of serum skeletal muscle troponin-C in rats administered Notechis scutatus venom, Pseudechis porphyriacus venom or normal saline (controls). ns = not significant compared to controls (one-way ANOVA, followed by Bonferroni t-test).
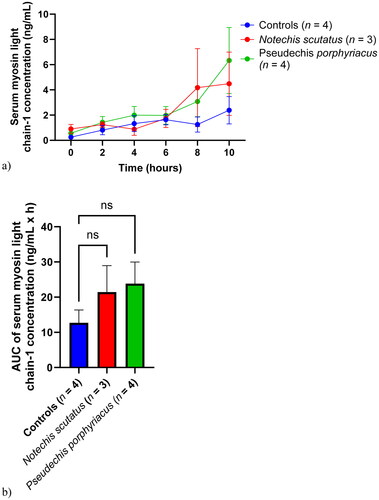
Skeletal muscle myosin light chain-1 concentration
Serum skeletal muscle myosin light chain-1 concentrations were similar for each of the groups until 6 h, after which there were comparative increases in serum concentrations for the two groups injected with venom, particularly rats injected with P. porphyriacus venom (). There was no significant difference in AUC between the groups ().
Figure 6. (a) Plot of serum skeletal muscle myosin light chain-1 concentrations (mean ± SEM) over time (0–10 h) and (b) area under the concentration-time curve (AUC) of serum skeletal muscle myosin light chain-1 in rats administered Notechis scutatus venom, Pseudechis porphyriacus venom or normal saline (controls). ns = not significant compared to controls (one-way ANOVA, followed by Bonferroni t-test).
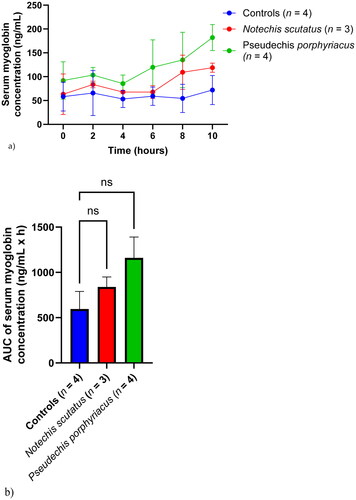
Myoglobin concentration
Serum myoglobin concentrations were stable in the control group throughout the test period (). Delayed increases in serum myoglobin were seen in rats treated with P. porphyriacus venom (from 6 h) and N. scutatus venom (from 8 h) (). There was no significant difference in AUC for myoglobin concentrations between the groups.
Figure 7. (a) Plot of serum myoglobin concentrations (mean ± SEM) over time (0–10 h) and (b) area under the concentration-time curve (AUC) of serum myoglobin in rats administered Notechis scutatus venom, Pseudechis porphyriacus venom or normal saline (controls). ns = not significant compared to controls (one-way ANOVA, followed by Bonferroni t-test).
Receiver operating characteristic curves
Differences in predictive values among biomarkers were similar at 0–4 h () and 0–10 h () after venom administration. The serum CK-MM activity had the highest predictive value of all (), as indicated by area under the ROC curves (95% CI) at 0-4 h and 0–10 h: 0.91 (0.78–1.00), 0.88 (0.73–1.00). The serum CK-MM activity had a superior predictive value than the serum CK activity: 0.79 (0.63–0.95) and 0.66 (0.51–0.80) and myoglobin concentration: 0.67 (0.45–0.89) and 0.73 (0.59–0.87) ().
Figure 8. Receiver operating characteristic curves for six serum biomarkers in seven rats with myotoxic snake envenoming at 0–4 h after Notechis scutatus or Pseudechis porphyriacus venom administration versus control rats.
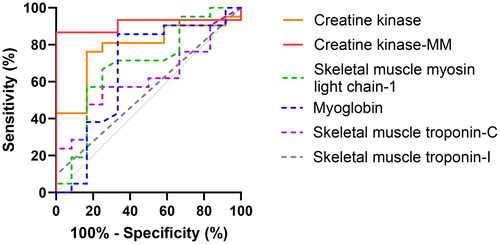
Figure 9. Receiver operating characteristic curves for six serum biomarkers in seven rats with myotoxic snake envenoming at 0–10 h after Notechis scutatus or Pseudechis porphyriacus venom administration versus control rats.
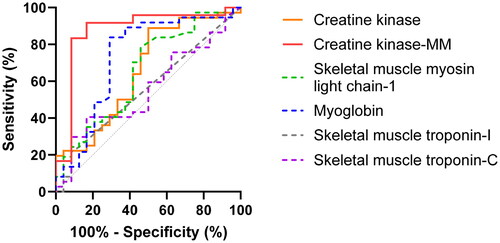
Table 1. Area under the receiver operating characteristic curves with 95% confidence intervals for the six serum biomarkers of myotoxicity in 11 rats at 0–4 h and 0–10 h after N. scutatus venom or P. porphyriacus venom administration.
Discussion
The serum CK-MM activity was shown to be a more superior biomarker than the serum CK activity in the detection of Australian myotoxic snake envenoming in a rat model. The serum CK-MM activity was superior in the detection of envenoming both at 0–4 h and 0–10 h (after venom administration). This is consistent with what has been previously demonstrated in non-venom associated skeletal muscle damage research [Citation26].
This rat model and venom doses selected did not generate the expected serum venom concentration and associated serum CK activity change. Relatively low serum venom concentrations and lower than expected serum CK activity, without any significant difference between the control and venom groups for serum CK activity results, were demonstrated. Venom dose was estimated based upon venom yield and serum venom concentrations in human cases of N. scutatus and P. porphyriacus envenoming [Citation23,Citation24]. Although serum concentrations were of a similar magnitude to those seen in human cases of N. scutatus and P. porphyriacus envenoming, they were much lower than those reported by Hart and colleagues [Citation12] in rats administered P. australis venom via the intramuscular route (peak serum venom concentration approximately 50 μg/L). The lower-than-expected peak serum venom concentration may explain the lack of significant venom induced serum CK activity rise. This is in keeping with the findings of Hart and colleagues [Citation12], who reported minimal impact of lower doses of administered P. australis venom on serum CK activity.
The time limitations of the rat model may also have led to the unexpectedly low and undifferentiated serum CK activity results. In an analysis of human cases of myotoxicity caused by Australian snakes, the median time to first abnormal serum CK activity was 13 h overall for all snake groups, 10 h for N. scutatus induced myotoxicity and 16.6 h for P. porphyriacus induced myotoxicity [Citation3]. The window of 10 h post-venom administration in this rat model, a limitation largely due to the necessity for sufficient blood volume drawn from the rats, may preclude adequate detection of a rise in serum CK activity. In human cases of envenoming, P. australis venom is associated with a shorter median time (7.7 h) to first abnormal serum CK activity (>500 U/L) compared with N. scutatus and P. porphyriacus envenoming, again potentially explaining the difference in serum CK activity rise seen in the studies by Hart and colleagues [Citation3,Citation12]. The rise in serum CK activity in the control rats, and likely venom administered rats, is potentially from the surgical procedure itself.
In this study, serum CK-MM activity rise was evident on the first assay post venom administration (2 h). One of the current deficits in the management of Australian snake envenoming is delayed administration of antivenom, previously shown to be a median of 4.3 h post bite [Citation2]. Once patients with snake envenoming present to hospital, there is an average delay of 2.5 h before the administration of antivenom. There are numerous reasons for this delay, including transfer to a second hospital facility that has 24-hour laboratory services, waiting for laboratory results to become available and waiting for specific signs of envenoming (including myotoxicity with rise in serum CK activity) to become evident [Citation4]. Antivenom is frequently administered after myotoxicity is already established and serum CK activity results are already abnormal [Citation3]. Of the biomarkers investigated in this study, CK activity and myoglobin concentration are the only two that are currently available in Australian emergency departments that have associated laboratory facilities [Citation3]. If the results of this study are validated in larger animal and human studies, serum CK-MM activity measurement may be a viable part of an early diagnostic testing strategy that may help detect myotoxic snake envenoming before serum CK activity rise is evident and aid the earlier administration of antivenom and prevention of fulminant myotoxicity [Citation3].
Aside from serum CK-MM activity, the other biomarkers investigated in this study did not demonstrate superiority to the serum CK activity in terms of early or overall predictive value for myotoxic envenoming. This was unexpected, particularly given the prior superiority in diagnostic value demonstrated in various models of each of the biomarkers [Citation15]. It is unclear if the study duration of our rat model was sufficient to demonstrate serum changes for these alternate biomarkers, or if the pattern of injury caused by Australian snake myotoxins produces a different biochemical footprint of injury. Whilst serum myoglobin concentration had a higher predictive value based on the area under the ROC curve for 0–10 h, this was not evident with the 0–4 h results, limiting its potential clinical usefulness, if similar results are replicated in humans.
There are a number of limitations in our study. Firstly, the generalisability of data from a small animal study is not known. Whilst there was myotoxic snake venom detected in all treated rats, the lack of pronounced rise in serum CK activity means that the predictive value of serum CK-MM activity is only known in a model of myotoxic envenoming, not in a rat model of established myotoxicity. The time course of a rat model that is possible ethically and practically is also a limitation in the evaluation of biomarkers. The duration is potentially insufficient to demonstrate established myotoxicity for some snake venom types in the absence of very high doses. These venom doses may not be representative of human clinical cases of envenoming. There are features of the results, such as a fall in serum CK-MM activity the control group at 10 h, that are not explained, and may be either true phenomena or measurement error. A study with a larger number of rats and administration of greater doses of N. scutatus and P. porphyriacus venom is necessary to confirm an adequate dose of venom used and the biomarker findings of this study. Such a study may help differentiate the effects of mechanical manipulation and instrumentation of the rats on serum biomarker concentrations from true venom effect.
Conclusions
Serum CK-MM activity is superior to serum CK activity for the early detection of Australian myotoxic snake envenoming in a rat model. Serum concentrations of skeletal muscle troponin-C, skeletal muscle troponin-I, myoglobin and skeletal muscle myosin light chain-1 are poor biomarkers of myotoxic snake envenoming in a rat model.
Institutional review board statement
The animal study protocol was approved by the Monash University Animal Ethics Committee. Permits for approved experiments: MARP/2014/097 (date of approval: 24/03/2016). Monash University complies with the Australian Code of Practice for the Care and Use of Animals for Scientific Purposes when using live animals for research.
Author contributions
Conceptualisation, C.I.J, A.S, W.C.H, G.K.I.; methodology, C.I.J, A.S, W.C.H, G.K.I; formal analysis, C.I.J, G.K.I.; investigation, C.I.J, A.S, W.C.H, G.K.I; resources, A.S, W.C.H, G.K.I.; writing—original draft preparation, C.I.J, A.S, W.C.H, G.K.I; writing—review and editing, C.I.J, A.S, W.C.H, G.K.I; visualisation, C.I.J, A.S, W.C.H, G.K.I; supervision, A.S, W.C.H, G.K.I.; project administration, W.C.H, G.K.I; funding acquisition, W.C.H, G.K.I. All authors have read and agreed to the published version of the manuscript.
Supplemental Material
Download MS Word (79.6 KB)Disclosure statement
C.I.J. is an employee of GSK Australia and previous employee of Boehringer Ingelheim Australia. This research is independent of his employment by GSK and Boehringer Ingelheim. The other authors declare no conflict of interest. The funders had no role in the design of the study; in the collection, analyses, or interpretation of data; in the writing of the manuscript; or in the decision to publish the results.
Additional information
Funding
References
- Tasoulis T, Lee MS, Ziajko M, et al. Activity of two key toxin groups in Australian elapid venoms show a strong correlation to phylogeny but not to diet. BMC Evol Biol. 2020;20(1):9. doi: 10.1186/s12862-020-1578-x.
- Johnston CI, Ryan NM, Page CB, et al. The Australian snakebite project, 2005–2015 (ASP‐20). Med J Aust. 2017;207(3):119–125. doi: 10.5694/mja17.00094.
- Johnston CI, Isbister GK. Australian snakebite myotoxicity (ASP-23). Clin Toxicol (Phila). 2021;59(7):611–618. doi: 10.1080/15563650.2020.1836377.
- Isbister GK. Antivenom availability, delays and use in Australia. Toxicon X. 2023;17:100145. doi: 10.1016/j.toxcx.2022.100145.
- Ramasamy S, Isbister GK, Hodgson WC. The efficacy of two antivenoms against the in vitro myotoxic effects of black snake (Pseudechis) venoms in the chick biventer cervicis nerve-muscle preparation. Toxicon. 2004;44(8):837–845. doi: 10.1016/j.toxicon.2004.08.005.
- Johnston CI, Ryan NM, O'Leary MA, et al. Australian taipan (Oxyuranus spp.) envenoming: clinical effects and potential benefits of early antivenom therapy—Australian snakebite project (ASP-25). Clin Toxicol (Phila). 2017;55(2):115–122. doi: 10.1080/15563650.2016.1250903.
- Johnston CI, Brown SGA, O'Leary MA, et al. Mulga snake (Pseudechis australis) envenoming: a spectrum of myotoxicity, anticoagulant coagulopathy, haemolysis and the role of early antivenom therapy—Australian snakebite project (ASP-19). Clin Toxicol (Phila). 2013;51(5):417–424. doi: 10.3109/15563650.2013.787535.
- Sanhajariya S, Duffull SB, Isbister GK. Investigating myotoxicity following Australian red-bellied black snake (Pseudechis porphyriacus) envenomation. PLoS ONE. 2021;16(9):e0256653. doi: 10.1371/journal.pone.0256653.
- Isbister GK, Brown SG, Page CB, et al. Snakebite in Australia: a practical approach to diagnosis and treatment. Med J Aust. 2013;199(11):763–768. doi: 10.5694/mja12.11172.
- Clarkson PM, Nosaka K, Braun B. Muscle function after exercise-induced muscle damage and rapid adaptation. Med Sci Sports Exerc. 1992;24(5):512–520.
- Lo KR, Hurst SM, Atkinson KR, et al. Development and validation of a sensitive immunoassay for the skeletal muscle isoform of creatine kinase. J Sci Med Sport. 2010;13(1):117–119. doi: 10.1016/j.jsams.2008.08.004.
- Hart AJ, Hodgson WC, O'Leary M, et al. Pharmacokinetics and pharmacodynamics of the myotoxic venom of Pseudechis australis (mulga snake) in the anesthetised rat. Clin Toxicol (Phila). 2014;52(6):604–610. doi: 10.3109/15563650.2014.914526.
- Isbister GK, Noutsos T, Jenkins S, et al. D‐dimer testing for early detection of venom‐induced consumption coagulopathy after snakebite in Australia (ASP‐29). Med J Aust. 2022;217(4):203–207. doi: 10.5694/mja2.51589.
- Isbister GK, Mirajkar N, Fakes K, et al. Phospholipase A2 (PLA2) as an early indicator of envenomation in Australian elapid snakebites (ASP-27). Biomedicines. 2020;8(11):459. doi: 10.3390/biomedicines8110459.
- Tonomura Y, Mori Y, Torii M, et al. Evaluation of the usefulness of biomarkers for cardiac and skeletal myotoxicity in rats. Toxicology. 2009;266(1–3):48–54. doi: 10.1016/j.tox.2009.10.014.
- Burch PM, Greg Hall D, Walker EG, et al. Evaluation of the relative performance of drug-induced skeletal muscle injury biomarkers in rats. Toxicol Sci. 2016;150(1):247–256. doi: 10.1093/toxsci/kfv328.
- Vassallo JD, Janovitz EB, Wescott DM, et al. Biomarkers of drug-induced skeletal muscle injury in the rat: troponin I and myoglobin. Toxicol Sci. 2009;111(2):402–412. doi: 10.1093/toxsci/kfp166.
- Bohlmeyer TJ, Wu AH, Perryman MB. Evaluation of laboratory tests as a guide to diagnosis and therapy of myositis. Rheum Dis Clin North Am. 1994;20(4):845–856. doi: 10.1016/S0889-857X(21)00069-7.
- Vanholder R, Sever MS, Erek E, et al. Rhabdomyolysis. J Am Soc Nephrol. 2000;11(8):1553–1561. doi: 10.1681/ASN.V1181553.
- Rasmussen M, Jin J-P. Troponin variants as markers of skeletal muscle health and diseases. Front Physiol. 2021;12:747214. doi: 10.3389/fphys.2021.747214.
- Bicer S, Reiser PJ. Myosin light chain isoform expression among single mammalian skeletal muscle fibers: species variations. J Muscle Res Cell Motil. 2004;25(8):623–633. doi: 10.1007/s10974-004-5070-9.
- Berna MJ, Zhen Y, Watson DE, et al. Strategic use of immunoprecipitation and LC/MS/MS for trace-level protein quantification: myosin light chain 1, a biomarker of cardiac necrosis. Anal Chem. 2007;79(11):4199–4205. doi: 10.1021/ac070051f.
- Churchman A, O'Leary MA, Buckley NA, et al. Clinical effects of red‐bellied black snake (Pseudechis porphyriacus) envenoming and correlation with venom concentrations: Australian snakebite project (ASP‐11). Med J Aust. 2010;193(11–12):696–700. doi: 10.5694/j.1326-5377.2010.tb04108.x.
- Isbister GK, O'Leary MA, Elliott M, et al. Tiger snake (Notechis spp) envenoming: Australian snakebite project (ASP‐13). Med J Aust. 2012;197(3):173–177. doi: 10.5694/mja11.11300.
- Kulawickrama S, O'Leary MA, Hodgson WC, et al. Development of a sensitive enzyme immunoassay for measuring taipan venom in serum. Toxicon. 2010;55(8):1510–1518. doi: 10.1016/j.toxicon.2010.03.003.
- Apple F, Hellsten Y, Clarkson P. Early detection of skeletal muscle injury by assay of creatine kinase MM isoforms in serum after acute exercise. Clin Chem. 1988;34(6):1102–1104. doi: 10.1093/clinchem/34.6.1102.