
 ?Mathematical formulae have been encoded as MathML and are displayed in this HTML version using MathJax in order to improve their display. Uncheck the box to turn MathJax off. This feature requires Javascript. Click on a formula to zoom.
ABSTRACT
Coal can be considered as the main fuel for electricity generation in Afghanistan. However, there is a quite limited data available about the overall quality, distribution, and character of coals in Afghanistan. Specific gravity (S.G) of coal as a key factor can be used for the estimation of potential tonnage production and be a fundamental parameter for the selection of coal washery process method. However, there is no investigation which comprehensively explores relationships between S.G and coal properties. In this investigation, the potential of S.G prediction based on conventional properties for Afghan coal samples was explored by stepwise regression and random forest. Pearson correlation (r) and variable importance measurement (VIM) of random forest (RF) were applied to select the most effective variables among conventional parameters for the S.G prediction. Results of VIM indicated that ash and carbon content of coal samples had the highest importance for the S.G prediction. Stepwise regression and RF models were developed based on these two coal variables. Testing the generated models indicated that S.G of Afghan coals can quite accurately predict by these models (R2 > 0.90). Modeling outcomes showed that the highest S.G (S.G > 2) for Afghan coal occurred when ash was higher than 40% and carbon was lower than 30%.
Introduction
Afghanistan mainly acquires its required electricity from neighbors. For more than a century, one of the most significant impediments in Afghanistan has been the lack of adequate fuel for power generation (Hare et al. Citation2008; SanFilipo Citation2005; Wnuk Citation2016) and around 70% of Afghans do not have a reliable access to electricity (Doebrich et al. Citation2006; Hackley et al. Citation2010; Hare et al. Citation2008; Tewalt et al. Citation2010; Wnuk Citation2016). However, some studies have been conducted to find the potential coal deposits, and it was reported that Afghanistan has potentially abundant coal resources (Jacob Citation1961; Siebdrat and Weippert Citation1963; Wood et al. Citation1983). However, the maximum coal production in the country was reported to be around 1900 short tons in 2016. This production generally has been used for small industries while sustainable electrical generation from coal has not occurred until now. This is obvious due to the fact that many coal deposits are not accessible as a result of a specific situation in the country. Thus, techniques that are not typically used for coal production assessments (indirect methods), can be considered as an initial step for the development (Doebrich et al. Citation2006; Hare et al. Citation2008, Citation2008; Tewalt et al. Citation2010; Wnuk Citation2016).
It was documented that coal specific gravity (S.G) can be used to have an indirect estimation for the tonnage of productions. Since S.G varies based on coal rank, various coal ranks have different conversion factors () (Wood et al. Citation1983). Moreover, S.G is a critical factor for the selection of processing methods in coal washery plants. The inorganic part of coal has much higher S.G than its organic fracture; thus, gravity beneficiation techniques (such as jig) are widely used for coal cleaning and rejection of impurities before shipping coal to the power plants. These impurities decrease the gross calorific value of coals if they associated with coal (Lopamudra et al. Citation2012; Rong and Lyman Citation1992). Therefore, prediction of S.G based on various conventional coal properties (i.e. proximate and ultimate analyses) may have several advantages.
Table 1. Conversion factors for various coal samples (Wood et al. Citation1983).
Meanwhile, while little is known about the properties of Afghan coals, using the existing data to model their essential characters may provide insight about possible developments in the future. In the modeling of fossil energy resources due to their heterogeneous structures, variable selection is significantly important. Considering all conventional properties as input variables for a generation of a statistical model may potentially improve the coefficient of determination (R2) of a predictive model, while it can increase the potential of overfitting or adapting in models. Variable importance measurement (VIM) of Random Forest (RF) and Stepwise regression can be used for variable selection and overcome those drawbacks. In this study, relationships between S.G of Afghan coal samples and their conventional properties are explored by using Pearson correlation (r) and VIM of RF. RF and stepwise regression are used to generate models for S.G prediction. To our best knowledge, this is the first study which explores relationships between conventional coal parameters and specific gravity and models it.
Material and methods
Dataset
In a collaboration between the U.S. Geological Survey and the Afghan Ministry of Mines and Industries, some of the coal resources in Afghanistan were assessed. More than eighty coal samples from different mines () were prepared, and their properties (i.e. proximate, ultimate, ash oxides, and S.G) were determined () based on the ASTM standards. The main purpose was to evaluate the quality, quantity, and distribution of coal throughout Afghanistan. The data is available online as a part of the World Coal Quality Inventory (WoCQI) (Chehreh Chelgani and Makaremi Citation2013; Tewalt et al. Citation2010). This database was used to assess and model relationships between S.G and coal conventional properties.
Table 2. Descriptive statistics of Afghan coal properties (as received).
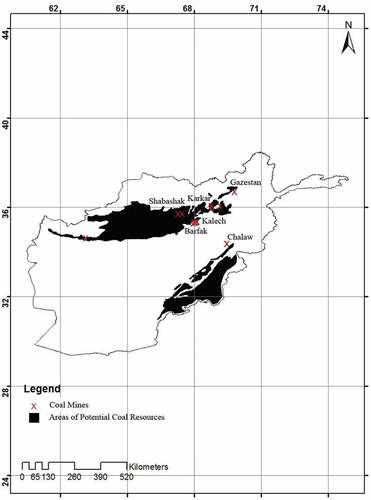
Figure 1. Potential coal resources in Afghanistan and sample locations.
Statistical methods
Pearson correlation
Pearson correlation (r) is considered to explore linear inter-correlations between coal conventional properties and S.G. “r” is a value, which is varied between −1 and 1. Negative values show that two variables are negatively correlated linearly, on the contrary with positive values. “r” around zero means there is absolutely no relationship between two variables. “r” between X and Y is calculated based on the following equation (SPSS Citation2004):
Stepwise regression
As the importance of variable selection for a generation of predictive models for fossil fuels such as coal was mentioned, stepwise regression was considered to have a realistic regression model. In this model, independent variables with not significant correlations are eliminated from the model and just those variables that can improve the accuracy of a multivariable model are retained in the regression equation. In general, all input variables systematically are checked and irrelevant variables with non-significant influences removed from the model (SPSS Citation2004).
Random forest
Capturing both linear and nonlinear correlations between input and output variables for generation of a predictive model improves the level of understanding, removes noisy factors, and helps to develop an accurate system (Chehreh Chelgani et al., Citation2016a; Matin et al. Citation2016; Nazari et al. Citation2018; Shahbazi, Chehreh Chelgani, and Matin Citation2017). Where there is always a significant concern whether regression can capture both linear and nonlinear relationships between variables simultaneously (Matin et al. Citation2016; Shahbazi, Chehreh Chelgani, and Matin Citation2017; Matin et al., Citation2018), such a drawback can be solved by variable importance measurement (VIM) methods of Random forest (RF). RF, as a tree-based model, can simultaneously measure both linear and nonlinear relationships between predictor variables and outputs. Permutation accuracy importance (PAI) is the most popular VIM in RF. The PAI between inputs and output variables is measured based on a comparison between the difference in the estimation accuracy of a tree before and after random permutation. PAI can be ranked regarding the average of differences over all trees. PAI value close to zero means that variable is not an important predictor. The empirical PAI equation for the variable Xj is defined by EquationEqn. 2(2)
(2) where
is a replicate of ℒ in the values of Xj.
has been randomly permuted, and
, …,
are the indices of the trees which were built from bootstrap replicates that do not include (xi, yi) (Matin and Chehreh Chelgani Citation2016; Chehreh Chelgani et al., Citation2016b; Shahbazi, Chehreh Chelgani, and Matin Citation2017).
After VIM, high-ranked variables are generally selected for generation of an RF predictive model. The RF model for sample xη, while K is the ensemble size, can be generated based on EquationEqn. 3(3)
(3) . In this equation; L(θ) of size n is a different bootstrapped sample which computed after the training set (L) of size N modified for each new tree. Each tree predictor “TL(θ)” depends on the random vector θ. θ represents the bagged samples from the original learning set L (Matin and Chehreh Chelgani Citation2016; Chehreh Chelgani et al., Citation2016b).
Results and discussion
Variable importance measurement
Proximate analysis
Proximate analysis is based on ASTM D3172 (Citation2013), which is a straightforward and fast test in the muffle furnace. In the proximate analysis, moisture (M), volatile matter (VM), and ash (A) of coal samples are measured. Fixed carbon (FC) is also determined by subtracting their summation from 100% (FC% = 100-(M+ VM+ A)))ASTM D3172(. Thus, FC incorporates the errors of other measured variables and should not be considered as an input variable for generating a predictive model (Chehreh Chelgani et al., Citation2016a).
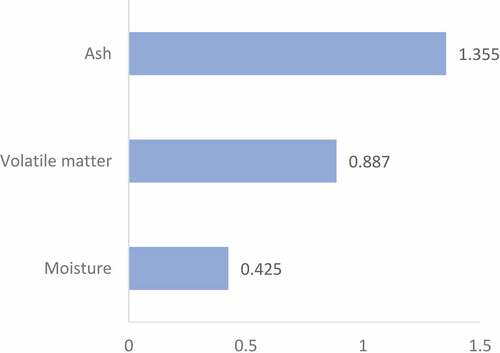
Pearson correlation between proximate variables and S.G indicates that ash has the highest absolute linear correlation among proximate parameters with S.G (). Pearson correlation results show by increasing VM, S.G decreases (). In other words, the S.G before beneficiation is mostly dependent on the inorganic part of coal while this is logical that lower rank (high VM) coals are less dense. VIM results of RF for nonlinear relationship assessments are in agreement with Pearson correlations and indicate ash has the highest importance for S.G estimation between proximate parameters (). These results are also in respectable agreement with previous investigations, which demonstrated there is a high positive correlation between inorganic material and S.G of coal samples (Mohanty et al. Citation2012).
Figure 2. Relationship between proximate analysis parameters and S.G by Pearson correlation.
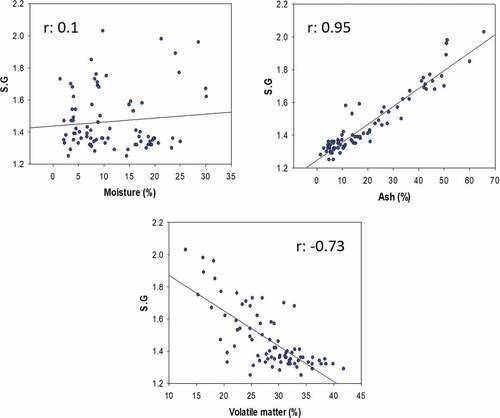
Figure 3. Variable importance measurement by RF between proximate parameters for S.G prediction.
Ash oxide
It is understood that ash is not the original mineral matter in the coal structure. Ash is composed of the altered inorganic minerals within coal samples. Based on ASTM D3172 to determine ash, samples are heated in a ventilated muffle furnace at temperatures 700 to 750◦C for 4 hours (ASTM D3172). During this period silicates may loss water, carbonates can lose carbon dioxide, pyrite may produce SO2 and oxidize, etc. Thus, various weight changes may happen during the ash determination process (Elliott Citation1981; Given and Yarzab Citation1978; Speight Citation1994). The analysis of coal ash generally shows the amounts of silica (SiO2), alumina (Al2O3), ferric oxide (Fe2O3), titanium oxide (TiO2), phosphorus pentoxide (P2O5), calcium oxide (CaO), magnesium oxide (MgO), sodium oxide (Na2O), and potassium oxide (K2O) (Speight Citation2005). These elements have been recommended to be used as predictor variables instead of the ash content for the estimation of HGI, Free swelling index (FSI), and Maximum fluidity (MF) of coal in different investigations (Chehreh Chelgani, Dehghan, and Hower Citation2011a; Chehreh Chelgani et al. Citation2011c; Chehreh Chelgani, Hower, and Hart Citation2011b; Chehreh Chelgani et al. Citation2008; Chehreh Chelgani and Matin Citation2018; Hadavandi and Chehreh Chelgani Citation2019; Jorjani et al. Citation2008).
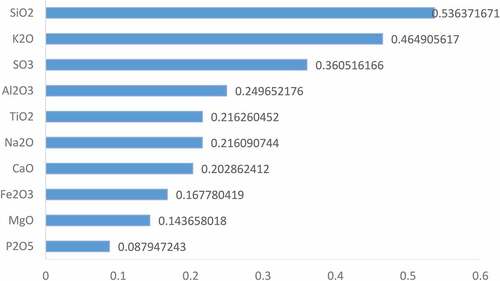
Analysis of ash oxide shows that SiO2 and Al2O3 have the highest contents in the Afghan coal samples (). Pearson correlation and VIM of RF are used to determine relationships between these ash oxides and S.G. Pearson assessments indicate that SiO2 and K2O have the highest positive linear correlations with S.G among ash oxides (). SO3 and Fe2O3 have the highest linear negative correlations. Based on , these negative correlations are as a result of high percentage of these oxides in some samples. Otherwise, these correlations are not significant in comparison with the correlation between ash content and S.G (r: 0.95 vs. 0.52). Moreover, VIM of RF, which is used to assess nonlinear capability of ash oxides for S.G prediction, illustrates that SiO2 has the highest importance among ash oxides for S.G prediction (). However, the importance of SiO2 is quite lower than the importance of the ash content for the prediction of S.G. Thus, ash percentage is selected to be used as an input variable for the generation of S.G predictive models.
Figure 4. Pearson correlation between S.G and ash oxides.
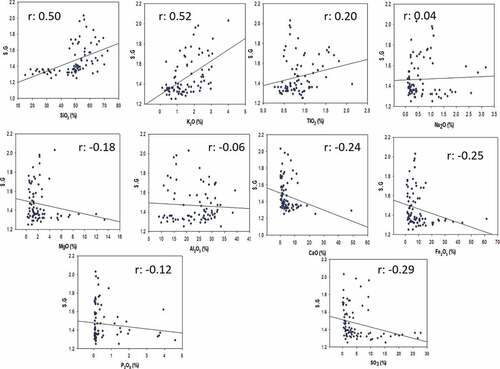
Figure 5. Variable importance measurement by RF between ash oxides.
Ultimate analysis
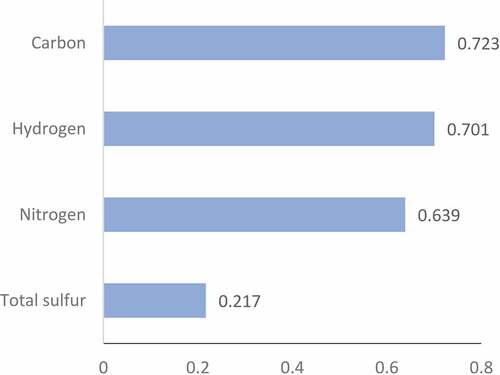
ASTM D3176 is a standard test for the ultimate analysis (ASTM D3176, Citation2015). This test determines the percentages of Hydrogen (H), Carbon (C), Nitrogen (N), Total sulfur (TS), and Oxygen (O) in coal samples. H, C, N, and TS are measured and O is calculated based on subtracting the summation of other elements from 100 (O% = 100-(H + N + TS + C)) [32]. Thus, O cannot be considered for the modeling approaches. H, C, N represent the organic part of coal samples. As Pearson correlations show there is a significant negative linear correlation between S.G and the organic part of coal samples (). Carbon has the highest negative correlation. In other words, by increasing the content of organic parts in the structure of coal samples, their S.G decreases. VIM between ultimate analysis parameters also indicates that carbon has the highest rank for the S.G prediction (). Therefore, ash and carbon are selected as input variables for the generation of an RF model to predict S.G of the coal samples.
Figure 6. Relationships between ultimate analysis variables and S.G.
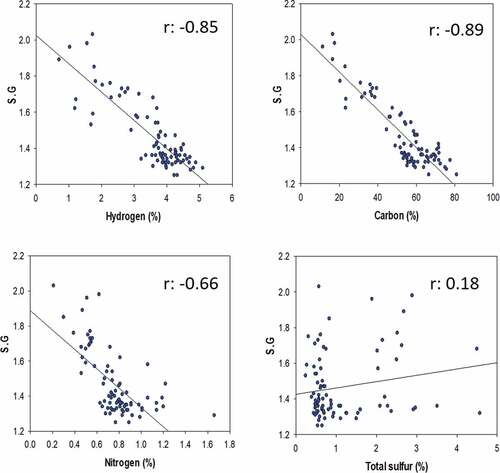
Figure 7. Variable importance measurement by RF between ultimate analysis variables.
Predictive models
For the modeling purposes from the entire database, randomly 70% of records are collected for the training section and the rest 30% of the dataset are used for the testing phase of the generated models. To develop an S.G predictive model by stepwise regression, variables which have the significant Pearson correlations value (|r|>0.5) with S.G are considered as input parameters: ash, volatile matter, carbon, hydrogen, and nitrogen. Stepwise regression selected ash and carbon as input variables to develop a predictive equation (EquationEqn. 4)(4)
(4) . Testing of the predictive regression model indicates that the stepwise model can accurately predict S.G ()).
Figure 8. Relationship between actual S.G and its predicted value by various models.
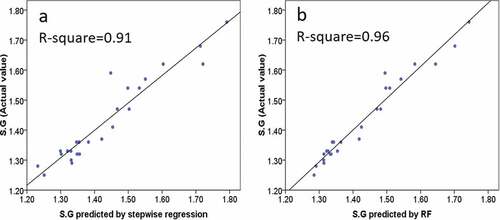
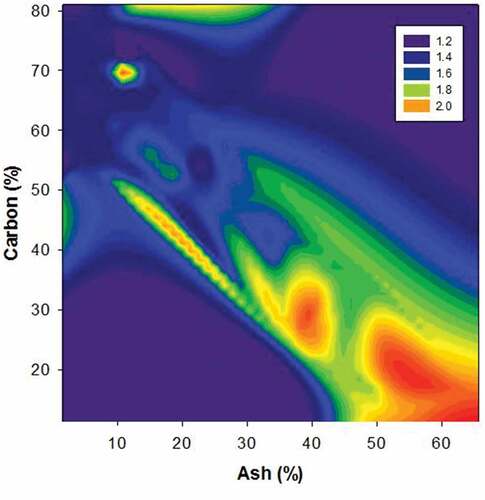
The RF model is considered to check the potential of improving stepwise regression results. Based on VIM outcomes, carbon and ash have the highest importance for the S.G prediction. Thus, they were considered as input variables for developing RF model. For comparison purposes, the same dataset, which used for stepwise regression is applied for RF modeling. The training process of the RF model is stopped after the generation of 1000 trees (forest) that means the RF model met the minimum possible error for the estimation of S.G after. Results of the testing phase of the developed RF model ()) indicate a significant improvement in the S.G prediction accuracy by RF model in comparison with the stepwise regression model (R2 = 0.96 vs. R2 = 0.91, respectively). A counterplot of relationships between carbon, ash, and S.G illustrates that the highest S.G for Afghan coal occurred when ash was higher than 40% and carbon was lower than 30% (as received coal basis) (). Based on these significant results, it can be concluded that the generated RF model can yield significant VIM and predictions of S.G. These results and suggested methods can be considered as systems for indirect evaluation of various parameters in Afghanistan and other coal resources.
Figure 9. Relationships between ash, carbon and S.G.
Conclusion
It was well understood that specific gravity of coal is a critical factor, which can be used for the estimation of tonnage production and gravity separation. Thus, stepwise regression and random forest were used to model specific gravity of Afghan coals based on their conventional properties (proximate and ultimate). Pearson correlation and variable importance measurement of the random forest showed that ash and carbon have the highest predictive ability for the specific gravity estimation of Afghan coals while other variables such as ash oxide did not show significant correlations. Generating and testing of regression and random forest models for specific gravity prediction by using the most effective variables (ash and carbon) indicated that S.G can be accurately predicted (in the testing stage, stepwise regression: R2 = 0.91 and random forest: R2 = 0.96). The counterplot between carbon, ash, and S.G demonstrated that the highest S.G for Afghan coal occurred when ash was higher than 40% and carbon was lower than 30%.
Additional information
Notes on contributors
S. Chehreh Chelgani
S. Chehreh Chelgani is an associate professor at the Lulea university of Technology, Dr. Chelgani developed various investigation in process modeling, flotation, leaching and coal processing. Since 2016 he has been an editorial board member of some journals such as minerals, materials, etc. He has been named a TOP reviewer in the Global Peer Review Awards powered by web of science. He was adjunct prof. at the University of Michigan between 2015-2018. He has been in several industrial and academia projects and outcomes of some of those projects have been successfully published in high ranked journals (more than 80 publication and h-index: 25). As an outstanding researcher he has been awarded some of the most prestigious scholarships in Canada and USA (OGS, NSERC, etc.)
References
- ASTM D3172. 2013. Standard Practice for Proximate Analysis of Coal and Coke, 1–2. West Conshohocken, PA 19428-2959. United States: ASTM International.
- ASTM D3176. 2015. Standard Practice for Ultimate Analysis of Coal and Coke, 1–2. United States: ASTM International.
- Chehreh Chelgani, S., B. Hart, W. C. Grady, and J. C. Hower. 2011c. Study relationship between inorganic and organic coal analysis with gross calorific value by multiple regression and ANFIS. International Journal of Coal Preparation and Utilization 31 (1):9–19. doi:10.1080/19392699.2010.527876.
- Chehreh Chelgani, S., F. Dehghan, and J. C. Hower. 2011a. Estimation of some coal parameters depending on petrographic and inorganic analyses by using Genetic algorithm and adaptive neuro-fuzzy inference systems. Energy Exploration & Exploitation 29 (4):479–94. doi:10.1260/0144-5987.29.4.479.
- Chehreh Chelgani, S., J. C. Hower, and B. Hart. 2011b. Estimation of free-swelling index based on coal analysis using multivariable regression and artificial neural network. Fuel Processing Technology 92 (3):349–55. doi:10.1016/j.fuproc.2010.09.027.
- Chehreh Chelgani, S., J. C. Hower, E. Jorjani, S. Mesroghli, and A. H. Bagherieh. 2008. Prediction of coal grindability based on petrography, proximate and ultimate analysis with multiple regression and artificial neural network models. Fuel Processing Technology 89:13–20. doi:10.1016/j.fuproc.2007.06.004.
- Chehreh Chelgani, S., and S. Makaremi. 2013. Explaining the relationship between common coal analyses and Afghan coal parameters using statistical modeling methods. Fuel Processing Technology 110:79–85. doi:10.1016/j.fuproc.2012.11.005.
- Chehreh Chelgani, S., and S. S. Matin. 2018. Study the relationship between coal properties with Gieseler plasticity parameters by random forest. International Journal of Oil, Gas and Coal Technology 17 (1):113–27. doi:10.1504/IJOGCT.2018.089345.
- Chehreh Chelgani, S., S. S. Matin, and J. C. Hower. 2016b. Explaining relationships between coke quality index and coal properties by Random Forest method. Fuel 182:754–60. doi:10.1016/j.fuel.2016.06.034.
- Chehreh Chelgani, S., S. S. Matin, and S. Makaremi. 2016a. Modeling of free swelling index based on variable importance measurements of parent coal properties by random forest method. Measurement 94:416–22. doi:10.1016/j.measurement.2016.07.070.
- Doebrich, J. L., R. Ronald, W. Ludington, P. G. Chirico, C. J. Wandrey, R. G. Bohannon, G. J. Orris, J. D. Bliss, A. Wasy, and M. O. Younusi. 2006. Geologic and Mineral Resource Map of Afghanistan. U.S. Geological Survey 1–2.
- Elliott, M. A., Editor. 1981. Chemistry of Coal Utilization. Hoboken, NJ: Wiley.
- Given, P. H., and R. F. Yarzab. 1978. In analytical methods for coal and coal products, Vol. 2. In Editor. J. C. Karr, 20. San Diego, CA, Chap: Academic Press.
- Hackley, P. C., J. R. SanFilipo, G. P. Azizi, P. A. Davis, and S. W. Starratt. 2010. Organic petrology of subbituminous carbonaceous shale samples from Chalāw, Kabul Province, Afghanistan: Considerations for paleoenvironment and energy resource potential. International Journal of Coal Geology 81:269–80. doi:10.1016/j.coal.2009.12.007.
- Hadavandi, E., and S. Chehreh Chelgani. 2019. Estimation of coking indexes based on parental coal properties by variable importance measurement and boosted-support vector regression method. Measurement 135:306–11. doi:10.1016/j.measurement.2018.11.068.
- Hare, T. M., P. A. Davis, D. Nigh, J. A. Skinner, J. R. SanFilipo, K. S. Bolm, C. M. Fortezzo, D. Galuszka, W. R. Stettner, S. Sultani, et al. 2008. Data series 317-2008. Large-scale digital geologic map databases and reports of the North Coal district in Afghanistan1-20. Reston, Virginia: U.S. Geological Survey.
- Jacob, H. 1961. Ergebnisse der untersuchung von kohlenproben aus verschiedenen lagerstatten Afghanistan [Translation: Results of the examination of coal assays from various beds in Afghanistan]: Bundesanstalt für Bodenforschung, Hannover, Germany, 95 p, 5 Plates, (in German) [AGS no. 129].
- Jorjani, E., J. C. Hower, S. Chehreh Chelgani, M. A. Shirazi, and S. Mesroghli. 2008. Studies of relationship between petrography and elemental analysis with grindability for Kentucky coals. Fuel 87 (6):707–13. doi:10.1016/j.fuel.2007.05.044.
- Lopamudra, P., A. K. Sahoo, A. Tripathy, and A. K. Sahu. 2012. Application of artificial neural network to study the performance of jig for beneficiation of non-coking coal. Fuel 97:151–56. doi:10.1016/j.fuel.2012.02.018.
- Matin, S. S., J. C. Hower, L. Farahzadi, and S. Chehreh Chelgani. 2016. Explaining relationships among various coal analyses with coal grindability index by Random Forest. International Journal of Mineral Processing 155:140–46. doi:10.1016/j.minpro.2016.08.015.
- Matin, S. S., L. Farahzadi, S. Makaremi, S. Chehreh Chelgani, and G. Sattari. 2018. Variable selection and prediction of uniaxial compressive strength and modulus of elasticity by random forest. Applied Soft Computing 70:980–87. doi:10.1016/j.asoc.2017.06.030.
- Matin, S. S., and S. Chehreh Chelgani. 2016. Estimation of coal gross calorific value based on various analyses by random forest method. Fuel 177:274–78. doi:10.1016/j.fuel.2016.03.031.
- Mohanty, M. K., H. Wang, H. Akbari, and J. C. Hirschi 2012. In-plant demonstration of a low cost automation system for coal spirals. Final technical report February 1, 2012, through July 31, 2013. doi:10.1094/PDIS-11-11-0999-PDN
- Nazari, S., S. Chehreh Chelgani, S. Z. Shafaei, B. Shahbazi, S. S. Matin, and M. Gharabaghi. 2018. Flotation of coarse particles by hydrodynamic cavitation generated in the presence of conventional reagents. Separation and Purification Technology 220:61–68. doi:10.1016/j.seppur.2019.03.033.
- Rong, R. X., and G. J. Lyman. 1992. The effect of jigging time and air cycle on bed stratification in a pilot scale Baum jig. Fuel 71 (1):115–23. doi:10.1016/0016-2361(92)90201-X.
- SanFilipo, J. 2005. Assessing the coal resources of Afghanistan, prepared under the auspices of the U.S. Agency for International Development S. department of the interior fact sheet 2005–3073, S. Geological Survey paper June
- Shahbazi, B., S. Chehreh Chelgani, and S. S. Matin. 2017. Prediction of froth flotation responses based on various conditioning parameters by Random Forest method. Colloids and Surfaces A: Physicochemical and Engineering Aspects 529:936–41. doi:10.1016/j.colsurfa.2017.07.013.
- Siebdrat, H., and D. Weippert. 1963. Zwischenbericht über die Geologischen Arbeiten zum Kohlengebiet von Darra-i-Suf mit Vorschlagen für Bergbauliche Massnahmen [Translation: Interim report on the geologic workings in the Darra-i-Suf coal region with recommendations for mining actions]. Deutsche Geologische Mission, 29. 16 Plates (in German) [AGS no. 130].
- Speight, J. G. 1994. The chemistry and technology of coal. 2nd. Marcel Dekker, New York: CRC Press.
- Speight, J. G. 2005. Handbook of Coal Analysis. Hoboken, New Jersey: A john wiley & sons, inc., publication.
- SPSS. 2004. Version 13. Help Files. SPSS Inc.
- Tewalt, S. J., H. E. Belkin, J. R. SanFilipo, M. D. Merrill, C. A. Palmer, P. D. Warwick, A. W. Karlsen, R. B. Finkelman, and A. J. Park. 2010. Chemical analyses in the World coal quality inventory, Version 1. Reston, Virginia: U.S. Geological Survey.
- Wnuk, C. 2016. Coal resource potential of Afghanistan. International Geology Review 58 (3):321–41. doi:10.1080/00206814.2015.1071209.
- Wood, G. H., J. T. M. Kehn, M. D. Carter, and C. C. William. 1983. Coal resource classification system of the U.S. Geological Survey 65.