
 ?Mathematical formulae have been encoded as MathML and are displayed in this HTML version using MathJax in order to improve their display. Uncheck the box to turn MathJax off. This feature requires Javascript. Click on a formula to zoom.
ABSTRACT
There has been plenty of research on the influence of various socio-economic and demographic data on waste generation to develop effective and targeted waste reduction measures, including energy recovery. This study evaluates the relationship between the waste generation and Circular Material Use rate, Environmental Tax Revenue, and Global Innovation Index beyond the typical socio-economic factors (e.g., gross domestic product or population). Correlation analysis is conducted on the EU-27 datasets before the development of the predictive model. The correlation strength between the factors is discussed to identify the potential rebound effect from the central driver of economic growth and development. A positive correlation and partial rebound effect are identified in the data. The waste amount ending in disposal and energy recovery treatment increases with the Circular Material Use rate, suggesting that the expected gains from Circular Material Use rate are offset by other socio-economic factors such as increasing population or gross domestic product. However, a diminishing trend is observed in the rebound effect over the years. Multiple linear regression with validation is applied to identify the best fit model for predicting waste generation. Using population, gross domestic product, Circular Material Use rate, and Environmental Tax Revenues as independent variables, a model is generated with a mean absolute percentage error of 18.65% (7% lower than the benchmark) and R2 (coefficient of determination) of 0.995.
Introduction
Sustainable waste management plays an important role in transitioning from a linear economy (Fan et al. Citation2021) to a circular economy (MacArthur Citation2013). Circular economy receives great attention in the EU, where the Circular Economy Action Plan (European Union Citation2020) was established in 2020, confirming the intention of halving municipal waste by 2030. However, sustainable waste management is hindered by various challenges. Numerous technical, climatic, environmental, demographic, socio-economic, and legislative parameters are involved (Abdallah et al. Citation2020) in waste management. One of the challenges lies in the scarcity of reliable data for planning, including implementing appropriate infrastructures, practices, treatment, and recovery technologies. Multiple stakeholders manage waste, including municipalities and contractors, which complicate data collection and compilation, especially for remote communities without a systematic waste management system. The challenge in data collection is a common issue in both developing and developed countries although data collection systems have progressed for the latter. It is reflected in studies focusing on developing models for waste prediction or forecasting, including China (Duan et al. Citation2020), Vietnam (Nguyen et al. Citation2021), Thailand (Sun and Chungpaibulpatana Citation2017), India (Kumar and Samadder Citation2017), South Africa (Ayeleru et al. Citation2021), Canada (Kannangara et al. Citation2018), the Czech Republic (Pavlas et al. Citation2020), Brazil (Teixeira et al. Citation2020), the Russian Federation (Gil’mundinov, Tagaeva, and Boksler Citation2020), OECD, and EU-28 countries (Adamović et al., Citation2017). Waste forecasting is helpful for planning and budget allocation ahead of waste management initiatives. Such forecast and application domain, including energy recoveries (Melikoglu Citation2020), such as evaluation of energy potential (Abdelli et al., Citation2020) and other optimal operations of waste management, has been summarized by Abdallah et al. (Citation2020). The application in supporting recycling programs (Baird, Curry, and Reid Citation2013) and landfill disposal planning (Hoque and Rahman Citation2020) has also been reported.
Various artificial intelligence (AI) approaches to municipal solid waste generation have been classified under different regional scales, as summarized by Beigl, Lebersorger, and Salhofer (Citation2008). Machine learning (ML) tools, including support vector machine, adaptive neuro-fuzzy inference system, artificial neural networks (ANN), and k-nearest neighbors (kNN), have been assessed (Abbasi and El Hanandeh Citation2016). ML provides tools for decision-makers to implement effective waste management policies for environmental impact mitigation and remains ongoing research. The ANN is among the most utilized modeling approaches to predict waste generation, including domestic, commercial, and construction waste (Coskuner et al. Citation2021). In exploring different approaches, Chhay et al. (Citation2018) proposed ANN models as the most acceptable model to forecast waste generation in China compared to the gray model and linear regression. A study on forecasting the composition of municipal solid waste has been conducted by Ma et al. (Citation2020) using backpropagation ANN methodology for China. Wu et al. (Citation2020) utilized an ANN for municipal solid waste prediction in mainland China and found that region division could increase prediction accuracy. Kannangara et al. (Citation2018) considered eight socio-economic parameters with a correlation ranging from −0.56 to 0.37 for municipal solid waste generation prediction using decision trees and ANN. Nguyen et al. (Citation2021) applied random forest and kNN algorithms to the forecasting model and highlighted urban population as the most critical and definitive variable.
In addition to ML tools, statistical learning methods have also been applied to this problem. Several regression models have been developed by Ghinea et al. (Citation2016) to forecast different solid waste fractions for Iasi Romania. Abdulredha et al. (Citation2018) developed a multiple regression model with an R2 of 0.799 to predict the waste composition of the solid waste from a hotel. Karpušenkaitė, Ruzgas, and Denafas (Citation2016) showed that non-parametric regression methods could best forecast medical waste generation in Lithuania. Multiple variable regression models are suggested for Palestine (Al-Khatib et al. Citation2016). A multiple linear regression model for Mexico using social and demographic as independent variables has been conducted by Araiza-Aguilar, Rojas-Valencia, and Aguilar-Vera (Citation2020), suggesting that the population is the most important predictor. Population, inflation rate, gross domestic product (GDP) per capita, and unemployment rate by Bayesian optimization tuned Gaussian process regression have also been conducted by Ceylan (Citation2020) to estimate the municipal solid waste in Turkey. The advantages and disadvantages of different AI models have been summarized comprehensively by Abdallah et al. (Citation2020). ANNs generally have higher predictive power and lower sensitivity to outliers than the regression method in forecasting waste generation. However, they also require higher input variables, resulting in comparatively high error susceptibility (Dataflair Citation2021), and it is a black-box approach. ANNs can learn abstract representations of a dataset, but the representations are difficult to interpret by human analysts. Linear regression offers low computational cost and interpretability; however, they are not suitable for highly non-linear data (Abdallah et al. Citation2020). Model selection depends on the purpose, type of assessed relationship, data handling, and interpretation requirements.
Demographic and socio-economic factors serve as influential variables in predicting waste generation. However, the nature of causality is highly complex and varies from country to country. They are also often the cause of the rebound effect (Vivanco and van der Voet Citation2014), undermining the efforts of waste generation reduction (Salemdeeb et al. Citation2017). Al-Salem, Al-Nasser, and Al-Dhafeeri (Citation2018) included additional variables such as agricultural production and construction in the multiple regression models to predict solid waste generation in Kuwait. Cubillos (Citation2020) developed a long short-term memory ANN to forecast the household waste generated at Herning (Denmark) using weather and ambient variables. The model by Cubillos (Citation2020) is suggested to improve the prediction accuracy by 85% compared to the autoregressive integrated moving average (ARIMA) model. Noori, Karbassi, and Sabahi (Citation2010) also suggested that seasonality is effective for waste prediction in Mashhad, Iran, especially for weekly prediction (Vu, Ng, and Bolingbroke Citation2019). The impact of weather on waste generation, especially the daily waste generation rate for waste collection planning, has also been related by Jiang, Fan, and Klemeš (Citation2021). Grazhdani (Citation2016) assessed the impact of waste management policy, including pay-as-you-throw, cumulative recycling education expenditure, and the number of drop-off recycling centers on the waste generation rate.
Sustainability-related indicators could also be useful as explanatory variables, but their use is still underexplored. The importance of a predictive model for waste generation and the challenges in waste data collection have been elucidated. One issue remains the intention to assess a broader range of independent/explanatory variables. The reason is to enhance the predictive power. One of the efforts to include sustainability-related indicators has been performed by Jassim, Coskuner, and Zontul (Citation2021), considering total annual CO2 emissions in addition to population, GDP, and yearly tourist numbers. The CO2 emissions and domestic material consumption are also applied by Adamović et al. (Citation2017). The other potential sustainability-related indicators which have not been investigated as independent variables are the Circular Material Use rate (Eurostat Citation2021a), Environmental Tax Revenues (Eurostat Citation2020), and the Global Innovation Indexes (WIPO, World Intellectual Property Organization Citation2020). The Circular Material Use rate measures the share of material recovered and fed back into the economy in overall material use (Eurostat Citation2021a). The selection of Circular Material Use rate as a variable could be questionable as the waste data is required, which deem as challenging. The justification is that the Circular Material Use rate accounted for a fraction of waste being recycled, thus reducing primary raw material requirement. The data on a waste portion that is recycled is often readily available, e.g., recycling companies, compared to the unattended waste. Incorporating the other variables could be significant in predicting the total waste generation, including the untreated waste with high environmental impacts. Environmental Tax Revenues (Eurostat Citation2020) consisting of revenue from pollution and resource tax could have an interrelation with the waste generation, deserving more assessment, as emphasized by Carattini, Baranzini, and Lalive (Citation2018). In a dynamic panel estimation, De Weerdt et al. (Citation2020) suggested that taxation of plastic waste incineration has a suppressive effect on its generation. The Global Innovation Index (GII) (WIPO, World Intellectual Property Organization Citation2020) is a multi-dimensional country-level index consisting of seven main categories, measuring the innovation performance in terms of institutions, human capital and research, infrastructure, market sophistication, business sophistication, knowledge technology outputs, and creative outputs. Although it is primarily meant to quantify links between knowledge resources and economic state, it provides insight into sustainable development from a different perspective, similar to covering the socio-economic aspect. This comprehensive index is expected to have an impact on waste generation both positively and negatively. For example, the causal relationship between the GII, competitiveness, and foreign trade has been assessed by Sener and Delican (Citation2019). However, the relationship of this index to waste generation is yet to be identified.
This study aims to quantify the relationship of socio-economic and sustainability-related variables to waste generation in the EU-27 countries. A multiple linear regression model is developed for waste generation estimation due to its simplicity and interpretability; such a model can contribute insights for better waste management, including waste reduction. The assessment of the associated relationships could be beneficial to improve the predictive model. The novel contributions of this work are:
A more comprehensive range of independent variables is assessed, including Circular Material Use rate, Environmental Tax Revenues, and the GII, beyond socio-economic factors (the classic independent variables).
A multiple regression model is built for waste amount estimation in EU-27 countries with cross-validation, where the correlation, including the rebound effect, is interpreted.
Methods
shows the overall framework to assess the relationship between different variables and develop the model for waste generation prediction. The dataset of EU-27 countries from the Year 2015–2019 is consolidated, forming 135 rows. The dependent variables are the amount of generated waste (Eurostat Citation2021b). Independent variables included in the dataset are GDP, population, energy consumption, Circular Material Use rate, Environmental Tax Revenues, and GII. They are extracted from Eurostat (Citation2021b), except GII, which is based on WIPO, World Intellectual Property Organization (Citation2020).
Figure 1. Overall framework in assessing the relationship of different variables and developing the waste generation prediction model
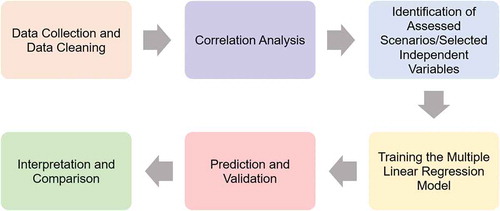
Table S1 summarizes the assessed independent variables, including the formal definition and the rationale of inclusion. The Circular Material Use rate is defined as the ratio of the circular use of materials to the overall material use. A higher circularity rate value indicates that more secondary materials substitute for primary raw materials, contributing to lower environmental impacts of primary material extraction. Environmental Tax Revenues considered in this study are the sum of pollution and resource tax. GII is a measure of the economy’s innovation performance. The total overall GII score, GII C1 (Institutions Index), GII C2 (Human Capital and Research Index), GII C3 (Infrastructure Index), GII C4 (Market Sophistication Index), GII C5 (Business Sophistication Index), GII C6 (Knowledge and Technology Outputs Index), GII C7 (Creative Outputs Index), G 3.1 (Information and Communication Technologies Index), G 3.1.2 (ICT use Index), and G 3.3 (Ecological Sustainability Index) are assessed. A total of 132 sets of data (132 rows × 16 columns) are utilized after the data cleaning, removing the incomplete/missing waste generation data in some EU-27 countries, and provided as supplementary material in Table S2.
Pearson correlation (Bewick, Cheek, and Ball Citation2003), as in EquationEq(1(1)
(1) ), is used to understand the degree of the relationship between linearly related variables. It serves as data preprocessing to enhance understanding the variables and multicollinearity (Alin Citation2010) before developing the regression model. The correlation between the Circular Material Use rate and the waste amount with non-circular use (Eurostat Citation2021c) is further assessed. The waste categorized under Circular Material Use rate comprises the recovery operation R2 to R11, defined in the Waste Framework Directive (Eur-lex Citation2018). Waste amount with non-circular use is estimated according to the waste sent to D10 (Disposal – incineration), R1 (Non-material recovery – energy recovery), D1–D7, and D12 (Disposal – landfill and other). It is intended to understand the contribution of materials recycled and fed back into the economy to the amount of non-recovered waste for rebound effect (Vivanco and van der Voet Citation2014) detection.
where r is the Pearson correlation coefficient between (independent variables) and
(dependent variable),
is the number of observations,
is the value of
for
th observation, and
is the value of
for
th observation. Different combinations of independent variables are considered in developing the regression model, as summarized in . The selection basis is further discussed in Section 3.
Table 1. Combination of selected independent variables for model formulation
Correlation does not imply causation. Multiple linear regression, a statistical learning algorithm based on supervised learning (Goodfellow et al. Citation2016), is applied in this study to identify the best fitting model for EU-27 municipal waste generation prediction, as shown in EquationEq(2)(2)
(2) . The definition of municipal waste is produced by households, including similar wastes from sources such as commerce, offices, and public institutions collected by or on behalf of municipal authorities (Eurostat Citation2021c). The method of the ordinary least squares (OLS) model is followed. The model is built in Jupyter notebook, Version 6.3.0 (Jupyter Citation2021), with Scikit-learn, Version 0.24.1 (Scikit-learn Citation2021) and Numpy, Version 1.19.2 (NumPy Citation2021) as the main machine learning library, using Python programming language (Python Software Foundation Citation2021). The dataset is split into the ratio of 80% training data, 20% testing (27 observations) for cross-validation (Holdout Method).
The p-value (probability value), R2 (R-squared value, a relative measure of fit), adjusted R2, the confidence of interval, mean absolute percentage error (MAPE), and the physical meaning of the relationship are assessed to validate the model in predicting waste generation. MAPE is chosen to compare the forecasting accuracy instead of Root Mean Square Error (RMSE), considering the scale of the numbers/data used and the data volume. MAPE reported in percentage is calculated based on EquationEq(3(3)
(3) ), where a lower percentage represents a lower prediction error.
under the summation symbol means that the index
starts out equal to 1. It is incremented by one for each successive term, stopping where
.
is the actual value,
is the predicted value, and
is the number of times the summation iteration that happens.
Results and discussion
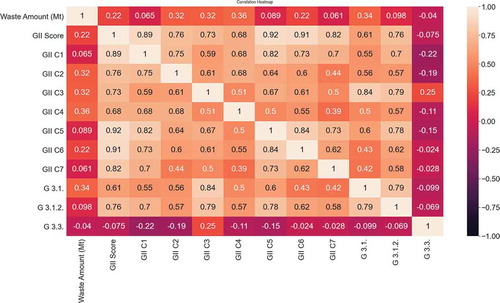
show the correlation of all the assessed variables. A strong correlation is observed between waste amount and GDP (0.99) and energy consumption (0.99), as shown in . This observation is generally consistent with the previous studies. The waste generation increases with the population increases and increases with GDP until the economic development reaches a certain extent (Wei et al. Citation2013). Popli et al. (Citation2021) concluded that population and GDP per capita are the most effective predictive model features. Circular Material Use rate (CE indicator) and Environmental Tax Revenues show a relatively moderate correlation of 0.42 and 0.39, considering a reasonably large sample size. The correlation between the waste amount and GII () is generally weak. A negative correlation is observed between waste amount and GII C 3.3. (Ecological Sustainability Index). However, the correlation is insignificant. The correlation results in are in contrast to the expected trends. Especially for the use of ICT (GII, category C 3.1) ,variable, such as e-services (e-shopping), is anticipated to positively affect waste generation. Xiao and Zhou (Citation2020) identified a correlation between the growth of the delivery industry (use of ICT) and the production of municipal solid waste. GII indexes have negligible suitability to be considered in the regression model. On top of the correlation to the dependent variables (waste amount), indicates a strong correlation between independent variables, especially energy consumption and GDP (0.99) and population (0.98). Although it is not perfectly correlated (1.00), special attention is still required in constructing the multiple regression model at the later stage as multicollinearity could undermine the statistical significance of an independent variable (Alin Citation2010).
Figure 2. Correlation between waste amount and the socio-economic indicators, CE indicator (circular material use rate), and environmental tax revenues
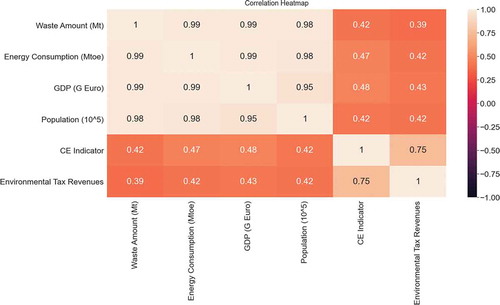
Figure 3. Correlation between waste amount and Global Innovation Indexes (GII)
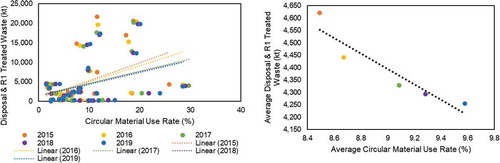
further explores the positive correlation between Circular Material Use rate with waste generation and focuses on non-circular use waste fraction. It shows the scatter plot between the Circular Material Use rate, representing the degree of circular economy, to the amount of disposal and energy recovered waste. By considering a moderate correlation (0.4), an interesting trend is observed, suggesting a potential partial rebound effect (Vivanco and van der Voet Citation2014) in the EU-27 countries when deliberated as a whole. The rebound effect shows a reduction in the expected gains from the Circular Material Use rate. The increase in Circular Material Use rate (%) is expected to decrease the amount of waste ended for energy recovery and disposal; however, the linear line in has shown an increasing trend. The rebound effect is not an isolated case. It has been reported that energy efficiency improvement is insufficient to offset the increasing service demand (Masanet et al. Citation2020). The increasing trend suggests that other factors, such as increasing population or increasing GDP, reduced the expected gains from Circular Material Use. However, the degree of increase shows a year-by-year reduction (), where the dots in different colors indicate years. The Circular Material Use rate started to minimize the impact of increment, e.g., population and GDP, on the amount of waste (disposal and R1 treated) ended in, e.g., landfill. It might eventually achieve zero rebounds where the actual resource savings are equal to the expected saving. The effort in waste reduction, as highlighted in the European Green Deal (Eur-lex Citation2019), material recovery, and recycling (Fan, Klemeš, and Hon Huin Citation2019) plays a significant role in achieving zero rebounds. Import and export activities for recycling considered in calculating the Circular Material Use rate (Eurostat Citation2021a) could also be the underlying reason for the variation and should be assessed further.
Figure 4. The scatter plot of (a) disposal and R1 (energy recovery)-treated waste versus circular material use rate from 2015 to 2019, with a correlation of 0.4; (b) the average values for circular material use rate based on years
summarizes the MAPE of the regression model developed based on a different combination of independent variables. Combination 3 has the highest error (71.10%). The model developed based on combinations 4 and 5 has the lowest MAPE, 18.56% and 18.59%. MAPE less than 20% could be a benchmark as a good forecast ability. However, as Gilliland (Citation2012) highlighted, it is sometimes inappropriate to interpret directly and more reasonably compared with the naive forecast in defining the forecasting performance.
Table 2. The mean absolute percentage of different combinations of independent variables for regression model
are plotted to illustrate the prediction error. shows the least combination of independent variables considered, namely GDP and population. Light purple shows the actual values of waste amount, where pink shows the predicted values. The overlap dots are represented by the mixture of pink and light purple colors. GDP and population are the typical features included in the regression model for waste prediction, where the relationship is well established. It could serve as the baseline scenario (benchmark) to assess the developed model performance, either better or worse. The improvement in (combination 2), where energy consumption is incorporated, is insignificant, and the numerical value suggests a MAPE of 24.33% (−1%). shows the cross-validation of combinations 3 and 6. Combination 3 () is constructed considering the high correlation among independent variables of GDP, population, and energy consumption. The high correlation (>0.95, ) put forward the potential of the independent variables depends on each other where only one is needed to represent the regression model. By assessing the model developed by GDP, Circular Material use rate and Environmental Tax Revenues (combination 3), the MAPE is as high as 71.10%. It is 46% higher than combination 1. As shown in , the overlap points are significantly lesser than the models based on the other combination of independent variables. There is a huge error (substantial gaps between the actual and predicted values) in observation 24 (). Population and GDP play significant roles in the regression model for waste generation prediction. shows the cross-validation of combination 6, the MAPE is high (30.43%), and the accuracy is lesser than combination 1. Combination 6 is infeasible as it consisted of too many variables (16) yet with a lower MAPE than combination 1 and the potential of overfitting.
Figure 5. Cross-validation – Fitting of OLS regression model based on (a) GDP and population only (combination 1 – benchmark) and (b) based on GDP, population, and energy consumption (combination 2). Light purple = actual value, pink = predicted value, and the overlap color suggests the predicted value is the actual value
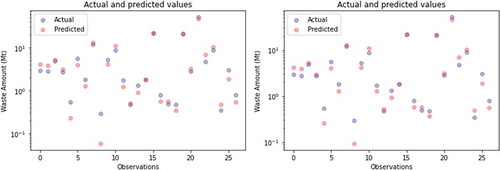
Figure 6. Cross-validation – Fitting of OLS regression model based on (a) GDP, Circular Material Use rate, and Environmental Tax Revenues (combination 3) and (b) 16 variables (combination 6). Light purple = actual value, pink = predicted value, and the overlap color suggests that the predicted value is as the actual value
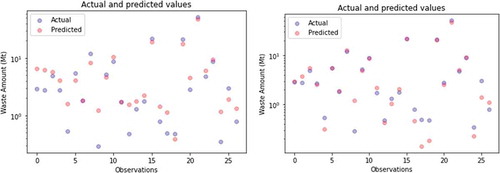
Figure 7. Cross-validation – Fitting of OLS regression model based on (a) all socio-economic indicators (combination 5) and (b) the selected best fit model (combination 4). Light purple = actual value, pink = predicted value, and the overlap color suggests that the predicted value is as the actual value
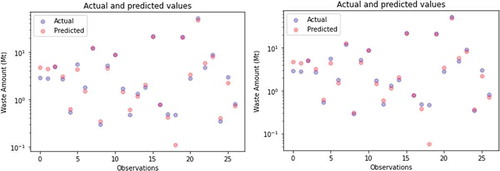
and b illustrates cross-validation by the regression model with a lower MAPE than combination 1 (benchmark). Combination 5 is having a slightly lower MAPE than combination 4. By referring to and b, the main error that contributes to the MAPE is at observation 18, showing a big gap between the actual value (light purple dot) and predicted value (pink dot). Based on MAPE value, the best fitting model should be combination 5. However, as a high correlation is detected between energy consumption, GDP, and population, the significance of energy consumption in the prediction model is evaluated. The p-value is first assessed, as shown in . All the p-values are less than 0.05, except energy consumption, whose value is 0.892; the null hypothesis cannot be rejected for the latter. The p-value indicates that the energy consumption is statistically insignificant. A similar suggestion is observed at the confidence interval. The coefficient of energy consumption ranges from −0.032 to 0.028. There is a possibility that energy consumption is having a coefficient of 0. Fewer variables without compromising the predictive power are preferable (Scheinost et al. Citation2019). This study proposes a regression model developed by combination 4 (see ) as the best fit model among the assessed models. The R2 value is reported as 0.995. A wide range of R2 has been reported in the previous studies ranging from relatively lower for a specific waste type (Kannangara et al. Citation2018) to as high as 0.999 (Ayeleru et al. Citation2021). The waste generation or waste amount can be predicted based on EquationEq(4)(4)
(4) :
Table 3. Ordinary least-squares regression results based on combination 5
Table 4. Ordinary least-squares regression results based on selected independent variables for the prediction model – combination 4
where is the waste generation (Mt),
is GDP (G EUR),
is population (105),
is Circular Material Use rate (%), and
represents the Environmental Tax Revenues (M Euro). Special attention is required in interpreting the negative sign in the coefficient of
. In multiple linear regression, the negative sign does not make it sufficient to conclude a negative correlation between waste generation and Circular Material Use rate (see , positive correlation), which could be due to the suppressor effect (Conger Citation1974). Although cross-validation and a simple model serving as a benchmark are conducted to prevent multicollinearity, the possibility could not be entirely eliminated. However, multicollinearity would not change the model predictive power (Frost Citation2021a), at least the training data, as illustrated in . Another possible issue to be further evaluated is the high R2. Despite the good prediction performance of the developed model, overfitting could exist (Frost Citation2021b). Overfitting occurs when the model describes the random error in the data rather than the relationships between variables (Hawkins Citation2004). This study is avoided by cross-validation, and there are no significant differences between the train and test score (high training score, low test (predicted) score = overfitting). There is still a likelihood that the model fits the dataset of EU-27 countries and fails to fit the additional data, e.g., data outside EU-27 countries.
Conclusions
This study generated a statistical predictive model for waste generation in the EU-27. It is an important basis for waste management planning, including a better waste allocation for recycling and energy recovery and a data-driven waste reduction policy. The statistical accuracy and cross-validation suggest that the multiple linear regression model consists of population, GDP, Circular Material Use rate, and Environmental Tax Revenue as the most appropriate for the waste generation prediction in the EU-27 countries. The mean absolute percentage error of the predictive model is 18.65% (<20% = good), relatively lower than the other combination of independent variables. This value is 7% lower than the benchmark model consisting of population and GDP as the independent variables (combination 1). The R2 is reported as 0.995, indicating that 99.5% of the waste generation variance is explained by the variance of the considered independent variables. The correlation between the variables has also been assessed. Several improvements can be conducted for future work, including
Extend the dataset to a broader set of countries and develop respective models based on clustered groups identified from Principal Component Analysis to further enhance the prediction power of the model and prevent overfitting.
None of the GII categories is selected as suitable predictors. For future work, the possibility of a non-linearity relationship can be assessed, e.g., by the ANN.
Other independent variables can be extracted from alternative economic and demographic datasets to capture additional effects.
The identified potential rebound effect of the Circular Material Use rate (expressed as a ratio of the lost benefit compared to the expected environmental benefit when holding waste generation constant) deserves a comprehensive assessment for a maximum benefit of waste recovery to the material.
The identified independent variables for waste generation prediction can be evaluated for suitability in building a waste composition prediction model, e.g., plastic waste fraction.
Supplemental Material
Download MS Word (46.1 KB)Acknowledgments
This research was supported by the EU project “Sustainable Process Integration Laboratory – SPIL,” project No. CZ.02.1.01/0.0/0.0/15_003/0000456 funded by the EU “CZ Operational Programme Research, Development and Education,” Priority 1: Strengthening capacity for quality research under the collaboration agreements with Universiti Teknologi Malaysia, Johor Bahru, Malaysia, and De La Salle University, Manila, the Philippines.
Disclosure statement
No potential conflict of interest was reported by the author(s).
Supplementary material
Supplemental data for this article can be accessed on the publisher’s website.
Additional information
Funding
Notes on contributors
Yee Van Fan
Yee Van FAN is a Key Researcher in the Sustainable Process Integration Laboratory – SPIL, Brno University of Technology, Czech Republic. Her expertise is on solid waste treatment and management with the extension to environmental/sustainability assessment. She is an associate member of Chartered Institution of Wastes Management, UK.
Jiří Jaromír Klemeš
Jiří Jaromír KLEMEŠ is a Professor and the Head of the Sustainable Process Integration Laboratory – SPIL, Brno University of Technology, Czech Republic. He is a Highly Cited Researcher and the founder and President of 24 y of PRES (Process Integration for Energy Saving and Pollution Reduction) conferences. His expertise and dominant research are related to Process Integration, Environmental Footprint minimisation, Sustainability, and Circular Economy.
Chew Tin Lee
Chew Tin LEE is a Professor at the School of Chemical & Energy Engineering, Universiti Teknologi Malaysia, Johor Bahru, Malaysia. She is an expert in waste treatment and management, including life-cycle analysis and community project management.
Raymond R. Tan
Raymond R. TAN is a Professor of Chemical Engineering and University Fellow of De La Salle University and an Academician of the Philippine National Academy of Science and Technology. His research focuses on the development of modelling techniques for planning sustainable systems. He received his BS and MS degrees in chemical engineering and PhD in mechanical engineering from De La Salle University.
References
- Abbasi, M., and A. El Hanandeh. 2016. Forecasting municipal solid waste generation using artificial intelligence modelling approaches. Waste Management 56:13–22. doi:https://doi.org/10.1016/j.wasman.2016.05.018.
- Abdallah, M., M. A. Talib, S. Feroz, Q. Nasir, H. Abdalla, and B. Mahfood. 2020. Artificial intelligence applications in solid waste management: A systematic research review. Waste Management 109:231–46. doi:https://doi.org/10.1016/j.wasman.2020.04.057.
- Abdelli, I. S., F. Y. Addou, S. Dahmane, F. Abdelmalek, and A. Addou. 2020. Assessment of methane emission and evaluation of energy potential from the municipal solid waste landfills. Energy Sources, Part A: Recovery, Utilization, and Environmental Effects 1–20. doi:https://doi.org/10.1080/15567036.2020.1813221.
- Abdulredha, M., R. Al Khaddar, D. Jordan, P. Kot, A. Abdulridha, and K. Hashim. 2018. Estimating solid waste generation by hospitality industry during major festivals: A quantification model based on multiple regression. Waste Management 77:388–400. doi:https://doi.org/10.1016/j.wasman.2018.04.025.
- Adamović, V. M., Antanasijević, D. Z., Ristić, M. Đ., Perić-Grujić, A. A., Pocajt, V. V. (2017). Prediction of municipal solid waste generation using artificial neural network approach enhanced by structural break analysis. Environmental Science and Pollution Research,24(1), 299–311.
- Adamović, V. M., D. Z. Antanasijević, M. Đ. Ristić, A. A. Perić-Grujić, and V. V. Pocajt. 2017. Prediction of municipal solid waste generation using artificial neural network approach enhanced by structural break analysis. Environmental Science and Pollution Research 24 (1):299–311. doi:https://doi.org/10.1007/s11356-016-7767-x.
- Alin, A. 2010. Multicollinearity. Wiley interdisciplinary reviews: Computational statistics. 2 (3):370–74. https://wires.onlinelibrary.wiley.com/doi/full/10.1002/wics.84
- Al-Khatib, I. A., I. Abu Fkhidah, J. I. Khatib, and S. Kontogianni. 2016. Implementation of a multi-variable regression analysis in the assessment of the generation rate and composition of hospital solid waste for the design of a sustainable management system in developing countries. Waste Management & Research 34 (3):225–34. doi:https://doi.org/10.1177/0734242X15622813.
- Al-Salem, S. M., A. Al-Nasser, and A. T. Al-Dhafeeri. 2018. Multi-variable regression analysis for the solid waste generation in the State of Kuwait. Process Safety and Environmental Protection 119:172–80. doi:https://doi.org/10.1016/j.psep.2018.07.017.
- Araiza-Aguilar, J. A., M. N. Rojas-Valencia, and R. A. Aguilar-Vera. 2020. Forecast generation model of municipal solid waste using multiple linear regression. Global Journal of Environmental Science and Management 6 (1):1–14.
- Ayeleru, O. O., L. I. Fajimi, B. O. Oboirien, and P. A. Olubambi. 2021. Forecasting municipal solid waste quantity using artificial neural network and supported vector machine techniques: A case study of Johannesburg, South Africa. Journal of Cleaner Production 289:125671. doi:https://doi.org/10.1016/j.jclepro.2020.125671.
- Baird, J., R. Curry, and T. Reid. 2013. Development and application of a multiple linear regression model to consider the impact of weekly waste container capacity on the yield from kerbside recycling programmes in Scotland. Waste Management & Research 31 (3):306–14. doi:https://doi.org/10.1177/0734242X12471100.
- Beigl, P., S. Lebersorger, and S. Salhofer. 2008. Modelling municipal solid waste generation: A review. Waste Management 28 (1):200–14. doi:https://doi.org/10.1016/j.wasman.2006.12.011.
- Bewick, V., L. Cheek, and J. Ball. 2003. Statistics review 7: Correlation and regression. Critical Care 7 (6):1–9. doi:https://doi.org/10.1186/cc2401.
- Carattini, S., A. Baranzini, and R. Lalive. 2018. Is taxing waste a waste of time? Evidence from a supreme court decision. Ecological Economics 148:131–51. doi:https://doi.org/10.1016/j.ecolecon.2018.02.001.
- Ceylan, Z. 2020. Estimation of municipal waste generation of Turkey using socio-economic indicators by Bayesian optimisation tuned Gaussian process regression. Waste Management & Research 38 (8):840–50. doi:https://doi.org/10.1177/0734242X20906877.
- Chhay, L., M. A. H. Reyad, R. Suy, M. R. Islam, and M. M. Mian. 2018. Municipal solid waste generation in China: Influencing factor analysis and multi-model forecasting. Journal of Material Cycles and Waste Management 20 (3):1761–70. doi:https://doi.org/10.1007/s10163-018-0743-4.
- Conger, A. J. 1974. A revised definition for suppressor variables: A guide to their identification and interpretation. Educational and Psychological Measurement 34 (1):35–46. doi:https://doi.org/10.1177/001316447403400105.
- Coskuner, G., M. S. Jassim, M. Zontul, and S. Karateke. 2021. Application of artificial intelligence neural network modeling to predict the generation of domestic, commercial and construction wastes. Waste Management & Research 39 (3):499–507. doi:https://doi.org/10.1177/0734242X20935181.
- Cubillos, M. 2020. Multi-site household waste generation forecasting using a deep learning approach. Waste Management 115:8–14. doi:https://doi.org/10.1016/j.wasman.2020.06.046.
- Dataflair. 2021. Advantages and disadvantages of machine learning language. accessed April 21, 2021. <data-flair.training/blogs/advantages-and-disadvantages-of-machine-learning/>
- De Weerdt, L., T. Sasao, T. Compernolle, S. Van Passel, and S. De Jaeger. 2020. The effect of waste incineration taxation on industrial plastic waste generation: A panel analysis. Resources, Conservation and Recycling 157:104717. doi:https://doi.org/10.1016/j.resconrec.2020.104717.
- Duan, N., D. Li, P. Wang, W. Ma, T. Wenga, L. Zhong, and G. Chen. 2020. Comparative study of municipal solid waste disposal in three Chinese representative cities. Journal of Cleaner Production 254:120134. doi:https://doi.org/10.1016/j.jclepro.2020.120134.
- Eur-lex. 2018. Directive 2008/98/ec of the European parliament and of the council. assessed April 20, 2021. <data.europa.eu/eli/dir/2008/98/2018-07-05>
- Eur-lex. 2019. The European green deal. assessed April 20, 2021. <eur-lex.europa.eu/legal-content/EN/TXT/?qid=1596443911913&uri=CELEX:52019DC0640#document2>
- European Union. 2020. Circular economy action plan for a cleaner and more competitive Europe. accessed August 25, 2020. <ec.europa.eu/environment/circulareconomy/pdf/new_circular_economy_action_plan.pdf>
- Eurostat. 2020. Environmental tax revenues. accessed April 21, 2021 <ec.europa.eu/eurostat/cache/metadata/en/env_ac_tax_esms.htm>
- Eurostat. 2021a. Circular material use rate. accessed April 21, 2021. <ec.europa.eu/eurostat/cache/metadata/en/sdg_12_41_esmsip2.htm>
- Eurostat. 2021b. Eurostat database. accessed April 21, 2021. <ec.europa.eu/eurostat/web/main/data/database>
- Eurostat. 2021c. Municipal waste by waste management operations. accessed April 21, 2021. <ec.europa.eu/eurostat/databrowser/view/ENV_WASMUN/default/table>
- Fan, Y. V., J. J. Klemes, and C. Hon Huin. 2019. Extended waste management pinch analysis (E-WAMPA) minimising emission of waste management: EU 28. Chemical Engineering Transactions 74:283–88. doi:https://doi.org/10.3303/CET1974048.
- Fan, Y. V., P. Jiang, J. J. Klemeš, P. Y. Liew, and C. T. Lee. 2021. Integrated regional waste management to minimise the environmental footprints in circular economy transition. Resources, Conservation and Recycling 168:105292. doi:https://doi.org/10.1016/j.resconrec.2020.105292.
- Frost, J. 2021a. Multicollinearity in regression analysis: Problems, detection, and solutions. accessed April 21, 2021 <statisticsbyjim.com/regression/multicollinearity-in-regression-analysis/>
- Frost, J. 2021b. Five reasons why your r-squared can be too high. accessed April 21, 2021. <statisticsbyjim.com/regression/r-squared-too-high/>
- Ghinea, C., E. N. Drăgoi, E. D. Comăniţă, M. Gavrilescu, T. Câmpean, S. I. L. V. I. M. Curteanu, and M. Gavrilescu. 2016. Forecasting municipal solid waste generation using prognostic tools and regression analysis. Journal of Environmental Management 182:80–93. doi:https://doi.org/10.1016/j.jenvman.2016.07.026.
- Gil’mundinov, V. M., T. O. Tagaeva, and A. I. Boksler. 2020. Analysis and forecasting of waste management processes in Russia. Studies on Russian Economic Development 31 (1):92–98. doi:https://doi.org/10.1134/S1075700720010074.
- Gilliland, M. 2012. The business forecasting deal: Exposing myths, eliminating bad practices, providing practical solutions. New Jersey, USA: John Wiley & Sons. doi:https://doi.org/10.1002/9781119199885.
- Goodfellow, I., Y. Bengio, A. Courville, and Y. Bengio. 2016. Deep learning. Vol. 1, No. 2, Cambridge, USA: MIT Press.
- Grazhdani, D. 2016. Assessing the variables affecting on the rate of solid waste generation and recycling: An empirical analysis in Prespa Park. Waste Management 48:3–13. doi:https://doi.org/10.1016/j.wasman.2015.09.028.
- Hawkins, D. M. 2004. The problem of overfitting. Journal of Chemical Information and Computer Sciences 44 (1):1–12. doi:https://doi.org/10.1021/ci0342472.
- Hoque, M. M., and M. T. U. Rahman. 2020. Landfill area estimation based on solid waste collection prediction using ANN model and final waste disposal options. Journal of Cleaner Production 256:120387. doi:https://doi.org/10.1016/j.jclepro.2020.120387.
- Jassim, M. S., G. Coskuner, and M. Zontul. 2021. Comparative performance analysis of support vector regression and artificial neural network for prediction of municipal solid waste generation, 0734242X211008526. Waste Management & Research. https://doi.org/10.1177%2F0734242X211008526
- Jiang, P., Y. V. Fan, and J. J. Klemeš. 2021. Data analytics of social media publicity to enhance household waste management. Resources, Conservation and Recycling 164:105146. doi:https://doi.org/10.1016/j.resconrec.2020.105146.
- Jupyter. 2021. accessed April 21, 2021. <jupyter.org/>
- Kannangara, M., R. Dua, L. Ahmadi, and F. Bensebaa. 2018. Modeling and prediction of regional municipal solid waste generation and diversion in Canada using machine learning approaches. Waste Management 74:3–15. doi:https://doi.org/10.1016/j.wasman.2017.11.057.
- Karpušenkaitė, A., T. Ruzgas, and G. Denafas. 2016. Forecasting medical waste generation using short and extra short datasets: Case study of Lithuania. Waste Management & Research 34 (4):378–87. doi:https://doi.org/10.1177/0734242X16628977.
- Kumar, A., and S. R. Samadder. 2017. An empirical model for prediction of household solid waste generation rate – A case study of Dhanbad, India. Waste Management 68:3–15. doi:https://doi.org/10.1016/j.wasman.2017.07.034.
- Ma, S., C. Zhou, C. Chi, Y. Liu, and G. Yang. 2020. Estimating physical composition of municipal solid waste in China by applying artificial neural network method. Environmental Science & Technology 54 (15):9609–17. doi:https://doi.org/10.1021/acs.est.0c01802.
- MacArthur, E. 2013. Towards the circular economy. Journal of Industrial Ecology 2:23–44.
- Masanet, E., A. Shehabi, N. Lei, S. Smith, and J. Koomey. 2020. Recalibrating global data center energy‐use estimates. Science 367 (6481):984‐986. doi:https://doi.org/10.1126/science.aba3758.
- Melikoglu, M. 2020. Appraising food waste generation and forecasting food waste to energy potentials of hospitals in Turkey: A global to local analysis. Sustainable Production and Consumption 24:292–97. doi:https://doi.org/10.1016/j.spc.2020.07.016.
- Nguyen, X. C., T. T. H. Nguyen, D. D. La, G. Kumar, E. R. Rene, D. D. Nguyen, and V. K. Nguyen. 2021. Development of machine learning-based models to forecast solid waste generation in residential areas: A case study from Vietnam. Resources, Conservation and Recycling 167:105381. doi:https://doi.org/10.1016/j.resconrec.2020.105381.
- Noori, R., A. Karbassi, and M. S. Sabahi. 2010. Evaluation of PCA and Gamma test techniques on ANN operation for weekly solid waste prediction. Journal of Environmental Management 91 (3):767–71. doi:https://doi.org/10.1016/j.jenvman.2009.10.007.
- NumPy. 2021. accessed April 21, 2021. <numpy.org/>
- Pavlas, M., R. Šomplák, V. Smejkalová, and P. Stehlík. 2020. Municipal solid waste fractions and their source separation: Forecasting for large geographical area and its subregions. Waste and Biomass Valorisation 11 (2):725–42. doi:https://doi.org/10.1007/s12649-019-00764-0.
- Popli, K., C. Park, S. M. Han, and S. Kim. 2021. Prediction of solid waste generation rates in urban region of Laos using socio-demographic and economic parameters with a multi linear regression approach. Sustainability 13 (6):3038. doi:https://doi.org/10.3390/su13063038.
- Python Software Foundation. 2021. Python language reference. accessed April 20, 2021. <www.python.org>
- Salemdeeb, R., D. F. Vivanco, A. Al-Tabbaa, and E. K. Zu Ermgassen. 2017. A holistic approach to the environmental evaluation of food waste prevention. Waste Management 59:442–50. doi:https://doi.org/10.1016/j.wasman.2016.09.042.
- Scheinost, D., S. Noble, C. Horien, A. S. Greene, E. M. Lake, M. Salehi, and R. T. Constable. 2019. Ten simple rules for predictive modeling of individual differences in neuroimaging. NeuroImage 193:35–45. doi:https://doi.org/10.1016/j.neuroimage.2019.02.057.
- Scikit-learn. 2021. accessed April 21, 2021. <scikit-learn.org/stable/>
- Sener, S., and D. Delican. 2019. The causal relationship between innovation, competitiveness and foreign trade in developed and developing countries. Procedia Computer Science 158:533–40. doi:https://doi.org/10.1016/j.procs.2019.09.085.
- Sun, N., and S. Chungpaibulpatana. 2017. Development of an appropriate model for forecasting municipal solid waste generation in Bangkok. Energy Procedia 138:907–12. doi:https://doi.org/10.1016/j.egypro.2017.10.134.
- Teixeira, E. D. C., M. A. S. González, L. F. M. Heineck, A. P. Kern, and G. M. Bueno. 2020. Modelling waste generated during construction of buildings using regression analysis. Waste Management & Research 38 (8):857–67. doi:https://doi.org/10.1177/0734242X19893012.
- Vivanco, D. F., and E. van der Voet. 2014. The rebound effect through industrial ecology’s eyes: A review of LCA-based studies. The International Journal of Life Cycle Assessment 19 (12):1933–47. doi:https://doi.org/10.1007/s11367-014-0802-6.
- Vu, H. L., K. T. W. Ng, and D. Bolingbroke. 2019. Time-lagged effects of weekly climatic and socio-economic factors on ANN municipal yard waste prediction models. Waste Management 84:129–40. doi:https://doi.org/10.1016/j.wasman.2018.11.038.
- Wei, Y., Y. Xue, J. Yin, and W. Ni. 2013. Prediction of municipal solid waste generation in China by multiple linear regression method. International Journal of Computers and Applications 35 (3):136–40. doi:https://doi.org/10.2316/Journal.202.2013.3.202-3898.
- WIPO, World Intellectual Property Organization. 2020. Global innovation index. accessed April 21, 2021. <www.wipo.int/global_innovation_index/en/>
- Wu, F., D. Niu, S. Dai, and B. Wu. 2020. New insights into regional differences of the predictions of municipal solid waste generation rates using artificial neural networks. Waste Management 107:182–90. doi:https://doi.org/10.1016/j.wasman.2020.04.015.
- Xiao, Y., and B. Zhou. 2020. Does the development of delivery industry increase the production of municipal solid waste? An empirical study of China. Resources, Conservation and Recycling 155:104577. doi:https://doi.org/10.1016/j.resconrec.2019.104577.