
ABSTRACT
Energy poverty is generally caused by having a low income, facing high energy costs, and living in a home with low energy efficiency. Various indicators capture these facets, but there is no consensus which is the best one, or how to combine them. To this aim, we create a multidimensional index that accounts for five dimensions of energy deprivation: two objective indicators of “low income, high costs,” and “high actual cost,” as well as three subjective indicators of “not warm enough home,” “housing faults,” and “bills difficulties.” We define households as poor if at least two forms of deprivation are present. We apply our measure to Poland. In 2017, 10% of households in Poland suffered from multidimensional energy poverty. Households living in buildings built before 1946, households living in rural areas, and households that were dependent on retirement and disability pensions were at the highest risk of multidimensional energy poverty.
1. Introduction and motivation
The issue of energy poverty has gained recognition among researchers and policy-makers since the seminal work of Boardman (Citation1991). However, defining energy poverty poses a scientific challenge, due to differences in experiencing and understanding energy poverty. First of all, there is a dichotomy between defining energy poverty in developing and developed countries. In developing countries, energy poverty is usually understood as the lack of access to energy services (Sokołowski Citation2019; Sovacool Citation2012), while in developed countries it is understood in terms of energy expenditures and incomes (Buzar Citation2007). Secondly, even within this dichotomy, the quality and costs of energy services, as well as building characteristics differ across countries, so it is unlikely that a single indicator can be applied in various contexts. Moreover, definitions of energy poverty become increasingly more complex. For instance, Bouzarovski and Petrova (Citation2015) distinguished between fuel and energy poverty, and Day, Walker, and Simcock (Citation2016) applied the capabilities framework to emphasize the role of access to energy services (or lack thereof) in achieving socio-economic wellbeing and sustaining quality of life. We take stock of the capabilities approach, and we relate energy poverty to household situation. We define energy poverty as a situation when a household is unable to afford the energy needed to provide its members with adequate warmth, cooling, lighting, and appliance use (Thomson, Bouzarovski, and Snell Citation2017).
We contribute to the literature on energy poverty measurement by proposing a multidimensional index that accounts for the multi-faceted nature of energy poverty, but also results in a single indicator that can be used for poverty mapping and policy planning. We combine objective and subjective indicators (five in total). We apply similar definitions and metrics as those used to study energy poverty in Europe (Buzar Citation2007; Thomson and Snell Citation2013; Tirado Herrero and Ürge Vorsatz Citation2012). We also acknowledge the research on multidimensional energy poverty in developing countries (Bhatia and Angelou Citation2015; Nussbaumer et al. Citation2011). By proposing a multidimensional index, we address the key drawback of using single indicators only: namely, conflicting interpretations and results of different indicators. At the same time, we provide a single index of multidimensional poverty at the household level for which the interpretation is clear: i.e., a household is considered energy-poor if it experiences at least two forms of deprivation. The index allows understanding of the coincidence of different facets of poverty at the household level, estimating the incidence of energy poverty in a given population, as well as between-group comparisons.
We base our methodology on Alkire and Foster (Citation2011) who comprehensively examine multidimensional poverty measurement and methodology. By combining monetary and non-monetary indicators of energy poverty we follow Alkire et al. (Citation2015) key argument (in line with Nolan and Whelan Citation2011) that multidimensional poverty measures which account for both monetary and non-monetary indicators are better than single monetary indicators. First, non-monetary indicators complement the monetary ones with a concept of what it really means to be poor. Second, they capture the lack of resources and can reflect the households’ capabilities. Third, as poverty is multidimensional phenomenon, it should be measured with multiple indicators.
We present an example of application to Poland, taking advantage of rich Household Budget Survey data. Energy poverty poses a serious challenge for public policy in Poland (Bouzarovski and Tirado Herrero Citation2017; Rutkowski et al. Citation2018). Importantly, our indicator can be applied to other EU countries (and comparisons between them) as the set of indicators used in our measure is consistent with those recommended by the EU Energy Poverty Observatory. Of course, researchers may want to modify the set of deprivations and indicators pertaining to them in order to capture the country-specific characteristics of energy poverty in the best possible way. While our work is open for refinement, we hope it is a step forward in improving social welfare indicators.
The article is organized as follows. In the second section, we review the relevant literature on defining and measuring energy poverty, and constructing multidimensional indicators. In the third section, we outline our methodology and data. In the fourth section, we present and discuss the results. The fifth section concludes. The appendix presents additional methodological details on how particular indicators were constructed.
2. Literature review
2.1. Single energy poverty indicators
The academic debate on suitable energy poverty metrics follows the discussion of the appropriate energy poverty definition, and several approaches are applied. The most common typology of metrics distinguishes qualitative (subjective) and quantitative (objective) indicators (Price, Brazier, and Wang Citation2012). Qualitative indicators rely on self-assessed situation of households regarding e.g.: housing situation, ability to pay utility bills or achieve thermal comfort (Healy and Clinch Citation2002; Kose Citation2019; Thomson, Bouzarovski, and Snell Citation2017). Quantitative metrics are based on the incomes and expenditures reported in surveys and/or modeled, as recent studies tend to rely more on the required energy cost rather than the actual cost.Footnote1 The most commonly applied quantitative measures are: Low Income, High Cost (Heindl Citation2015; Hills Citation2012; Imbert, Nogues, and Sevenet Citation2016; Lewandowski and Sałach Citation2018), absolute threshold of energy spending in relation to income (e.g., ‘10% energy poverty threshold’ as in Boardman Citation1991; Legendre and Ricci Citation2015) and metrics based on median expenditures (Tirado Herrero and Ürge Vorsatz Citation2012).
The measurement of energy poverty has two main aims. First, the identification of energy-poor households should enable the efficient implementation of support measures. Second, the measurement should capture the relevant facets of deprivation. Ideally, energy poverty metrics would include both quantitative and qualitative components that ensure comprehensive coverage while minimizing biases in the representations of outcomes. Finally, the measurement should strike a balance between accuracy and complexity, and efficiency in informing policymakers (Pelz, Pachauri, and Groh Citation2018). Indeed, the EU Poverty Observatory monitors energy poverty using four primary indicators, including two objective and two self-reported measures, and a wide range of secondary indicators (EPOV Citation2018).
Using a group of objective and subjective indicators independently has advantages: it accounts for a diversity of concepts of energy poverty, and presents a broader picture than any single indicator could. It allows measuring energy poverty in terms similar to capabilities approach (Day, Walker, and Simcock Citation2016), as the importance of energy services for the quality of life can be better understood thanks to capturing the relationship between energy poverty, and housing condition or thermal comfort.
However, using a group of indicators independently also has disadvantages, especially if they are used for social policy, and if different indicators show different results (Romero, Linares, and López Citation2018). This is the case in Poland, a country for which we implement our multidimensional index. Based on the EPOV (Citation2018) metrics, data quality and availability, as well as quantitative and qualitative assessment, Sokołowski, Kiełczewska, and Lewandowski (Citation2019) recommended five indicators that capture key dimensions of energy poverty in Poland: high required energy costs and low income, high actual energy expenditure, inability to adequately heat the building, housing faults, and inability to pay utility bills. However, in 2017 the share of households affected by particular deprivations ranged from 2.2% (problems with paying utility bills) to 18% (high actual expenditure, Sokołowski, Kiełczewska, and Lewandowski Citation2019). Furthermore, the objective indicators show that inhabitants of detached homes are at the highest risk of energy poverty in Poland, while the subjective indicators indicate that inhabitants of old multifamily buildings are at the highest risk of being affected. Such discrepancies pose challenges for policy-makers and can create confusion regarding the rate of energy poverty and the characteristics of energy-poor households.
2.2. Multidimensional energy poverty indices
The concept of multidimensional inequality and poverty has been widely applied to studies of poverty and living conditions since the seminal works of Sen (Citation1976), Kolm (Citation1977), and Atkinson and Bourguignon (Citation1982), among others. Recently, the Alkire-Foster methodology (Alkire et al. Citation2015) has become the leading approach to construct multidimensional indicators. However, to the best of our knowledge, so far it has not been applied to energy poverty in Europe. Nussbaumer et al. (Citation2011), and Sadath and Acharya (Citation2017) used it to measure energy poverty in developing countries, but, due to data limitations, accounted only for self-reported forms of deprivation. Finally, Okushima (Citation2017) applied the Alkire–Foster method in a developed country (Japan), but based on income/expenditure data, without accounting for self-reported characteristics of energy poverty. To the best of our knowledge, our article is the first to combine objective and subjective indicators of energy deprivation.
There are two groups of methods of multidimensional poverty measurement (Alkire et al. Citation2015). In the first group, aggregate data are used. In the second group, the information on particular poverty dimension for single unit of analysis (a household) is used. We use the latter method which allows identifying households considered multidimensionally poor via the joint distribution of deprivations at the household level (coincidence of different facets of poverty). Thus, we contribute to the literature on composite measures of energy poverty as the previous attempts were based on aggregate data. Thomson and Snell (Citation2013), and Gouveia, Palma, and Simoes (Citation2019) calculated composite indices of energy poverty, while Bollino and Botti (Citation2018) computed a compound indicator based on fuzzy sets methodology. Bouzarovski and Tirado Herrero (Citation2015) developed an index as a weighted mean of the share of households facing problems with utility bills (weighted 0.5), inadequate living conditions (0.25), and insufficient thermal comfort (0.25). Although useful for making comparisons across countries, the composite indices cannot be applied to measure the incidence of poverty at the household level.
By studying the joint distribution of deprivations at the household level, we are also able to capture the differences in the distribution of deprivation forms across households. Assume one scenario in which three households are affected by one deprivation measure each, and another scenario in which one household is affected by three deprivations while the other two households are not affected at all. A multidimensional approach that we use will show different results for each scenario, as it identifies the households with coinciding dimensions of energy poverty. The compound index, however, will show the same value in both scenarios, even though the underlying experiences of energy poverty are very different.
3. Methodology and data
3.1. Selection of indicators
We use five indicators to construct the multidimensional index of energy poverty. “Low income, high costs” (hereafter, LIHC) and “high share of energy expenditure in income” (high actual costs) are the objective indicators. They are calculated on the basis of the information on the households’ income and energy expenditures. “Inability to keep the home adequately warm” (not warm enough), “presence of leaks, damp, or rot” (housing faults), and “inability to pay utility bills” (bills difficulties) are self-reported indicators. Their definitions are presented in and methodology of each indicator is described in detail in the appendix.
Table 1. Single dimensions of energy poverty.
There are three main arguments for using this group of indicators. First, these indicators belong to those recommended by EPOV (Citation2018) and as independent indicators they were shown to be the most suitable measures of energy poverty in Poland. Their selection was confirmed in the extensive consultations with Polish and European policymakers and stakeholders (Sokołowski, Kiełczewska, and Lewandowski Citation2019). In particular, they were accepted by the Polish Ministry of Energy as indicators on which the policy responses to energy poverty may be based.Footnote3
Second, these indicators convey complementary information. The correlations and redundancy measures (Alkire et al. Citation2015) between particular dimensions of energy poverty across Polish households in 2017 are quite low (). The highest correlation is between two subjective deprivations (0.30), followed by the correlation between two monetary measures (0.18). The correlations between any pair of monetary and subjective deprivations are very low and do not exceed 0.13. The highest observed redundancy measures are only 40% (between two subjective indicators, and between two monetary indicators). This proves that the chosen dimensions of deprivation convey complementary information and capture different aspects of energy poverty.
Table 2. Cross-correlations and redundancy measures (%) of single dimensions of energy poverty in Poland.
Third, including more indicators is not desirable. In particular, we decide against using a fixed-threshold of spending indicators, which are arbitrary and may lead to path-dependency in defining energy poverty (Bouzarovski and Petrova Citation2015). They also provide implausible results for PolandFootnote4
3.2. Methodology of multidimensional index
We calculate the multidimensional energy poverty index using the methodology outlined by Alkire et al. (Citation2015) and Alkire and Apablaza (Citation2017). The joint distribution of deprivations that any unit of the analysis (a household) may experience is defined by the set of deprivations, D. We use the dual-cutoff approach. First, for every household i, we set a deprivation matrix assigning a value of one if the household is deprived in a given dimension d ∈ D, and a value of zero if it is not. Second, for each household, we add the positive entries, weighting each dimension with an equal weight, i.e., wd = 1/5 for every d ∈ D, to obtain the weighted sum ci is the deprivation score (the weighted share of deprivations at a household level). We think that each dimension of deprivation is an essential aspect of energy poverty so we treat each dimension as equally important.Footnote5 Equal weights are commonly used in studies of multidimensional poverty in which none of dimensions is considered as the most important (e.g., Alkire and Apablaza Citation2017).
A household is identified as poor if its weighted deprivation score ci is higher than the poverty cutoff, k = 0.4. Thus, a household with at least two out of five types of deprivation is treated as energy poor, while a household with only one deprivation is not considered poor. We think that two deprivations are enough to recognize a household as energy poor. Deprivation in only one dimension may not necessarily indicate energy poverty as it may result from other circumstances or measurement error. However, deprivation in another dimension validates that energy poverty is an issue for a given household. On the other hand, the incidence of three or more dimensions is very rare in Poland (it concerns only 2% of households, see Section 4), thus using a cutoff of k = 0.6 would imply selecting a small number of severely deprived households.
Finally, we calculate the headcount ratio (H) as the share of households that are multi-dimensionally poor, the average deprivation among the energy poor households (A), and the adjusted headcount ratio M0 that accounts for the number of deprivations that poor people experience. We focus, however, on H, since we want to compare the multidimensionally poor population with populations that are deprived according to particular indicators (for which only the H can be calculated). Moreover, in section 4 we show that 80% of the multidimensionally poor households suffer from exactly two deprivations, so we will present results for A and M0 only for groups that noticeably differ in A.
3.3. Data
We use Polish Household Budget Survey (HBS) data for 2017. The HBS is a nationwide representative survey carried out by the Polish statistical office (Statistics Poland). The questionnaire covers all of the households’ revenues and expenditures, as well as the respondents’ subjective assessments of their material situation. It also covers dwelling characteristics and subjective assessment of housing conditions. Therefore, the HBS allows us to calculate all five dimensions of energy poverty.
Households are the unit of analysis, and all five indicators are defined at the household level. We estimate the incidence of energy poverty as the share of households identified as energy-poor. We also calculate the population shares in order to ensure the comparability of these indicators with standard income poverty indicators. The number of observations in the 2017 database is 36,665 of households (97,434 persons). We drop observations with missing data and obtain a sample of 35,980 households (95,621 persons). We use survey weights that are representative at the household level (number of persons in the household and urban/rural area).Footnote6 We recalibrate the weights in the reduced sample to ensure representativeness with respect to age and sex, following Myck and Najsztub (Citation2015). The original weights in the HBS data are representative only at the household level (due to number of household members and urban/rural areas). Myck and Najsztub (Citation2015) showed that reweighting according to individual characteristics, such as age and sex, improves the accuracy of the calculations. This is important as we calculate statistics on the household level, as well as on the individual level.
4. Results
4.1. Multidimensional energy poverty index – composition by forms of deprivation
We find that 1.33 million out of 13.57 million households (9.8%) in Poland are multidimensionally energy-poor (in 2017). In population terms, 3.35 million people out of the 38 million people living in Poland (8.8%) are affected. The vast majority of households identified as multidimensionally poor are affected by exactly two forms of deprivation (1.06 million, 7.8% of population and 80% of the poor, ). The number of households affected by at least three forms of deprivation is much lower (314 thousand, or 2% of households). On the other hand, 25% of households in Poland are deprived in exactly one dimension, while two in three households are not affected by any dimension of energy poverty.
Table 3. Coincidence of single dimensions of energy poverty.
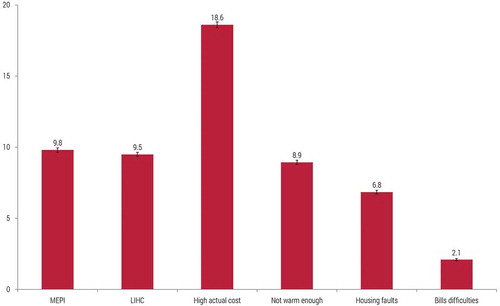
The share of households affected by multidimensional energy poverty in Poland (9.8%) is comparable to the shares affected by poverty as defined by the LIHC and the “not warm enough” indicators (). The “high actual costs” indicator is associated with a high incidence of energy poverty, of almost 20%. At the other end of the spectrum is the “bills difficulties” indicator, which identifies only 2% of households as energy-poor. Moreover, the multidimensional index exhibits higher precision than single indicators, as its standard error is lower than the standard errors of single indicators (except for the high actual cost indicator).
Figure 1. Energy poverty rate according to the multi-dimensional and single indicators (percent of households, with standard errors).
Among the multidimensionally energy-poor households, the combination of two expenditure-based forms of deprivation (“low income, high costs” and “high expenditure”) is the most common (31% of poor household), followed by the combination of two subjective forms of deprivation (“leaks, damp, or rot” and “not warm enough,” 16%, see ). Although the experience of energy poverty in these subgroups may be different, the use of a multidimensional index makes the identification more credible than it would have been if single indicators had been used (which may be affected by measurement errors or spurious self-assessments). Forty-eight percent of households identified as multidimensionally energy-poor exhibited some objective and some subjective forms of deprivation. The ability to identify households that are affected by both expenditure-based and subjective indicators of energy poverty is a desirable feature of the multidimensional approach.
Table 4. Energy-poor households, by dimensions of the poverty.
A simple compound index with equal weights applied to our indicators would show a 9.2% energy poverty rate, while the Bouzarovski and Tirado Herrero (Citation2015) methodology would show 5% rate. Although the rates shown by the compound index (9.2%) and the multidimensional index (9.8%) are comparable, a compound index assumes substitution between energy poverty dimensions. This is especially problematic in Poland where a high risk of energy poverty in terms of expenditures would be compensated in the compound index by a low risk of problems with utility bills. The multidimensional index is also more robust to changes in the set of indicators: assume that the indicator with the lowest incidence and the highest error (bills difficulties) is removed from the indicators set. The compound index based on the remaining four indicators would increase to 11.0%, while the multidimensional indicator would decrease to 9.2%. Both approaches allow estimating the energy poverty rate, but the multidimensional index is superior in quantifying the coincidence and relations between various deprivations.
4.2. Multidimensional energy poverty and household incomes
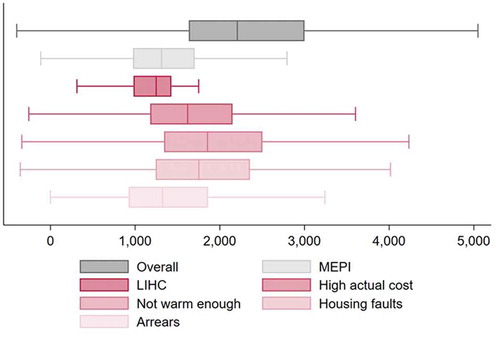
The equivalised incomes of energy-poor households are relatively low in comparison to the overall equivalised income distribution in Poland. This is the case especially for the multidimensionally poor (). Groups deprived according to the LIHC and the “bills difficulties” indicators also exhibit rather low incomes – the median equivalised income in these groups is visibly lower than the 1st quartile of the overall equivalised income distribution (). The incomes of households that are deprived according to the “high actual costs,” “not warm enough,” and “housing faults” indicators are higher. Some households that belong to these groups have incomes in the 4th quartile of the overall distribution. However, these households are not classified as poor according to the multidimensional indicator, which is its key advantage. While the multidimensional index identifies energy-poor households who are not income-poor, it does not identify as poor households with relatively high incomes who are affected by a single deprivation.
Figure 2. Equivalised income of households – overall and for energy-poor households (multi-dimensionally and according to single indicators).
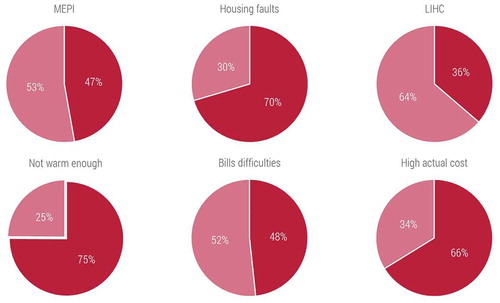
Slightly more than a half (53%) of multidimensionally poor households are also income-poor. The share of income-poor households is similar for the “bills difficulties” indicator, higher for the LIHC indicator, and lower for the other single dimensions of deprivations (). These disparities between income and energy poverty are likely to be of special interest to policy-makers, as they may be related to the lack of dedicated support for energy-poor households in Poland (Rutkowski et al. Citation2018). Energy-poor households can expect support only if they suffer from income poverty and receive forms of social assistance that are reserved for the poorest individuals. Finally, households affected by multidimensional poverty are potentially in the worst situation in terms of satisfying their energy needs.
Figure 3. Income poverty among energy-poor households (multi-dimensionally and according to single indicators).
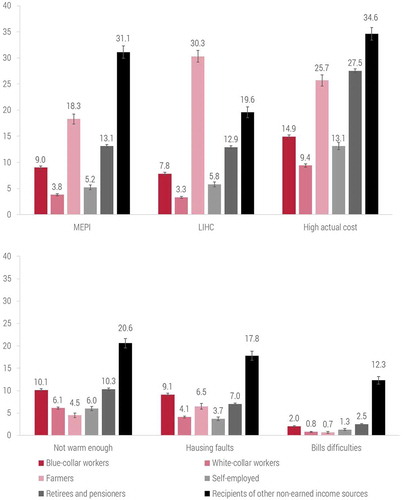
The multidimensional energy poverty rate is much higher among households living on non-earned sources of income than it is among any other socioeconomic group (). Farmers, retirees, and pensioners also experience high rates of multidimensional poverty. However, these groups differ in the structure of deprivations. Recipients of non-earned income who have low incomes are most likely to be affected by the “high expenditure” and the self-reported forms of deprivation. Retirees and pensioners are also among those most likely to spend a high share of their income on energy. While farmers are most often affected by the objective forms of deprivation, especially the “low income, high costs” indicator, the incidence of subjective forms of deprivation among these households is quite low. The construction of the multidimensional index makes the energy poverty level ascribed to farmers more reliable.Footnote7 The risk of energy poverty among farmers can be overestimated according to objective indicators, especially “low income, high costs,” since farmers may experience seasonal income fluctuations, and often live in large area houses (Lewandowski, Kiełczewska, and Ziółkowska Citation2018). Accounting for multiple deprivations is therefore particularly desirable in the case of farmers’ households.
Figure 4. Multidimensional energy poverty index and single dimensions of energy poverty, by main source of household income (percent of households).
Households of retirees and pensioners, recipients of non-earned income sources, and blue-collar workers are the three most numerous groups among the multidimensionally energy-poor, and jointly constitute 78% of all multidimensionally energy-poor households (). Retirees and pensioners and recipients of non-earned income sources represent a higher share among the energy-poor in comparison to their shares in the total population. Farmers are also over-represented. The opposite pattern is observed for blue-collar workers, white-collar workers, and the self-employed. The overlap between income and multidimensional energy poverty is the largest among farmers (83% of energy-poor farmers are also income-poor) and recipients of non-earned income sources (79%), while it is the smallest among blue-collar workers (31%) and white-collar workers (37%).
4.3. Multidimensional energy poverty and building characteristics
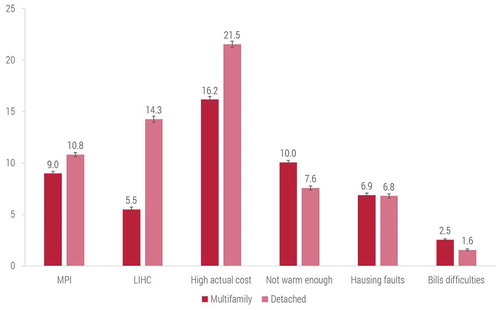
The risk of energy poverty in Poland is strongly related to the characteristics of dwellings. The multidimensional energy poverty is more common among households living in detached houses than among households living in multifamily buildings (). This difference is driven by the results of the expenditure-based indicators, which show a much higher risk of energy poverty among households living in detached houses. This finding can, in turn, be related to the fact that in Poland, the dwelling areas in detached houses are much larger than the dwelling areas in multifamily buildings (Lewandowski, Kiełczewska, and Ziółkowska Citation2018), which translates into higher heating costs. On the other hand, the subjective indicators show that households living in multifamily buildings are deprived slightly more often, which may be due to lower energy efficiency standards in those types of dwellings (MCBE Citation2017). Consequently, the difference in the multidimensional poverty rates of households living in detached houses and households living in multifamily buildings is much smaller than the differences shown by single indicators. Again, this is because the MEPI accounts for combinations of objective and subjective forms of deprivation.
Figure 5. Multidimensional energy poverty index and single dimensions of energy poverty (percent of households), by type of building.
The older the building the household lives in is, the higher the household’s risk of multidimensional energy poverty is. The relationship between the age of the building and the risk of multidimensional poverty is stronger among households living in the multifamily buildings than among households living in detached houses (). This finding can be traced back to two distinct features. First, according to subjective indicators, the risk of energy poverty is by far the highest among households living in multifamily buildings built before 1946. Indeed, 74% of multidimensionally energy-poor households that live in multifamily buildings suffer from some form of subjective energy poverty. Second, according to the expenditure-based indicators, the risk of deprivation is almost equally high among households living in all types of detached houses built before 1996. However, according to the subjective indicators, the risk of deprivation increases with the age of the building (as in the case of multifamily buildings). Thus, the older a detached house is, the higher is the share of households affected by multiple forms of deprivation (). Sixty-three percent of multidimensionally energy-poor households that live in detached houses suffer from some form of subjective energy poverty. The MEPI shows that households living in older buildings face higher risk of poverty, often because objective and subjective forms of deprivation overlap. Understanding these complex patterns is important for targeting of policies.
Figure 6. Multidimensional energy poverty index and single dimensions of energy poverty (percent of households), by year of construction and type of building.
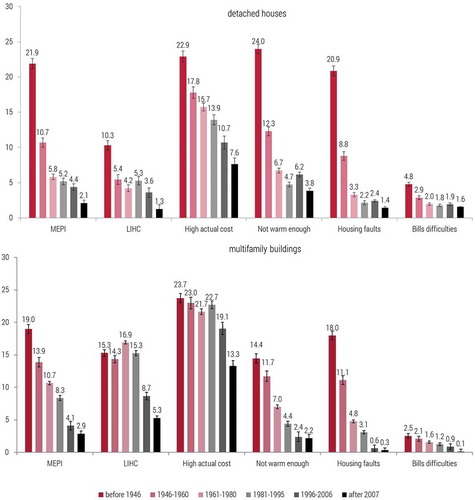
Note that single indicators, and especially the “bills difficulties,” exhibit higher standard errors than the MEPI, especially in the case of buildings built after 2007. Application of MEPI improves statistical reliability of within-group estimates of poverty rates.
Households that live in detached houses and households that live in multifamily buildings make up equal shares of multidimensionally energy-poor households (). Moreover, the structure of households identified as energy-poor suggests that there is a strong relationship between multidimensional energy poverty and the energy efficiency of the building. For example, 41% of all energy-poor households live in buildings constructed before 1946 (24% in multifamily buildings, 15% in detached buildings), while only 19% of the total population live in such buildings (11% and 8%, respectively). Furthermore, 29% of energy-poor households live in buildings built between 1961 and 1980 (13% in multifamily buildings, 16% in detached buildings), while the share of the total population living in such buildings is higher, at 35% (21% and 14%, respectively). Meanwhile, households living in newer buildings represent a lower share among the energy-poor. To sum up, our results suggest a strong relation between the year of building construction and multidimensional energy poverty.
Table 5. Energy-poor households, by dimensions of the form of poverty.
Table 6. Structure of energy-poor households, by type of building and year of construction (thousands of households).
4.4. Spatial distribution of multidimensional energy poverty in Poland
The multidimensional energy poverty rate is the highest among households living in rural areas (). The same pattern can be observed for the LIHC, “high actual costs” and “housing faults” indicators. For the “not warm enough” and “bills difficulties” indicators, there is no clear pattern related to the degree of urbanization. The differences in energy poverty between urban and rural areas can be traced back to the patterns pertaining to detached/multifamily buildings and sources of income described in the previous subsections.
Figure 7. Multidimensional energy poverty index and single dimensions of energy poverty (percent of households), by size of place of residence.
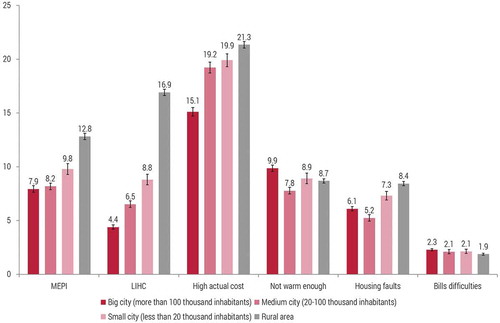
In rural areas and small towns, household incomes are, on average, lower than they are in cities, while the share of households depending on farming or welfare transfers, and the share of households living in detached houses are higher. As a result, households living in rural areas represent a higher share among the energy-poor, according to the MEPI (44% of the energy-poor households, compared to 33% of all households, are in rural areas, ). Households living in large cities represent a lower share among the poor, but they still constitute 27% of all poor households due to their high share in the total population (34%).
Table 7. Structure of energy-poor households by size of place of residence (thousands of households).
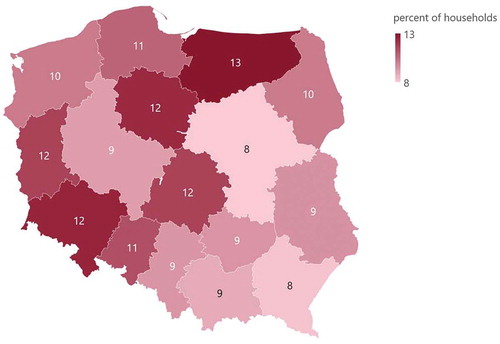
The rate of multidimensional energy poverty is highest in the northern and western regions of Poland, and is lowest in the eastern part of the country (). This pattern may seem counterintuitive, as the eastern regions are less urbanized and have lower average incomes than the central or western regions. However, the homes in the eastern regions are, on average, newer, and the incidence of subjective deprivation, and in particular of home “not being warm enough,” is lower in the eastern regions than in the central or western regions (Lis, Miazga, and Sałach Citation2017).
Map 1. Multidimensional energy poverty rate by NUTS2 regions in Poland (percent of households).
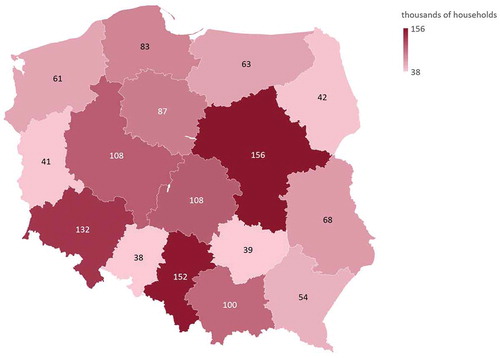
However, in terms of poverty mapping, the regions with the highest poverty rates are not necessarily those where most of the energy-poor live. Indeed, the largest numbers of energy-poor households live in populous regions (). The five largest regions (mazowieckie, wielkopolskie, śląskie, małopolskie, dolnośląskie) from 16 voivodships in Poland are home to 49% of all energy-poor households (52% of all households).
Map 2. The distribution of the multidimensional energy poverty rate by NUTS2 regions in Poland (thousands of households).
4.5. Accounting for differences in deprivation intensity
So far we have analyzed the headcount ratio (H) since we have been mainly focused on the differences between the multidimensional index and single indicators. In this subsection, we conduct between-group comparisons accounting for the deprivation intensity (the average number of deprivations among the energy-poor households, “A”) and adjusted headcount ratio (M0). However, 80% of the multidimensionally poor households are deprived in exactly two dimensions, and between-group differences in A are rather small. Hence, we present results only of the most pronounced between-group differences in the deprivation intensity, which are between groups distinguished based on the main sources of income (). The results for other groups are available upon request.
Table 8. The headcount, adjusted headcount, and deprivation intensity, by main source of incomeFootnote8
In 2017, the average energy poverty deprivation intensity in Poland amounted to 2.24, and the adjusted headcount ratio was 0.22. Households living on other non-earned incomes experienced the highest deprivation intensity (2.40) which combined with a high headcount ration (31%) resulted in a much higher adjusted headcount ratio than among other groups. Retirees and pensioners also experienced, on average, more deprivations that the average poor household. On the other hand, farmers, who exhibited the second highest headcount ratio (18.3%) recorded the lowest deprivation intensity (2.11). Households of workers and self-employed exhibited a below-average deprivation intensity. The multidimensional approach shows that households living on non-earned sources of income are more severely affected by energy poverty than it is suggested by particular deprivation measures analyzed independently.
5. Conclusions
In this paper, we have used the Alkire–Foster methodology to develop a multidimensional energy poverty index that allows measuring the coincidence of energy poverty dimensions at a household level. As such, our index differs from previously used compound indices which did not have this feature. We used five indicators of energy deprivation – low income combined with high required costs, high actual energy expenditures, housing defects, inadequate thermal comfort, and difficulties paying utility bills on time – and defined energy-poor households as those that suffer from at least two forms of deprivation. We were able to combine objective and subjective indicators, and at the same time to develop an index that can be used for poverty mapping and policy planning.
We applied our index to Poland, taking advantage of a rich, household-level dataset of the Polish HBS. We found that almost 10% (1.33 million) of households in Poland suffer from more than one dimension of energy poverty, and are thus poor in the multidimensional sense. Although the vast majority of these households have incomes that are low relative to the incomes of the general population in Poland, only half of energy-poor households are income-poor. We have identified three groups that face the greatest risk of multidimensional energy poverty: households that live in buildings built before 1946, households which main source of income is from old-age or disability pension, and households that live in rural areas.
The proposed multidimensional energy poverty index can be useful for policy-makers searching for a detailed understanding of the characteristics of energy-poor households. Households that suffer from multiple types of energy deprivation are likely to be in a worse situation than households affected by only one form of deprivation. Moreover, it offers an easier way to characterize the energy-poor population than particular indicators used independently as the latter may classify different groups as those at the highest risk of deprivation. Hence, the multidimensional index can be particularly useful for targeting public support to households that are most deprived.
According to our knowledge, our article is the first one to use the Alkire–Foster methodology to study energy poverty in a developed country, and using both income/expenditure and self-assessed indicators. We understand, however, its limitations and possibilities for future research. The energy poverty definition to some extent limits it to household characteristics and relies on energy efficiency. Our data allow measuring energy efficiency and energy prices only with proxy indicators, e.g., with subjective thermal comfort and energy expenditures. The use of relative thresholds may impede setting targets for reducing energy poverty. Finally, the indicators are open for refinements in terms of applying a more elaborated conceptual framework.
Additional information
Funding
Notes
1 By required energy cost we understand the cost that the household needs to incur in order to satisfy its energy needs, given the housing situation and household composition.
2 The 30th percentile threshold was also used by Belaid (Citation2018) for France, and Okushima (Citation2017) for Japan.
3 In 2019, Ministry of Energy, responsible for tackling energy poverty in Poland have been dissolved.
4 Adopting the absolute 10% energy expenditure threshold (applied in the UK until 2012) would result in implausibly high incidence of energy poverty: almost a half of the Polish population would be considered energy poor (Lis, Miazga, and Sałach Citation2017).
5 The role of weights in the dichotomous counting approach that we apply is different than in the composite indices. In the composite indices weights are crucial in determining the trade-offs between the deprivation dimensions. In the dichotomous counting approach, weights just directly reflect the relative impact the individual dimensional deprivations has on the individual deprivation score (Alkire et al. Citation2015).
6 Some subpopulations are not at all covered by the survey design, e.g., homeless people.
7 Farmers’ expenditures and incomes are comparable and they are accounted for in the best possible manner in the process of data collection. The vast majority of households living of farming in Poland are subsistence farming. The legal system in Poland does not treat subsistence farms as businesses – the farms are exempt from income tax (and are not covered by the accounting rules). Statistics Poland applies its methodology of measuring farmers’ incomes and expenditures in HBS. It is aimed at ensuring, among others, that the business expenditures are not counted as private consumption spending.
8 The detailed results are available upon request.
References
- Alkire, S., and M. Apablaza. 2017. Multidimensional poverty in Europe 2006–2012: Illustrating a methodology. In Monitoring social inclusion in Europe, ed. A. B. Atkinson, A. C. Guio, and E. Marlier, 225–38. Luxembourg: Eurostat.
- Alkire, S., and J. Foster. 2011. Counting and multidimensional poverty measurement. Journal of Public Economics 95 (7–8):476–87. doi:10.1016/j.jpubeco.2010.11.006.
- Alkire, S., J. E. Foster, S. Seth, M. E. Santos, J. M. Roche, and P. Ballon. 2015. Multidimensional poverty measurement and analysis, ch. 2 and 7. Oxford: Oxford University Press.
- Atkinson, A. B., and F. Bourguignon. 1982. The comparison of multi‐dimensioned distributions of economic status. Review of Economic Studies 49 (2):183–201. doi:10.2307/2297269.
- Belaïd, F. 2018. Exposure and risk to fuel poverty in France: Examining the extent of the fuel precariousness and its salient determinants. Energy Policy 114 (C):189–200. doi:10.1016/j.enpol.2017.12.005.
- Bhatia, M., and N. Angelou. 2015. Beyond Connections: Energy Access Redefined. ESMAP Technical Report;008/15, World Bank, Washington, DC.
- Boardman, B. 1991. Fuel poverty: From cold homes to affordable warmth. London: Belhaven Press.
- Bollino, A. C., and F. Botti. 2018. Energy poverty in Europe: A multidimensional approach. PSL Quarterly Review 70 (283):473–507.
- Bouzarovski, S., and S. Petrova. 2015. A global perspective on domestic energy deprivation: Overcoming the energy poverty–fuel poverty binary. Energy Research & Social Science 10:31–40. doi:10.1016/j.erss.2015.06.007.
- Bouzarovski, S., and S. Tirado Herrero. 2015. The energy divide: Integrating energy transitions, regional inequalities and poverty trends in the European Union. European Urban and Regional Studies 24 (1):69–86. doi:10.1177/0969776415596449.
- Bouzarovski, S., and S. Tirado Herrero. 2017. Geographies of injustice: The socio-spatial determinants of energy poverty in Poland, the Czech Republic and Hungary. Post-Communist Economies 29 (1):27–50. doi:10.1080/14631377.2016.1242257.
- Buzar, S. 2007. The ‘hidden’ geographies of energy poverty in post-socialism: Between institutions and households. Geoforum 38 (2):224–40. doi:10.1016/j.geoforum.2006.02.007.
- Day, R., G. Walker, and N. Simcock. 2016. Conceptualising energy use and energy poverty using a capabilities framework. Energy Policy 93:255–64. doi:10.1016/j.enpol.2016.03.019.
- DECC. 2014. The fuel poverty statistics methodology and user manual. Department of Energy & Climate Change. URN 14D/148. London.
- Gouveia, J. P., P. Palma, and S. G. Simoes. 2019. Energy poverty vulnerability index: A multidimensional tool to identify hotspots for local action. Energy Reports 5:187–201. doi:10.1016/j.egyr.2018.12.004.
- Healy, J. D., and J. P. Clinch. 2002. Fuel poverty in Europe: A cross-country analysis using a new composite measure. Dublin: University College Dublin.
- Heindl, P. 2015. Measuring fuel poverty: General considerations and application to German household data. Finanz.: Public Finances 71:178–215.
- Hills, J. 2012. Getting the measure of fuel poverty. Final Report of the Fuel Poverty Review. CASE report 72, Department of Energy and Climate Change, London.
- Imbert, I., P. Nogues, and M. Sevenet. 2016. Same but different: On the applicability of fuel poverty indicators across countries – insights from France. Energy Research & Social Science 15:75–85. doi:10.1016/j.erss.2016.03.002.
- Kolm, S. C. 1977. Multidimensional egalitarianisms. Quarterly Journal of Economics 91 (1):1–13. doi:10.2307/1883135.
- Kose, T. 2019. Energy poverty and health: The Turkish case. Energy Sources, Part B: Economics, Planning and Policy 14 (5):201–13. doi:10.1080/15567249.2019.1653406.
- Legendre, B., and O. Ricci. 2015. Measuring fuel poverty in France: Which households are the most fuel vulnerable? Energy Economics 49 (C):620–28. doi:10.1016/j.eneco.2015.01.022.
- Lewandowski, P., A. Kiełczewska, and K. Ziółkowska (Święcicka). 2018. Zjawisko ubóstwa energetycznego w Polsce, w tym ze szczególnym uwzględnieniem zamieszkujących w domach jednorodzinnych. IBS Research Report 02/2018. Instytut Badan Strukturalnych.
- Lewandowski, P., and K. Sałach. 2018. Pomiar ubóstwa energetycznego na podstawie danych BBGD – metodologia i zastosowanie. IBS Research Report 01/2018. Instytut Badan Strukturalnych
- Lis, M., A. Miazga, and K. Sałach. 2017. What accounts for the regional variation of Energy poverty in Poland. In Energy poverty and vulnerability a global perspective, ed. N. Simcock, H. Thomson, S. Petrova, and S. Bouzarovski, 119–40. London: Routledge.
- MCBE. 2017. Przegląd przepisów określających minimalne wymagania dotyczące charakterystyki energetycznej budynków. Accessed March 20, 2019. https://www.miir.gov.pl/media/51736/EkspertyzaMCBE2017.pdf.
- Myck, M., and M. Najsztub. 2015. Data and model cross-validation to improve accuracy of microsimulation results: Estimates for the Polish household budget survey. International Journal of Microsimulation 8 (1):33–66.
- Nolan, B., and C. Whelan. 2011. Poverty and deprivation in Europe. Oxford, England: OUP.
- Nussbaumer, P., M. Bazilian, V. Modi, and K. K. Yumkella. 2011. Measuring Energy Poverty: Focusing on What Matters. OPHI Working Papers 42, University of Oxford, Oxford, England.
- Okushima, S. 2017. Gauging energy poverty: A multidimensional approach. Energy 137:1159–66. doi:10.1016/j.energy.2017.05.137.
- Pelz, S., S. Pachauri, and S. Groh. 2018. A critical review of modern approaches for multidimensional energy poverty measurement. Wiley Interdisciplinary Reviews: Energy and Environment 7:e304. doi:10.1002/wene.304.
- Price, C. W., K. Brazier, and W. Wang. 2012. Objective and subjective measures of fuel poverty. Energy Policy 49:33–39. doi:10.1016/j.enpol.2011.11.095.
- Romero, J. C., P. Linares, and X. López. 2018. The policy implications of energy poverty indicators. Energy Policy 115:98–108. doi:10.1016/j.enpol.2017.12.054.
- Rutkowski, J., K. Sałach, A. Szpor, and K. Ziółkowska (Święcicka). 2018. How to reduce energy poverty in Poland? IBS Policy Paper 01/2018. Instytut Badan Strukturalnych.
- Sadath, A. C., and R. H. Acharya. 2017. Assessing the extent and intensity of energy poverty using multidimensional energy poverty index: Empirical evidence from households in India. Energy Policy 102:540–50. doi:10.1016/j.enpol.2016.12.056.
- Sen, A. 1976. Poverty: an ordinal approach to measurement. Econometrica 44:219-31.
- Sokołowski, J., A. Kiełczewska, and P. Lewandowski. 2019. Defining and measuring energy poverty in Poland. IBS Research Report 01/2019. Instytut Badan Strukturalnych.
- Sokołowski, M. M. 2019. When black meets green: A review of the four pillars of India’s energy policy. Energy Policy 130:60–68. doi:10.1016/j.enpol.2019.03.051.
- Sovacool, B. K. 2012. The political economy of energy poverty: A review of key challenges. Energy for Sustainable Development 16 (3):272–82. doi:10.1016/j.esd.2012.05.006.
- Statistics Poland. 2018. Household Budget Survey 2017. Warsaw, Poland.
- The EU Energy Poverty Observatory (EPOV). 2018. Retrived from https://www.energypoverty.eu/indicators-data
- Thomson, H., and C. Snell. 2013. Quantifying the prevalence of fuel poverty across the European Union. Energy Policy 52:563–72. doi:10.1016/j.enpol.2012.10.009.
- Thomson, H., S. Bouzarovski, and C. Snell. 2017. Rethinking the measurement of energy poverty in Europe: A critical analysis of indicators and data. Indoor + Built Environment: the Journal of the International Society of the Built Environment 26 (7):879–901. doi:10.1177/1420326X17699260.
- Tirado Herrero, S., and D. Ürge Vorsatz. 2012. Trapped in the heat: A post-communist type of fuel poverty. Energy Policy 49:60–68. doi:10.1016/j.enpol.2011.08.067.
Appendix – Methodology of calculating single indicators of energy poverty
Low income, high costs (LIHC)
A household is classified as energy-poor if it fulfills two criteria simultaneously: a high required energy expenditure and a low income.
High required energy expenditure
The high required energy expenditure criterion is met if the required equivalent household energy expenses are higher than the median of the equivalent energy expenditure in the population.
Household energy expenditure is the sum of spending on electricity and heat.
Required household energy expenditure is the level of energy expenditure – given the characteristics of the household and the building, and the energy prices (depending on the type of heating) – which allows the household to maintain the optimal temperature in the dwelling, and to make adequate use of lighting and appliances.
Required energy expenditure is calculated based on the actual energy expenditure across households in a given year. The value of the required energy expenditure is determined for 84 categories, according to the type of building (multi-family, detached or semi-detached house, single-family detached house), type of heating (central heating, fuel stoves, electric stoves, gas stoves) and period of building construction (seven periods).
The required energy expenditure is the sum of the required expenditure on electricity (the average expenditure on electricity per person multiplied by the number of people in the household in a particular household category) and heat (the average expenditure on heat per square meter, multiplied by the usable floor area of a building in a particular household category).
In the context of heat expenditure, we control for the under-occupation of a dwelling which is defined by two conditions: the Parker Morris criterion (based on: DECC Citation2014) and the Eurostat criterion (based on: https://ec.europa.eu/eurostat/statistics-explained/index.php/Glossary:Under-occupied_dwelling).
For the equivalised required electricity expenditure, we use a scale with a two-person household as a reference point. The coefficients for the households with a given number of people are obtained by dividing the median required energy expenditure of households with a given number of people by the median required energy expenditure of a two-person household.
(b) Low income
The low-income criterion is based on two conditions met simultaneously: (i) the equivalent income of a household is in the lowest 30% of incomes in the population, and (ii) the equivalent household income after housing costs is lower than the individual income threshold.
The equivalent disposable income of households is calculated using the modified OECD equivalence scale: the first adult is assigned a weight of one, each next person aged 14 or older is assigned a weight of 0.5, and each child under age 14 is assigned a weight of 0.3.
Income after housing costs equals disposable income less expenditures on water supply and other services, rent, and mortgage payment.
The equivalisation of income after housing costs is performed using the Fuel Poverty scale: the first adult is assigned a weight of 0.58, each next person aged 14 or older is assigned a weight of 0.42, and each child under age 14 is assigned a weight of 0.2.
The threshold of equivalent income after housing costs is determined separately for each household. The threshold is the sum of two components: 60% of median equivalent incomes after housing costs in a population, and the required equivalent energy expenditures of a given household.
(2) High share of energy expenditure in income (high actual costs)
A household is classified as energy-poor if its share of actual energy expenditure in income equals at least double the median of this share in the population.
Household energy expenditure is the sum of spending on electricity and heat.
We omit the households in the first income percentile in the calculation of threshold.
(3) Inability to keep the home adequately warm (not warm enough)
Indicator based on the following survey question: “In your view, is your apartment warm enough in the winter (i.e., does your building have technically efficient heating and sufficient insulation)?” The households answering “no” are classified as energy-poor.
(4) Presence of leaks, damp, or rot (housing faults)
Indicator based on the following survey question: “In your view, does your apartment have a leaking roof; damp walls, floors, or foundations; or rotting window frames or floors?” The households answering “yes” are classified as energy-poor.
(5) Inability to pay utility bills (bills difficulties)
Indicator based on the following survey question: “Considering the last 12 months, how would you rate your satisfaction with your household’s needs regarding the payment of housing-related bills on time (fixed costs, rent, rental costs, etc.)?” The households answering “low” and “rather low” are classified as energy-poor.
