
 ?Mathematical formulae have been encoded as MathML and are displayed in this HTML version using MathJax in order to improve their display. Uncheck the box to turn MathJax off. This feature requires Javascript. Click on a formula to zoom.
ABSTRACT
Existing research suggests that students are an under-reported and under-supported group of the population that frequently lives in fuel poverty. Furthermore, studies show that students do not realize that they live in fuel poor conditions and are rarely recognized as a group vulnerable to fuel poverty. The aim of the research presented in this paper is to understand, evaluate and consequently reveal the experiences of students living in the private-rentedd sector, quantify their possible exposure to fuel poverty, and to determine the impacts of this exposure on their well-being. Three thousand five hundred and twelve students from seven European countries participated in this research making it the largest study to date targeting this specific social group. Our results demonstrate that this group is vulnerable to fuel poverty and that their exposure to such conditions can have a detrimental effect on both their mental and physical health, as well as their social life.
1. Introduction
Fuel poverty is a socio-economic problem with significant health and environmental impacts (Hills Citation2011) affecting millions of households across Europe (Papada et al. Citation2019). It occurs when a household is unable to afford adequate energy services on its income and is associated with poor building quality and rising energy costs (Velux Citation2017). Although various definitions of fuel poverty exist (Moore Citation2012), there is currently no official definition of fuel poverty in European Union (EU) legislation; as highlighted in the European Commission’s Vulnerable Consumers Working Group working paper (Citation2015), a common definition for all Member States would be confining due to the diverse realities across the European Union.
Fuel poverty is often used interchangeably with energy poverty. Although both terms are closely associated with each other, there is an inconsistent use of terminology that can be confusing (Li et al. Citation2014). The link between the two terms is highlighted by Bouzarovski and Petrova (Citation2015) who state that “the inability to attain a socially and materially necessitated level of domestic energy services” is a common condition that underpins every form of fuel and energy poverty in both developed and developing countries. When the term “fuel poverty” is used within the European Commission the focus is put on the affordability of adequate energy services in general, whereas “energy poverty” includes aspects of the internal market of electricity and gas (Šajn Citation2016). After assessing numerous EU policy documents issued between 2001 and 2014, Thomson, Snell, and Liddell (Citation2016) point out that although the term “energy poverty” significantly prevails over “fuel poverty”, when both terms are used in a document, they tend to refer to two separate concepts. In this paper, the term fuel poverty is used, because the focus is put on that condition when a household is unable to keep its home adequately warm at reasonable cost.
Defining fuel poverty poses a challenge for a number of reasons (Bouzarovski, Petrova, and Tirado-Herrero Citation2014). To begin with, fuel poverty is a cross-sectional challenge with diversified drivers, from energy regulations and the state of the macro-economy (Bouzarovski and Tirado-Herrero Citation2017) to household income levels and energy efficiency of buildings. Furthermore, fuel poverty is a personal condition, often occurring behind closed doors (Thomson, Bouzarovski, and Snell Citation2017). It includes various domestic energy services such as cooling, lighting, and cooking (Simcock, Walker, and Day Citation2016), therefore is not just limited to spatial heating. Fuel poverty is a spatiotemporal dynamic phenomenon, hence its causes and impacts are difficult to explicitly identify (Bouzarovski Citation2014). Finally, apart from the absence of a single agreed EU-widee definition, there are different indicators in use throughout Europe to measure the problem and to define vulnerable groups (Tirado-Herrero Citation2017).
The main drivers leading to fuel poverty are low household income, fuel price regulation, and poor energy efficiency of buildings (Boardman Citation1991). Furthermore, the absence of cost savings (Boardman Citation2009) or higher energy needs than the average, as may be the case possibly due to a disability (Snell, Bevan, and Thomson Citation2015), can also have fuel poverty implications. Additionally, living in privately rented accommodation, which is most common among young people, can prevent the tenant from upgrading their dwelling (Bouzarovski Citation2014) and often coincides with high heating costs and poor housing conditions (Seebauer, Friesenecker, and Eisfeld. Citation2019). Landlords don’t tend to address this issue either due to absence of direct financial incentives for energy renovations or due to insufficient information about the benefits of energy efficiency (Ambrose Citation2015). Furthermore, tenants may feel that they lack control over their energy suppliers and consequently their energy bills; this is usually due to not knowing about their rights to switch suppliers, or because of the fear that something might go wrong with the switching process. The latter is more prevalent among low-income groups (Ofgem Citation2008). Another barrier to switching suppliers might be the landlord’s assertion that the tenant switches back to the initial supplier at the end of the tenancy which could incur a financial penalty for the tenant (Carr Citation2019).
Fuel poverty disproportionately affects certain groups of people in a variety of different ways. Poor quality housing and the lack of thermal comfort can have both physical and mental effects on infants, children, the elderly, and those with chronic conditions (Kose Citation2019; Marmot Review Team Citation2011). Adolescents and adults, including university students, are most likely to encounter mental health problems (Liddell and Morris Citation2010); in particular, the effects of fuel poverty on the physical and mental health of university students are considerable but to date have received little attention (NUS Citation2018).On the other hand, the elderly are more likely to develop respiratory and cardiovascular complications (Hills Citation2011). “Excess winter mortality” can be a consequence of fuel poverty; increased rate of deaths in the winter is linked to cardiovascular and respiratory diseases which are strongly related to low temperatures and high humidity often found in fuel poor households (Guertler and Smith Citation2018; Rudge and Gilchrist Citation2005). Tackling fuel poverty, is therefore essential to protect those falling into fuel poverty, to relieve them from associated health problems.
To date, limited research has been carried out on fuel poverty among young people, including students, living in rented accommodation, despite them having a higher risk of falling into fuel poverty compared to other demographic groups (Healy Citation2003; Taltavull de la Paz, Juárez, and Monllor Citation2016). According to Bouzarovski et al. (Citation2013) many young people and students do not realize that they live in fuel poor conditions and are rarely recognized as a group vulnerable to fuel poverty. Furthermore, young peoples’ limited knowledge of energy conservation and energy efficiency measures may lead to an increase in their energy costs and push them closer to a fuel poor status (Clugston and Calder Citation1999; Petrova Citation2018). This lack of knowledge might tie students, many of whom are on tight budgets, down in high energy costs that may start to accumulate debts and result in a vicious fuel poverty circle as it is the case for low-incomee households (EPEE Citation2009). People experiencing fuel poverty may either continue to heat their home anyway and be at the risk of not being able to pay the bills and fall in arrears, or they don’t heat their homes adequately and end up living in a cold home facing not only socio-economic implications but also physical and mental health problems associated with fuel poverty (Grey et al. Citation2017). Therefore, more research is needed to fully understand the implications that fuel poverty may have on university students’ well-being, social life as well as on their education, and targeted policies are needed to effectively reduce the phenomenon (Morris and Genovese. Citation2018).
According to UNESCO (Citation2017), the global number of students in higher education more than doubled from 100 million to 207 million between 2000 and 2014. At the same time, young adults spend more years in tertiary education; on average, between 2005 and 2016, the share of 20–24 year olds registered in higher education increased by six percent across OECD countries (OECD Citation2018). The continuous worldwide increase in demand for higher education, in parallel with limited numbers of traditional university accommodation (i.e. dormitories), has further increased demand for student housing, posing a challenge for many cities that host a university (Thomsen and Eikemo Citation2010). This steady increase in enrollment, and insufficient number of student dormitories, forces a growing number of students to live in the private-rentedd sector (Revington et al. Citation2018). Europe, home to 19.6 million tertiary students (Eurostat Citation2016), has a considerable share of building stock that is yet to be compliant with energy performance requirements (BPIE Citation2011; Guler Citation2018) as half of it was built before 1970 (Birchall et al. Citation2014) when the first thermal regulations were introduced (Corrado, Ballarini, and Filippidou Citation2018). The proven correlation between the age of a building and its thermal efficiency (Dowson et al. Citation2012) points toward an urgent need for drastic policy measures within the EU that will accelerate the current low renovation rate of buildings (Agostino, Zangheri, and Castellazzi Citation2017). This is the only viable long-term solution helping reduce exposure to fuel poverty.
The European Commission has recently made the alleviation of energy poverty a policy priority through multi-faceted legislation that not only asks for a better definition of energy poverty and the concept of vulnerable consumers but also encourages the shaping of national plans to boost renovations and energy efficiency retrofits of buildings, safeguards against disconnections, and requires from the Member States to monitor the situation at country level (EC Citation2019). In addition, the European Commission and other EU institutions have deployed various financial instruments and mobilized funding to tackle energy poverty (Lakatos and Arsenopoulos Citation2019). In 2018 the Energy Poverty Observatory (EPOV) was launched as part of the European Commission’s policy efforts to address energy poverty across Europe (EC Citation2018).
Thus, the challenges that need resolving, are on one hand the limited availability of refined data at the European level (Thomson, Bouzarovski, and Snell Citation2017), and on the other the lack of consensus, due to the diverse realities across Member States, on how fuel poverty should be defined and measured. Overcoming the methodological and conceptual obstacles mentioned above and extending and refining the existing knowledge on fuel poverty will enable us to have a better understanding of this phenomenon and better define vulnerable groups and/or give a wider recognition to young people and students.
The present study builds on the existing evidence that university students are a social group that is vulnerable to fuel poverty. It investigated the possible drivers of fuel poverty among students, including house-hunting criteria, accommodation type, building performance, irregular income, and levels of energy awareness. Furthermore, it investigated the impact that these drivers have on student finances, health, thermal comfort, and social life.
This present work is part of wider research conducted for the Horizon 2020 funded SAVES 2 project and builds on the Homes Fit For Study research (NUS Citation2018) carried out by NUS in 2017 that provided in-depth insight into the student experience of fuel poverty in the UK. The sample of students participating in the current research is extended to six additional European countries making it the largest study to date targeting this specific social group.
2. Overview of fuel poverty in Europe
The European Union Statistics on Income and Living Conditions (EU-SILC) is an instrument of the European Statistical System (ESS) that has been used to monitor poverty and social inclusion in the EU since 2010. It provides cross-sectionall data relating to a given time period, and longitudinal data relating to individual-level changes over time, observed periodically, on a wide range of social issues such as poverty, social inclusion, living conditions, and income. Two types of variables are used in the production of EU-SILC statistics: (a) at household level and (b) at personal level. On the grounds of these target variables, additional variables are calculated for each statistical unit-observation, to support the computation of the indicators (Eurostat Citationn.d.).
Three of the indicators monitored by EU-SILC are linked to fuel poverty. Those are: presence of a leak, damp, or rot in dwellings; inability to keep one’s home adequately warm, and; arrears on mortgage or rent, utility bills or hire purchase. The utility bills indicator refers to all utility expenses including energy, water, sewage, and waste.
The most recent EU-SILC data for the three fuel poverty indicators are from 2017 and are illustrated in –. The percentage of total population experiencing any of the three fuel poverty indicators is presented for two age classes: those between 16 and 299 years old and those from 16 years and over. It should be noted that the 16 to 29 years old age group covers young people who are not necessarily enrolled in a university program as the EU-SILC instrument doesn’t provide information on the current academic status of the participants in its surveys. There isn’t a “30 years and over” age class available in the EU-SILC dataset, therefore, the second age group covers individuals of all ages. As is noted on Eurostat’s datasets, there is a break in time series for the United Kingdom, and Iceland is not included in the Figures due to unavailability of data for 2017. The horizontal straight lines in the Figures below represent the EU 28 average values for the two age groups and the bold x-axis labels highlight the seven countries where the research presented in this paper was carried out. Those are: Bulgaria, Cyprus, Greece, Ireland, Lithuania, Romania, and the United Kingdom. The decision to conduct research in the seven countries was based on two main factors; high levels of fuel poverty across the general population as evidenced through the EU-SILC indicators, and the ability to reach students in those countries through local universities or students’ unions. As the EU-SILC findings for 2017 reveal, the share of people aged between 16 and 299 years old experiencing the three fuel poverty indicators is higher than those aged 16+ in all seven countries where we conducted our research, with the exception of Lithuania; in Lithuania the prevalence of people aged 16–29 unable to keep their home adequately warm (). Nevertheless, the share of young people in Lithuania between 16 and 299 who are unable to heat their homes adequately is the fourth highest across Europe.
Figure 1. Share of total population with no activity limitation aged 16 years old or over and 16 to 29 years old living in a dwelling with a leaking roof, damp walls, floors or foundations, or rot in window frames of floor. EU-SILC survey, 2017c. Source of data: Eurostat. Author’s own representation.
Figure 2. Share of total population with no activity limitation aged 16 years old or over and 16 to 29 years old with arrears on mortgage or rent, utility bills or hire purchase. EU-SILC survey, 2017a. Source of data: Eurostat. Author’s own representation.

Figure 3. Share of total population with no activity limitation aged 16 years old or over and 16 to 29 years old not able to keep their home adequately warm. EU-SILC survey, 2017b. Source of data: Eurostat. Author’s own representation.
In , the share of total population living in a substandard home in 2017, not experiencing any difficulty in executing a task or action, is presented per country and per age group. Comparing the 16 to 29 age group, out of the seven countries from our research four are close to the EU-28 average of 14.4% (Bulgaria 15.3%, Ireland 15.6%, Greece 13.8%, and Lithuania 13.5%), two are above the average (Cyprus 32.2%and the United Kingdom 18.2%), and one is below (Romania 10.7%). Cyprus has the highest share of population in Europe living in a substandard home which is more than twice the EU −28 [16–29] average.
Three of the countries in our study, Bulgaria (39.6%), Cyprus (30.2%), and Greece (51.4%), have the highest percentages among the EU-28 countries of 16 to 29 year olds with arrears on mortgage or rent, utility bills or hire purchase, () and are significantly over the average of 10.8%. Ireland (13.6%) and Romania (15.8%) are over the average, while Lithuania (9.6%) and the United Kingdom (8.8%) are the only two countries below the average.
A significant share of the total population aged 16 to 29 years in Bulgaria (38.9%), Greece (28.6%), Cyprus (27.2%), and Lithuania (26.1%) is not able to keep their home adequately warm () which significantly higher than the EU-28 average for this age group (8.1%). Romania (10.4%) is closer to the EU-28 [16–29] average, while Ireland (5.3%) and the United Kingdom (7.0%) are the only two countries from our study that are below this average. Overall, Bulgaria, Cyprus, Greece, and Lithuania have the four highest shares in Europe of people aged 16 to 29 years unable to adequately heat their dwellings.
3. Methodology
The aim of this study was to understand, evaluate, and consequently reveal the experiences of students living in the private-rentedd sector, quantify their possible exposure to fuel poverty and its impacts on their well-being. Students living in seven EU countries (Bulgaria, Cyprus, Greece, Ireland, Lithuania, Romania, and the United Kingdom) participated in our research.
Data from students was collected through a survey that included 35 questions many of which were identical to those of the Homes Fit for Study research (NUS, Citation2018). No new data for the UK were collected for the purposes of this research so results for the UK are only presented for the identical questions between the two studies. In this paper we present the findings from fifteen questions most relevant to its scope. These fifteen questions are described in detail in the Annex. The full list of questions (35 in total) and results drawn from the full SAVES 2 research are reported in “Analysis of the current trends in the rental accommodation market for students” (SAVES2, Citation2018).
Three of the questions of the current research are related to demographics and one of them determined the eligibility of the respondents for the research (see Annex). The remaining questions looked at students’ energy awareness and attitudes, drivers for housing selection, experience of fuel poverty indicators in their everyday life, their social life, and well-being.
Online versions of the questionnaire surveys were created on LimeSurvey in Bulgarian, Greek, Lithuanian, Romanian, and English. The questionnaires were disseminated to students through university mailing lists, students’ unions, local students’ letting agents and private rental agencies.
All data were collected during winter months in order to be reflective of fuel poverty conditions in students’ homes. The UK data were collected between January and February 2017. Data from the other six countries were collected in December 2017 and January 2018.
3.1. Participant sample
Respondents in Bulgaria, Cyprus, Greece, Lithuania, and Romania came from specific universities: Sofia University ‘St. Kliment Ohridski’ (UoS), University of Cyprus (UCY), National and Kapodistrian University of Athens (NKUA), Technical University of Crete (TUC), Vilnius Gediminas Technical University (VGTU), and the University of Bucharest (UoB). Respondents from the UK and Ireland came from a large number of different universities as they were contacted by the National Union of Students (NUS-UK) and Union of Students in Ireland (USI), who have a country-wide reach through their networks.
Out of the total number of respondents that participated in the questionnaire the shares that were eventually considered in this analysis were those that ():
Lived in a privately rented house/flat from a landlord
Lived in a privately rented house/flat from a letting agent
Lived in a rented room in a landlord’s house
Table 1. Independent variable utilized in logistic regression analysis.
Table 2. Independent variables utilized for logistic regression.
Table 3. Statistics implemented for the evaluation of backward LR logistic regression model.
Table 4. Student current term-time accommodation on which the eligibility of research participants was based.
Data for the UK was weighted by gender. For the other six countries the participation rate was assumed low or moderate () so data were not weighted by gender.
Table 5. Demographics of research participant.
3.2. Data analysis
Descriptive statistics were used to analyze the collected data for each country. In addition to basic mean values, standard deviations, and percentages for each participating country, Spearman correlation analysis, and logistic (logit) regression models for the whole sample were applied to help further investigate the relationships between poor housing conditions and students’ health and comfort. Spearman correlation analysis and logistic (logit) regression models could not be applied for the UK due to unavailability of the corresponding questionnaire data. A Reliability test was carried out for all Likert questions with the use of Cronbach’s Alpha (a) (Cronbach Citation1951). Considering a k x l matrix wherein each column/row represents a question/subject, Cronbach’s alpha can be calculated by the following equation:
where στ2 is the variance of the sum of each row of the matrix, σi2 is the variance of the sum of each row of the matrix and k is a correction parameter. The more consistent the quantified answers are, the greater the value of στ2 and thus a tends to 1. Adversely, στ2 tends to approximate σi2 and thus a tends to 0 (Leontitsis and Pagge Citation2007).
At first, a normality test was carried out to examine if the data can fit the normal distribution. The result, however, showed that the data do not fit the normal distribution since the corresponding Shapiro-Wilk p values (Z. Wang et al. Citation2019) were lower than 0.05. To that end, Spearman’s rank correlation coefficient (rs) was utilized. It is a nonparametric measure employed when the dataset does not follow the normal distribution and/or is relatively small (Grech and Calleja Citation2018). It is calculated through the following equation:
where di is the significant difference between the two ranked variables and n is the total number of the data pair. Its values range from −1 to +1. If rs = +1 it signals a perfect positive correlation. Adversely, if rs = −1 it signals a perfect negative correlation (Gauthier Citation2001).
Multivariate logistic regression was used to investigate the impact of housing conditions on residents’ well-being. In the dataset, the possible detrimental impact of housing conditions to students’ well-being was considered as a binary dependent variable (no = 0, yes = 1). Moreover, seven explanatory variables used for logistic regression analysis were chosen on the basis of existing literature and relevant apprehension connected to Fuel Poverty indexes suggested in literature (Csiba, Bajomi, and Gosztonyi Citation2016) (). The variable selection was carried out under the framework of giving insights into the main factors governing the thermal profile of an accommodation, as well as the consequent thermal comfort experienced by the occupant and the corresponding, if any, health impacts.
Two stepwise logit models incorporating the Backward likelihood-ratio (backward elimination of the statistically insignificant variables) and the Forward likelihood ratio (forward selection of the statistically significant variables) respectively, alongside a model following the Entry procedure (variables’ statistical significance is assessed simultaneously in a single step) were put into force (Hosmer et al. Citation1978) and compared.
The following statistical tools and techniques were utilized for concluding to the best fitting logistic regression model:
Percentage correct predicted
Negelkerke R2
ROC – area under the curve
AIC criterion
The main principles of the abovementioned statistics are tabulated in .
Eventually, the Backward likelihood ratio model performed better in terms of data fitting accuracy and thus its variable selection is presented here using a p-value < 0.05. The results are expressed as odds ratios with 95% confidence intervals. The formulated model is expressed by (C. Wang et al. Citation2019) as:
where V1, V2, V3, V4, V5, V6, V7, represent each independent variable and β0, βj, βk, βl, βm, βn, βq, β0 are the corresponding log odds units. Finally, the overall performance of the Backward logistic regression model was evaluated by further statistical tests. A hypothesis and a goodness of fit test were implemented, following the Likelihood Ratio and the Hosmer-Lemeshow methodology, respectivelyy (). The Likelihood Ratio is a hypothesis test that indicates the best-fittedd model between two nested models, by approximating a Chi-squared distribution. The Hosmer–Lemeshow test is a goodness of fit test for evaluating the overall performance of a logistic regression model, i.e. it specifies how well the data fit the model. This statistical method is implemented as a Pearson Chi-square. Setting as Y the number of groups developed from expected probabilities of each observation, a log-likelihood estimation is calculated from a 2 x Y table of observed and expected frequencies (Ismail Citation2015).
3.3. Data limitations
The data gathered in this study were provided by students living in seven EU countries. However, since data was obtained through a questionnaire survey, the results inevitably face some limitations. First of all, in some cases, e.g. Bulgaria and Greece, the response rate is low and thus the results cannot be considered as representative of the corresponding country. Similarly, gender bias incidents are possible since, except for the UK, the corresponding variable was not taken into account in the analysis. Another issue is the unavailability of data from the UK concerning some presented questions. Therefore, the results should not be considered as representative of student’s universe but indicative and must be used with prudence. It should be mentioned nevertheless, that globally speaking, this study presents one distinct advantage; to the best of the authors’ knowledge the geographic coverage of this study is the largest among relevant academic works targeting students as a social group. As such, the results provide valuable EU-wide insight into student experience of fuel poverty, which until recently has been under-reported and under-supported. Ideally the present work will be extended to add further student data, not only from the seven countries but from the rest of Europe, thus becoming more representative of the student population in each country and of the climatic, cultural, legislative, and other differences between European countries.
4. Results
The results are divided into two parts. The first is focused on students’ house hunting criteria, the impact of the selected home on their energy bills, and thermal comfort. The second section focuses on incidences of building disorder, problems, and hazards in students’ accommodation, and the consequent implications on their wellbeing.
In some instances results for the UK are not presented because the corresponding data was not available. This is because data for the UK were collected in 2017 through the Homes Fit for Study (HFFS) research (NUS (National Union of Students) Citation2018) while data for the other six countries were collected specifically for the purposes of this research, months after the UK research was completed. The questionnaire used for this research included a mixture of questions from the HFFS research and some new additional ones, that served the scope of our research. It is for those additional questions that data, and therefore results are not available for the UK.
4.1. Socio-demographic characteristics
The number of students that opened the questionnaire was 7,097. However, as shown in , a large number of respondents (3,585 of the initial respondents) had to be excluded from the survey because they didn’t live in the private-rentedd sector (e.g. lived in a place they owned, lived with family, lived in halls of residence (or other accommodation provided by their university)). Eventually, 3,512 students were considered eligible for this research () and could continue taking part in the survey.
summarizes the type of privately rented accommodation used by the respondents at the time of the survey. The most popular type in all participating countries was a house or flat rented directly from a landlord. In the UK, renting a house or flat from a letting agency was as common as renting a house or flat from a landlord. On the other hand, renting a room in a landlord’s house is common among Bulgarian respondents. It is worth noting that in total, and for most of the countries (more than 70% of the sample in five out of seven countries), significantly more women than men responded to the questionnaire, which could have had an impact on the results presented in this paper.
4.2. Criteria when house hunting
In all countries except for Bulgaria, respondents predominantly chose their accommodation based on affordability of rent, location, and condition (). In Bulgaria, the primary criterion for respondents was the size of the accommodation. A good energy efficiency rating was not a priority in any country when choosing a house.
Table 6. Criteria when house-hunting.
As shown in , in all countries except for Bulgaria, significant shares of respondents did not receive an energy performance certificate (EPC) either upon or without request. In Bulgaria, most respondents reported receiving an EPC, principally upon request. In the UK a notable share received an EPC without requesting it. Nevertheless, in almost all countries a notable percentage of respondents (between 22% and 43%) did not know whether they had received an EPC or not, suggesting disinterest or low awareness of energy efficiency.
Table 7. Receipt of an EPC.
4.3. Energy costs and comfort
Indoor thermal discomfort can be a result of several interconnected factors. In all countries, a significant share of respondents (between 18% and 66%) felt colder (either much or a bit) during the winter than they would have liked (). Over 60% of respondents in Ireland and 56% in the UK felt colder than they would like to in their home.
Table 8. Thermal comfort of participants.
A crucial factor that may influence the occupants’ decision to heat their homes is whether the energy bills are included in the rent or are paid as an additional amount (). In all countries, the majority of respondents paid their energy bills either separately to their landlord or directly to their supplier. In Ireland approximately one-thirdd of the respondents reported that their energy bills were included in the rent payment, while the same was reported in the UK by 28% of respondents.
Table 9. Payment methods for utility bills.
One of the major implications of fuel poverty is the inability to adequately heat one’s home. As shown in many respondents in all countries either turned the heat down or off to keep their costs down. The highest corresponding shares were observed in the UK (82%) and Ireland (70%) and are in agreement with the previous finding that the majority of respondents in these two countries felt colder than they would like to in their home.
Table 10. Actions taken due to concerns about energy costs.
Among the various drivers of fuel poverty, the cost of energy is deemed of critical importance as well. Significant shares of respondents from Ireland, Greece, Cyprus, and Lithuania (37%, 36%, 33%, and 27%, respectively) reported high energy bills despite efforts to use less energy (). In Bulgaria 67% of the respondents managed to keep their energy bills at affordable levels due to significant efforts to use less energy. The same was reported for slightly lower shares of respondents in Greece (42%), Cyprus (40%), Ireland (35%), and Romania (26%).
Table 11. Efforts to save energy and its impact on energy bills.
Arrears on energy bills are another major consequence of fuel poverty. Respondents who paid their utility bills separately (as opposed to respondents who had an all-inclusive rent agreement, which included a set fee for bills) were asked whether they had faced such arrears. The results () indicate that whilst the majority of respondents in all countries were able to pay their energy bills, some occurrences of arrears due to lack of money were reported, mainly in Bulgaria (27%), Greece (15%) and Romania (14%).
Table 12. Arrears in utility bills.
4.4. Housing conditions and satisfaction with accommodation
Another impact of fuel poverty is the emergence of poor housing conditions such as damp, mold, rot, and leakages, though it could be argued that their presence in the first place can exacerbate fuel poverty conditions. In all countries, instances of damp or mold on walls and/or ceilings either in respondents’ current and/or in their previous accommodations were reported (). Leaks in the roof or windows, rot in window frames or floors, and a level of infestation were found in all countries, however, this was less frequently observed compared to damp or mold. Cyprus was the only country where respondents didn’t report any infestation.
Table 13. Building disorder, problems, and hazards in housing.
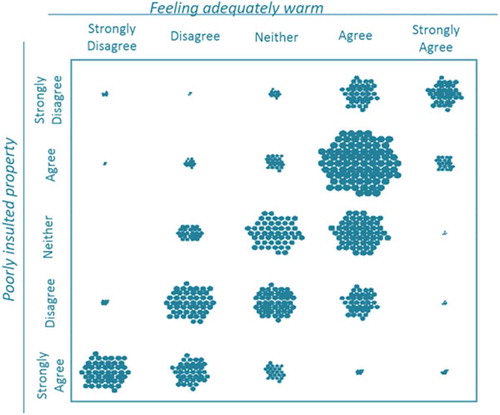
The primary relationship between poorly insulated properties and thermal comfort or the decreased energy usage of its tenants were investigated for the entire sample rather than per country. To this effect, at first the Cronbach’s alpha coefficients were calculated for the corresponding Likert questions and found equal to 0.69. Successively, non-parametric tests were carried out by employing Spearman’s rank correlation coefficient for the corresponding Likert scale questions. The results are statistically significant with a significance level of 0.01. The UK is not included in this part of the analysis due to unavailability of the corresponding questionnaire data.
Spearman’s correlation analysis sustained that a poorly insulated property has a negative correlation with an adequately warm feeling which is statistically significant (rs = −.527, p <.001) ().
Figure 4. Poorly insulated property vs. Feeling adequately warm.
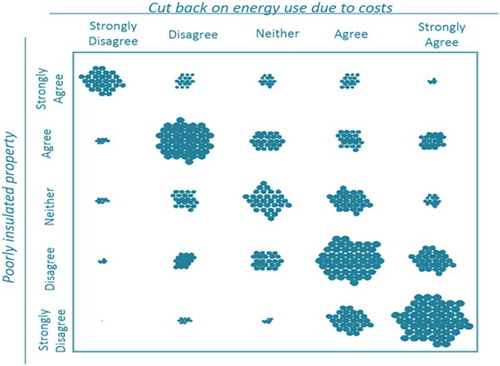
Additionally, a poorly insulated property has a positive correlation with the cut back in energy use due to its costs which is statistically significant (rs = .408, p < .001) ().
Figure 5. Poorly insulated property vs. cut back on energy use due to costs.
In all countries, the majority of respondents approached their landlord to report issues related to poor housing conditions (). However, in Lithuania, Ireland, Greece, and Romania a considerable proportion of respondents did not approach their landlord. It is thought that this could be because the respondents felt either that the issues were not worth reporting, or they were afraid that the respective improvements to the building could result in an increase in rent.
Table 14. Approaching the landlord about issues with accommodation.
Overall, respondents in all countries, except for Cyprus, were rather satisfied with their current accommodation (). In Cyprus most of the respondents appeared either satisfied or neutral. This might be explained by the fact that their main criteria while house hunting, namely the cost of rent, location, and condition, were met.
Table 15. Overall satisfaction with the current accommodation.
4.5. Impact on wellbeing
Poor housing conditions may negatively affect both mental and physical health, as well as social lives. As shown in a significant proportion of respondents reported feeling miserable, anxious or depressed due to the poor condition of their accommodation; notable proportions of respondents in Bulgaria, the UK, Ireland, and Cyprus felt miserable (44%, 40%, 32%, and, 24%, respectively), and furthermore, 30%, 27%, and, 21% of respondents in the UK, Ireland, and Cyprus, respectivelyy, felt anxious or depressed.
Table 16. Impacts of poor housing on students’ physical/mental health and social life.
In relation to physical health, respondents from Bulgaria (33%), Ireland (19%), Greece (14%), and the UK (11%) reported their existing health problem(s) got worse due to poor conditions of their home. It is probable however that incidences of poor health as a result of poor housing conditions are underreported; students may not be making the link between their health problems and the condition of their house – this could warrant further research that would contribute in the field of health science.
In Cyprus over a fifth of respondents preferred not to invite friends or family to their home, while a fifth of respondents living in Ireland spent as much time as possible away from their home due to its condition.
To better understand the impacts of poor housing conditions on respondents’ physical or mental health, three binary logistic regression models were implemented. Logistic regression analysis allows to further investigate the accommodation’s characteristics that are linked with the respondents’ health. In light of this, a number of indicators of poor housing conditions were regressed against the respondents’ reported health impacts. Throughout the analysis, respondents’ health was set as the dependent variable in order to investigate the corresponding effects of fuel poverty incidences. As such, independent variables representing some of the main fuel poverty outcomes and other relevant accommodation characteristics were implemented following the corresponding bibliography aiming to investigate any possible association with occupants’ health.
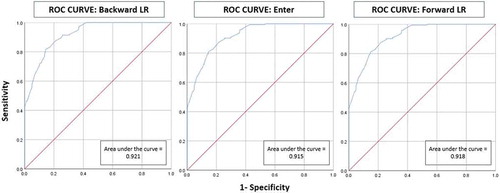
Three different logistic regression models were constructed with respect to the Enter, Forward Selection Likelihood Ratio (LR), and Backward Elimination Likelihood Ratio (LR) methods. As shown in the main statistics of all three models for the health impacts due to poor housing conditions are good. In the ROC curves of the three logistic regression models are illustrated. Whilst Backward LR and Forward LR models attain the same percentage of correct prediction, both Negelkerke Backward’s R2 and the area under the ROC curve are prevalent against Forward LR’s ones. More precisely, the Pseudo Negelkerke R2 of the Backward logistic regression, which is equal to 0.666, implies that the model can explain 66.6% of the deviations in the probability of a detrimental impact in respondents’ health, percentage higher than the corresponding ones of the other two models. In addition, the Backward logistic regression has the highest value of the area under the ROC curve (0.921) meaning that it outperforms in terms of accurate discriminating performance between the two dependent variable’s values (1 = yes, 0 = no). It is moreover characterized by the lowest value in terms of the AIC criterion (307.31) and thus it may outperform the Enter and Forward logistic regression models, on estimating the values of the dependent variable. Finally, the Backward logistic regression model is qualified with the highest Log likelihood value (−145.65). Therefore, the Backward LR model is considered the most robust.
Table 17. Characteristics of logistic regression models.
Figure 6. ROC curve area of logistic regression models.
All predictor variables added to the model were found to have a statistically significant influence on respondents’ health (). The odds of reporting a negative health impact either physical or mental are increased by a factor of 3.018 by turning the heating off in order to reduce costs, while indication of condensation, draughty windows/doors, and damp/mold also increased the odds by a factor of 3.923, 2.721, and 2.021, respectively.
Table 18. Logistic regression for the impact of housing conditions on occupants’ health.
These results indicate that poor housing conditions can have a negative impact on one’s well-being. They also demonstrate that turning the heating system down or off to help cut down costs, can have a negative impact on one’s health. Finally, a sufficiently insulated home can lower the risk of developing poor physical or mental health.
Further statistics were utilized to evaluate the reliability of the model, namely the Likelihood Ratio and the Hosmer-Lemeshow tests (). The Chi square was found statistically significant and equal to 296.42 and thus the null hypothesis that the model’s explanatory power is not adequate can be rejected (Ismail Citation2015). As shown in the probability to accept the null hypothesis that the model was good enough to explain the deviations is 97% while the Hosmer-Lemeshow value is equal to 2.29.
Table 19. Results of likelihood ratio and Hosmer-Lemeshow tests.
5. Conclusions
The research presented in this paper aimed to further understand and evaluate the experiences of students living in the private-rentedd sector, to quantify their possible exposure to fuel poverty, and to determine the impacts of this exposure on their well-being. It covered seven European countries making it the largest study to date targeting this specific social group. However, the authors recognize that the sample is not representative of the number of students per country. As a consequence, this study should work as a stimulus for further research that is needed for capturing the actual magnitude of fuel poverty among students living in the presented countries. Additionally, with the exception of the UK, the datasets were not weighted, therefore, bias incidences might be apparent in the results. Subsequently, future research should also investigate whether gender, age, and field of study play a role in their level of exposure to fuel poverty.
When choosing their accommodation students are primarily interested in the cost of rent, the location, and condition of the property. This was the case for students in six out of seven countries studied in this research. In the seventh country, Bulgaria, respondents were primarily interested in the size of the accommodation. In no country was the availability of an Energy Performance Certificate (EPC), a priority for students when house hunting. This fact alone is indicative of the vulnerability of students to fuel poverty even before they move in to their home. In fact, in most countries a considerable share of students did not know if they had received an EPC or not, thus suggesting low energy awareness or disinterest in energy efficiency issues. Bulgaria is the only exception, as all respondents were aware of whether they had received an EPC or not, either upon or without request. In the UK, a noteworthy share (37%) received an EPC without requesting it while in Bulgaria the majority of respondents (55%) received an EPC upon request.
Overall, respondents were rather satisfied with their accommodation and this could be because the criteria that students prioritized during house hunting, namely the cost of rent, location, condition of the home, and its size were being met.
Over half of the respondents living in the western European countries (Ireland and the UK) felt much or a bit colder than they would have liked to in their home during winter. The same was reported by significant shares in the southern European countries (Greece and Cyprus). On the other hand, the majority of respondents living in the eastern European countries (Lithuania, Bulgaria, and Romania) reported to be content with their overall comfort during the winter period. Poor thermal comfort conditions could be attributed to the fact that a significant share of respondents in all countries, but mainly in the UK, Ireland, and Greece, turned their heating down or off to keep their heating costs down.
With regards to overall utility bills, considerable shares of respondents from Ireland, Greece, Cyprus, and Lithuania (between 27% and 37%) reported high energy bills despite efforts to use less energy. In Bulgaria 67% of the respondents did manage to keep their energy bills at affordable levels but only after significant efforts to use less energy. The same was reported for slightly lower shares of respondents in Greece, Cyprus, Ireland, and Romania. Students who paid for their utility bills were consequently asked whether they were unable to pay their energy bills due to lack of money. Whilst in all countries the majority of respondents were able to pay their energy bills on time, arrears were reported in all countries (between 7% and 27%).
Spearman correlation analysis evidenced that in general, an inadequately insulated property has a negative primary relationship with adequate thermal comfort of respondents and a positive primary relationship with a decreased energy use out of fear for high costs. As a result of poor housing conditions, some of the respondents reported feeling miserable, anxious or depressed; in Bulgaria, the UK, Ireland, and Cyprus a high share of respondents felt miserable (between 24% and 44%), and furthermore, 30%, 27%, and 21% of respondents in the UK, Ireland, and Cyprus, respectivelyy, felt anxious or depressed. Some of the respondents from Bulgaria (33%), Ireland (19%), Greece (13%), and the UK (11%) reported that existing health problem(s) got worse due to poor conditions of their home. At the same time in Cyprus over a fifth of respondents preferred not to invite friends or family to their home, while a fifth of respondents living in Ireland spent as much time as possible away from home due to its condition. In this regard, logistic regression analysis showed that poor housing conditions, and mainly the limitation of heating due to costs, have a big impact on students’ health.
In general, the results of this study suggest that university students are a social group that is vulnerable to fuel poverty. Furthermore, their exposure to such conditions can have a detrimental effect on both their mental and physical health as well as on their social life. These can be attributed among others to the low-reportedd levels of awareness on energy efficiency, incidences of unsatisfactory thermal comfort due to costs and existing poor housing conditions. However, further research on incidences of poor health as a result of poor housing conditions may reveal that such incidences are even higher than those captured through this paper as students may not be making the link between their health problems and the condition of their house.
European energy and social policy have actively addressed the age and quality of the European building stock over the last few years which has a crucial effect on the number of citizens living in fuel poverty (many likely to be students). Evidence presented in this paper shows that, in addition to the adoption of the necessary policy measures to accelerate the renovation of building stock and the tackling of fuel poverty, further research is needed to understand students’ decision-makingg processes that can leave them exposed to fuel poverty. In addition, raising awareness on the benefits of choosing more energy efficient properties ((which may be slightly more expensive in terms of rent, but will lead to much lower energy costs, sufficient energy services, and better quality of life), could help students make more informed decisions when selecting accommodation. It is clear that students are exposed to fuel poverty, either due to external determinants and/or through their own decision-makingg. National policy makers need to be aware of this when creating their energy policy. The policy is a requisite for all Member States as part of the Clean energy for all Europeans package that supports renovations and energy efficiency retrofits of buildings, safeguards against disconnections, and monitors the energy poverty situation. Therefore, the timing could not be better for addressing the issue of energy poverty for different social groups including that of university students which as revealed through this research is a group vulnerable to fuel poverty.
Acknowledgments
We would like to thank the SAVES 2 project team members for supporting and assisting us in the tailoring of the methodology to all local context, the translations of the questionnaire survey and its circulation in the respective countries: Neil Jennings from the National Union of Students UK (NUS), Vasileios Lontorfos from the University of Athens (UoA), Rostislava Kutsarova from the Sofia University ‘St. Kliment Ohridski’ (UoS), Christina Lambrou, and Costas Charalambous from the University of Cyprus (UCY), Stelios Diakrousis from the Technical University of Crete (TUC), Darcy Lonergan, and Ben Archibald from the Union of Students in Ireland (USI), Audrius Banaitis and Adas Meskenas from the Vilnius Gediminas Technical University (VGTU) and Magdalena Platis, Silvia Padure, and Claudia Maria Udrescu from the University of Bucharest (UoB).
We would also like to thank Rachel Drayson from the National Union of Students UK (NUS) for sharing the material used in the Homes Fit for Study research and all her support in integrating the UK results (Homes Fit for Study) in the SAVES 2 study.
Correction Statement
This article has been republished with minor changes. These changes do not impact the academic content of the article.
Additional information
Funding
References
- Agostino, D. D., P. Zangheri, and L. Castellazzi. 2017. Towards nearly zero energy buildings in Europe: A focus on retrofit in non-residential buildings. Energies 10 (1). doi: 10.3390/en10010117.
- Ambrose, A. R. 2015. Improving energy efficiency in private rented housing: Why don’t landlords act? Indoor and Built Environment 24 (7):913–24. doi:10.1177/1420326X15598821.
- Bewick, V., L. Cheek, and J. Ball. 2005. Statistics review 14: Logistic regression. Critical Care 9 (1):112. doi:10.1186/cc3045.
- Birchall, S., I. Wallis., D. Churcher, S. Pezzutto, R. Fedrizzi, and E. Causse, 2014.A survey on the needs and the architectural features of the EU building stock. D2.1. BSRIA. Grant Agreement No: 314461 (FP7/2007-2013), iNSPiRe Project. Accessed September 6, 2019. http://inspirefp7.eu/wp-content/uploads/2016/08/WP2_D2.1a_20140523_P18_Survey-on-the-energy-needs-and-architectural-features.pdf.
- Boardman, B. 1991. Fuel poverty: From cold homes to affordable warmth. London: Belhaven Press.
- Boardman, B. 2009. Fixing fuel poverty, challenges and solutions. London: Routledge. doi:10.4324/9781849774482.
- Bouzarovski, S. 2014. Energy poverty in the European Union: Landscapes of vulnerability. Wiley Interdisciplinary Reviews: Energy and Environment 3 (3):276–89. doi:10.1002/wene.89.
- Bouzarovski, S., and S. Petrova. 2015. A global perspective on domestic energy deprivation: Overcoming the energy poverty-fuel poverty binary. Energy Research and Social Science 10:31–40. doi:10.1016/j.erss.2015.06.007.
- Bouzarovski, S., S. Petrova, M. Kitching, and J. Baldwick. 2013. Precarious domesticities: Energy vulnerability among urban young adults. Eds. K. Bickerstaff, G. Walker, and h. Bulkeley, In Energy justice in a changing climate; social equity in a changing climate, London: Zed Books, 30–45. doi:10.1360/zd-2013-43-6-1064.
- Bouzarovski, S., S. Petrova, and S. Tirado-Herrero, 2014. From fuel poverty to energy vulnerability: The importance of services, needs and practices. Accessed March 20, 2019. https://papers.ssrn.com/sol3/papers.cfm?abstract_id=2743143.
- Bouzarovski, S., and S. Tirado-Herrero. 2017. The energy divide: Integrating energy transitions, regional inequalities and poverty trends in the European Union. European Urban and Regional Studies 24 (1):69–86. doi:10.1177/0969776415596449.
- BPIE (Buildings Performance Institute Europe). 2011. Europe’s buildings under the microscope. Buildings Performance Institute Europe, Brussels. ISBN: 9789491143014.
- Carr, H. 2019. Law and the Precarious home: A case study of thermal inefficiency in English homes. In Law and the Precarious Home: Socio Legal perspectives on the home in insecure times, ed. H. Carr, B. Edgeworth, and C. Hunter, 139–58. 1st ed. Oxford: Hart Publishing.
- Clugston, R. M., and W. Calder. 1999. Critical dimensions of sustainability in higher education. In Sustainability and university life, ed. W. L. Filho, 31–46. 2nd ed. New York, NY: Peter Lang.
- Corrado, V., I. Ballarini, and F. Filippidou. 2018. Cost-benefit analysis of building renovation. In Handbook of energy efficiency in buildings: A life cycle approach, ed. U. Desideri and F. Asdrubali, 773–810. 1st ed. Oxford: Butterworth-Heinemann.
- Cronbach, L. J. 1951. Coefficient alpha and the internal structure of tests. Psychometrika 16 (3):297–334. doi:10.1007/BF02310555.
- Csiba, K., A. Bajomi, and Á. Gosztonyi, eds. Jones, S., A. Tod, H. Thomson, MD. Groote, F. Anagnostopoulos, S. Bouzarovski, S.Tirado-Herrero, C. Snell, A. Dobbins, S. Pye, et al. 2016. Energy poverty handbook. Brussels, Belgium: The Greens/EFA group of the European Parliament. doi:10.2861/094050.
- Dowson, M., A. Poole, D. Harrison, and G. Susman. 2012. Domestic UK retrofit challenge: Barriers, incentives and current performance leading into the green deal. Energy Policy 50:294–305. doi:10.1016/j.enpol.2012.07.019.
- EPEE project. 2009. European fuel poverty and energy efficiency. Accessed November 28, 2019. https://ec.europa.eu/energy/intelligent/projects/sites/iee-projects/files/projects/documents/epee_european_fuel_poverty_and_energy_efficiency_en.pdf.
- European Commission. 2015. Vulnerable consumer working group: Working paper on energy poverty. Accessed March 28, 2019. https://ec.europa.eu/energy/sites/ener/files/documents/Working Paper on Energy Poverty.pdf.
- European Commission. 2018. Launch of the EU energy poverty observatory (EPOV). Last modified November 30, 2018. Accessed November 29, 2019. https://ec.europa.eu/energy/en/events/launch-eu-energy-poverty-observatory-epov.
- European Commission. 2019. Clean energy for all Europeans package. Accessed September 9, 2019 https://ec.europa.eu/energy/en/topics/energy-strategy-and-energy-union/clean-energy-all-europeans.
- Eurostat. 2016. Tertiary education statistics. Last Modified December 19, 2018. Accessed March 29, 2019. https://ec.europa.eu/eurostat/statistics-explained/index.php?title=Tertiary_education_statistics#Participation.
- Eurostat, n.d. European Union statistics on income and living conditions (EU-SILC). Accessed March 26, 2019. https://ec.europa.eu/eurostat/web/microdata/european-union-statistics-on-income-and-living-conditions.
- EU-SILC survey. 2017a. Arrears (mortgage or rent, utility bills or hire purchase) by level of activity limitation, sex and age. Accessed November 29, 2019. https://ec.europa.eu/eurostat/web/products-datasets/-/hlth_dm050.
- EU-SILC survey. 2017b. Inability to keep home adequately warm by level of activity limitation, sex and age Accessed November 29, 2019. https://ec.europa.eu/eurostat/web/products-datasets/-/hlth_dhc140.
- EU-SILC survey. 2017c. People living in a dwelling with a leaking roof, damp walls, floors or foundation, or rot in window frames or floor by level of activity limitation, sex and age. Accessed November 29, 2019. https://ec.europa.eu/eurostat/web/products-datasets/-/hlth_dhc070.
- Fawcett, T., 2006. An introduction to ROC analysis. Pattern recognition letters, 27(8),pp.861-874. doi:https://doi.org/10.1016/j.patrec.2005.10.010
- Gauthier, T. D. 2001. Detecting trends using Spearman’s rank correlation coefficient. Environmental Forensics 2:359–62. doi:10.1006/enfo.2001.0061.
- Grech, V., and N. Calleja. 2018. WASP (Write a Scientific Paper): Parametric vs. non-parametric tests. Early Human Development 123:48–49. doi:10.1016/j.earlhumdev.2018.04.014.
- Grey, C., Schmieder-Gaite, T., Jiang, S., Nascimento, C., Poortinga, W. 2017. Cold homes, fuel poverty and energy efficiency improvements: A longitudinal focus group approach. Indoor + built environment: the journal of the International Society of the Built Environment, 26(7):902-913. doi:https://doi.org/10.1177/1420326X17703450
- Guertler, P., and P. Smith, 2018. Cold homes and excess winter deaths a preventable public health epidemic that can no longer be tolerated, (February), 1–22. https://www.e3g.org/library/cold-homes-and-excess-winter-deaths-a-preventable-public-health-epidemic.
- Guler, K. 2018. How passive house standard transformed design process and occupant experience. In Contemporary issues in housing design, ed. K. Guler, 189–208. 1st ed. Newcastle upon Tyne, Cambridge Scholars Publishing.
- Healy, J. 2003. Fuel poverty and policy in Ireland and the European Union vol. 12 of studies In Public Policy. 1st ed. Dublin: The Policy Institute.
- Hills, J., 2011. Fuel poverty - The problem and its measurement: Interim report of the fuel poverty review. Report No. 69, Case, London. Accessed March 15, 2019. http://sticerd.lse.ac.uk/dps/case/cr/CASEreport69.pdf.
- Hosmer Jr, D. W., C. Y. Wang, I. C. Lin, and S. Lemeshow. 1978. A computer program for stepwise logistic regression using maximum likelihood estimation. Computer Programs in Biomedicine 8 (2):121–34. doi:10.1016/0010-468X(78)90047-8.
- Hosmer Jr, D. W., S. Lemeshow, and R. X. Sturdivant. 2013. Applied logistic regression (Vol. 398). Hoboken, New Jersey: John Wiley & Sons.
- Ismail, Z. 2015. An empirical estimation of energy poverty in poor South African households. Journal of Economics and Sustainable Development 6 (13). https://pdfs.semanticscholar.org/60fb/f24e99d42d78c118b5ae258055dd54d83fc6.pdf.
- Kose, T. 2019. Energy poverty and health : The Turkish case Energy poverty and health: The Turkish case. Energy Sources, Part B: Economics, Planning, and Policy 1–13. doi:10.1080/15567249.2019.1653406.
- Lakatos, E., and A. Arsenopoulos. 2019. Investigating EU financial instruments to tackle energy poverty in households: A SWOT analysis. Energy Sources, Part B: Economics, Planning, and Policy 14 (6):235–53. doi:10.1080/15567249.2019.1667456.
- Leontitsis, A., and J. Pagge. 2007. A simulation approach on Cronbach’s alpha statistical significance. Mathematics and Computers in Simulation 73 (5):336–40. doi:10.1016/j.matcom.2006.08.001.
- Li, K., B. Lloyd, X. J. Liang, and Y. M. Wei. 2014. Energy poor or fuel poor: What are the differences? Energy Policy 68:476–81. doi:10.1016/j.enpol.2013.11.012.
- Liddell, C., and C. Morris. 2010. Fuel poverty and human health: A review of recent evidence. Energy Policy 38 (6):2987–97. doi:10.1016/j.enpol.2010.01.037.
- LimeSurvey: An open source survey tool. (version 2.73.1). LimeSurvey GmbH, Hamburg, Germany. http://www.limesurvey.org.
- Marmot Review Team. 2011. The Health Impacts of Cold Homes and Fuel Poverty. Report. London: Friends of the Earth and the Marmot Review Team. Accessed March 29, 2019. http://www.instituteofhealthequity.org/resources-reports/the-health-impacts-of-cold-homes-and-fuel-poverty/the-health-impacts-of-cold-homes-and-fuel-poverty.pdf.
- Martínez-Camblor, P., C. Carleos, and N. Corral. 2013. General nonparametric ROC curve comparison. Journal of the Korean Statistical Society 42 (1):71–81. doi:10.1016/j.jkss.2012.05.002.
- Mohammed, A. A., C. Naugler, and B. H. Far. 2015. Emerging business intelligence framework for a clinical laboratory through big data analytics. Emerging trends in computational biology, bioinformatics, and systems biology: Algorithms and software tools, 577–602. New York: Elsevier/Morgan Kaufmann. doi:10.1016/B978-0-12-802508-6.00032-6.
- Moore, R. 2012. Definitions of fuel poverty: Implications for policy. Energy Policy 49:19–26. doi:10.1016/j.enpol.2012.01.057.
- Morris, J., and A. Genovese. 2018. An empirical investigation into students’ experience of fuel poverty. Energy Policy 120 (May):228–37. doi:10.1016/j.enpol.2018.05.032.
- Nagelkerke, N. J. 1991. A note on a general definition of the coefficient of determination. Biometrika 78 (3):691–92. doi:10.1093/biomet/78.3.691.
- NUS (National Union of Students), 2018. Homes fit for study. Report. National Union of Students. Accessed March 29, 2019. https://s3-eu-west-1.amazonaws.com/nusdigital/document/documents/39256/20180313_EAGA_NUS_Homes_fit_for_study_Research_report_FINAL.pdf.
- OECD (Organisation for Economic Co-operation and Development). 2018. Education at a glance 2018: OECD indicators. Paris: OECD Publishing. doi:10.1787/eag-2018-en.
- Ofgem. 2008. Energy supply probe - Initial findings report. Accessed November 28, 2019. https://www.ofgem.gov.uk/ofgem-publications/38437/energy-supply-probe-initial-findings-report.pdf.
- Papada, L., N. Katsoulakos, I. Doulos, and D. Kaliampakos. 2019. Analyzing energy poverty with fuzzy cognitive maps : A step-forward towards a more holistic approach analyzing energy poverty with fuzzy cognitive maps : A. Energy Sources, Part B: Economics, Planning, and Policy 14 (5):159–82. doi:10.1080/15567249.2019.1634162.
- Petrova, S. 2018. Encountering energy precarity: Geographies of fuel poverty among young adults in the UK. Transactions of the Institute of British Geographers 43 (1):17–30. doi:10.1111/tran.12196.
- Revington, N., M. Moos, J. Henry, and R. Haider. 2018. The urban dormitory: Planning, studentification, and the construction of an off-campus student housing market. International Planning Studies. doi:10.1080/13563475.2018.1552565.
- Rudge, J., and R. Gilchrist. 2005. Excess winter morbidity among older people at risk of cold homes : A population-based study in a London borough. Journal of Public Health. 27 (4):353–58. doi:10.1093/pubmed/fdi051.
- Šajn, N., 2016. Energy poverty: protecting vulnerable consumers. http://www.europarl.europa.eu/RegData/etudes/BRIE/2016/583767/EPRS_BRI(2016)583767_EN.pdf.
- SAVES2 project. 2018. D5.1 analysis of the current trends in the rental accommodation market for students https://saves.nus.org.uk/resources/analysis-of-current-trends-in-the-rental-accommodation-market-for-students.
- Seebauer, S., M. Friesenecker, and K. Eisfeld. 2019. Integrating climate and social housing policy to alleviate energy poverty: An analysis of targets and instruments in Austria. Energy Sources, Part B: Economics, Planning, and Policy 14 (7–9):304–26. doi:10.1080/15567249.2019.1693665.
- Simcock, N., G. Walker, and R. Day. 2016. Fuel poverty in the UK: Beyond heating? People Place and Policy Online 10 (1):25–41. doi:10.3351/ppp.0010.0001.0003.
- Snell, C., M. Bevan, and H. Thomson. 2015. Energy research & social science justice, fuel poverty and disabled people in England. Chemical Physics Letters 10:123–32. doi:10.1016/j.erss.2015.07.012.
- Taltavull de la Paz, P., F. Juárez, and P. Monllor. 2016. Fuel poverty: Evidence from housing perspective. http://ieb.ub.edu/wp-content/uploads/2018/04/2016-IEB-WorkingPaper-20.pdf.
- Thomsen, J., and T. A. Eikemo. 2010. Aspects of student housing satisfaction: A quantitative study. Journal of Housing and the Built Environment 25 (3):273–93. doi:10.1007/s10901-010-9188-3.
- Thomson, H., C. Snell, and C. Liddell. 2016. Fuel poverty in the European Union: A concept in need of definition? People, Place and Policy 10 (1):5–24. doi:10.3351/ppp.0010.0001.0002.
- Thomson, H., S. Bouzarovski, and C. Snell. 2017. Rethinking the measurement of energy poverty in Europe: A critical analysis of indicators and data. Indoor and Built Environment 26 (7):879–901. doi:10.1177/1420326X17699260.
- Tirado-Herrero, S. 2017. Energy poverty indicators: A critical review of methods. Indoor and Built Environment 26 (7):1018–31. doi:10.1177/1420326X17718054.
- UNESCO (United Nations Educational, Scientific and Cultural Organization). 2017. Six ways to ensure higher education leaves no one behind. Policy Paper 1–10. doi: 10.1145/2783258.2783348.
- Velux. 2017. Healthy homes barometer, 2017: Buildings and their impact on the health of Europeans, report. Velux Group, Hørsholm, Denmark. Accessed March 11, 2019. http://velcdn.azureedge.net/~/media/com/health/healthy-home-barometer/507505-01 barometer_2017.pdf.
- Wang, C., L. L. Guo, H. K. Wei, Y. F. Zhou, J. J. Tan, H. Q. Sun, S. W. Jiang, and J. Peng. 2019a. Logistic regression analysis of the related factors in discarded semen of boars in Southern China. Theriogenology 131:47–51. doi:10.1016/j.theriogenology.2019.03.012.
- Wang, Z., J. Lv, Y. Tan, M. Guo, Y. Gu, S. Xu, and Y. Zhou. 2019b. Temporospatial variations and Spearman correlation analysis of ozone concentrations to nitrogen dioxide, sulfur dioxide, particulate matters and carbon monoxide in ambient air, China. Atmospheric Pollution Research 10 (4):1203–10. doi:10.1016/j.apr.2019.02.003.
