
 ?Mathematical formulae have been encoded as MathML and are displayed in this HTML version using MathJax in order to improve their display. Uncheck the box to turn MathJax off. This feature requires Javascript. Click on a formula to zoom.
ABSTRACT
The history of concentrating solar power (CSP) is characterized by a boom-bust pattern caused by policy support changes. Following the 2014–2016 bust phase, the combination of Chinese support and several low-cost projects triggered a new boom phase. We investigate the near- to mid-term cost, industry, market and policy outlook for the global CSP sector and show that CSP costs have decreased strongly and approach cost-competitiveness with new conventional generation. Industry has been strengthened through the entry of numerous new companies. However, the project pipeline is thin: no project broke ground in 2019 and only four projects are under construction in 2020. The only remaining large support scheme, in China, has been canceled. Without additional support soon creating a new market, the value chain may collapse and recent cost and technological advances may be undone. If policy support is renewed, however, the global CSP sector is prepared for a bright future.
1. Introduction
Concentrating solar power (CSP) collects the heat of the sun to generate renewable electricity. Through thermal storage it generate electricity after sundown or even days later, for example during adverse weather periods. Because of this ability, CSP is one of the few renewable electricity technologies that can generate fully dispatchable or even fully baseload power at very large scale (Pfenninger et al. Citation2014). Therefore, it may have an important role to play in the decarbonization of power systems around the world, especially as a dispatchable electricity source to balance the fluctuating renewables, such as wind power and solar photovoltaic (PV) (Boie et al. Citation2016; Brand and Blok Citation2015; Du et al. Citation2018; Jorgenson, Denholm, and Mehos Citation2014; Labordena et al. Citation2017; Trieb, Fichter, and Moser Citation2013, Citation2014). Despite this potentially crucial advantage, the global CSP expansion has so far been limited to just a handful of countries, and the current global CSP fleet of 6.1 GW is only about 1% of the current global wind power or solar photovoltaic (PV) fleets (IRENA Citation2020).
The history of CSP is characterized by strong ups and downs in a sequence of boom-bust cycles triggered by changes in national policy support. The first cycle was caused by the increase in support in California in the 1980s, leading to the construction of nine CSP stations of some 350 MW generation capacity. After a few years of activity, decreasing support led to the bankruptcy of the only commercially operating CSP company, Luz, in 1991 – an event that was followed by a 15-year global construction hiatus (Baharoon et al. Citation2015; de la Tour, Glachant, and Ménière Citation2010). The second cycle saw the introduction and cancellation of a feed-in tariff in Spain triggering new projects in 2007–2011 (the last supported project finished in 2013) and a brief surge of support in the US for projects breaking ground 2010–11 (last supported project completed in 2015). During this period, a new, largely European, CSP industry emerged, leading to the construction of about 50 CSP stations in Spain and, later in the cycle, in the US, with Spanish and German companies supplying most of the CSP-specific components (del Rio, Peñasco, and Mir-Artigues Citation2018; Lilliestam et al. Citation2017; Martìn et al. Citation2015). The two lead markets collapsed as support was stopped in both Spain and the US, triggering a second bust phase (2014–16): as only a handful of projects broke ground and ongoing ones were completed, the capacity under construction in 2016 was only 1/3 of that in 2012. During this period, numerous industry actors left (or had already left) the sector. CSP was kept alive as a commercial technology by a handful of projects, mainly in Morocco and South Africa, but accompanying the thinning project pipeline was a cost increase in new projects (Lilliestam et al. Citation2018). During this phase, the outlook for CSP was gloomy.
This changed for the third time in September 2016, as China announced a new feed-in tariff (FIT) to support the construction of 20 stations (1.35 GW) by the end of 2018 as a step toward the 5 GW CSP aim of the 13th Five-Year Plan (Gosens, Binz, and Lema Citation2020; Gosens, Kåberger, and Wang Citation2017). This marks the beginning of the third global boom phase. The construction start of the low-cost 700 MW Noor Energy 1 (Dubai) in 2018 and the PPA awarded to the EDF-led CSP-PV hybrid Noor Midelt 1 (Morocco) in 2019 further increased optimism about the future of CSP (Lilliestam and Pitz-Paal Citation2018; NewEnergyUpdate Citation2019b).
These recent events are important for CSP technology itself and the CSP sector as a whole. However, it is less clear what it means for their future. In this paper, we investigate trends in the global CSP market and their implications for the outlook for CSP, on a national, regional and global scale. We focus especially on developments in the latest boom phase, starting in 2016, including the emergence of the Chinese market and industry.
2. Methods and data
Our analytical framework builds on concepts from different streams of research, and especially two separate but related sets of literature (Bento and Wilson Citation2016; Markard Citation2020): the industrial life-cycle (ILC) and technological innovation systems (TIS) literature. We focus on the formative phase, in which a technology and its industry and innovation system are still immature and need to grow and develop; this is the phase CSP is currently in (Gosens, Binz, and Lema Citation2020).
The ILC literature describes how industries develop from their initial emergence, through an expansive growth phase, to maturity and their eventual decline (Gort and Klepper Citation1982; Perez and Soete Citation1988). In this, the technology is the central analytical focus and firms the key actors (Bento and Wilson Citation2016). In the formative stage, lively competition between companies characterizes the sector’s development, as does uncertainty around the future markets. Firms compete for technological leadership through innovation but also for settling a dominant design, which is eventually (generally in the subsequent growth phase) entrenched by organizational processes, such as standardization (Anderson and Tushman Citation1990; Klepper Citation1997). The formative phase is often characterized by high fluctuation of diverse actors, as the high number of new firms entering the sector may be similar to the number of firms leaving. If a market exists for a longer time and at a size that allows companies to survive and grow, to experiment and innovate, the technology will see both technological learning and increasingly experience economies of scale – the technology improves both in terms of quality and cost. Toward the end of the formative phase, the market may see a consolidation period, in which a few industry actors succeed and survive whereas many may be shaken out of the market, either into bankruptcy or via merger with the larger companies (Anderson and Tushman Citation1990; Agarwal and Bayus Citation2002; Bento and Wilson Citation2016; Gort and Klepper Citation1982; Klepper Citation1997; Peltoniemi Citation2011).
The technological innovation systems literature takes a systemic approach to understanding the rise and success of a technological sector, thereby not focusing on the technology and its performance, but rather on knowledge creation and the flow of knowledge in networks (Carlson and Stankiewicz Citation1991). Successful innovation systems must fulfil a set of functions, including knowledge development and (or through) entrepreneurial experimentation; these ideas exist in the ILC as well: in both bodies of research, innovation and the accumulation of experience are vital drivers of technology improvement, and both the diversity of actors and what they have achieved in the past are important factors (Bento and Wilson Citation2016; Bergek et al. Citation2015, Citation2008; Peltoniemi Citation2011). The TIS focuses strongly on social and political functions attached to and surrounding the technology (Markard Citation2020). Particularly important for immature, still policy support-dependent technologies is the buildup of technological legitimacy, which describes the social standing of a technology – whether it is seen as “appropriate and desirable” (Bergek et al. Citation2008) – which can be expressed in (soft) norms or in (hard) rules and regulations (Hekkert et al. Citation2007; Markard and Truffer Citation2008). A further key function is market formation, the creation of a niche in which the still immature technology can develop, away from market pressures; for energy technologies such as CSP, this is typically a support scheme, without which the developing technology – and its industry – could not survive (del Rio, Peñasco, and Mir-Artigues Citation2018). The feedback between legitimacy and market formation is important and may trigger positive feedback: with a stronger industry and improving technological performance and cost, the legitimacy of a technology increases, as there is a stronger voice pushing for further or continued support and as norms adapt to the specificities of this technology and industry, leading to continued political support, strengthening the industry, and so on. Such feedback may thus make the strong stronger (Bergek et al. Citation2008; Meckling et al. Citation2015). The existence of policy-industry feedbacks however also means that if an industry is struggling or the technology not developing fast enough, support may be reduced – the weak may be further weakened. Achieving positive feedback is thus central to a technology’s success or demise, for its eventual shift into continued development in the growth phase, which may follow the formative stage (Bergek et al. Citation2008; Markard Citation2020)
In our analytical framework, we draw on this evolutionary perspective on market, industry and technology development, theoretical overview above to operationalize outlook with a set of six indicators relating to industry and technology development on the one hand and policy (including technology legitimacy) and markets on the other (see ). The outlook of CSP immediately depends on two factors. First, there needs to be a market for CSP – and as CSP is still immature and uncompetitive without support (del Rio, Peñasco, and Mir-Artigues Citation2018), the presence of a market is equal to the presence of policy support schemes. Second, if there is a market, there must be a strong value chain – an industry capable of delivering and assembling components into well-functioning CSP stations that are incentivized by the support policy. The more and larger markets exist, and the more companies in the value chain, the better is the outlook. Although both are necessary conditions for CSP expansion, however, neither is sufficient on its own to ensure a good outlook for the technology.
Table 1. Indicators used to assess the outlook of CSP on the global level. For all indicators, we create data series 2007-current; all indicators will be assessed on a global level, and some will additionally be analyzed on a national level
For the value chain and its individual companies to survive and thrive, innovate and keep developing the technology, a strong pipeline of ongoing projects under construction is needed. If this is given, the (national) industry base is strengthened with several companies competing on each step of the value chain, which is both good for competition and innovation; learning and technological development are further strengthened if companies stay in the market for a sustained time period, as companies gather experience with component manufacturing and station assembly. The home country of the industry is also important, especially for technology legitimacy: policymakers are more likely to support CSP if there is a substantial or at least growing CSP industry in their country. If CSP is to be a politically attractive candidate for support, the cost and performance of CSP stations must be good and improving: if costs are low and the technology is moving rapidly down the learning curve, its legitimacy increases and policymakers have more incentive to implement support schemes and create a market for CSP.
2.1. Analytical framework: policy and market outlook
2.1.1. Policy support
As CSP is not yet competitive with other new generation, and especially not with operating and depreciated generators, it requires policy support to be economically viable (del Rio, Peñasco, and Mir-Artigues Citation2018). Often, such support has been either FITs, giving a remuneration per kWh generated for a predefined number of years to all projects fulfilling a set of criteria, or power purchase agreements, either resulting from an auction or from negotiation with an off-taker, usually the grid operator. In the past, CSP was dependent on single support schemes – e.g. first in California (1984–1991) and then in Spain (2007–2013Footnote1 ) – and hence its global commercial survival hinged on the longevity of single policy schemes. In California, the devastating impact of this dependence was powerfully demonstrated, as the industry collapsed as the support decreased. Similarly, the comparatively small markets triggered by support in emerging economies could not compensate the loss of the large Spanish (2012/13) and US (2015) markets: the construction rate decreased by 90% between 2014 and 2016, with severe consequences for the industry.
Therefore, the number of active policy schemes actually triggering new projects each year is a metric for the robustness of the global CSP expansion. In this, there is no clear threshold beyond which the number is “sufficient”; for the small CSP industry, we use the simplest metric: a higher number is better. We list FITs that may see the start of construction of new projects in each year; for auctions, we describe the year in which the auction result was announced, as opposed to the year of the tender or break-ground. Importantly, support schemes may differ in their effect, depending on their design: a non-capped FIT, for example, may lead to a long project pipeline, whereas an auction scheme will generally trigger single projects – especially if it does not have a predefined auction schedule – without creating a mentionable project pipeline.
2.1.2. Project pipeline
Any technology must have a healthy industry base to improve, develop and be deployed. For this, there must be a sufficient number of projects under construction, so that companies can continuously work, improve their work processes and innovate – and continuously make business, so that they can make enough profit to stay in the industry. Without ongoing projects declining revenue will lead to declining cash flow and decreasing solvency will force companies out of the CSP sector; with more ongoing projects, the existing value chain can grow and develop, and reap profits from past investments and innovations (Mathews Citation2005). Only if the engineers can be continuously employed will they remain in a company accumulate experience and knowhow – which is central to improving technological performance. This buildup of experience is especially important for complex technologies such as CSP, where learning is not mainly locked into patents and factories (learning by doing, scale in manufacturing) but in the living memory of the engineers who build and operate the stations (learning by using) (Binz et al. Citation2017; Huenteler et al. Citation2016; Quitzow, Huenteler, and Asmussen Citation2017). Following a crisis with weak markets, the sector may be reinvigorated by new firms entering, increasing competition and bringing impulses for innovation (Lee and Malerba Citation2017; Mathews Citation2005), but they will require time to build up experience (unless they manage to hire laid-off experienced engineers from the incumbents). Also such new companies vitally depend on the presence or near-term perspective of a robust project pipeline.
In policy reports, the number of finished projects (or finished capacity) is used to indicate how well an industry is doing (e.g. REN21 (Citation2014), REN21 (Citation2018)). This shows the momentary output but not the continuity of the industry – and it shows dips in this continuity too late, after a decrease in project pipeline has already led to diminished industry activity. Here, we instead measure the project pipeline as the number of projects and capacity under construction in each year. As for the value chain analysis above, there is no threshold for which pipeline length is “enough”; we evaluate the pure numbers, with small numbers indicating that the industry has entered a crunch phase likely associated with industry discontinuity, and high numbers indicating continuity.
2.2. Analytical framework: industry outlook
2.2.1. Active value chain companies and their nationality
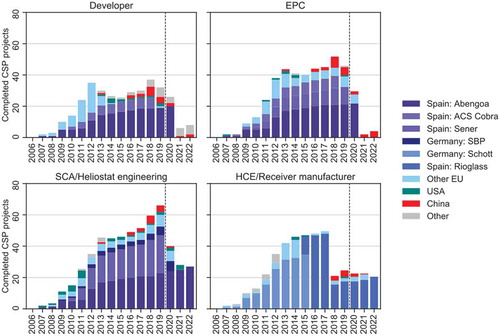
A trivially necessary condition for CSP deployment and the near-term technology outlook is that there is an industry capable of manufacturing and assembling components at the required amounts. For this, a value chain with many actors on each step is beneficial, as diversity is essential for competition among companies – which in turn is beneficial for technological improvement – and it increases the likelihood that output can be scaled up, should the market grow. Further, diversity is the best way to increase resilience of the value chain, making it less dependent on the success (and commercial survival) of single companies (Stirling Citation1999). For both factors, the number of companies active in CSP projects under construction is an important metric. For this, we focus on four CSP-specific value chain steps: project development; engineering, procurement and construction (EPC); collector/heliostat engineering; and receiver manufacturing. Other steps, such as turbine or generator construction, are not CSP-specific and do not critically depend on developments in the CSP sector.
The creation of a new industry and new jobs has historically been a key driver for renewable energy policies around the world (IRENA Citation2018a; Montt et al. Citation2018; Ragwitz et al. Citation2009; Schmidt, Schmid, and Sewerin Citation2019), and for CSP, jobs have been and remain among the most important drivers for support (Caldés-Gómez and Díaz-Vázquez Citation2018; Lilliestam and Patt Citation2015). Hence, jobs and the presence of a strong national CSP industry a key drivers for technology legitimacy, and we assess this as the home country of each company involved in ongoing projects.
2.2.2. Industry experience
As technologies mature and grow, their costs tend to decrease, due to economies of scale and the accumulation of experience. Innovation, both in the market (learning-by-doing and learning-by-networking) and in dedicated R&D efforts, trigger increased performance and/or decreasing costs of a new technology (Bergek et al. Citation2008; Nemet Citation2019; Oerlemans, Meeus, and Boekema Citation2003; Sagar and van der Zwaan Citation2006; Wright Citation1936). Whereas some technologies experience most innovation on the component production stage – mass-produced products, prominently PV – other technologies rely on tacit knowledge and knowhow of not only how to produce components but also on how to assemble them into a well-functioning whole (Huenteler et al. Citation2016). The latter applies for CSP, which is an engineering-heavy, complex technology, with each project being different and tailored to both the environment in which it stands and the requirements of each single offtaker (Binz et al. Citation2017). For complex technologies, the experience of the involved engineers is particularly important, meaning that companies with more experience should be, on average, better capable of producing components and assembling them into more efficiently working stations (Huenteler et al. Citation2016; Quitzow, Huenteler, and Asmussen Citation2017). We measure the experience of the actors involved as the number of operational projects the companies involved in construction each year have been previously involved in. In this, we account for mergers, counting projects of acquired companies for the experience of the new mother company. We focus on the same four CSP-specific value chain steps as in section 2.2.1.
2.3. Analytical framework: cost development
For the outlook of CSP, it is important that it continuously experiences a reduction in cost, driven by a reduction in investment cost and/or improved performance. As other technologies, notably solar PV, sees massive cost progress, CSP risks being left behind – economically, but also politically: low and/or decreasing costs would increase the legitimacy of CSP, making it a more attractive candidate for government support.
In the policy debate and in scientific scenarios, the LCOE is often used as a measure of the economic performance of a technology or scenario (Bogdanov et al. Citation2019), as it is a combined metric of cost (investment and O&M) and performance/efficiency (expected generation). Such an aggregate metric is important, as different technologies improve in different areas: the LCOE of PV, for example, has decreased mainly because of lower investment costs, whereas the LCOE of wind power has decreased mainly because of improved performance and efficiency (IRENA Citation2018b). Further, the LCOE is an easily comprehensible metric in policy debates, reflecting “how much a technology costs”, and it is often used to indicate the point of cost competitiveness with other technologies. Importantly, the LCOE says nothing about the market value and ignores the system importance of dispatchability (Mehos et al. Citation2016; Trieb et al. Citation2015). For these reasons, we use the generation-weighted average LCOE of all finished projects in each year to assess the cost development.
The LCOE is calculated as
where It is the annuity on investment expenditures for year t, assuming the same expenditures each year over the lifetime n (uniform assumption: 25 years), O&Mt are the operation costs (1.5% of the investment cost per year), Et is the expected yearly generation, and r is the weighted cost of capital (WACC, 5%, except where stated otherwise) (Lilliestam et al. Citation2017). These uniform assumptions are necessary to analyze the general cost trend over time, filtering out the financial specificities of single projects. Our LCOEs may thus differ from the support level, for example if the actual financing costs or the support duration are significantly different from our standardized assumptions.
Although these are not project-specific assumptions, we expect the error to be small. For example, the O&M varies between projects, and is typically lower for larger projects – but as O&M costs are a minor contribution to the LCOE of CSP, this is a minor imprecision (IEA Citation2010). Importantly, the WACC may vary very strongly between countries, projects and times – a critical issue, as the WACC is the single largest predictor of the LCOE of renewable power projects. Nevertheless, as there is no comprehensive, systematic overview of actual WACCs for CSP, and as all CSP projects are built in relatively low-risk support schemes – either a feed-in tariff or a long-term power purchase agreement – we assume a uniform, relatively low WACC. Our assumption of 5% WACC is similar to other CSP studies, such as the SunShot studies (DOE Citation2012; Mehos et al. Citation2016) and the Trans-CSP studies (Trieb Citation2005, Citation2006).
2.4. Data
We base our analysis on data for all CSP projects operational and under construction on 1 January 2020, building on previous versions of the csp.guru dataset. In addition, we gathered and analyzed data for all CSP support schemes triggering new projects since 2007. All data is available on www.csp.guru, including a comprehensive description of all changes compared to the previous data version. The individual sources for all data points are included in the online dataset.
The project dataset holds information for all CSP stations ≥10 MW in operation (1984–2018) and under construction on 1 January 2020, regarding technical (e.g. technology, capacity, storage), economic (e.g. investment costs, expected generation, support, concessional funding), and industrial aspects (e.g. EPC, developer, component suppliers). All data are directly or indirectly taken from companies involved in each project. All economic data are collected in the national currency of each project, converted to USD with the average exchange rate of each year and then deflated to USD2018 with the US GDP deflator provided by the World Bank. We only include projects which are completed or under construction, while omitting all projects under development from the analysis, as it is unclear whether such projects will actually be realized. Hence, we exclude all Chinese stations supported by the FIT but for which construction had not yet started on 1 January 2020, and analyze only 12 Chinese projects, including one under construction but outside the FIT scheme. For the LCOE calculation, we exclude three Chinese pilot stations as they are not commercial stations and their costs are very uncertain, but include them in the industry analyzes as the main function of pilot projects is for the involved companies to test their technology and gain experience. In all analyses, we focus on solar-only stations and exclude ISCC/hybrid CSP stations for which the solar component is an add-on to a fossil-fueled power station. In a few cases, especially for a handful of Spanish stations, we do not know exactly when they broke ground. For these projects, we estimate the construction start year by subtracting the average construction duration (2 years) of all other Spanish projects from the year in which they became operational.
The policy data describes FITs and auctions that led to the start of construction of CSP stations by or before 1 January 2020. We base our data on the Global Renewable Power Support Dataset (Hafner and Lilliestam Citation2019) and complete it with CSP support scheme information on a project-by-project basis. The dataset is complete except for the US support: we know that they were supported by various schemes, such as tax credits and investment support (Mir-Artigues, del Río, and Caldés Citation2019), and that each station has a unique PPA, but we do not know how and when the PPAs were defined. Hence, the US PPAs are not included.
Auctions are shown in the year in which the auction result was announced, and not in the year the auction was held; again, we only include auction results for completed projects or such under construction on 1 January 2020. Hence, the Midelt I auction in Morocco is not included in our figures, as the outcome was announced in 2019, but construction had not started in January 2020; the Midelt II auction closed in 2019, but no outcome was announced as of April 2020.
Feed-in tariffs are included for the years they were active and in principle open to new projects. Hence, we list the Spanish FIT as closed in 2012, which was the last year in which it was in principle open to new projects. Similarly, we indicate the Chinese FIT as active until 2021, as the projects included in the preselection list will receive this support if they are finished by December 2021 (barring any future policy changes). Hence, new Chinese projects may start construction and receive support, if they have not started already and are among the 20 projects on the FIT list.
3. Results
3.1. Policy and market outlook: weak and weakening
The policy and market outlook for CSP is weak and highly uncertain. Currently, only China and Morocco have active CSP support schemes; according to current plans, the Chinese support will end in 2021. No further support schemes have been decided and announced, despite a number of declarations of intent to do so. In addition, the project pipeline is thinning out rapidly: whereas 2018 saw more projects under construction than in a long time, no new project broke ground in 2019, and only a handful of projects remain under construction in 2020.
3.1.1. Markets: only two active CSP policy support schemes
The policy support situation for the global CSP sector has been and remains very problematic. Historically, active CSP support triggering new projects has been present in only 1–3 countries in any given year (, upper panel). This situation is, if anything, worse today than before, with only two support schemes (the Chinese FIT, Moroccan auctions) still active. All other announced plans are projects under development (e.g. Minos in Greece; Likana in Chile) for which the financing is entirely unclear: currently, these projects would not receive support, and their realization highly uncertain. In early 2020, the Chinese government decided to phase out its support scheme by 2021: it will only support already selected projects and only if they are connected to the grid before the end of 2021, but the rules and definitive remuneration are not yet decided (Azure Citation2020; Energy Iceberg Citation2020; Ministry of Finance Citation2020). The Moroccan scheme, while remarkable for an emerging country such as Morocco, is too small and unpredictable to sustain the global CSP industry on its own. As of April 2020, no further CSP support scheme is open to new projects, and no support scheme has a predictable amount of capacity to be auctioned in the next few years.
Figure 1. Policies triggering new CSP projects (upper panel) and CSP capacity under construction per year (lower panel), 2006–2022. Upper panel: only support that triggered construction is displayed; hence, Morocco has no entry for 2019 as Midelt 1 has not broken ground (in April 2020). The US PPA deals are not included. Lower panel: includes stations under construction in January 2020 and scheduled for completion before the end of 2022. Source: csp.guru (Citation2020)
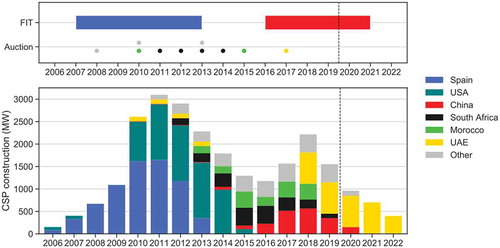
The Chinese FIT is closed to newly developed projects and is available only to a set of preselected commercial-scale ”demonstration projects”, so that no ”new” projects received support in China since 2016. In January 2020, 10 projects included in the FIT had not yet started construction, and would receive support if they are operational before the end of 2021.
In Morocco, the auction scheme is still active, with the 2018 call for Midelt I awarded – with a PPA of 0.071 USD/kWh for the CSP-PV hybrid (NewEnergyUpdate Citation2019a) – and a call for bids for Midelt II was issued in mid-2019 (Masen Citation2019). Whether, how or when Morocco will include CSP in further auctions is unknown. Spain and Italy have published plans to add another 5 GW and 800 MW of CSP by 2030, but have yet to define concrete support schemes. As both countries face political uncertainty, and even more so in the wake of the Covid-19 crisis, the prospects of new CSP support there is uncertain (Lilliestam et al. Citation2019b). New support in other markets with existing CSP stations or projects still under construction like South Africa, Israel or India, appear unlikely, but possible: there, CSP is at least on the political agenda. Several countries have announced intentions to support CSP, including several Gulf countries, but no concrete measures have been decided or implemented. For the first time in almost 15 years, the global CSP sector of 2020 may face a near-term future without a single active support scheme, and thus without any market.
3.1.2. The project pipeline is thinning out
Both the number of projects and capacity under construction has increased since the 2014–2016 bust phase (), with 19 projects (2200 MW) under construction during 2018. In comparison with other renewables, like wind power or PV, this is very little, but it represents a strong increase for CSP, back to a pipeline which is comparable in terms of capacity to 2012/13. Since then, however, the situation has strongly deteriorated: in 2018, only three projects broke ground in two countries (UAE, China), and no new project broke ground in 2019. Several projects under construction outside China in 2018–19 were remnants from old policy schemes (e.g. the Israeli Ashalim stations) or had been strongly delayed by project-specific problems (e.g. Cerro Dominador, Chile, affected by problems connected to Abengoa’s near-bankruptcy in 2016) (REN21 Citation2019). The global market remains highly dependent on single policies (mainly the Chinese FIT) but also on single projects (especially Noor Energy 1). Without the Chinese support and Noor Energy 1, project pipeline would have been virtually non-existent already in 2018.
Figure 2. Number of projects breaking ground (left) and under construction (right) in each year, 2006–2019 (now operational) and 2020–2022 (under construction on 1 January 2020, scheduled for completion 2020–2022). Projects are counted in each year in which they were under construction (construction start-completion). Noor Energy 1 is indicated as ongoing until the last part is scheduled to be finished in 2022, although the first parts should be completed in 2021. Source: csp.guru (Citation2020)
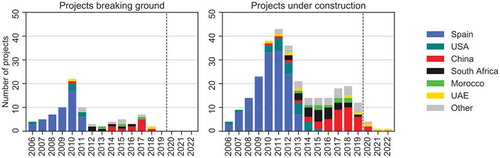
Only 5 projects of 960 MW capacity remained under construction in January 2020, and almost ¾ of that capacity is Noor Energy 1. Hence, the project pipeline is disappearing and the entire market of 2020 consists of Noor Energy 1, a handful of delayed Chinese projects and Cerro Dominador. Possible additions in 2020 are Midelt I and/or II, depending on if and when construction starts, and South African Redstone, for which financing was settled in 2019 after years of delay. The sheer size of Noor Energy 1 will keep the involved companies afloat for some years, but for companies not included in that project, hard times are coming. Without further auctions and/or new support schemes during 2020, their commercial survival is threatened. The current situation is new to the CSP sector: although the project pipeline disappeared in single countries in the past, there were always new projects somewhere else. Today, despite all the positive CSP news, a near-term future without a single new project anywhere in the world is conceivable.
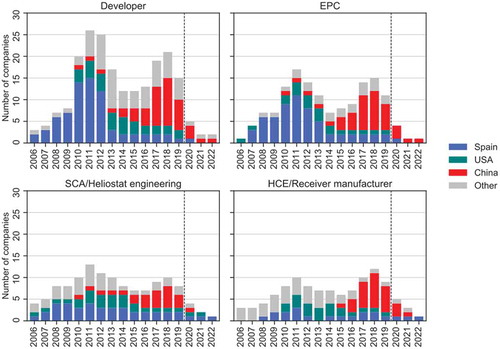
3.2. Industry outlook: stronger than it has been in a long time
The global CSP industry is stronger than in many years, following the entry of numerous new companies in the last 3 years (). By far most new entrants are Chinese and active only in China, triggered by the FIT programme there, and bring little or no experience from previous successfully concluded commercial-scale projects (Gosens, Binz, and Lema Citation2020). Because the global policy and market outlook is very weak, there is trouble for the new industry on the horizon. If, however, new markets arise or old are sustained, triggered by new support policies, the industry is well positioned to keep growing and further decrease the technology cost.
Figure 3. Number of active companies per segment (developer, EPC, collector (IP owner) and receiver (manufacturing), respectively) in CSP projects under construction 2006–2019 (now operational) and 2020–2022 (under construction on 1 January 2020, scheduled for completion 2020–2022). Projects are counted in each year in which they were/are scheduled to be under construction (construction start-completion). Source: csp.guru (Citation2020)
3.2.1. Chinese companies strengthen the global CSP value chain
In terms of value chain diversity, CSP has bounced back since the crunch years 2014–16. The number of different companies active in four key CSP-specific value chain segments (developers, EPCs, and suppliers of collector technology and receivers) is comparable to the situation during the late Spanish expansion in 2012 (). This is an important improvement compared to the last few years and an indication that the value chain is increasing its resilience: today, the value chain is not as dependent on single companies as it was a few years ago (Lilliestam et al. Citation2018), and hence it is less likely to collapse if one or a few single companies fail.
The rise of Chinese companies is driving this development, whereas the number of active “old” European and American companies has continuously decreased since 2011, due to mergers, take-overs and market exits (incl. bankruptcies). The US industry has practically disappeared: there was only one CSP-specific company involved in active projects in 2020, whereas most previously strong US CSP companies appear to no longer exist (Deign Citation2020). The entire global industry diversity increase since 2014 consists of “new” Chinese companies, in all segments. Just observed in other industries (Lee and Malerba Citation2017; Mathews Citation2005), we observe that crises, when incumbent companies struggle, allow new entrants to enter the CSP market: we see this both the rise of the Spanish industry in 2007, after a long crunch phase, and the emergence of the Chinese industry in 2016, as the bust phase afflicted the Spanish incumbents following the cancellation of support in Spain.
In particular the EPC segment, where suppliers and components are selected, is of critical importance for the whole future CSP sector, and here Chinese companies are positioning themselves. Because CSP is a complex technology, its performance depends at least as much on the way components work together as a whole as it does on the behavior of each component, and the knowledge of how to assemble a station – work led by the EPC – is the key to competitiveness.
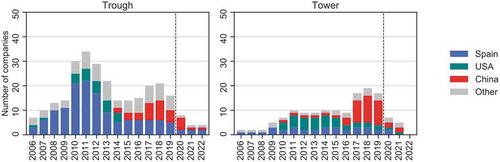
The Chinese support programme was set up to let domestic companies test concepts and ideas in a very diverse set of different station designs, sometimes with but often without foreign collaborators. This strategy has been successful, especially for the tower segment, with numerous Chinese firms involved in completed and still ongoing projects (). Over the last 5 years, a national CSP innovation system has developed in China, to a large extent in parallel, with few overlaps, to the European CSP industry: the Chinese stations are to the largest extent supplied by Chinese companies, whereas the non-Chinese projects are supplied by non-Chinese companies (Gosens, Binz, and Lema Citation2020; Lilliestam, Ollier, and Pfenninger Citation2019a).
Figure 4. Number of active companies in the four value chain segments in the trough (left) and tower (right) markets, 2006–2019 (now operational) 2020–2022 (under construction on 1 January 2020, scheduled for completion 2020–2022). Projects are counted in each year in which they were/are scheduled to be under construction (construction start-completion). Source: csp.guru (Citation2020)
3.2.2. Industry experience concentrated in handful of Spanish companies
Looking at the experience of the involved firms, the rise of the Chinese industry is put into perspective. Across all four investigated value chain segments, European companies are the most experienced ones (), indicating that they are the ones with the vitally important tacit knowledge of how to manufacture and assemble components into an efficiently working CSP station. Of these experienced European companies, very few are involved in ongoing projects, indicating that some of this vital know-how may leave the CSP sector, absent new projects.
Figure 5. Experience of national industries as the sum of previously completed projects of companies active in projects under construction, 2006–2022. Note: the HCE graph includes the acquisition of Solel, by Siemens, and Rioglass’ acquisition of the receiver businesses of Siemens and Schott. If multiple companies are involved in the same value chain step of one project, the “experience point” is split equally between them. Source: csp.guru (Citation2020)
European companies are the most experienced, as they have been active the longest – the Spanish expansion 2007–2013 was carried out almost exclusively by Europeans. In addition, European companies are, with a few exceptions, the only companies active in multiple countries, bringing experience with different markets and geographical contexts. Of these companies, a handful of companies bring almost all experience. In particular Abengoa brings very large experience as developer, EPC and collector supplier, and the bulk of the global experience in these segments has been gathered by the Spanish firms Abengoa, Sener, and Cobra. In the receiver market, Rioglass – following the acquisition of the receiver businesses of the German firms Schott and Siemens – holds practically all accumulated experience. As Noor Energy 1 – EPCed by Shanghai Electric – includes some of these experienced companies, prominently Abengoa and Rioglass, the drop in experience in the near-term market after 2019 appears less dramatic, masking the potential impact of most other highly experienced companies currently standing without projects.
Among the new Chinese entrants, by far most companies are only involved in single projects and are by definition inexperienced: they are currently in the process of gathering first market experiences with their products and processes. Some companies, such as Shouhang and Supcon, have taken over development of several stalled projects and may emerge as new “national champions”, should the projects be restarted and successfully concluded; currently, none of these projects is under construction. A few firms, including Shanghai Electric, are involved in projects abroad, including finished, currently operational ones. If these firms continue finding a market, at home or abroad, they are well-positioned to survive and continue developing the technology, as they bring documented experience from completed projects and at least a near-term project pipeline.
3.3. Cost outlook: cost of CSP approaching competitiveness with conventional sources
The costs of new CSP stations have decreased rapidly in the last years, and after a short-term cost increase in 2015, the average LCOE of new stations has decreased to about 0.15 USD/kWh in 2018/2019 – drop of about 0.08 USD/kWh in 5 years (). The projects under construction in 2020 continue this trend, with the Noor Energy 1 project setting the medium-term benchmark with its LCOE of just below 0.10 USD/kWh.Footnote2 Thus, CSP continues the past trend toward cost competitiveness with other renewables, and may soon compete with new fossil fuel power stations (IRENA Citation2018b).
Figure 6. Levelised cost of electricity of the 82 solar-only commercial CSP stations for which we have both cost and expected generation data, 2006–2019 (now operational) and 2020–2022 (under construction in January 2020, scheduled completion 2020–2022). The different parts of Noor Energy 1 are displayed with their individual finalization dates in 2021 and 2022, but with a uniform cost for the entire complex. The average LCOE is the generation-weighted average of all stations (expected to) start operating in each year. Source: csp.guru (Citation2020)
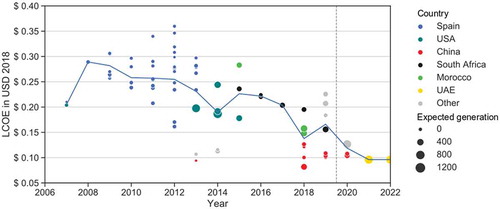
In particular the Chinese projects are responsible for this decreasing cost trend, despite their comparatively high support remuneration of 0.17 USD/kWh: all completed Chinese projects are below the global average cost, whereas all non-Chinese projects are above the average. The strong Chinese presence in the construction of Noor Energy 1 is very likely a strong contribution to its low costs, both in terms of providing comparatively low-cost Chinese components and by helping to reduce the financing costs, for example through state bank loans (Gosens, Binz, and Lema Citation2020).
Nevertheless, it is striking that the Chinese projects are so much cheaper than all other projects, especially given the much weaker solar resource in China compared to the locations of the non-Chinese projects (Lilliestam, Ollier, and Pfenninger Citation2019a). Quite possibly, some projects state lower-than-actual costs in order to be included in the support programme, so as to gather experience and get references from completed projects, allowing them to lead or participate in CSP projects abroad. This hypothesis is further supported by the first-of-a-kind nature of all below-average cost projects: no Chinese developer and EPC had previously completed a commercial CSP station when starting construction, meaning that they did not have the necessary experience and reference projects that are important for entering the international market.
With this strong cost decrease, the economic outlook for CSP is dramatically different than a few years ago: CSP is rapidly becoming a true option also in economic terms for dispatchable renewable power in sun-belt countries around the world. Today, CSP support must not be very expensive, making it an increasingly attractive option for policymakers: this improves its legitimacy, strengthens the political case for CSP and improves the attractiveness of new support schemes.
4. Discussion
We show that the near- to mid-term outlook for CSP is very uncertain: there are several positive developments concerning the global value chain and cost development. The market and policy outlook is bleak, however, with the very real risk of a complete loss of all markets for CSP (). As in the past, the entire global market hinges on single policy schemes and single projects, making the entire outlook dependent on singular events, such as the failure of one project (Noor Energy 1 makes up almost ¾ of the capacity under construction in 2020). The most important risk, that of support scheme cancellation, materialized in early 2020, as the Chinese government decided to phase out national support by 2021. At the time of writing in April 2020, there is no large, predictable market for CSP anywhere in the world, for the first time since 2006.
Table 2. Summary of key results and their effect on the outlook
Over the last years, the industry value chain has been strengthened, with numerous new entrants, decreasing costs and technology improvements. Every analyzed step of the CSP value chain is more diverse and hence more resilient today than it was five years ago, despite the weakening of European industry and disappearance of almost all US companies. Today, the global value chain would likely withstand the exit of single firms, even of a large, experienced company. The large number of active companies indicates that the value chain can be rapidly scaled up, should the demand arise; increased global competition is a likely driver of continued innovation, technological improvement and cost reductions.
Indeed, the cost development remains strong: the average cost of projects under construction is around 0.10 USD/kWh, driven by the low cost of the Chinese projects and the Dubaian Noor Energy 1 project. If this trend continues, CSP may soon compete on a cost basis not only with other dispatchable renewables, but also with fossil power. This strong cost trend may prove critical for technology legitimacy, making CSP attractive to policymakers: today, unlike 5 years ago, a reasonably priced dispatchable solar power is feasible, as shown by the 0.07 USD/kWh PPAs of Noor Energy 1 (Dubai) and, as awarded in mid-2019, the CSP-PV hybrid Noor Midelt 1 (Morocco). If ongoing projects can indeed reliably deliver power at the stated low costs, the chance of new support and new markets increases – which will in turn may allow for a diverse and flourishing industry, with multiple companies competing for market shares.
Without a future market, however, the achievements of the last years may be lost: a diverse and resilient value chain helps if the sector enters a crunch, but it does not help if the market disappears entirely due no support and no new projects. This risk is in severe danger of materializing: as of January 2020, only four projects remain under construction, and no new CSP project has broken ground since 2018. Hence, the CSP project pipeline is, once again, disappearing, and there is no near-term market for the re-strengthened global CSP industry. If no new support schemes are implemented soon, the CSP market will likely collapse and the industry and CSP innovation systems with it. In the absence of new projects, learning will slow down or stop and “unlearning” – especially from experienced engineers and companies leaving the sector – may increase CSP costs in the future, should markets reappear.
Currently, in April 2020, it seems certain that the Chinese market will disappear as national support there is canceled, and there is no evidence suggesting that new support is coming anywhere in the world. Beyond the Midelt auctions of 2018 (Midelt I, awarded) and 2019 (Midelt II, not yet awarded), the future of the Moroccan support is unknown. Several countries, including Spain, have announced intentions for CSP support, but no country has decided and announced new CSP support.
Consequently, the future of CSP entirely depends on the actions of policy-makers in the handful of countries that have CSP on their agenda. There are several recent developments that may have increased the legitimacy and political attractiveness of CSP support to policymakers in sun-rich countries. First of all, the costs of CSP have decreased strongly, with recent projects awarded PPAs below USD 0.10 per kWh. Further, the rising shares of fluctuating solar PV and wind power will increase the strain on power systems, increasing the need for dispatchable power – and with tightening climate targets, that dispatchable power must be carbon-neutral. Operational projects in several countries, including Spain, China, Morocco, and South Africa, have shown that CSP is capable of doing this, with several large-storage stations showing a solid operational record. Currently, CSP is the least-cost technology for dispatchable power with >4 hours of storage, whereas PV equipped with batteries is cheaper for short durations; even with strong learning effects in battery technologies, the cost advantage of CSP for long storage durations is likely to remain (Schöniger et al. Citationthis issue). Today, other than 5 or 10 years ago, CSP is becoming a cost-attractive technology, offering a system service – dispatchable renewable power – that is becoming increasingly needed and valuable.
In addition to this, the policy narrative of CSP remains closely connected to jobs and industry creation. As the bulk of the CSP industry is either Spanish or Chinese, these two countries seem the most likely candidates for ambitious support schemes: in these countries, CSP support would combine renewables and climate policy with industrial policy, increasing the technological legitimacy. In both countries, a policy allowing for a reliable and long project pipeline would allow value chain investments, leading to new jobs and increased industry capacities. Today, CSP support should be more attractive to Chinese and Spanish policymakers than in the past, as it is cheaper, more needed, and the industries already exist. In China, the decision was made differently, for reasons unknown to us: possibly, CSP was collateral damage when the overall Chinese policy regime for renewables support became untenable. Spain remains the main contender for new CSP support, and we must wait and see what the Spanish decision is – and whether Spain decides to funnel parts of its upcoming Corona recovery programme to rebuilding its CSP industry, or rather to more traditional industries.
If governments decide to implement CSP support, the key issue will be to trigger numerous projects to maintain and expand value chains. Such support policies could include the introduction of a FIT without a prequalification to allow a larger number of different projects. In Europe, to comply with the European state-aid guidelines, an auction scheme with a pre-defined schedule for multiple projects per year over several years would fulfil the same function. Auctions with the main aim to minimize support cost, as is the current global trend, are not necessarily the most useful instrument if the aim is also to maintain and develop the CSP industry (del Río and Mir-Artigues Citation2019): in order to achieve a long and diverse project pipeline and a diverse and thriving industry, longevity, predictability and sufficient profit margins are critical aspects of a support policy.
5. Conclusions and policy implications
The outlook for CSP is very uncertain and entirely depends on action taken by national policymakers in sunbelt countries and especially in the key markets of China and Spain. The global CSP industry is stronger and more diverse than it has been for a long time, following the creation of a Chinese CSP industry. This new industry, however, is so far almost exclusively focused on the Chinese domestic CSP market – and that market is breaking away, if the national support is phased out as decided in 2021. The incumbent industry, mainly from Europe, remains active, but consolidation and the latest bust phase have greatly reduced the number of active, experienced companies. The costs of CSP are decreasing rapidly, with the average LCOE of new projects moving toward USD 0.10 per kWh. The efforts of the last years have paid off, and dispatchable renewable power from CSP is now approaching cost competitiveness, even with new fossil fuel power. The industry and cost outlooks for CSP are bright.
However, the market and policy outlook is troublesome, and if no further large-scale support scheme is implemented soon – within months, rather than years – the global CSP sector will enter a new bust phase, from which it may be difficult to recover. Because the bulk of the global CSP industry is either Chinese or Spanish, these two countries seem natural candidates for revived policy support. Although both countries have CSP in their medium-term policy targets, China has decided to stop supporting CSP and Spain has not decided any concrete CSP policy yet. Hence, if policymakers are interested in keeping CSP as an option for dispatchable renewable power and keeping their domestic CSP industries alive and competitive in the global market, rapid action is necessary. Especially the recent rapid cost decrease should have increased technology legitimacy and hence the attractiveness of CSP for policymakers in sunbelt countries.
Already the implementation of one or two support schemes in the short term, and a handful more in the mid-term, could suffice to turn this bleak outlook into a bright one. If new support schemes are implemented, the CSP value chain is today better suited than in a long time to expand and further develop the technology, continue to push down costs, and make CSP a global option for affordable dispatchable renewable electricity.
Additional information
Funding
Notes
1 The FIT was canceled in 2012, but the last supported projects, under construction in 2012, were completed in 2013.
2 The PPA for Noor Energy 1 is lower than our estimated LCOE – 0.073 USD/kWh – because the PPA is paid for 35 years whereas we use a uniform 25 years lifetime for all LCOE estimates; it most likely has very preferential financing conditions, making its financing costs lower than the uniform 5% cost of capital we assume for all projects (Lilliestam and Pitz-Paal Citation2018). It also appears that the PPA has been changed to now also include a PV component.
References
- Agarwal, R., and B. L. Bayus. 2002. The market evolution and sales takeoff of product innovations. Management Science 48 (8):1024–41. doi:10.1287/mnsc.48.8.1024.167.
- Anderson, P., and M. Tushman. 1990. Technological discontinuities and dominant designs: A cyclical model of technological change. Administrative Science Quarterly 35 (4):604–33. doi:10.2307/2393511.
- Azure. 2020. New incremental offshore wind power proejcts will be excluded from the central REDF subsidy. Accessed April 18, 2020. http://www.azure-international.com/index.php/china-energy-transition-updates/renewable/breaking-news-new-incremental-offshore-wind-power-projects-will-be-excluded-from-the-central-redf-subsidy.
- Baharoon, D. A., H. A. Rahman, W. Z. W. Omar, and S. O. Fadhl. 2015. Historical development of concentrating solar power technologies to generate clean electricity efficiently - A review. Renewable and Sustainable Energy Reviews 41:996–1027.
- Bento, N., and C. Wilson. 2016. Measuring the duration of formative phases for energy technologies. Environmental Innovation and Societal Transitions 21:95–112. doi:10.1016/j.eist.2016.04.004.
- Bergek, A., Hekkert, M., Jacobsson, J. 2008. Functions in innovation systems: A framework for analysing energy system dynamics and identifying goals for system-building activities by entreprenuers and policy makers. In Innovation for a low carbon economy: Economic, institutional and management approaches, ed. T. Foxon, J. Köhler, and C. Oughton. London: Edward Elgar.
- Bergek, A., M. Hekkert, S. Jacobson, J. Markard, B. Sandén, and B. Truffer. 2015. Technological innovation systems in contexts: Conceptualizing contextual structures and interaction dynamics. Environmental Innovation and Societal Transitions 16:51–64. doi:10.1016/j.eist.2015.07.003.
- Bergek, A., S. Jacobsson, B. Carlsson, S. Lindmark, and A. Rickne. 2008. Analyzing the functional dynamics of technological innovation systems: A scheme of analysis. Research Policy 37:407–29. doi:10.1016/j.respol.2007.12.003.
- Binz, C., J. Gosens, T. Hansen, and U. Elmer Hansen. 2017. Toward technology-sensitive catching-up policies: Insights from renewable energy in China. World Development 96:418–37. doi:10.1016/j.worlddev.2017.03.027.
- Bogdanov, D., J. Farfan, K. Sadovskaia, A. Aghahosseini, M. Child, A. Gulagi, A. Oyewo, L. Barbosa, and C. Breyer. 2019. Radical transformation pathway towards sustainable electricity via evolutionary steps. Nature Communications 10:1077. doi:10.1038/s41467-019-08855-1.
- Boie, I., C. Kost, S. Bohn, M. Agsten, P. Bretschneider, O. Snigovyi, M. Pudlik, M. Ragwitz, T. Schlegl, and D. Westermann. 2016. Opportunities and challenges of high renewable energy deployment and electricity exchange for North Africa and Europe - Scenarios for power sector and transmission infrastructrue in 2030 and 2050. Renewable Energy 87:130–44. doi:10.1016/j.renene.2015.10.008.
- Brand, B., and K. Blok. 2015. Renewable energy perspectives for the North African electricity systems: A comparative analysis of model-based scenario studies. Energy Strategy Reviews 6:1–11. doi:10.1016/j.esr.2014.11.002.
- Caldés-Gómez, N., and A. Díaz-Vázquez. 2018. Promoting solar electricity exports from southern to central and northern European countries. Luxembourg: Joint Research Center of the European Commission (JRC).
- Carlson, B., and R. Stankiewicz. 1991. On the nature, function and composition of technological systems. Journal of Evolutionary Economics 1:93–118. doi:10.1007/BF01224915.
- csp.guru. 2017. CSP guru ( Version: August 2016). Zürich, Johan Lilliestam: ETH Zürich.
- csp.guru. 2018. CSP guru ( Version: May 2018). Zürich, Johan Lilliestam: ETH Zürich.
- csp.guru. 2019. CSP guru ( Version: January 2019). Potsdam, Richard Thonig, Johan Lilliestam: Institute for Advanced Sustainability Studies (IASS).
- csp.guru. 2020. CSP guru ( Version: January 2020). Potsdam, Richard Thonig, Johan Lilliestam: Institute for Advanced Sustainability Studies (IASS).
- de la Tour, A., M. Glachant, and Y. Ménière. 2010. Economic analysis of the CSP industry. Paris: CERNA, Mines ParisTech.
- Deign, J. 2020. America’s concentrated solar power companies have all but disappeared. Accessed April 18, 2020. https://www.greentechmedia.com/articles/read/americas-concentrated-solar-power-companies-have-all-but-disappeared.
- del Río, P., and P. Mir-Artigues. 2019. Designing auctions for concentrating solar power. Energy for Sustainable Development 48:67–81. doi:10.1016/j.esd.2018.10.005.
- del Rio, P., C. Peñasco, and P. Mir-Artigues. 2018. An overview of drivers and barriers to concentrated solar power in the European Union. Renewable and Sustainable Energy Reviews 81:1019–29. doi:10.1016/j.rser.2017.06.038.
- DOE. 2012. SunShot vision study. Washington, D.C.: US Department of Energy (DOE).
- Du, E., N. Zhang, B.-M. Hodge, C. Kang, B. Kroposki, and Q. Xia. 2018. Economic justification of concentrating solar power in high renewable energy penetrated power systems. Applied Energy 222:649–61. doi:10.1016/j.apenergy.2018.03.161.
- Energy Iceberg. 2020. China’s renewable power price and subsity: “new” design in 2020? Accessed April 18, 2020. https://energyiceberg.com/china-renewable-power-price/.
- Gort, M., and S. Klepper. 1982. Time paths in the diffusion of product innovations. The Economic Journal 92 (367):630–53. doi:10.2307/2232554.
- Gosens, J., C. Binz, and R. Lema. 2020. China’s role in the next phase of the energy transition: Contributions to global niche formation in the concentrated solar power sector. Environmental Innovation and Societal Transitions 34:61–75. doi:10.1016/j.eist.2019.12.004.
- Gosens, J., T. Kåberger, and Y. Wang. 2017. China’s next renewable energy revolution: Goals and mechanisms in the 13th five year plan for energy. Energy Science & Engineering 5 (3):141–55. doi:10.1002/ese3.161.
- Hafner, S., and J. Lilliestam. 2019. The global renewable power support policy dataset ( Version: October 2017. J. Lilliestam). Potsdam, Institute for Advanced Sustainability Studies (IASS).
- Hekkert, M., R. Suurs, S. Negro, S. Kuhlmann, and R. Smits. 2007. Functions of innovation systems: A new approach for analysing technological change. Technological Forecasting and Social Change 74:413–32. doi:10.1016/j.techfore.2006.03.002.
- Huenteler, J., T. S. Schmidt, J. Ossenbrink, and V. Hoffmann. 2016. Technology life-cycles in the energy sector - technological characteristics and the role of deployment for innovation. Technological Forecasting and Social Change 104:102–21. doi:10.1016/j.techfore.2015.09.022.
- IEA. 2010. Technology roadmap. Concentrating solar power. Paris: International Energy Agency (IEA).
- IRENA. 2018a. Renewable energy and jobs. Annual review 2018. Abu Dhabi: International Renewable Energy Agency (IRENA).
- IRENA. 2018b. Renewable power generation costs in 2017. Abu Dhabi: International Renewable Energy Agency.
- IRENA. 2020. Renewable energy statistics 2019. Abu Dhabi: International Renewable Energy Agency (IRENA).
- Jorgenson, J., P. Denholm, and M. Mehos. 2014. Estimating the value of utility-scale solar technologies in California under a 40% renewable portfolio standard. Golden: NREL.
- Klepper, S. 1997. Industry life cycles. Industrial and Corporate Change 6 (1):145–81. doi:10.1093/icc/6.1.145.
- Labordena, M., A. Patt, M. Bazilian, M. Howells, and J. Lilliestam. 2017. Impact of political and economic barriers for concentrating solar power in sub-Saharan Africa. Energy Policy 102:52–72. doi:10.1016/j.enpol.2016.12.008.
- Lee, K., and F. Malerba. 2017. Catch-up cycles and changes in industrial leadership: Windows of opportunity and responses of firms and countries in the evolution of sectoral systems. Research Policy 46 (2):338–51. doi:10.1016/j.respol.2016.09.006.
- Lilliestam, J., T. Barradi, N. Caldés, M. Gomez, S. Hanger, J. Kern, N. Komendantova, M. Mehos, W. M. Hong, Z. Wang, et al. 2018. Policies to keep and expand the option of concentrating solar power for dispatchable renewable electricity. Energy Policy 116:193–97. doi:10.1016/j.enpol.2018.02.014.
- Lilliestam, J., M. Labordena, A. Patt, and S. Pfenninger. 2017. Empirically observed learning rates for concentrating solar power and their responses to regime change. Nature Energy 2:17094. doi:10.1038/nenergy.2017.94.
- Lilliestam, J., L. Ollier, and S. Pfenninger. 2019a. The dragon awakens: Will China save or conquer concentrating solar power? AIP conference Proceedings: SolarPACES 2018, Casablanca, Morocco, 130006.
- Lilliestam, J., and A. Patt. 2015. Barriers, risks and policies for renewables in the Gulf States. Energies 2015 (8):8263–85. doi:10.3390/en8088263.
- Lilliestam, J., and R. Pitz-Paal. 2018. Concentrating solar power for less than USD 0.07 per kWh: Finally the breakthrough? Renewable Energy Focus 26:17–21. doi:10.1016/j.ref.2018.06.002.
- Lilliestam, J., R. Thonig, L. Späth, N. Caldés, Y. Lechón, P. del Río, C. Kiefer, G. Escribano, and L. Lázaro Touza. 2019b. Policy pathways for the energy transition in Europe and selected European countries. Update September 2019. MUSTEC project deliverable 7.3. Potsdam: Institute for Advanced Sustainability Studies (IASS).
- Markard, J. 2020. The life cycle of technological innovation systems. Technological Forecasting and Social Change 153 (April 2020):119407. doi:10.1016/j.techfore.2018.07.045.
- Markard, J., and B. Truffer. 2008. Technological innovation systems and the multi-level perspective: Towards and integrated framework. Research Policy 37:596–615. doi:10.1016/j.respol.2008.01.004.
- Martìn, H., J. de la Hoz, G. Velasco, M. Castilla, and J. L. Garcìa de Vicuña. 2015. Promotion of concentrating solar power (CSP) in Spain: Performance analysis of the period 1998–2013. Renewable and Sustainable Energy Reviews 50:1052–68. doi:10.1016/j.rser.2015.05.062.
- Masen. 2019. Masen launches Noor Midelt II solar farm tender process. Accessed October 6, 2019. http://www.masen.ma/en/masen-news/masen-launches-noor-midelt-ii-solar-farm-tender-process.
- Mathews, J. 2005. Strategy and the crystal cycle. California Management Review 47 (2):5–32. doi:10.2307/41166293.
- Meckling, J., N. Kelsey, E. Biber, and J. Zysman. 2015. Winning coalitions for climate policy. Science 349 (6253):1170–71. doi:10.1126/science.aab1336.
- Mehos, M., C. Turchi, J. Jorgenson, P. Denholm, C. Ho, and K. Armijo. 2016. On the path to SunShot: Advancing concentrating solar power technology, performance, and dispatchability. Golden: National Renewable Energy Laboratory.
- Ministry of Finance. (2020). 关于促进非水可再生能源发电健康发展的若干意见. http://jjs.mof.gov.cn/zhengcefagui/202001/t20200122_3463379.htm.
- Mir-Artigues, P., P. del Río, and N. Caldés. 2019. The economics and policy of concentrating solar power. Cham: Springer.
- Montt, G., K. Wiebe, M. Harsdorff, M. Simas, A. Bonnet, and R. Wood. 2018. Does climate action destroy jobs? International Labour Review 157 (4):519–56. doi:10.1111/ilr.12118.
- Nemet, G. 2019. How solar energy became cheap: A model for low-carbon innovation. Routledge, London.
- NewEnergyUpdate. 2019a. Noor Midelt winner optimizes CSP trough, storage to hit record price. Accessed October 9, 2019. https://analysis.newenergyupdate.com/csp-today/noor-midelt-winner-optimizes-csp-trough-storage-hit-record-price.
- NewEnergyUpdate. 2019b. Noor Midelt winner optimizes CSP trough, storage to hit record price. Accessed June 30, 2019. https://analysis.newenergyupdate.com/csp-today/noor-midelt-winner-optimizes-csp-trough-storage-hit-record-price.
- Oerlemans, L., M. Meeus, and F. Boekema. 2003. Do networks matter for innovation? The usefulness of the econominc network approach in analysing innovation. Journal of Economic and Social Geography 89 (3):298–309.
- Peltoniemi, M. 2011. Reviewing industry life-cycle theory: Avenues for future research. International Journal of Management Reviews 13:349–75. doi:10.1111/j.1468-2370.2010.00295.x.
- Perez, C., and L. Soete. 1988. Catching up in technology: Entry barriers and windows of opportunity. In Technical change and economic theory, ed. G. Dosi, C. Freeman, R. Nelson, G. Silverberg, and L. Soete. pp. 458-479. New York, NY: Columbia University Press.
- Pfenninger, S., P. Gauché, J. Lilliestam, K. Damerau, F. Wagner, and A. Patt. 2014. Potential for concentrating solar power to provide baseload and dispatchable power. Nature Climate Change 4 (8):689–92. doi:10.1038/nclimate2276.
- Quitzow, R., J. Huenteler, and H. Asmussen. 2017. Development trajectories in China’s wind and solar energy industries: How technology-related differences shape the dynamics of industry localization and catching up. Journal of Cleaner Production 158:122–33. doi:10.1016/j.jclepro.2017.04.130.
- Ragwitz, M., W. Schade, B. Breitschopf, R. Walz, N. Helfrich, M. Rathmann, G. Resch, C. Panzer, T. Faber, R. Haas, et al. 2009. EmployRES. The impact of renewable energy policy on economic growth and employment in the European Union. Karlsruhe: Fraunhofer-Institut für System- und Innovationsforschung (ISI).
- REN21. 2014. Renewables 2014. Global status report. Paris: REN21.
- REN21. 2018. Renewables 2017. Paris: REN21.
- REN21. 2019. Renewables 2019. Global status report. Paris: REN21.
- Sagar, A., and B. van der Zwaan. 2006. Technological innovation in the energy sector: R&D, deployment, and learning-by-doing. Energy Policy 34:2601–08. doi:10.1016/j.enpol.2005.04.012.
- Schmidt, T. S., N. Schmid, and S. Sewerin. 2019. Policy goals, partisanship and paradigmatic change in energy policy - analyzing parliamentary discourse in Germany over 30 years. Climate Policy 19 (6):771–86. doi:10.1080/14693062.2019.1594667.
- Schöniger, F., R. Thonig, G. Resch, and J. Lilliestam. this issue. Making the sun shine at night: Comparing concentrated solar power and photovoltaics with storage. Energy Sources, Part B: Economics, Planning and Policy.
- Stirling, A. 1999. On the economics and analysis of diversity. Brighton: Science Policy Research Unit, University of Sussex.
- Trieb, F. 2005. Concentrating solar power for the Mediterranean region. Stuttgart: German Aerospace Centre (DLR).
- Trieb, F. 2006. Trans-Mediterranean interconnection for concentrating solar power. Stuttgart: German Aerospace Centre (DLR).
- Trieb, F., T. Fichter, and M. Moser. 2013. Concentrating solar power in a sustainable future electricity mix. Sustainability Science 9:47–60. doi:10.1007/s11625-013-0229-1.
- Trieb, F., T. Fichter, and M. Moser. 2014. Concentrating solar power in a sustainable future electricity mix. Sustainability Science 9 (1):47–60. doi:10.1007/s11625-013-0229-1.
- Trieb, F., D. Hess, J. Kern, T. Fichter, M. Moser, U. Pfenning, N. Caldés, C. de la Rúa, A. Tuerk, D. Frieden, et al. 2015. North Africa case study. Stuttgart: German Aerospace Centre (DLR).
- Wright, T. P. 1936. Factors affecting the cost of airplanes. Journal of the Aeronautical Sciences 3 (4):122–28. doi:10.2514/8.155.
Appendix: Description of the csp.guru data update
The January 2020 version of csp.guru (Citation2020) builds on three previous versions from January 2019 (csp.guru Citation2019), May 2018 (csp.guru Citation2018), and August 2016 (csp.guru Citation2017; Lilliestam et al. Citation2017). This version is primarily an update regarding projects, project status, LCOE, and component suppliers. The data was compiled in January-March 2020, and describes the situation on 1 January 2020.
We updated the project status for all projects under construction in the previous version, while scanning all known projects under development for construction begin. For all projects finished during 2019, we changed the status to “operational”. For some projects, we changed the project status to “under development” (excluded in the current dataset); this applies in particular to several Chinese projects where construction was either halted or had previously been “overoptimistically” reported by developers and participating companies to have broken ground during 2017 or 2018. In addition, we fixed some minor errors in the previous version, following the reporting of these by csp.guru users.
Regarding the industry data, we performed a comprehensive review of companies involved in construction of stations or supply of CSP-specific components. For the collector data, the previous dataset version was correct but imprecise regarding what the listed company had done, by conflating engineering/IP ownership and manufacturing of the components (which may happen via licensing from the IP owner). In the current version, we have replaced collector manufacturing with collector (SCA/heliostat) engineering, which better describes who supplies the know-how for collectors of each individual project.
We describe the Noor Energy 1 project as one project, although it consists of 3 separate but co-located 200 MW parabolic trough stations and one 100 MW tower; as they have separate planned completion dates, we separate the different parts in the capacity analyses. Noor Energy 1 is described as one project regarding costs, as it is treated as one project by the offtaker, with one PPA for the entire complex (including the PV part). As the project developer has not published the expected generation of Noor Energy 1, we use the estimate of Lilliestam and Pitz-Paal (Citation2018), who expect load factors of 55–65% (tower with 15 h storage) and 50–55% (trough with 10 h storage); on average, the station would then reach a load factor of about 56%, which we use for the LCOE estimate.
For all projects without a known construction start date, we have assumed construction times of 1 year (PS10), 2 years (corresponding to the typical construction time of all Spanish stations, for Helioenergy 1 and 2, Solaben 2 and 3, Solacor 1 and 2, Morón, La Africana Orellana, and Dhursar), and 3 years (to coincide with the construction start date of the sister stations of similar/identical design/in the same complex, of Solaben 1 and 6 and Casablanca). We know the construction start date for all other stations.
For further descriptions of how the dataset has evolved, and about the inclusions/exclusions or assumptions behind previous dataset versions, please refer to csp.guru.
