
 ?Mathematical formulae have been encoded as MathML and are displayed in this HTML version using MathJax in order to improve their display. Uncheck the box to turn MathJax off. This feature requires Javascript. Click on a formula to zoom.
ABSTRACT
Ireland has a renewable heat sectoral target of 600,000 heat pumps by 2030 with currently just 44,000 installed. Such a high heat pump target will have a significant effect on electricity demand and on the management and operation of the electricity grid. Many studies rely on synthetic data to estimate the impact of the adoption of low carbon technologies. This paper explores residential electricity demand using an innovative dataset from a field trial of deeply retrofitted homes heated by air source heat pumps. We estimate the after diversity maximum demand during a period of extreme weather, comparing it to a typical winter day. We assess which statistical distributions best model the electricity demand per home heated by an air source heat pump. The after diversity max demand is 3.84 kW compared to 2.33 kW, while a Gamma distribution best models average coincident electricity demand for the homes.
1. Introduction
Improving energy efficiency, reducing emissions, increasing the share of renewable energy, and reducing energy poverty are of paramount importance in the European Union’s (EU) strategy for a clean energy transition (Ioannis et al. Citation2020). Ambitions for low-carbon economies and competitive secure energy systems were endorsed and enhanced in Council directive 2018/2001 (EU Citation2018). Each EU member state has a National Energy and Climate Plan (NECP) which details their plans to reach at least 32% renewable energy by 2030.
Fossil fuels serve 50.5% of the residential sector’s energy needs in the European Union (Eurostat Citation2019). The Republic of Ireland, however, is above the European average with 72% of household energy consumption relying on fossil fuels (oil, natural gas & solid fuels) (SEAI Citation2019). Only 2.5% of household energy consumption is served by renewable energy from rooftop solar photovoltaic, rooftop solar thermal, heat pumps (HPs), etc (SEAI Citation2019). Heat energy, for both space heating and domestic hot water, in the Irish residential sector accounts for 61% of household total energy consumption (SEAI Citation2019).
There is a significant challenge to understand the impact of HPs on electricity demand, and particularly peak demand. Many studies rely on estimates from simulations based on mechanistic or hypothesized statistical distributions. However, performance in situ can vary considerably from laboratory experiments. This paper addresses the following research questions using an empirical data set from a field study:
What impact does an extreme cold weather event have on peak electricity demand of homes heated by air source heat pumps (ASHPs) when compared to a typical winter day in a temperate climate?
Which statistical distributions best model coincident demand from homes heated by ASHPs?
The main contributions of this paper are data-driven estimates of the electricity demand from homes heated by ASHPs, and well-fitted statistical distributions. Our analysis provides insights for the electrification of the heating sector based on real-world operations rather than theoretical simulations.
1.1. Electricity peak demand design considerations
The Irish government has updated building regulations and home energy grant schemes to address the decarbonization of the residential heating sector. Ireland’s NECP has a sectoral target of 600,000 HPs of which 400,000 will be retrofitted by 2030 (DCCAE Citation2019). This corresponds to 30% of the 2 million housing stock. An estimated 44,000 HPs are currently installed in Ireland (EHPA Citation2019). Homeowners who wish to avail of a HP grant must first upgrade their home to a building energy rating (BER) of at least a B grade (≤150 KWh/m2/year) (CSO Citation2021). This will ensure that HPs operate efficiently and do not result in high electricity bills for home owners (SEAI Citation2017).
The magnitude and the pace required to reach the target of HPs in the next decade will not only have a significant effect on electricity demand but also on the management and operation of the grid. Understanding energy usage of HPs can improve energy conservation practices and help achieve a sustainable future (Bilgen and Sarıkaya Citation2018). Love et al. (Citation2017) note four potential problems associated with HP adoption. At the Transmission System Operator (TSO) level problems meeting peak demand, and handling ramp rate increases. At the Distribution System Operator (DSO) level, problems managing excessive voltage drops, and making investment decisions on the reinforcement of low voltage feeders and transformers.
The literature on the electrification of residential heating reflects these concerns. Eyre and Baruah (Citation2015) estimate that the electrification of residential heating in the United Kingdom (UK) could increase peak electricity demand by 30%. Protopapadaki and Saelens (Citation2017) analyze the impact of ASHPs and solar photovoltaics (PV) penetration on residential low-voltage feeders in both rural and urban areas in Belgium based on simulated data for 1 year. They estimate that cable overloading could be expected with ASHP penetration between 20% and 30%. Asare-Bediako, Kling, and Ribeiro (Citation2014) employ a combination of top-down and bottom-up approaches with scaled synthetic load profiles representing base loads per household in the Netherlands. A scenario-based approach is used for the analysis of different combinations and penetration levels of renewable energy systems including different types of heat pumps. In a future scenario of base load and HPs during the winter week, they estimate there could be up to a 100% increase in peak load with the increased possibility of voltage drops.
These previous studies rely on simulated datasets to estimate the effects of HP uptake. Love et al. (Citation2017) use a real-world dataset from HP installations to create an aggregated load profile. The houses are a range of dwelling types and ages with many not purpose built for HPs having little upgrades in building energy efficiency standards.
Love et al. (Citation2017) use after diversity max demand (ADMD) to estimate the extreme values of the HP load profile. Currently an ADMD of 2.5 kW per customer is standard design practise in Ireland, as in Europe and much of the rest of the world, ESBN (Citation2020). ADMD is used by the DSOs in the design of distribution networks where coincident demand is averaged over a large number of customers (Barteczko-Hibbert Citation2015). The electricity usage data is smoothed by calculating the average usage over a sample of N customers for each time step in the sample time horizon T. Eq. 1. shows the smoothed time series TSt where dit is the electricity demand in kW from customer i in time step t.
The ADMD is the maximum average electricity demand over the sample time horizon as shown in Eq.2.
This measure allows the DSO to dimension the low voltage network in anticipation of the average concurrent maximum demand. Barteczko-Hibbert (Citation2015) reports an ADMD for samples of 100 customers across all demographic groups in the UK of between 1.2 and 2 kW. DSOs need to estimate the impact of the adoption of low carbon technologies such as HPs on ADMD, and plan network reinforcement strategies accordingly. Love et al. (Citation2017) use a winter period when calculating the ADMD for HP demand in the UK, when heating energy demand is at its highest. The ADMD is 1.7 kW for the additional heat pump demand for a sample of 100 customers. This is the additional heat pump demand and does not include the rest of the household electricity use. The ADMD of the whole home with heat pump is around 2 kW. They note that total is less than the sum of the components as the daily peak in heat pump use is not concurrent with the daily peak of the rest of the home. They note that the peak in aggregated HP profile occurs in the morning while the national gird peak demand occurs in the evening. The shape of the national grid profile remains largely the same even at a 20% HP penetration level, but they note that this may change in colder weather.
Bottom-up models of high-resolution electricity usage data can provide opportunities to investigate changes in usage patterns caused by the electrification of residential heating sector (Fischer, Surmann, and Lindberg Citation2020).
Statistical probability distribution functions can be used to model the overall shape of the electricity load. Seppala (Citation1995) proposes a modified Log-normal distribution to investigate hourly load data in Finland. Carpaneto and Chicco (Citation2006) find that a Gamma distribution is the best fit in modeling single-house urban residential aggregated load in the province of Cuneo, Italy during winter working days. Gonzalez-Longatt et al. (Citation2012) conclude that a Gaussian mixture model performs best on a Venezuelan case study.
McLoughlin, Duffy, and Conlon (Citation2012) use a Weibull and log – logistic probability distribution function when characterizing domestic electricity consumption in Ireland. The dataset gathered in 2009 as part of a smart meter trial is a representative sample of the population of households. It provides a good estimate of the baseline electricity demand prior to the adoption of low carbon technologies. Only 24 of the 4,232 participants reported using renewable energy as their home heating source.
Munkhammar, Rydén, and Widén (Citation2014) find that a Weibull distribution is best in modeling electricity use of Swedish households. Their study is on detached houses with some using electricity for heating including heat pumps. Munkhammar, Widén, and Rydén (Citation2015) investigate power consumption and production patterns associated with EV home-charging and PV power production. They fit a Weibull distribution to household electricity use, Bernoulli distribution representing electric vehicle use, and a bimodal normal distribution for solar PV electricity production. The resulting power consumption/production distributions for multiple households with low carbon technologies are found not to be normally distributed.
The literature shows that a variety of distributions are useful to model residential load. There is no standard probability distribution that can be used in all cases. The probability distribution of the aggregated load depends heavily on where in the grid the aggregation is viewed, the time of day and the profile of the end-users. The planned uptake of HPs could have a significant effect on electricity demand profiles, especially during colder winters in temperate climates like Ireland. There is a significant research gap on the statistical probability distribution of the aggregate load of houses heated by HPs. This paper contributes to addressing the gap by investigating an innovative real-world dataset from a field trail of Irish houses retrofitted with ASHPs.
1.2. Heat pumps in temperate climates
Temperate climates in both northern and southern latitudes experience mild to warm summers and cool to cold winters with distinct seasonal changes. Ireland lies in the north Atlantic Ocean on the European continental shelf, where it benefits from the North Atlantic Current and Gulf Stream airflows. Ireland experiences a maritime temperate climate giving it a milder climate than other places at similar latitudes, having mild winters and tepid summers. Therefore, there is only demand for space heating and domestic hot water heating in the residential sector and little to no demand for space cooling. Heat demand is low density because of the dispersal patterns of the population of 4.8 million people, the nature of the housing stock, and Ireland’s temperate climate. District heating has very limited potential in cities in Ireland (Carroll, Chesser, and Lyons Citation2020). Many rural households do not have a connection to the natural gas network and have a high dependence on fossil fuels for space heating and domestic hot water. In Tipperary county where the house energy consumption data in this paper is sourced, 86.9% of households source their heat from oil and solid fuels (CSO Citation2018).
National energy efficiency retrofit programs aim to incentivize HP adoption. The longest running of these programs has been in place in Ireland since 2000 and aims to combat fuel poverty by way of energy efficiency upgrades. Retrofit programs for homeowners currently include grants for renewable energy technologies such as HPs. The retrofit programs have been successful in reducing energy consumption in residential space heating (Dennehy et al. Citation2019).
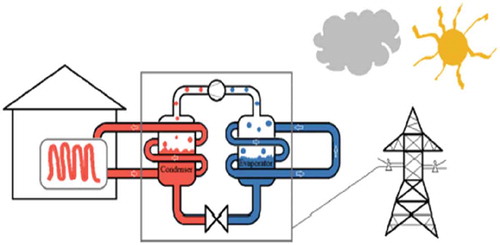
HPs are promoted as an attractive renewable alternative for residential consumers to replace fossil fuel heating systems. They are advertised as low maintenance systems offering lower costs, contributing to lowering carbon emissions and improving local air quality. HPs are energy recovery systems that use electricity to extract heat from an external source and transform it for use in the building’s heating system. Additional benefits accrue when the electricity used to operate the HPs comes from renewable energy systems (Carroll, Chesser, and Lyons Citation2020). A schematic of the HP process can be seen in . It shows an HP, in this case an ASHP, powered by electricity from the gird to extract heat from the outside air. This heat energy is absorbed by the coolant liquid in the evaporator (blue). The coolant is compressed to a higher pressure increasing its temperature. The coolant than condenses in the water cooled condenser (red), transferring heat to the house’s heating system. The coefficient of performance (COP) metric is used to gauge how efficiently a HP does this. The COP is defined as the ratio of heating provided by the HP to the electricity consumed by the HP.
Figure 1. Heat pump system schematic diagram (Carroll, Chesser, and Lyons Citation2020)
Irish has a temperate climate and rarely experiences extreme wintersor major snowstorms. Because of their rarity when they do occur, they cause serious disruption. Occasionally a significant snowfall occurs with blocking high pressure to the north of Ireland pushing the North Atlantic jet stream and associated storm systems south, bringing an easterly Polar Continental airflow. This type of pattern can follow a phenomenon called a “Sudden Stratospheric Warming (SSW)” (Met Eireann Citation2019, 3). There have been 25 SWWs between the years 1958 to 2013. The SSW on the 12th of February 2018 resulted in a polar continental air mass, named “The Beast from the East.” Resulting snow fall across the country accumulated due to temperatures staying below freezing even during the day. Storm Emma arrived in Ireland on the 28th February 2018, combining with “The Beast from the East” strong winds created blizzard-like conditions driving snow inland. The extreme weather event lasted until 4th of March 2018, resulting in the cancellation of public transport across the country, the closure of schools and businesses and 100,000 homes and businesses losing power (Met Eireann Citation2019).
shows how ASHPs use electricity to transfer heat energy from the outside ambient air to the house’s heating system. The greater the difference between these two temperatures the harder the ASHP has to work to achieve adequate heat comfort levels (Heinen et al. Citation2017). Thus, the replacement of the traditional methods of home heating (oil, natural gas, and solid fuels) with HPs will increase demand for electricity, especially during cold winters and extreme weather events like Storm Emma. Leahy and Foley (Citation2012) find that “the daily total wintertime electricity demand in Ireland increases by around 1.6 GWh with every 1°C drop in air temperature.”
2. Methodology
We explore the ADMD and statistical distributions for the electricity demand per ASHP heated home using a unique empirical dataset of the electricity usage of deep retrofitted Irish homes located in the countryside. The Superhomes project was developed by the Tipperary Energy as a one stop shop for home energy retrofit. It combines a range of deep retrofit measures along with the installation of ASHPs, wood stoves and solar PV technologies. It helps homeowners upgrade their homes to a high building energy rating (BER) of at least a B. The initial phase of the project, Superhomes 1.0 (SH1.0), included extensive systems monitoring to facilitate data collection from 20 detached homes in rural Ireland retrofitted with ASHPs.
Superhomes 2.0 (SH2.0) followed SH1.0 and aimed to optimize the real-world ASHP heat performance. The aim was to develop a fully integrated solution for the market integrating a net zero energy building retrofit package with an optimized ASHP control system. The goal being to move from a pilot phase to a clear business model to facilitate a large-scale deployment nationally.
The SH2.0 project team gathered data for the purposes of carrying out tests on the ASHP systems over two heating seasons, October 2017 to April 2018 and October 2018 to April 2019. Heat and electricity data were collected in three ways: remote login to the manufacturer’s platform, site visits to collect data on SD cards and downloads provided from manufacturers. Quality assurance measures were employed to ensure data quality was to the highest levels. Electrical meters were within accuracy Class A as defined in Annex MI-003 of the Measuring Instruments Directive.
Analysis of the COP from the first heating season pointed to areas for more detailed investigation. Optimization measures were devised and implemented in the second heating season. Adjustments were made to flow temperature control settings to prevent early switch-off of the compressor and excessive compressor cycling which leads to below average COP and excessive wear on compressors. In some cases, adjustments were made to pump speeds and radiator valve settings to improve radiator and overall system temperature difference as a temperature difference less than 5°C led to a decrease in COP.
The electricity demand of the whole home following the SH2.0 optimization are used in this study to estimate the ADMD and statistical distribution of the electricity load of retrofitted ASHP heated homes. The electricity use in kilowatts (kW) at 15 minutes resolution metered at the home boundary for a sample of 20 homes is analyzed. This is the total home electricity usage which includes the ASHP and hot water immersion heating. Temperature data for the corresponding time frame was sourced from the nearest weather station, Gurteen weather station in Tipperary.
The homes are a mix of dwelling types and sizes, spanning a mix of typical ASHP systems in retrofitted homes. They are typical of the type of home targeted in the NECP. All homes have a minimum BER of B with a mix of underfloor and radiators. Due to privacy concerns, no further information about the size and make of the HP, or socioeconomic or dwelling characteristics are made available for this analysis. Recording of the homes began at different times in 2018 with the majority starting in January. All recordings finished on 28th February 2019. There were some instrumentation failures during the field trial. As a result, not all 20 homes have data for the winter heating period.
The data were cleaned by removing meters with large amounts of missing data, and patching or repairing small amounts of missing data by interpolation. This left eight homes with complete electricity data sets for analysis. The average electricity per time step over the sample of customers is then calculated to create the average coincident demand per time step, TSt in Eq.1. Taking the maximum over the time series yields the ADMD in Eq.2. We use the software package RStudio for data analysis and modeling. The R package “fittdistrplus” provides functions for fitting univariate distributions to different types of data and allows different estimation methods (Delignette-Muller and Dutang Citation2015). We fit and evaluate statistical distributions for the data in TSt.
3. Results
Focusing on research question 1, the impact of an extreme weather event on peak electricity usage of homes heated by ASHPs when compared to a typical winter day. We estimate the ADMD comparing the 28th February 2018 from the extreme weather event, and the same day the following year as a typical winter day. The 28th February was chosen as Met Eireann (Met Eireann Citation2018) notes Februarys maximum and minimum air temperatures for the entire country were recorded at the Gurteen weather station on this day in 2018. During this time frame only eight of the SH2.0 recorded complete data.
provides statistics from a day during the event 28th February 2018 with the same day the following year 28th February 2019 to illustrate the impact of an extreme weather event on average electricity usage. Comparing the temperature first, none of the descriptive statistics are above freezing temperature during 28th February 2018 while the same day the following year had an average temperature of 8.4°C, a minimum temperature of nearly 6°C and a maximum of approximately 12°C.
Table 1. Descriptive Statistics for average electricity use per home and temperature for Storm Emma, A Day during Storm Emma & The same day the following year
Next, viewing the average electricity usage per home we see the major impact an extreme weather event can have. The ADMD is 3.839 kW on the 28th February 2018. The ADMD the following year on the 28th February 2019 is 2.331 kW, 61% lower.
The magnitude for all the descriptive statistics is considerably lower for electricity usage for the 28th February 2019. A t-test for the difference of the means for temperature and average electricity usage, allows the null hypothesis of no significant difference between the means to be rejected.
. shows the temperature during Storm Emma which only rose above 2.5°C in the latter hours of 4th March. The minimum temperature of −5.6°C was recorded at 4:00 on 1st March and the average temperature was −0.67°C over the duration of Storm Emma (). The ADMD value over the full storm Emma period, i.e. the maximum average coincident value is 4.361 kW (). This is the maximum coincident demand the DSO can expect per house. The min average coincident demand use during Storm Emma was 1.086 kW.
Figure 2. The averaged SH2.0 electricity usage TSt and Temperature, 28th February – 4th March 2018
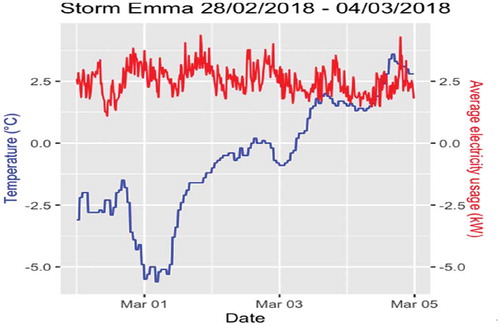
The mean wind during Storm Emma was 12.5 m/s and the minimum wind speed was 5 m/s. The cut-in wind speed for wind turbines varies by the size of the turbine, its generally accepted that a wind speed of 5 m/s is needed for generation. Therefore, the concerns raised by Leahy and Foley (Citation2012) of no renewable electricity from wind during cold spells were not experienced here.
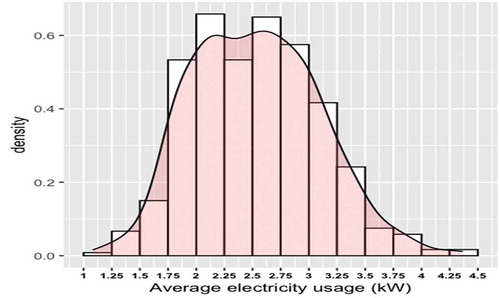
Focusing on research question 2, the probability distributions that best model the average coincident demand of homes heated by ASHPs, TSt in Eq.1, the histogram in shows the average electricity usage during Storm Emma (28th February – 4th March 2018), the skewness of the data is 0.28 and the kurtosis is 2.78. The data is slightly skewed to the right.
Figure 3. Coincident averaged electricity usage Histogram and Empirical Density, Storm Emma:28th February – 4th March 2018
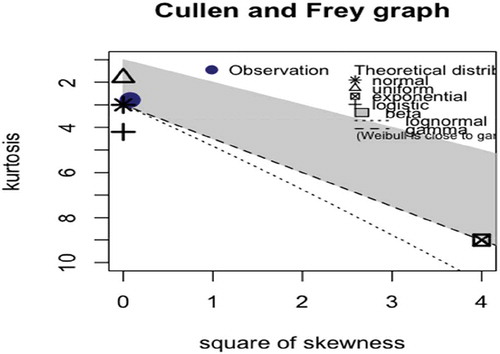
In the next step we use curve fitting to model the average electricity use per home. As part of the “fittdistrplus” package (Delignette-Muller and Dutang Citation2015) in RStudio, we use the function “descdist” to produce a Cullen and Frey graph (, Below) which is used to reduce the set of possible candidate distributions. Based on this information, we consider; Gamma, log-normal, normal and Weibull distributions, but not logistic or exponential distributions. The parameters of the distributions are estimated using maximum likelihood estimates (MLE).
Figure 4. Skewness-kurtosis plot for average electricity usage (kw) as provided by the descdist function in R
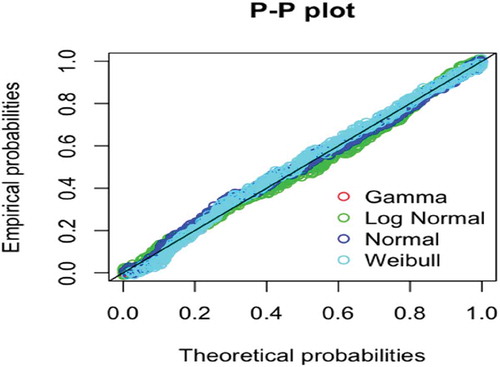
Goodness-of-fit plots for the four probability distributions are presented in . From the histogram () and cumulative distribution function (CDF) () plots we see the gamma and normal distribution function are good fits. The Q-Q and P-P plots indicates limitations and alternative probability distributions. The Q-Q plot () highlights the lack-of-fit at the tails, the gamma and normal probability distributions again are preferred here for their better description of the right tail of the empirical distribution. The P-P plot () highlights the lack-of-fit at the distribution center, all probability distributions fit the distribution center to different degrees with gamma and normal being the best fit.
Figure 5. CDF plot of both the empirical distribution and the fitted distribution
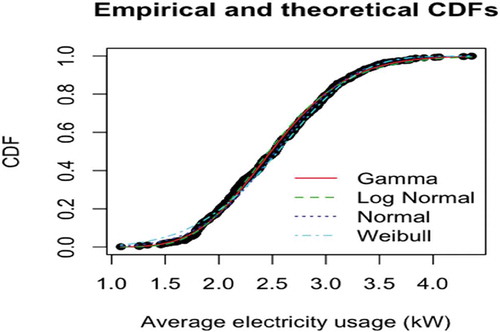
Figure 6. Density function of the fitted distribution along with the histogram of the Storm Emma empirical distribution
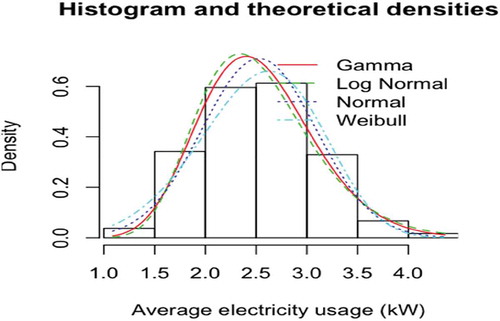
Figure 7. Q-Q plot representing the empirical quantiles (y-axis) against the theoretical quantiles (x-axis)
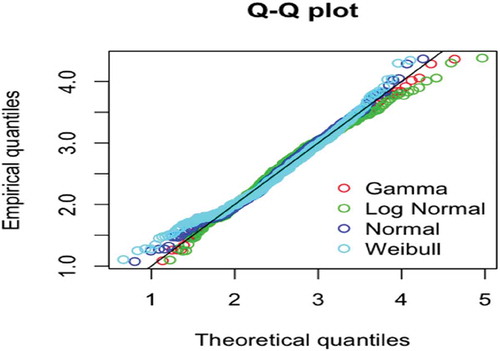
Figure 8. P-P plot representing the empirical distribution function evaluated at each data point (y-axis) against the fitted distribution function (x-axis)
presents the results of the “gofstat” function which computes the goodness-of-fit statistics for parametric distributions. The three goodness-of-fit statistics produced by this function are; Kolmogorov–Smirnov, Cramer-von Mises and Anderson-Darling. All goodness-of-fit statistics are in favor of the Gamma distribution over the other distributions. The Gamma fit measures are highlighted in bold font.
Table 2. Goodness-of-fit Statistics & Criteria
The MLE estimates for the Gamma distribution shape and rate parameters are shape ≈ 19.93, rate ≈ 7.88. We use these estimates to explore the tails of the distribution for the extreme weather event. The 99, 95 and 90% cut off points are 3.86 kW, 3.47 kW and 3.27 kW per customer, respectively. This allows the DSO to estimate the probability of electricity demand for its portfolio of customers being above these cut-off points during an extreme weather event. There have been 25 such events over the past 55 years, which leads to an expectation they may occur once every 2 years.
4. Discussions and conclusions
Currently most of the Irish housing stock is heated by energy from fossil fuels, particularly in rural areas. In an effort to electrify and decarbonize the residential heating sector the Irish government plans to have 30% of the housing stock heated by HPs by 2030 increasing from a base of around 44,000 to 600,000.
The dataset used in this paper comes from a project called Superhomes in which rural detached houses had been retrofitted to a high energy efficiency rating and had ASHPs installed to meet heat demand. The Superhomes project is viewed as a blueprint for retrofitting Irelands old energy inefficient housing stock. A concern associated with the mass adoption of HP is that there will be a problem in meeting the peak electricity demand (Love et al. Citation2017).
Using the Superhomes data we calculate the ADMD per home heated by an ASHP. In our first research question we found that there was a 65% increase in peak average electricity demand from 3.839 kW on the day of the extreme cold weather event compared to 2.331 kW on a typical winter day. The ADMD figure over the entirety of the storm was 4.4 kW.
These figures compare with a baseline before the adoption of low carbon technologies of 2.5 kW, the ADMD design value historically used by DSOs. This highlights the importance of the energy efficiency measures of the Superhomes project which achieved minimum BER ratings of B (≤150 kWh/m2/year).
One of the potential problems associated with HP adoption according to Love et al. (Citation2017) is meeting peak demand increases. If the Superhomes are the blueprint for retrofitted the housing stock this may not be a problem. However, the energy efficiency performance seen in this sample may not be representative of all retrofits. An area of future research is to investigate a lager sample of retrofitted houses to explore detailed models to estimate ADMD.
In our second research question, we found that a Gamma distribution is best to model coincident demand from homes heated by ASHPs demand after assessing several distributions on the data. McLoughlin, Duffy, and Conlon (Citation2012) found that residential electricity consumption in Ireland was best characterized by Weibull and log – logistic probability distributions. Increasing the share of electric powered HPs for home heat energy needs could change which probability distribution best characterizes residential electricity consumption. The cost of additional investment needed to support the adoption of low carbon technologies may be incorrectly estimated if suitable distributions are not used. The shape and size of the right-hand tail is extremely important to estimate what investment and reinforcement may be needed in the low voltage distribution network (Chesser et al. Citation2020).
An area of future research will look at what percentage of penetration of HP will change the electricity demand distribution at different points on the electricity grid. It would also be interesting to explore if the patterns generalize well to other northern European countries or regions with similar temperate maritime climates. The distributions may generalize to countries like the UK, but not to warmer climates or other regions with very different housing stock.
Electrification of the Irish residential heating sector is needed in order to address energy efficiency, emissions, renewable energy and energy poverty in reaching 2030 goals. This raises many challenges, especially during extreme weather events. As prolonged cold periods due to a blocking high-pressure system is generally paired with low wind speeds which will result in low wind energy generation and could have serious impacts on supply. The analysis in this paper provides useful information and insight for DSOs in network planning for the future electrification of the residential heating sector.
Additional information
Funding
References
- Asare-Bediako, B., W. Kling, P. Ribeiro, 2014. Future residential load profiles: scenario-based analysis of high penetration of heavy loads and distributed generation. Energy and Buildings 75:228–38. doi:https://doi.org/10.1016/j.enbuild.2014.02.025.
- Barteczko-Hibbert, C. 2015. After diversity maximum demand (ADMD) report. Report for the ‘Customer-Led Network Revolution’project. Durham University.
- Bilgen, S., and İ. Sarıkaya. 2018. Energy conservation policy and environment for a clean and sustainable energy future. Energy Sources, Part B: Economics, Planning, and Policy 13 (3):183–89. doi:https://doi.org/10.1080/15567249.2017.1423412.
- Carpaneto, E., and G. Chicco 2006. Probability distributions of the aggregated residential load. Paper presented at the 2006 International Conference on Probabilistic Methods Applied to Power Systems. Stockholm, Sweden.
- Carroll, P., M. Chesser, and P. Lyons. 2020. Air source heat pumps field studies: A systematic literature review. Renewable and Sustainable Energy Reviews 134:110275. doi:https://doi.org/10.1016/j.rser.2020.110275.
- Chesser, M., P. Lyons, P. O’Reilly, and P. Carroll. 2020. Probability density distributions for household air source heat pump electricity demand. Procedia Computer Science 175:468–75. doi:https://doi.org/10.1016/j.procs.2020.07.067.
- CSO. 2018. Type of heating in permanent housing units by nature of occupancy, Province County or City, type of private accommodation, censusYear and statistic. Retrieved from https://statbank.cso.ie/px/pxeirestat/Statire/SelectVarVal/Define.asp?MainTable=H0001&TabStrip=Select&PLanguage=0&FF=1
- CSO. 2021. Domestic building energy ratings. Retrieved from https://www.cso.ie/en/methods/surveybackgroundnotes/domesticbuildingenergyratings/
- DCCAE. 2019. Climate action plan. Retrieved from https://www.dccae.gov.ie/en-ie/climate-action/publications/Documents/16/Climate_Action_Plan_2019.pdf
- Delignette-Muller, M. L., and C. Dutang. 2015. fitdistrplus: an R package for fitting distributions. Journal of Statistical Software 64 (4):1–34. doi:https://doi.org/10.18637/jss.v064.i04.
- Dennehy, E. R., Dineen, D., Rogan, F., and B.P. Ó Gallachóir. 2019. Recession or retrofit: An ex-post evaluation of Irish residential space heating trends. Energy and Buildings, 205, 109474. doi:https://doi.org/10.1016/j.enbuild.2019.109474
- EHPA. 2019. Heat pump sales overview. Retrieved from http://stats.ehpa.org/hp_sales/story_sales/
- Eireann, M. 2018. Weather statement for February 2018. Retrieved from https://www.met.ie/climate/past-weather-statements#
- Eireann, M. 2019. Storm emma. Retrieved from https://www.met.ie/cms/assets/uploads/2019/02/EmmaReport2019.pdf
- ESBN. 2020. Assessment of the Scope for Higher Penetrations of Distributed Generation on the Low Voltage Distribution Network, ESB Networks, technical report DOC-150720-FVC
- EU. 2018. Directive (EU) 2018/2001 of the European parliament and of the council of 11 December 2018 on the promotion of the use of energy from renewable sources. Official Journal of the European Union 5: 82–209.
- Eurostat. 2019. Energy consumption and use by households. Retrieved from https://ec.europa.eu/eurostat/web/products-eurostat-news/-/DDN-20190620-1#:~:text=In%202017%2C%20households%20accounted%20for,and%20derived%20heat%20(7.6%25).
- Eyre, N., and P. Baruah. 2015. Uncertainties in future energy demand in UK residential heating. Energy Policy 87:641–53. doi:https://doi.org/10.1016/j.enpol.2014.12.030.
- Fischer, D., A. Surmann, and K. B. Lindberg. 2020. Impact of emerging technologies on the electricity load profile of residential areas. Energy and Buildings 208:109614. doi:https://doi.org/10.1016/j.enbuild.2019.109614.
- Gonzalez-Longatt, F., J. Rueda, I. Erlich, W. Villa, and D. Bogdanov. 2012. Mean variance mapping optimization for the identification of gaussian mixture model: Test case. Paper presented at the 2012 6th IEEE International Conference Intelligent Systems.
- Heinen, S., W. Turner, L. Cradden, F. McDermott, and M. O’Malley. 2017. Electrification of residential space heating considering coincidental weather events and building thermal inertia: A system-wide planning analysis. Energy 127:136–54. doi:https://doi.org/10.1016/j.energy.2017.03.102.
- Ioannis, K., L. Marina, N. Vasileios, A. Margarita-Niki, and R. Joanna. 2020. An analysis of the determining factors of fuel poverty among students living in the private-rented sector in Europe and its impact on their well-being. Energy Sources, Part B: Economics, Planning, and Policy. 1–23. doi:https://doi.org/10.1080/15567249.2020.1773579
- Leahy, P. G., and A. M. Foley. 2012. Wind generation output during cold weather-driven electricity demand peaks in Ireland. Energy 39 (1):48–53. doi:https://doi.org/10.1016/j.energy.2011.07.013.
- Love, J., A. Z. P. Smith, S.Watson, E. Oikonomou, A. Summerfield, C. Gleeson, and R. Lowe. 2017. The addition of heat pump electricity load profiles to GB electricity demand: evidence from a heat pump field trial. Applied Energy 204:332–42. doi:https://doi.org/10.1016/j.apenergy.2017.07.026.
- McLoughlin, F., A. Duffy, and M. Conlon. 2012 . Characterising domestic electricity consumption patterns by dwelling and occupant socio-economic variables: an Irish case study. Energy and Buildings 48: 240–48. doi:https://doi.org/10.1016/j.395enbuild.2012.01.037.
- Munkhammar, J., J. Rydén, and J. Widén. 2014. Characterizing probability density distributions for household electricity load profiles from high-resolution electricity use data. Applied Energy 135:382–90. doi:https://doi.org/10.1016/j.apenergy.2014.08.093.
- Munkhammar, J., J. Widén, and J. Rydén. 2015. On a probability distribution model combining household power consumption, electric vehicle home-charging and photovoltaic power production. Applied Energy 142:135–43.doi:https://doi.org/10.1016/j.apenergy.2014.12.031.
- Protopapadaki, C., and D. Saelens. 2017. Heat pump and PV impact on residential low-voltage distribution grids as a function of building and district properties. Applied Energy 192:268–81. doi:https://doi.org/10.1016/j.apenergy.2016.11.103.
- SEAI. 2017. Heat pump systems. Retrieved from https://www.seai.ie/grants/home-energy-grants/heat-pump-systems/
- SEAI. 2019. Energy in Ireland 2019 Report. Retrieved from https://www.seai.ie/publications/Energy-in-Ireland-2018.pdf
- Seppala, A. 1995. Statistical distribution of customer load profiles. Paper presented at the Proceedings 1995 International Conference on Energy Management and Power Delivery EMPD’95. Singapore: IEEE.