
 ?Mathematical formulae have been encoded as MathML and are displayed in this HTML version using MathJax in order to improve their display. Uncheck the box to turn MathJax off. This feature requires Javascript. Click on a formula to zoom.
ABSTRACT
The management of energy systems with a high share of renewables is a challenge for grid planners and operators, as weather and energy demand do not always coincide. Investigating the energy autonomy of cities and their local energy resources can help to overcome this challenge. To this end, real energy demand data from the city of Loja, Ecuador, and wind energy generation from a nearby wind farm were compared. This showed that wind energy provides 53% of the city’s demand. It is exposed that despite the excess energy, the wind farm’s ability to supply the city with electricity is limited to about 74% when the wind farm is expanded to twice its rated capacity. The results show that in order to improve the autonomy, other energy sources, such as photovoltaic, as well as useful size energy storage are needed.
1. Introduction
The global economic crisis triggered by the pandemic has shown the fragility of global supply chains (Ivanov Citation2021), especially when it comes to basic food or energy. To build resilience to future supply chain disruptions and ensure basic services to populations everywhere, local food and energy production must be improved and strengthened, including in urban areas (Labussière et al. Citation2018). This scenario will increase the global demand for electricity in the coming decades (Nadaï and Labussière Citation2018). Therefore, the integration of renewable energy will be a crucial feature of urban energy systems (Bareiß Citation2020), which entails a good understanding of the multivector energy networks within a context of an energy transition (P. C. Taylor et al. Citation2022).
Urban energy systems are essential for any city because they need a reliable and abundant source of electrical energy as well as other services such as drinking water, fuels for transportation or food (Montealegre et al. Citation2022). On the other hand, the double crisis of fossil fuels (availability and pollution) forces an urgent and inevitable energy transition toward renewable sources (Eicker Citation2019). In this sense, governments and institutions are making great efforts to reduce dependence on fossil fuels before the fuel shortage becomes apparent (Spyridaki et al. Citation2020). A detailed analysis of electricity use and its relationship with local energy resources, economic activity and the environment provides very valuable information that can be used as a basis for planning the energy transition in urban areas (Droege Citation2018; Johnstone and McLeish Citation2022).
The current energy system must therefore transform to integrate Distributed Energy Resources (DERs) and Demand Response programs (DR) (Kubli, Loock, and Wüstenhagen Citation2018). This paradigm shift brings new challenges for power system management (Darby Citation2020). On the one hand, utilities and distributors need to implement systems to monitor and control the power system in order to integrate distributed generation (Karad and Thakur Citation2021), especially in medium and low voltage grids. On the other hand, electricity consumers, considered in the past as passive subjects, will take an active role as prosumers (Correa-Florez, Michiorri, and Kariniotakis Citation2019). Local energy markets can be an enticing way to involve prosumers in the energy system, and to increase demand side flexibility (Kühnbach, Bekk, and Weidlich Citation2022).
The integration of DERs and DR into the electricity system creates problems with the continuity and reliability of power supply, which raises the need for utility-scale energy storage systems (Mohammad and Mishra Citation2018). Current energy storage systems have limited capacity and can only cover short-term interruptions (Sperstad and Korpås Citation2019). Therefore, in order to have a long-term reliable energy system without fossil fuels, the current energy infrastructure needs to be fundamentally changed (Raunbak et al. Citation2017).
The worst-case scenario is a rapid depletion of fossil fuel reserves (Luque-Ayala, Marvin, and Bulkeley Citation2018), combined with the lack of viable utility scale electricity storage technology that would enable a high penetration of renewables in the energy system (Kim et al. Citation2021). This situation could threaten the medium and long-term viability of electricity systems with current standards of service availability and continuity (Emblemsvåg Citation2022).
Renewable energy sources can meet most of the electricity demand (Rahman et al. Citation2021). However, renewable electricity generation depends on the immediate availability of renewable energy resources (O’Connell, Reynders, and Keane Citation2021). For example, the variability of wind energy is significant even when considering large geographical areas (Basit et al. Citation2019).
The large-scale deployment of DERs at all levels of the electricity system (high, medium and low voltage) requires a back-up of fast-response generation systems to ensure grid stability and quality of supply (Joos et al. Citation2017). When different variable renewable energy systems are combined or deployed over large geographical areas, variability of renewable energy sources is easier to manage as they often compensate for each other (Hrnčić et al. Citation2021). Characterizing DERs over large areas is a task necessary to optimize the energy mix to reduce variability (Syranidou et al. Citation2020). DERs generation simulations are a first step toward this optimization (Icaza et al. Citation2018; Reyes et al. Citation2017), but they lack comparison with electricity demand.
The ability of wind energy to reliably generate electricity is directly related to wind resource characteristics (von Krauland et al. Citation2021). Therefore, it is important to obtain wind quality data to reduce uncertainty and improve forecasts to match generation and demand (Thornton et al. Citation2017). Forecasting errors have a negative impact on power system management, especially in areas with high wind power penetration (Spodniak, Ollikka, and Honkapuro Citation2021).
1.1. Overview on urban energy autonomy
Wind and solar PV capacity within an urban context is increasing rapidly. However, their integration depends on the characteristics of each city, its location, climate and landscape (Delponte and Schenone Citation2020). It also depends on the city size, population density, electricity grid robustness and energy demand profile. This section takes on the state of the art regarding these arguments, focusing specifically on the renewable energy integration in urban areas’ networks to improve their energy autonomy (Juntunen and Martiskainen Citation2021).
There is currently a growing debate concerning the role of decentralized and distributed solution, since energy regulations are not a responsibility of local governments (Lazaro et al. Citation2022). It is therefore required to generate evaluation methods that allow the cooperation between the different actors to promote local energy transition projects and solutions, and assist the local governments in their investment decisions (Ha and Kumar Citation2021).
There are some studies that address the integration of renewable energy in urban areas, but they mostly rely on simulations of implausible scenarios based on little to none measured data (Minin and Furtaev Citation2018). Kühnbach et al., propose a model to optimize the expansion of solar PV capacity and storage in 166 regions of southern Germany, and assesses the autonomy level of a decentralized electric grid, which gives a great excess installed capacity (Kühnbach et al. Citation2020).
Icaza et al. simulate the renewable energy sources in order to ensure a 100% renewable electricity generation in mid-sized cities in Ecuador (Icaza, Borge-Diez, and Galindo Citation2021), and assesses the state of a 100% renewable electricity system in Ecuador (Icaza, Borge-Diez, and Galindo Citation2022). However, finding the link between uncertainties in wind generation and local demand side management can help in the integration of wind energy in power grids (Ahmed et al. Citation2020).
In order to create self-sufficient urban electricity grids it is necessary to lay down the infrastructure (power lines, storage facilities) required to continuously manage energy. This is both a technical and a financial challenge (Arroyo and Miguel, Citation2020). This paper introduces a system which we believe will allow the quantification and comparison of both generation and consumption data in real time. These results can be used to manage the power grid as well as to assist decision makers in their investment plans. The study of the city of Loja, Ecuador, and its neighboring wind farm fills this knowledge gap (Maldonado-Correa et al. Citation2020).
1.2. Context of the case study
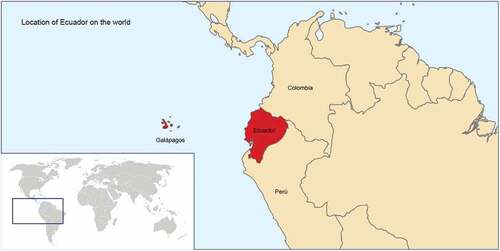
Ecuador is located in the west South America (see ). Ecuador is bordered by Pacific Ocean to the west, Colombia to the north, and Peru to the southeast, between 81.03° W-75.16° W, 1.48° N-5.04° S (Erazo et al. Citation2018).
Figure 1. Location of Ecuador on the world.
The climate of Ecuador is tropical and varies according to altitude and region, due to the different altitudes and, to some extent, the proximity to the equator (Moreno, Bernal, and Espinosa Citation2018).
The coastal lowlands in the western part of Ecuador are typically warm, with temperatures around 25°C. The coastal areas are influenced by ocean currents and are hot and rainy between January and April.
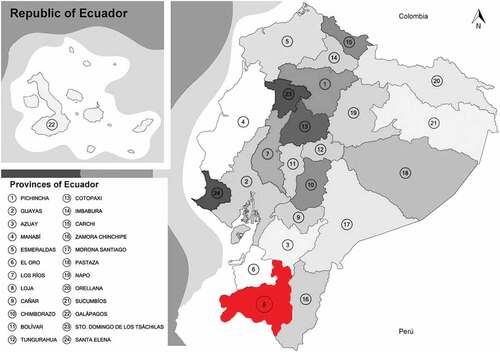
shows the location of Loja, Ecuador. The weather in Loja is that of a subtropical highland climate. The average daytime temperature is 21°C, which drops to a minimum of 10°C on average at night. The average annual temperature is 18°C, with daily averages ranging from 16°C to 30°C (Benítez, Armijos, and Calva Citation2021).
Figure 2. Location of Loja, Ecuador.
According to ARCONEL (Ecuador’s electricity system regulator), 64% of electricity in the country is generated from hydropower, while 35% is of thermal origin. The remaining 1% is from other renewable sources (wind, photovoltaic, biogas, biomass) (Carvajal et al. Citation2019). See for a detailed breakdown of electricity generation in Ecuador.
Table 1. Effective Power in Electric Power Generation of Ecuador.
Loja is located in the southern part of the country, on the border with Peru, at an altitude of 2057 m above sea level (a.s.l.) (Solano et al. Citation2021). The history of wind generation in mainland Ecuador began in 2012 with the construction of the first large-scale wind farm (16.5 MW) on the hills of Villonaco near the town of Loja (Hernandez, Maldonado‐Correa, and Méndez Citation2016).
NIS has 133 power plants with a total capacity of 8073 MW, largely hydraulic because the government implemented policies and regulations to promote the development of renewable energy (Guimara˜es Citation2020) and the gross energy generation in April 2020 was 27062 GWh (Ayala-Chauvin et al. Citation2021). On the other hand, the interconnection with Loja is a radial branch of the NIS, as it is not meshed. Therefore, a single failure in the transmission line could isolate Loja from the NIS and leave it without power.
In this sense, the Villonaco wind farm is a strategic project to diversify the energy mix and improve Loja’s resilience to power outages. It also represents an ideal scenario to study a new model of decentralized energy management.
This study compares the electricity demand of an urban area with the electricity supply based on the DERs generation of a nearby wind farm, Villonaco (16.5 MW). Electricity consumption in the urban area follows daily, weekly and annual patterns. Electricity generation depends on wind availability, which is determined by weather conditions, so it has a very high variability, although it also follows a seasonal pattern.
This analysis is based on the aggregated measurements of electricity consumption in the urban area of Loja, measured at the substations, and on the data from the SCADA of the Villonaco wind farm (Maldonado-Correa, Solano, and Rojas-Moncayo Citation2019). The study assumes that the electricity generated by the wind farm is consumed in the urban area and that the National Interconnected System (NIS) of Ecuador covers the rest of the demand, covers generation gaps and serves as a power sink when there is a generation surplus.
The main results from the reconciliation of electricity generation and use data are quantitative. The Villonaco wind farm does not provide a continuous supply in some time intervals, even considering an expansion by a factor of 2, since no electricity is generated when the wind speed is below the cut-in speed of the turbines.
The analysis of power generation shows some degree of seasonality, with January to March having more frequent and longer gaps in power generation, and overall lower power generation than the rest of the year. This knowledge will be useful to set up storage systems for both short term (seconds) and long term (days or weeks).
Finally, this paper presents a practical method that shows that it is possible to implement a low-cost and independent energy management system that allows local companies to manage their energy consumption in a decentralized and autonomous way. Furthermore, the knowledge obtained through this project is an input to local Ecuadorian governments that can be used to support investment decisions regarding energy infrastructure within urban areas.
2. Materials and methods
The method presented in this section is based on the confrontation of the data generation and consumption. The wind farm power generation values were obtained from the wind farm SCADA system. An algorithm was developed to time-synchronize the wind farm power generation and the town’s power demand. This created time synchronous energy values were used to assess the daily, seasonal and annual comparisons between generation and demand.
2.1. Wind resource data
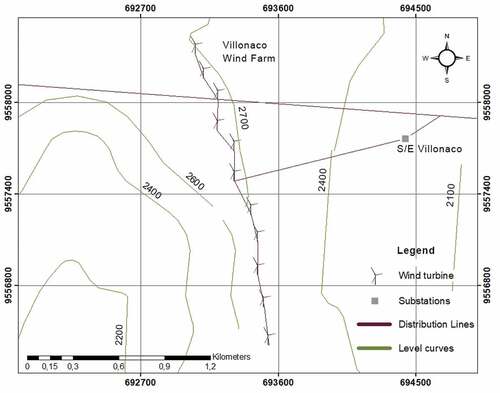
The Villonaco Wind Farm is located in the Loja region on the Villonaco Hill at 2700 meters above sea level in an area considered orographically complex. It was put into operation in 2013 (Perdomo, López-Presa, and Maldonado Citation2016).
The location of the wind farm has wind resources of exceptional quality, due to the temperature difference between the two sides of the Villonaco Mountains with Loja (2100 m a.s.l.) to the west and Catamayo (1000 m a.s.l.) to the east. This orographic peculiarity causes the Foehn effect, with an eastward air movement that generates steady winds in this direction. The result is a high density of wind resource in the area where the wind farm is located. The locals call this type of orographic phenomenon Huayrapungo (wind gate in Quechua language). Wind resources are measured with weather stations located 80 m above the ground, on the nacelle. Data are collected for mean wind speed, wind direction, temperature and air density at 15-minute intervals.
shows the spatial distribution of the wind turbines which consists of 11 direct-drive wind turbines of model GW70/1500 Goldwind with a capacity of 1.5 MW each, corresponding to a total installed capacity of 16.5 MW with mean year production of 59.57 GWh (Sánchez et al. Citation2021).
Figure 3. Villonaco wind farm geographic setting.
2.2. Measurement of the power generation and use variables
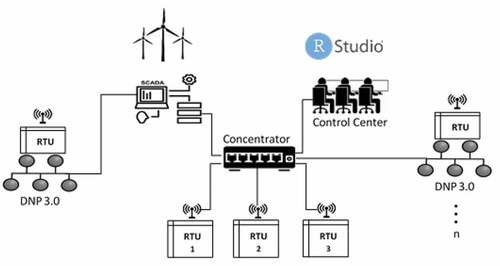
The power variables were measured using DNP 3.0 (Distributed Network Protocol), which is based on the OSI (Open Systems Interconnections) model (Singh, Nivangune, and Patwardhan Citation2017). This is a secure communication protocol that is an industry standard (Richard and Appiah-Kubi Citation2017).
On the other hand, the data analysis processes were performed using the R language in RStudio, an open source tool for statistical analysis and real-time visualization of the data.
shows the automation, monitoring and control systems. These systems mainly consist of the SCADA of the wind farm, a communication concentrator and the RTUs (Remote Terminal Units) (Medrano et al. Citation2018). This equipment is used to measure the data at both ends of the power grid: the generation side at the wind farm and the consumption side at the city substations. In the case of Loja, Ecuador, the measurements were made in 4 substations feeding the circuits of the urban area.
Figure 4. Data acquisition system.
2.3. Integration of the data
The authors have developed code in the R language to integrate the generation and consumption of active power to give the active energy in real time. The integration of the power to give the energy for the superposition period was calculated using an interval integrator based on Riemann’s theorem (Martínez-Cervantes Citation2016) and displayed using RStudio. The theorem states the following:
for all , where
is active power of
and
Where and
are the electricity power generation and demand respectively, and epsilon are binary variables
that allow to generate all the
vertices of the
rectangles dimensioned where they need to be evaluated. Therefore, the sum of the term with
with
, can be read as follows:
term 1 (3)
term 2
term 3
and is an alternating sum over values that takes place at the 2 n vertices of the integration domain, which we refer to simply as a rectangle (Taylor Citation2020). This theorem has been implemented in the RStudio tool for real-time data analysis, integration and visualization. It is an extension of the 1st theorem, known as Barrow Rule (Ponce-Campuzano and Maldonado-Aguilar Citation2014).
2.4. Analysis of the data
Once the information is integrated and the intervals are standardized, statistical analysis is performed to assist the system operator. The statistical analysis is essentially to create a database where you can visually observe the seasonal behavior of the wind.
The generated energy and the energy demand
are the sum of all generated and demanded active power.
The difference in synchronized data for power sources and power loads at 15-minute intervals determines the net energy surplus or deficit in each interval:
In periods when the energy generated is greater than the energy demand
, there is an energy surplus. Otherwise, there is an energy deficit.
(5)
Both data sets, generation and usage, were synchronized and overlaid to produce a time series with 15-minute intervals. The time format used is a standard format (%d-%m-%Y %H:%M:% OS), so it is easy to compare data from different sources.
The data in the frequency column are fitted to the Weibull function using a nonlinear method, and the values of the parameters and
are determined using the RStudio function “nlinfit” – nonlinear regression and “survreg” – regression for a parametric survival model function.
is the flowchart of the proposed method. This method integrates active power variables and calculates the surplus or deficit for each interval. It also compares the measured data with the modelled production forecasts. Finally, the results are printed to provide insights into skewness, tail behavior, presence of multimodal behavior, and data outliers. The histograms can be compared to the basic shapes associated with standard analytical distributions.
Figure 5. Flow diagram of the method.
A wind turbine operates when the wind speed is above a minimum value (cut-in) and below a maximum value (cutout). To calculate the number of hours that the wind turbine has generated electrical energy, the current data is fitted to the Weibull statistical model (Datsiou and Overend Citation2018; Jiang et al. Citation2015).
Therefore, this RStudio tool allows system operators to perform real-time analysis of power generation and usage within the system and use this information to plan ahead and develop energy management strategies. The tool is also open source, low cost and easy to implement (Campbell Citation2019; Tyralis et al. Citation2017).
3. Results
The results presented in this section are based on wind analysis and data comparison between electricity generation and consumption. Additionally, annual and per day generation and consumption curves are presented.
3.1. Wind data
The readings show an annual pattern characterized by strong winds between July and September and lower wind availability from January to April, resulting in frequent generation gaps during these months. This illustrates the natural shortcomings of renewable energy systems and how they affect the continuity of electricity generation, and highlights some of the challenges in managing renewable energy systems. This case is about managing a wind farm as the main source of energy with the support of National Interconnected System, to fill generation gaps.
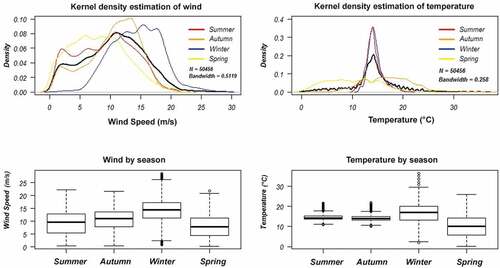
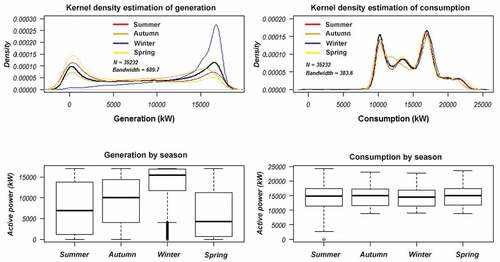
was created by applying the function “density ()” Kernel Density Estimation of the software RStudio. The generic density function computes kernel density estimates for wind and temperature at Villonaco. The default method does this with the given kernel and bandwidth for univariate observations. Graphs are created using plot(density(x)), where x is a numerical vector (Shi and Chen Citation2021). In addition, the wind rose and wind frequency distribution are shown. The mean annual wind speed and temperature in 2019 are 10.5 m/s and 13.5°C, respectively.
Figure 6. Wind Speed, temperature, wind rose and frequency distribution of Villonaco.
The weather data collected from the towers show the three-season climate of the Loja region with a warm rainy season (summer: 1 December to 28 February, autumn: 1 March to 31 May), a cool dry season (winter: 1 June to 31 August) and a warm dry season (spring: 1 September to 30 November).
shows the boxplot of wind speed and temperature by season. Summer and autumn are characterized by rainfall, mean temperature is 15°C and mean wind speed is 10 m/s and 13 m/s, respectively. In spring, precipitation is lower, the mean temperature is 10°C and the mean wind speed is 8 m/s. Finally, winter is characterized by temperatures between 17 and 18°C and a mean wind speed of 15 m/s. Moreover, it can be seen that the kernel density estimate of the wind in winter is characterized by winds between 5 and 20 m/s with an average of 15 m/s, all within the power curve of the wind turbines.
Figure 7. Wind speed and temperature per seasons.
By using the Compute Tukey Honest Significant Differences (TukeyHSD) function of RStudio, it was found that summer and autumn are quite similar seasons. Therefore, 3 periods can be considered in the study area: Summer and Autumn from December 1 to May 31, Winter from June 1 to August 31, and Spring from September 1 to November 30 (Alavipanah et al. Citation2015; Hui Citation2018).
3.2. Electricity generation
The study period was set from May 2018 to April 2019, as the quality of the data was good for a full year, with very few missing data (< 0.2%).
shows the integrated generation of the Villonaco wind farm for the study period, which amounts to 87778 MWh. Moreover, the analysis of the last 3 periods shows a very regular annual generation, with 87400 MWh in 2017 and 87700 MWh in 2018, which makes the wind farm a very reliable and consistent energy producer, with little variation from year to year.
Figure 8. Generation of the Villonaco Wind Farm.
The generation corresponds to the three weather periods in the Loja region, with a warm rainy period (summer: December 1 to February 28, autumn: March 1 to May 31), a cool dry period (winter: June 1 to August 31) and a warm dry period (spring: September 1 to November 30).
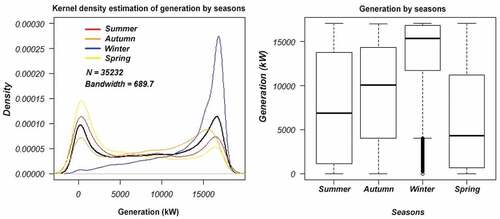
The measured data from the wind turbine in Ecuador were used to simulate the kernel density curve, which allowed the comparison of the curves by season, as shown in . From this comparison, it can be deduced that there is a higher power generation in winter.
Figure 9. Generation per seasons.
3.3. Electricity use
Electricity use data for the urban area of Loja were provided by Empresa Eléctrica Regional del Sur (EERSSA), the local utility, and aggregated at the substation level for this study. These are high quality data that characterize the energy consumption of the urban area in 15-minute intervals over a 5-year period.
As with the generation data, the period selected for this study was May 2018 through April 2019, as shown in .
Figure 10. Electricity use in the urban area of Loja from May 2018 to April 2019.
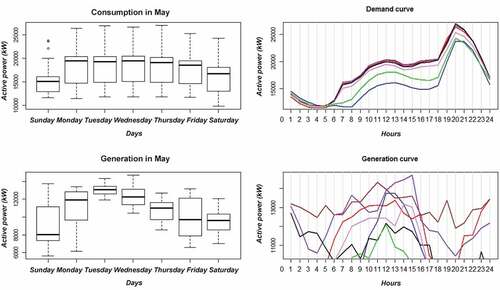
The total electricity use for the study period was 156191 MWh, and the maximum active power was registered on Friday, March 4, 2019, at 19:30, with a peak demand of 29689 kW.
shows one of the main contributions of this section, a realistic load profile and urban electricity consumption data that can be used by researchers and utilities. The consumption curve shows a high peak demand from 19:00 to 22:00. According to the Ecuadorian Ministry of Energy, this is due to lighting and other electrical appliances, so it is necessary to promote energy efficiency plans to flatten the consumption curve.
Figure 11. Annual electricity demand curve.
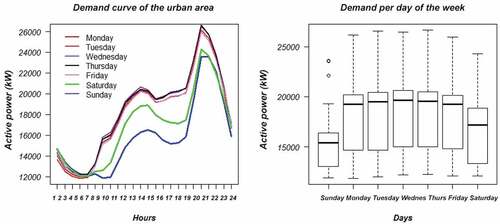
On the other hand, these results illustrate the low performance of the system, since the system is designed for peak power, covering a period of 3 to 4 hours per day, and has a low capacity factor for the rest of the day. Therefore, it is necessary to promote demand management, renewable energy integration, energy conservation and optimization of energy flows to flatten the consumption curve and make better use of energy resources and infrastructure (López Citation2020).
3.4. Confronting urban electricity demand with wind energy supply
In this section, two sets of real data are contrasted, the electricity consumption of the urban area of Loja and the energy generated by Villonaco Wind Farm. Electricity consumption follows well-defined daily and weekly cycles, and wind energy has a seasonal behavior.
For the one-year period with 15-minute intervals, we have 35040 measurements ((8760x60)/15) instead of 35132 measurements. During the study period, the wind farm generated 87778 MWh and the urban area consumed 155987 MWh (see ).
Figure 12. Overlay of generation and usage data, May 2018 – April 2019.
shows the generation of the wind power plant by station. In this section, the results of the measurements of electricity use in the urban area are discussed in detail considering the different seasons. It was found that the usage is uniform in all periods, with an average power of 15000 kW. Nevertheless, there is a small increase in usage in summer, especially in the month of December. On the other hand, the generation is characterized by a high density of power generation in winter with an average of 15000 kW.
Figure 13. Generation and use by seasons.
shows the synchronized data for May 2018. There is a generation gap from May 28 to 30. In normal operation, National Interconnected System covers the rest of Loja’s electricity needs during peak demand and generation gaps.
Figure 14. Superposition of generation and use data, May 2018.
shows the production surplus and deficit for the month of May. The deficit for the month of May was 5342.1 MWh and the surplus was 286.3 MWh. So, in the month of May, surplus availability for storage is low and therefore the national interconnected system supplies energy to meet the deficit.
Figure 15. Surplus/deficit, May 2018.
The generation surplus occurs during off-peak hours and is delivered to National Interconnected System. To maximize the efficiency of the system, it is advisable to use the energy at the time it is generated. One of the ways to achieve this is by adopting demand response strategies that encourage the adjustment of industrial production schedules to the availability of electricity. Electricity can also be stored using storage systems such as batteries or hydrogen, and used either to control and balance the system or for other purposes such as electric mobility or industrial activities that require a lot of electricity.
Alternatively, excess generation can use the National Interconnected System current hydroelectric plants as equivalent storage capacity. In this case, National Interconnected System uses the excess generation from the wind turbines in exchange for energy bonds, through an equivalence between usable excess power and saved water from the dams.
shows generation and consumption per day. The variable nature of wind energy generation and the difficulty to synchronize them is obvious, but the variables can be discretized to optimize the system by determining the storage and discharge capacity per hour (X. Jiang et al. Citation2018; Oree, Sayed Hassen, and Fleming Citation2017). In the case of Loja, the annual charging capacity of a storage system is small. In the following section, several discussion scenarios are considered. One of them is the expansion of the wind farm to improve the storage capacity.
Figure 16. Generation/consumption per day of the week.
These results, based on measured data, are a good basis for discussing energy management strategies or agreements with the National Interconnected System, to avoid energy dumping and achieve a net zero balance for the city.
4. Discussion
Three scenarios are considered in the analysis of electricity generation and demand:
Base scenario. The urban area of Loja and the Villonaco wind farm are connected to the grid National Interconnected System.
Isolated system scenario. The urban area of Loja and the Villonaco wind farm are not connected to the National Interconnected System.
Wind farm expansion scenario. The Villonaco wind farm is expanded to double its capacity (33 MW).
4.1. Base scenario
In the baseline scenario, the urban area of Loja prioritizes the electricity generated by the Villonaco wind farm and relies on National Interconnected System to meet the rest of its electricity needs, especially the peak demand that exceeds the capacity of the wind farm and the generation gaps of the wind farm. However, on the way to a 100% renewable energy system, and considering that Ecuador is facing the post-oil phase, this scenario could be feasible in the long term only during the rainy season, as the NIS generates most of its renewable electricity from hydropower. According to National Energy Center Corporation (CENACE), there are some periods during the dry season when NIS needs up to 40% electricity from thermal power plants to meet the total national electricity demand. Therefore, it is important to consider a scenario in which Loja does not rely on the NIS and has to operate as an isolated system.
In addition, Loja is located at the end of a radial branch of the NIS and is therefore connected to the system by only one power line. This creates an inherent vulnerability with a high risk of temporary isolation of the urban area. In this scenario, it makes sense to optimize grid management using electricity storage.
The third scenario examines the impact of doubling the rated capacity of the wind farm to 33 MW by extending it to the neighboring hills. The expansion consists of adding 11 new wind turbines of the same type as the existing ones, for a total capacity of 33 MW, on the Membrillo and Ducal hills, near Villonaco. In this study, it is assumed that the same wind conditions prevail in the expansion area as in the original site, which is a reasonable assumption given the proximity and the common geographical structure. Therefore, doubling the wind farm capacity in this study results in doubling the energy output. This scenario basically maintains the current conditions where the town receives power from both Villonaco and the NIS to compensate for the fluctuations of the wind farm.
In addition, there are two other scenarios that include Loja as an isolated system and the expansion of the current wind farm by a factor of 2.
4.2. Isolated system scenario
In this scenario, the Villonaco wind farm is considered as the only source of electricity for the urban area of Loja. This is a plausible situation since Loja’s power grid is connected to the NIS through a single 138 kV power line, and thus only one outage away from being isolated.
To maintain a reliable power supply in an isolated environment, the electrical system must include energy storage and management systems. Comparing the energy supplied by the wind farm to the city’s electricity needs gives an idea of the storage requirements and additional electricity generation that Loja would need to install as an isolated system.
Ecuador’s electricity system, like most electricity systems in the world, matches electricity generation to the system’s electricity demand at any given time. Large-scale integration of renewable energy sources requires to change the system with a completely different approach to energy management, matching energy demand to resource availability to maximize system efficiency.
shows the generation surplus and generation deficit of the system Villonaco-Loja over a period of 1 years, from May 1, 2018 to April 30, 2019. The total energy consumption during this period was 155987 MWh, while the wind farm generated 87778 MWh, which corresponds to a total deficit of 71774 MWh, i.e. 46% of the total energy demand of Loja. The rest of the demand was met by the NIS.
Figure 17. Surplus/Deficit of the Villonaco-Loja May 2018 to April 2019.
Direct energy demand response was 84212 MWh, 53% of demand and 96% of generation, and there was a generation surplus totaling 3565 MWh that could not be absorbed by the City and was delivered to NIS.
summarizes the monthly values for wind farm energy generation, city energy use, deficit and surplus, direct supply and net balance of the Villonaco-Loja system. The net balance with NIS showed a deficit of 68209 MWh, which is 43.7% of Loja’s electricity usage.
Table 2. Wind generation, energy use, surplus and deficit, energy balance.
In November and from January to April, wind resources are scarcer and direct supply is low. The energy deficit exceeds 50% of demand during this period. In addition, the current system generates only a very small surplus (2.6% of total energy consumption), and it is neither practical nor economical to invest time, effort, and money in storage or DR systems under these conditions. In addition, the operation of the Villonaco-Loja isolated system also requires a highly automated control system for the medium and low voltage networks to ensure supply quality and stability.
Therefore, energy policies to incentivize the use of efficient technologies at a household level are needed (Tsao, Vu, and Lu Citation2021).
4.3. Villonaco wind farm expansion scenario
According to the preliminary study by the Ecuadorian Ministry of Energy, the wind farm can be expanded to the neighboring Ducal and Membrillo hills, which have similar wind conditions to Villonaco hill. The resulting installed capacity of 33 MW exceeds the average peak demand by 25%, and the energy generated by the expanded wind farm is 175611 MWh, 13% higher than the yearly city energy use.
shows that the expanded wind farm directly supplies 115890 MWh (74% of the total demand) during the study period, while the total surplus is 59665 MWh and the total deficit is 40096 MWh. This means that the electricity generation is sufficient to theoretically meet 100% of the energy demand of the urban area. In practice, these values need to be adjusted taking into account the efficiency and limitations of the storage systems, such as energy and power limits and operating range.
Table 3. Wind generation, energy use, surplus and deficit, energy balance expansion.
Considering NIS as a perfect virtual storage system (infinite power and capacity, and 100% efficiency), the net balance is positive with NIS totaling 19568 MWh.
This scenario shows that the expansion of the wind farm could make the urban area of Loja a self-sufficient electricity producer, as long as a utility-sized energy storage system is installed in order to manage the generation surplus.
In a global context in which energy demand is increasing at an exponential rate due to population growth, it is necessary to optimize the exploitation of renewable resources to achieve energy sustainability (Bilgen and Sarıkaya Citation2018). In this sense, a challenge for energy system designers is to analyze the feasibility of combined wind and solar systems with storage systems (Ruiz et al. Citation2019). However, recent studies show that for an installed power of 9 MW, storage systems are not feasible, but for higher powers (Akyürek and Türkay Citation2017).
Ecuador is studying the integration of Storage Systems to improve the performance of hydropower plants, and their role in tackling demand variability, improving power quality and also to phase out more polluting power plants (Posso Rivera et al. Citation2022).
The region of Loja, Ecuador, presents an interesting solar potential that would allow the implementation of photovoltaic solar technology (Cevallos-Sierra and Ramos-Martin Citation2018), this combined with the extension of the Villonaco Wind Power Plant would increase the installed power and possibly improve energy autonomy, however, it is necessary to conduct a feasibility study.
In the social sphere, the positive influence of the Villonaco Wind Power Plant, the improvement of road infrastructure, educational equipment and public lighting has been verified (Vicuña and Pérez Citation2020), therefore, future research should consider the analysis of the impact of economic and social in the area of influence (Costa-Campi, Jové-Llopis, and Trujillo-Baute Citation2019).
5. Conclusions and policy implications
The current situation of climate change and resource scarcity encourages communities to rely as much as possible on local resources to increase resilience, especially in critical supply chains such as food or energy. Therefore, locating critical supplies should be a priority for urban planners in the coming decades. For energy supply, this means using distributed energy resources such as wind, solar or hydro power in different proportions depending on what is available in each area.
Managing a DERs based energy system presents a new set of challenges due to the limited control of energy resources and their real-time nature. Therefore, real-time data acquisition and processing systems are key to managing this type of network. The model presented in this paper manages this real-time data collection and processing for both generation and demand, providing easy-to-understand information for urban planners and network managers that can be used to develop day-to-day and medium-term strategies and policies for sustainable management and development. These strategies include demand reduction programs for large consumers to manage the grid in real time, or measures to flatten and shape the demand curve to better match generation and thus improve the long-term stability of the system.
Moreover, this model is implemented using an open source tool (RStudio), so it is flexible and inexpensive.
The city of Loja in Ecuador is located in a geographical environment that generates constant easterly winds throughout the year, with little seasonal variation due to its proximity to the equator, being January to April being the months with the least amount of wind. This makes wind energy the best option as the main renewable local energy source for the city.
Villonaco Power Station is a 16.5 MW wind farm located on the nearby hills of Villonaco. Due to the excellent quality of wind resources in the area, it has a remarkable annual capacity factor of about 54%.
The comparison between the wind farm’s electricity production and the city’s electricity consumption shows that 53% of the real-time demand can be met by the wind farm in its current configuration, with very little excess production during off-peak hours.
A hypothetical expansion of the wind farm to 33 MW would result in 74% of the City’s electricity demand being met directly, even though the total annual output of the wind farm exceeds the total annual demand. Further expansions of the wind farm do not result in a significant increase in direct coverage. This is because the periods not covered are due to lack of wind rather than lack of capacity.
However, the Electricity Plan of the Energy and Resources Ministry of Ecuador considers the development of unconventional renewable resources, including a 110 MW expansion of the Villonaco wind farm in Loja with Villonaco II and III. Another 50 MW wind project called Minas de Hascachaca, also in the Loja province, is projected for 2023. This project will be 100% funded with private capital thanks to the recent opening of the energy sector to private actors.
Therefore, if the system is to be self-sufficient, a power storage system with the capacity to supply the city with power for a few days would need to be established. Such a storage system is a technical and financial challenge, and currently the preferred option is to sell the excess energy to the national grid operator.
The main contribution of this study is the creation of a tool to analyze and compare consumption and generation data in real time, which can be used by grid operators, policy makers and researchers to improve energy use and efficiency and to educate the public. The tool is also flexible enough to be used in grids of different sizes and with any generation mix, helping grid operators in the Global South.
Acronyms and Nomenclature
ARCONEL - Ecuador’s electricity system regulator.
DERs - Distributed Energy Resources.
DNP - Distributed Network Protocol.
DR - Demand Response.
NIS - National Interconnected System.
OSI - Open Systems Interconnections.
RTUs - Remote Terminal Units.
SCADA - Supervisory control and data acquisition.
- generated energy
- energy demand
- active power
- power generation
– power demand
Disclosure statement
No potential conflict of interest was reported by the author(s).
References
- Ahmed, S. D., F. S. M. Al-Ismail, M. Shafiullah, F. A. Al-Sulaiman, and I. M. El-Amin. 2020. Grid Integration Challenges of Wind Energy: A Review. IEEE Access 8 (type 1):10857–23. doi:10.1109/ACCESS.2020.2964896.
- Akyürek, B., and B. E. Türkay. 2017. The prediction and penetration of wind energy with storage system analysis. Energy Sources, Part B: Economics, Planning, and Policy 12 (3):211–15. doi:10.1080/15567249.2015.1036330.
- Alavipanah, S., M. Wegmann, S. Qureshi, Q. Weng, and T. Koellner. 2015. The Role of Vegetation in Mitigating Urban Land Surface Temperatures: A Case Study of Munich, Germany during the Warm Season. Sustainability 7 (4):4689–706. doi:10.3390/su7044689.
- Arroyo, F. R., and L. J. Miguel. 2020. The Role of Renewable Energies for the Sustainable Energy Governance and Environmental Policies for the Mitigation of Climate Change in Ecuador. Energies 13 (15):3883. doi:10.3390/en13153883.
- Ayala-Chauvin, M., C. Samaniego-Ojeda, G. Riba, and J. Maldonado-Correa (2021). Lifecycle Assessment of Electricity Generation transition in Ecuador BT - Innovations in Electrical and Electronic Engineering (S. Mekhilef, M. Favorskaya, R. K. Pandey, and R. N. Shaw (eds.); pp. 1–10). Springer, Singapore. doi:10.1007/978-981-16-0749-3_1.
- Bareiß, K. 2020. Potential of power-to-heat from excess wind energy on the city level. Energy Sources, Part B: Economics, Planning and Policy 15 (1):26–43. doi:10.1080/15567249.2020.1740358.
- Basit, A., T. Ahmad, A. Yar Ali, K. Ullah, G. Mufti, and A. D. Hansen. 2019. Flexible Modern Power System: Real-Time Power Balancing through Load and Wind Power. Energies 12 (9):1710. doi:10.3390/en12091710.
- Benítez, Á., L. Armijos, and J. Calva. 2021. Monitoring Air Quality with Transplanted Bryophytes in a Neotropical Andean City. Life 11 (8):821. doi:10.3390/life11080821.
- Bilgen, S., and İ. Sarıkaya. 2018. Energy conservation policy and environment for a clean and sustainable energy future. Energy Sources, Part B: Economics, Planning, and Policy 13 (3):183–89. doi:10.1080/15567249.2017.1423412.
- Campbell, M. (2019). RStudio Projects BT - Learn RStudio IDE: Quick, Effective, and Productive Data Science (M. Campbell (ed.); pp. 39–48). Berkeley, CA: Apress. doi:10.1007/978-1-4842-4511-8_4
- Carvajal, P. E., F. G. N. Li, R. Soria, J. Cronin, G. Anandarajah, and Y. Mulugetta. 2019. Large hydropower, decarbonisation and climate change uncertainty: Modelling power sector pathways for Ecuador. Energy Strategy Reviews 23:86–99. doi:10.1016/j.esr.2018.12.008.
- Cevallos-Sierra, J., and J. Ramos-Martin. 2018. Spatial assessment of the potential of renewable energy: The case of Ecuador. Renewable and Sustainable Energy Reviews 81:1154–65. doi:10.1016/J.RSER.2017.08.015.
- Correa-Florez, A. C., A. Michiorri, and G. Kariniotakis. 2019. Comparative Analysis of Adjustable Robust Optimization Alternatives for the Participation of Aggregated Residential Prosumers in Electricity Markets. Energies 12 (6):1019. doi:10.3390/en12061019.
- Costa-Campi, M. T., E. Jové-Llopis, and E. Trujillo-Baute. 2019. Energy poverty in Spain: An income approach analysis. Energy Sources, Part B: Economics, Planning, and Policy 14 (7–9):327–40. doi:10.1080/15567249.2019.1710624.
- Darby, S. J. 2020. Demand response and smart technology in theory and practice: Customer experiences and system actors. Energy Policy 143 (July 2019):111573. doi:10.1016/j.enpol.2020.111573.
- Datsiou, K. C., and M. Overend. 2018. Weibull parameter estimation and goodness-of-fit for glass strength data. Structural Safety 73:29–41. doi:10.1016/j.strusafe.2018.02.002.
- Delponte, I., and C. Schenone. 2020. RES Implementation in Urban Areas: An Updated Overview. Sustainability 12 (1):382. doi:10.3390/su12010382.
- Droege, P. 2018. Urban Energy Transition: Renewable Strategies for Cities and Regions. Amsterdam: Elsevier.
- Eicker, U. 2019. Introduction: The challenges of the urban energy transition (London). 1–15. doi: 10.1016/B978-0-12-811553-4.09993-5.
- Emblemsvåg, J. 2022. Wind energy is not sustainable when balanced by fossil energy. Applied Energy 305. doi:10.1016/j.apenergy.2021.117748.
- Erazo, B., L. Bourrel, F. Frappart, O. Chimborazo, D. Labat, L. Dominguez-Granda, D. Matamoros, and R. Mejia. 2018. Validation of Satellite Estimates (Tropical Rainfall Measuring Mission, TRMM) for Rainfall Variability over the Pacific Slope and Coast of Ecuador. Water 10 (2):213. doi:10.3390/w10020213.
- Guimara˜es, L. 2020. The Regulation and Policy of Latin American Energy Transitions. Amsterdam: Elsevier Science & Technology.
- Ha, Y.-H., and S. S. Kumar. 2021. Investigating decentralized renewable energy systems under different governance approaches in Nepal and Indonesia: How does governance fail? Energy Research & Social Science 80:102214. doi:10.1016/j.erss.2021.102214.
- Hernandez, W., J. L. Maldonado‐Correa, and A. Méndez. 2016. Frequency‐domain analysis of performance of a wind turbine. Electronics Letters 52 (3):221–23. doi:10.1049/el.2015.2711.
- Hrnčić, B., A. Pfeifer, F. Jurić, N. Duić, V. Ivanović, and I. Vušanović. 2021. Different investment dynamics in energy transition towards a 100% renewable energy system. Energy 237:121526. doi:10.1016/j.energy.2021.121526.
- Hui, E. G. M. 2018. Learn R for Applied Statistics: With Data Visualizations, Regressions, and Statistics. Berkeley, CA: Apress.
- Icaza, D., D. Borge-Diez, and S. P. Galindo. 2021. Proposal of 100% renewable energy production for the City of Cuenca- Ecuador by 2050. Renewable Energy 170:1324–41. doi:10.1016/j.renene.2021.02.067.
- Icaza, D., D. Borge-Diez, and S. Galindo. 2022. Analysis and proposal of energy planning and renewable energy plans in South America: Case study of Ecuador. Renewable Energy 182:314–42. doi:10.1016/j.renene.2021.09.126.
- Icaza, D., C. Salinas, D. Moncayo, F. Icaza, A. Cárdenas, and M. A. Tello (2018). Production of Energy in the Villonaco Wind Farm in Ecuador. 2018 World Engineering Education Forum - Global Engineering Deans Council (WEEF-GEDC), 1–7. doi:10.1109/WEEF-GEDC.2018.8629596
- Ivanov, D. 2021. Supply Chain Viability and the COVID-19 pandemic: A conceptual and formal generalisation of four major adaptation strategies. International Journal of Production Research 59 (12):3535–52. doi:10.1080/00207543.2021.1890852.
- Jiang, X., G. Nan, H. Liu, Z. Guo, Q. Zeng, and Y. Jin. 2018. Optimization of Battery Energy Storage System Capacity for Wind Farm with Considering Auxiliary Services Compensation. Applied Sciences 8 (10):1957. doi:10.3390/app8101957.
- Jiang, P., Y. Xing, X. Jia, and B. Guo. 2015. Weibull Failure Probability Estimation Based on Zero-Failure Data. Mathematical Problems in Engineering 2015:681232. doi:10.1155/2015/681232.
- Johnstone, P., and C. McLeish. 2022. World wars and sociotechnical change in energy, food, and transport: A deep transitions perspective. Technological Forecasting and Social Change 174:121206. doi:10.1016/j.techfore.2021.121206.
- Joos, G., J. Reilly, W. Bower, and R. Neal. 2017. The Need for Standardization: The Benefits to the Core Functions of the Microgrid Control System. IEEE Power and Energy Magazine 15 (4):32–40. doi:10.1109/MPE.2017.2690518.
- Juntunen, J. K., and M. Martiskainen. 2021. Improving understanding of energy autonomy: A systematic review. Renewable and Sustainable Energy Reviews 141:110797. doi:10.1016/j.rser.2021.110797.
- Karad, S., and R. Thakur. 2021. Efficient monitoring and control of wind energy conversion systems using Internet of things (IoT): A comprehensive review. Environment, Development and Sustainability 23 (10):14197–214. doi:10.1007/s10668-021-01267-6.
- Kim, J. H., A. D. Mills, R. Wiser, M. Bolinger, W. Gorman, C. Crespo Montañes, and E. O’Shaughnessy. 2021. Project developer options to enhance the value of solar electricity as solar and storage penetrations increase. Applied Energy 304. doi:10.1016/j.apenergy.2021.117742.
- Kubli, M., M. Loock, and R. Wüstenhagen. 2018. The flexible prosumer: Measuring the willingness to co-create distributed flexibility. Energy Policy 114:540–48. doi:10.1016/j.enpol.2017.12.044.
- Kühnbach, M., A. Bekk, and A. Weidlich. 2022. Towards improved prosumer participation: Electricity trading in local markets. Energy 239:122445. doi:10.1016/j.energy.2021.122445.
- Kühnbach, M., S. Pisula, A. Bekk, and A. Weidlich. 2020. How much energy autonomy can decentralised photovoltaic generation provide? A case study for Southern Germany. Applied Energy 280:115947. doi:10.1016/j.apenergy.2020.115947.
- Labussière, O., V. Banos, A. Fontaine, E. Verdeil, and A. Nadaï (2018). The Spatialities of Energy Transition Processes BT - Energy Transitions: A Socio-technical Inquiry (O. Labussière and A. Nadaï (eds.); pp. 239–75). Cham, Switzerland: Springer International Publishing. 10.1007/978-3-319-77025-3_6
- Lazaro, L. L. B., R. S. Soares, C. Bermann, F. M. A. Collaço, L. L. Giatti, and S. Abram. 2022. Energy transition in Brazil: Is there a role for multilevel governance in a centralized energy regime? Energy Research & Social Science 85:102404. doi:10.1016/j.erss.2021.102404.
- López, M. 2020. Daylight effect on the electricity demand in Spain and assessment of Daylight Saving Time policies. Energy Policy 140:111419. doi:10.1016/j.enpol.2020.111419.
- Luque-Ayala, A., S. Marvin, and H. Bulkeley. 2018. Rethinking Urban Transitions: Politics in the Low Carbon City. London: Taylor & Francis.
- Maldonado-Correa, J., J. C. Solano, and M. Rojas-Moncayo. 2019. Wind power forecasting: A systematic literature review. Wind Engineering 0309524X19891672. doi:10.1177/0309524X19891672.
- Maldonado-Correa, J., M. Valdiviezo-Condolo, M. S. Viñan-Ludeña, C. Samaniego-Ojeda, and M. Rojas-Moncayo. 2020. Wind power forecasting for the Villonaco wind farm. Wind Engineering 0309524X2096881. doi:10.1177/0309524X20968817.
- Martínez-Cervantes, G. 2016. Riemann integrability versus weak continuity. Journal of Mathematical Analysis and Applications 438 (2):840–55. doi:10.1016/j.jmaa.2016.01.054.
- Medrano, K., D. Altuve, K. Belloso, and C. Bran (2018). Development of SCADA using a RTU based on IoT controller. 2018 IEEE International Conference on Automation/XXIII Congress of the Chilean Association of Automatic Control (ICA-ACCA). Valparaíso, Chile, 1–6. doi:10.1109/ICA-ACCA.2018.8609700.
- Minin, V. A., and A. I. Furtaev (2018). Prospects for the Development of Wind Energy Resources in the Western Sector of the Arctic Zone of Russia. 2018 International Multi-Conference on Industrial Engineering and Modern Technologies (FarEastCon). Vladivostok, Russia, 1–4. doi: 10.1109/FarEastCon.2018.8602694.
- Mohammad, N., and Y. Mishra. 2018. The Role of Demand Response Aggregators and the Effect of GenCos Strategic Bidding on the Flexibility of Demand. Energies 11 (12):3296. doi:10.3390/en11123296.
- Montealegre, A. L., S. García-Pérez, S. Guillén-Lambea, M. Monzón-Chavarrías, and J. Sierra-Pérez. 2022. GIS-based assessment for the potential of implementation of food-energy-water systems on building rooftops at the urban level. Science of the Total Environment 803. doi:10.1016/j.scitotenv.2021.149963.
- Moreno, J., G. Bernal, and J. Espinosa (2018). Introduction - The Soils of Ecuador (J. Espinosa, J. Moreno, and G. Bernal (eds.); pp. 1–25). Cham, Switzerland: Springer International Publishing. 10.1007/978-3-319-25319-0_1.
- Nadaï, A., and O. Labussière (2018). New Energy Resources in the Making BT - Energy Transitions: A Socio-technical Inquiry (O. Labussière and A. Nadaï (eds.); pp. 49–100). Cham, Switzerland: Springer International Publishing. 10.1007/978-3-319-77025-3_2.
- O’Connell, S., G. Reynders, and M. M. Keane. 2021. Impact of source variability on flexibility for demand response. Energy 237:121612. doi:10.1016/j.energy.2021.121612.
- Oree, V., S. Z. Sayed Hassen, and P. J. Fleming. 2017. Generation expansion planning optimisation with renewable energy integration: A review. Renewable and Sustainable Energy Reviews 69:790–803. doi:10.1016/j.rser.2016.11.120.
- Perdomo, W., J. López-Presa, and J. Maldonado. 2016. Power Performance Verification of a Wind Farm Using the Friedman’s Test. Sensors 16:816. doi:10.3390/s16060816.
- Ponce-Campuzano, J. C., and M. Á. Maldonado-Aguilar. 2014. The fundamental theorem of calculus within a geometric context based on Barrow’s work. International Journal of Mathematical Education in Science and Technology 45 (2):293–303. doi:10.1080/0020739X.2013.822586.
- Posso Rivera, F., J. Zalamea, J. L. Espinoza, and L. G. Gonzalez. 2022. Sustainable use of spilled turbinable energy in Ecuador: Three different energy storage systems. Renewable and Sustainable Energy Reviews 156:112005. doi:10.1016/j.rser.2021.112005.
- Rahman, M., S. Tanzil, R. H. Ritu, and D. M. Kamunya (2021). Geographical distribution of renewable energy production for maximum efficiency and environmental sustainability. 2021 9th International Conference on Modern Power Systems (MPS). Cluj-Napoca, Romania, 1–6. doi: 10.1109/MPS52805.2021.9492681.
- Raunbak, M., T. Zeyer, K. Zhu, and M. Greiner. 2017. Principal Mismatch Patterns Across a Simplified Highly Renewable European Electricity Network. Energies 10 (12):1934. doi:10.3390/en10121934.
- Reyes, A., P. H. Ibargüengoytia, J. D. Jijón, T. Guerrero, U. A. García, and M. Borunda (2017). Wind Power Forecasting for the Villonaco Wind Farm Using AI Techniques BT - Advances in Soft Computing (O. Pichardo-Lagunas and S. Miranda-Jiménez (eds.); pp. 226–36). Cham, Switzerland: Springer International Publishing. doi:10.1007/978-3-319-62428-0_19.
- Richard, A., and P. Appiah-Kubi. 2017. Design and performance of a split protocol architecture on Distributed Network Protocol. 2017 IEEE International Conference on Electro Information Technology (EIT) 3 (DNP3):249–53. doi:10.1109/EIT.2017.8053364.
- Ruiz, G. S., S. I. Valencia, I. J. Guevara, and R. J. L. López (2019). Comparative of wind systems vs photovoltaic for the implementation in the electric network of Veracruz Port. 2019 IEEE International Conference on Engineering Veracruz (ICEV), I Boca del Río, Veracruz, Mexico, 1–4. 10.1109/ICEV.2019.8920462.
- Sánchez, S., V. Hidalgo, M. Velasco, D. Puga, P. A. López-Jiménez, and M. Pérez Sánchez. 2021. Parametric study of a horizontal axis wind turbine with similar characteristics to those of the Villonaco wind power plant. Journal of Applied Research in Technology & Engineering 2 (2):51. doi:10.4995/jarte.2021.15056.
- Shi, Y., and N. Chen. 2021. Conditional Kernel Density Estimation Considering Autocorrelation for Renewable Energy Probabilistic Modeling. IEEE Transactions on Power Systems 36 (4):2957–65. doi:10.1109/TPWRS.2020.3046123.
- Singh, C., A. Nivangune, and M. Patwardhan (2017). Function code based vulnerability analysis of DNP3. 2016 IEEE International Conference on Advanced Networks and Telecommunications Systems, ANTS 2016. Bangalore, India. doi:10.1109/ANTS.2016.7947865.
- Solano, J. C., T. Montaño, J. Maldonado-Correa, A. Ordóñez, and M. Pesantez. 2021. Correlation between the wind speed and the elevation to evaluate the wind potential in the southern region of Ecuador. Energy Reports 7:259–68. doi:10.1016/j.egyr.2021.06.044.
- Sperstad, B. I., and M. Korpås. 2019. Energy Storage Scheduling in Distribution Systems Considering Wind and Photovoltaic Generation Uncertainties. Energies 12 (7):1231. doi:10.3390/en12071231.
- Spodniak, P., K. Ollikka, and S. Honkapuro. 2021. The impact of wind power and electricity demand on the relevance of different short-term electricity markets: The Nordic case. Applied Energy 283 (December 2020):116063. doi:10.1016/j.apenergy.2020.116063.
- Spyridaki, N. A., V. Stavrakas, Y. Dendramis, and A. Flamos. 2020. Understanding technology ownership to reveal adoption trends for energy efficiency measures in the Greek residential sector. Energy Policy 140 (March):111413. doi:10.1016/j.enpol.2020.111413.
- Syranidou, C., J. Linssen, D. Stolten, and M. Robinius. 2020. Integration of Large-Scale Variable Renewable Energy Sources into the Future European Power System: On the Curtailment Challenge. Energies 13 (20):5490. doi:10.3390/en13205490.
- Taylor, M. E. 2020. Introduction to Analysis in Several Variables: Advanced Calculus. Rhode Island USA: American Mathematical Society.
- Taylor, P. C., M. Abeysekera, Y. Bian, D. Ćetenović, M. Deakin, A. Ehsan, V. Levi, F. Li, R. Oduro, R. Preece, et al. 2022. An interdisciplinary research perspective on the future of multi-vector energy networks. International Journal of Electrical Power & Energy Systems 135:107492. doi:10.1016/j.ijepes.2021.107492.
- Thornton, H. E., A. A. Scaife, B. J. Hoskins, and D. J. Brayshaw. 2017. The relationship between wind power, electricity demand and winter weather patterns in Great Britain. Environmental Research Letters 12 (6):064017. doi:10.1088/1748-9326/aa69c6.
- Tsao, Y.-C., T.-L. Vu, and J.-C. Lu. 2021. Pricing, capacity and financing policies for investment of renewable energy generations. Applied Energy 303. doi:10.1016/j.apenergy.2021.117664.
- Tyralis, H., G. Karakatsanis, K. Tzouka, and N. Mamassis. 2017. Data and code for the exploratory data analysis of the electrical energy demand in the time domain in Greece. Data in Brief 13:700–02. doi:10.1016/j.dib.2017.06.033.
- Vicuña, D. M., and J. E. Pérez. 2020. La política de energía eólica y sus efectos sobre el desarrollo local. Un análisis a partir del sistema de actores (Loja, Ecuador). Anales de Geografía de La Universidad Complutense 40 (1 SE–Estudios e investigaciones). doi: 10.5209/aguc.69333.
- von Krauland, A.-K., F.-H. Permien, P. Enevoldsen, and M. Z. Jacobson. 2021. Onshore wind energy atlas for the United States accounting for land use restrictions and wind speed thresholds. Smart Energy 3:100046. doi:10.1016/j.segy.2021.100046.