
 ?Mathematical formulae have been encoded as MathML and are displayed in this HTML version using MathJax in order to improve their display. Uncheck the box to turn MathJax off. This feature requires Javascript. Click on a formula to zoom.
ABSTRACT
This study explores the techno-economic feasibility of, both off-grid and on-grid, hybrid renewable energy systems for remote rural electrification in Thala City, located in the highest region of Tunisia, using wind and biomass resources. Employing Hybrid Optimization of Multiple Energy Resources based on different scenarios includes grid-connected and stand-alone configurations with pumped storage hydropower and lead acid battery storage while minimizing the levelized cost of energy, the net present cost, and greenhouse gas emissions. The optimal configuration wind/biomass/pumped-hydro storage/Converter grid-connected, minimizes the levelized cost of energy (LCOE) and net present cost (NPC), resulting in a cost of 501,540 US$ and LCOE of 0.042 US$/kWh. Notably, 7% of electricity is generated from olive mill waste, 69% from wind turbines, and 24% is purchased from the grid. This hybrid system emits 342 tons/year of CO2, 76% less than a grid-alone system, contributing to an annual CO2 reduction of 1000 tons.
1. Introduction
The access to electricity plays a pivotal role in driving socioeconomic development and improving the quality of life. Recognizing its significance, Sustainable Development Goal 7 (SDG 7) aims to achieve universal access to affordable, reliable, sustainable, and modern energy by 2030 (UNDP Citation2023). However, when it comes to electrification some lower and lower-middle-income countries face a double challenge: the access and the reliability of the energy supply. Electrifying rural areas remains a significant obstacle due to geographical isolation, limited infrastructure, low load density, and the fragile social and economic conditions of their scattered population (World Bank Citation2021; Fakih, Ghazalian, and Ghazzawi Citation2020).
Despite progress made in reducing the number of people without electricity access, which has declined from 1 billion in 2016 to 770 million in 2019, the advancements in rural electrification have been considerably slower (Akbas et al. Citation2022). In many lower and lower-middle-income countries, those connected to electricity may also experience frequent and/or long periods of power outages with impact the economic performance of firms (Fakih, Ghazalian, and Ghazzawi Citation2020). The number of power outages per month in the MENA (Middle East and North Africa) region is more than 16 times higher than in high-income OECD countries, and this situation is even worse in South Asian countries (Rehman et al. Citation2021).
Moreover, currently, power production is contributing significantly to climate change threats. The sector is still extensively supported by fossil fuels, being responsible for around 40% of the global CO2 emissions from energy combustion and industrial processes and reaching an all-time high emissions by 2022 due to an increase in power demand in emerging economies (IEA Citation2023). Balancing economic growth and the increase in electricity demand with climate mitigation is thus a challenging task (Rehman et al. Citation2021). Off-grid renewable energy sources (RES) particularly solar, have been promoted as a sustainable way to increase electrification in rural areas in both small stand-alone systems and micro-grids (Mandelli et al. Citation2016). However, the spatiotemporal variability of RES poses a challenge to the power grid’s safe and stable functioning (Karadöl, Yıldız, and Şekkeli Citation2021).
To address this issue Hybrid energy systems (HES), i.e., a combination of multiple renewable energy with/without support of conventional energy sources, have been pointed out as a cost-effective solution for rural electrification, not just reducing fuel consumption and grid development costs (Vendoti, Muralidhar, and Kiranmayi Citation2020) but also overcoming the obstacles of maintaining a safe and stable operation of the power generation (Al Afif, Ayed, and Maaitah Citation2023; Al-Najjar et al. Citation2022; Al-Najjar et al. Citation2020; Aziz et al. Citation2019; Zisos, Sakki, and Efstratiadis Citation2023). Several simulations utilizing various techno-economic modeling tools, particularly the Hybrid Optimization of Multiple Energy Resources software (HOMER), have indicated that HES can improve energy access and also reduce greenhouse gas emissions (GHG) (Ramli et al. Citation2016; Alsafasfeh Citation2015; Romero-Garcia et al. Citation2014; Deb et al. Citation2023) (HOMER-ENERGY. Citation2016); (Rahmat et al. Citation2022; Suresh, Muralidhar, and Kiranmayi Citation2020).
Several authors have been applying HOMER model, to explore diverse combinations of HES and assess its costs and feasibility, tabled in . Vendoti, Muralidhar, and Kiranmayi (Citation2020) for example, analyzed the best-suited configuration of HES to meet the electricity demand in an off-grid Indian village, showing that a combination of PV – Wind – Biomass – Biogas – fuel cell coupled with battery was the cheapest and most dependable solution with a cost of energy of 0.214$/kWh. The same conclusion was achieved by Suresh, Muralidhar, and Kiranmayi (Citation2020) who modeled and optimized off-grid
Table 1. Previous research, system architecture, and key findings summary.
HES for electrifying the cluster of three village hamlets in the Karnataka State in India. The authors have study combinations of HES through Genetic Algorithm and HOMER Pro software, concluding that the combination of biogas-biomass-solar-wind-fuel cell with battery is the optimal solution supplying energy with 0% unmet load at the least cost of energy.Mohsen Moarefdoost (Citation2015) used the same modeling tool to study the feasibility of an off-grid HES for a remote rural area in Iran. An HES of biogas-fueled generator, PV, battery, and converter is the optimal solution to meet the 14.53 kWh/day consumption of the community, leading to a net present cost and a levelized cost of electricity (LCOE) of $93,057 and 0.0933 $/kWh, respectively. Ur Rashid et al. (Citation2022), also designed a technical and economical hybrid system for three regions in the remote areas of Balochistan, Pakistan. Using HOMER Pro software, the authors considered different combinations of fuel cells, generators, batteries, hydrogen tanks, electrolyzers, wind and solar modules, and converters, evaluating its costs regarding net present, electricity, initial project, and operation.
HES analysis has also explored on-grid connected systems, which offer the advantage of increasing demand without overloading the existing network, often susceptible to extensive power outages. In a study conducted by Khan et al. (Citation2020), a techno-economic analysis of grid-connected renewable energy systems using biogas and solar PV-biogas generators was carried out for Meknassy, a town in Tunisia. The HES combining solar PV and biogas emerged as the most cost-effective option, with an LCOE of approximately €0.077/kWh. This represents a 29% reduction in LCOE compared to the optimal system configuration relying solely on biogas connected to the grid.
Al Afif, et al. (Citation2023) investigated the techno-economic viability of a renewable energy system for Al Karak Governorate in Jordan, based on two scenarios, off-grid and on-grid. They conclude that photovoltaic, wind and the national grid with battery storage is the most cost-effective system for the selected location, with 0.024 US$/kWh COE and 298,359 US$ NPC.
Despite the existence of studies focusing on assessing the HES in rural areas, few have been including biomass in their analysis, particularly the use of biowaste, a value source of energy in rural areas, such as in Tunisia. The Tunisian energy landscape is marked by a contested evolution between the stagnation of natural resources and the sustained increase in demand. During the last two decades, the production of hydrocarbons has fluctuated between 6 and 7 million tons/year (Bettaieb Citation2018), while primary energy demand has grown at a rate of 3% per year on average. This phase shift has caused a structural energy deficit to appear since the year 2000. Tunisia has defined a policy aimed at reducing vulnerability and enhancing the security of its supply, in response to the new energy and environmental situation (Jebli and Youssef Citation2013). The country’s energy strategy focuses on promoting the growth and use of RES, such as wind, solar, hydropower, and biowaste which hold significant potential to meet its energy needs (Ben Jebli et al. Citation2015; Brini et al. Citation2017; Dahmouni et al. Citation2011).
Regarding the treatment of biowaste in Tunisia, most of the agro-industrial waste is used as animal feed. However, several of these residues, such as olive mill waste, have high chemical oxygen demand and biological oxygen demand values, as well as a high phenolic compound load, so using this waste as a feedstock for bio and thermal conversion technologies not only helps to produce clean energy, but also helps to reduce olive mill waste, which is a major environmental concern. Tunisia is the world’s fourth-largest producer of olive oil and was expected to have an annual average discharge of 800,000 tons of this highly polluting olive mill waste without any treatment due to a lack of knowledge, the complexity and high costs associated with treatment, and its transport and storage (Azbar et al. Citation2004). Wastes associated with olive oil mills may have a great impact on land and water environments because of their high phytotoxicity. Recently, many studies have suggested anaerobic digestion as a promising process for the effective value creation of olive mill wastes through methane production (Aboelfetoh et al. Citation2022; Rodríguez et al. Citation2022; Ma et al. Citation2020; Rubio et al. Citation2022).
This study aims to contribute to the HES research by focusing on the treatment of olive mill waste using anaerobic digestion and connecting it to other renewable sources in Thala city, in the highest region of Tunisia. It studies the feasibility of utilizing on-grid and standalone HESs based on two renewable sources (wind and biomass) in this remote Tunisian area, addressing the shortage of energy sources, reducing electricity bills of the citizens, mitigating GHG emissions and alleviating poverty and fostering the development of productive activities for job creation. The Organic waste treatment using biogas technology is in line with the Tunisian government’s energy transition strategy, with 100 MW of biogas power planned to be installed by 2030 (GIZ. 2018) under the Paris Agreement commitment. HOMER Software pro is used to investigate the optimal sizing of hybrid renewable energy systems based on two renewable sources, wind, and biomass (olive mill wastes), to meet the electrical needs of Thala city, based on maximizing the renewable energy fraction and minimizing the levelized cost of energy and the net present cost. Sensitivity analysis is performed considering variations in wind speed, biomass availability, the project lifetime, and the nominal discount rate (NDR). This paper addresses a research gap by examining the importance of utilizing biogas derived from olive oil industry waste as a potential renewable energy source. It highlights the potential significance of this waste as a viable energy option for various Mediterranean countries.
2. Methodology
The research endeavors to conduct a techno-economic assessment for optimizing the scale of a hybrid energy system in Thala city, Tunisia. This optimization involves harnessing the inherent natural resources within the locality. HOMER software has been used and the methodology is illustrated in .
Figure 1. Methodology of the research work.
HOMER Pro, designed by the National Renewable Energy Laboratory (NREL Citation2021), is used to perform the simulation and optimization of the hybrid power system in a particular site. HOMER is the world’s most advanced microgrid modeling software (Güven and POYRAZ Citation2021). The system performance, the NPC, and the LCOE are found for different combinations, with/without energy storage, connected to the grid/off-grid, and can be examined separately. HOMER can perform simulations of hundreds of data that can take many hours to ensure the optimum state between demand and supply. The flow-diagram for the HOMER software is represented in .
Figure 2. Simplified flowchart of HOMER pro optimization algorithm.
The optimal solutions for a renewable energy system in Thala are analyzed using a computational simulation method with HOMER Pro software. The simulation process can be divided into three parts: i) defining the input data, ii) simulating each scenario, and iii) analyzing the output results. The required inputs for the simulation rely on accurate data, namely stochastic variables, including meteorological data and data on electricity loads, data on renewable resources (e.g. wind-speed data), biomass availability in the selected region, cost and financial variables, and equipment efficiency and performance data. These data are fed into HOMER in the form of monthly averages or as time-series data to the output power of a wind turbine and a biogas digester. First, the simulation was run for several scenarios based on the combinations of RE technology used and the type of storage technology. Then, the software estimated each system’s NPC and LCOE. The NPC and LCOE are considered to be the most important metrics for the techno-economic analysis of a hybrid power system.
The single-line diagram in represents the renewable energy system architecture in Thala. The proposed system includes wind turbines, batteries, a hydro-pumped storage system, and a biogas generator. In the hybrid system, the electrical demand is coupled at the alternating current (AC) bus side. The architecture consists of both AC and DC buses for supplying electrical power. A bidirectional converter maintains the power flow between the wind turbines, batteries, and biogas generator. The energy storage device is used to maintain stability for the system for high renewable penetration and to balance the power supply for high loads even at times of low resources.
Figure 3. Single-line diagram of the renewable energy system.
2.1. Case study
2.1.1. Geographic position
Thala is a town and commune in Tunisia. It is located in the mountainous region of the Tunisian ridge, approximately 240 km to the west of Tunis at an altitude of 1017 m, which makes it the highest and the coldest town in the country. The population of Thala in 2020 was 33,400 (INS Citation2023). Thala was chosen as the context for the investigation of this paper due to the abundance of bare land to construct wind farms and take advantage of the region’s renewable resources. and show details of the selected city and the geographic location, respectively.
Figure 4. Geographic location of Thala.
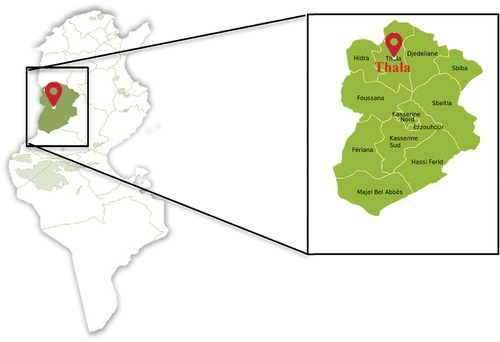
Table 2. Case study characteristics.
2.1.2. Climate
Thala is known for its semi-arid climate; the summers are hot, dry, and mostly clear and the winters are long, cold, windy, snowy, and partly cloudy. Over the year, the temperature typically varies from 1.5°C to 32°C and is rarely below −2°C and above 37°C. The monthly weather characteristics of the region are presented in (Spark Citation2023).
Table 3. Monthly climate data of Thala.
2.1.3. Electric demand assessment
A maximum peak load of 5.6 MW was recorded on Monday, 17 August 2020 at 1:40 p.m. compared to 5.8 MW recorded on Tuesday, July 2019 at 1:41 p.m., showing a decrease of 3.4%. The average annual growth in the period (2010‒2020) in Thala city amounted to 1.9%. presents the average demand of Thala for the 11 years from 2010 to 2020, and illustrates the maximum power consumption recorded in the summer for two consecutive years 2019 and 2020.
Figure 5. Hourly power demand pattern on two days of maximum power consumption during 2019 and 2020 in Thala city (A.R.C. Citation2009).
Table 4. Average demand of Thala city (Llc Citation2022).
Thala has a population of 33,400 residents, and with an average household size of 4.2 residents per household, we can estimate that there are approximately 8,000 households in the town (INS). In Thala, the average load per household is influenced by the ownership of various appliances and technological devices. A significant majority, approximately 96%, 70%, and 95% of households own a television, washing machine, and refrigerator or freezer, respectively. However, only 9% of households in Thala have a computer. Similarly, approximately 19% of households have internet access, indicating a relatively lower level of connectivity. When estimating the overall electricity consumption, these percentages are considered alongside the power ratings of each appliance, as summarized in . Moreover, the load profile for a typical residential load in Thala, as illustrated in , provides a visual representation of the energy usage pattern throughout the day. Thala’s total daily power consumption is approximately, 11.2 MWh/day and 13.9 kWh/day/household, with approximately 1.6 MW peak load.
Table 5. The power rating of different appliances in Thala city (Power Consumption Table Citation2003).
2.2. Resources assessment
2.2.1. Wind energy
The wind potential of Tunisia is evaluated to be 8 GW on an exploitable surface of 1600 km2 (Bettaieb Citation2018. The wind atlas of Tunisia is presented in . The map shows that there are many favorable sites for the implementation of viable wind energy projects in the north, northeast, and south, and Thala leads the Tunisian governorates in terms of mean wind speed. The windiest part of the year in Thala lasts for 6.3 months, from November 5 to May 15, with average wind speeds of more than 4.5 m/s. The windiest month of the year in Thala is February, with an average hourly wind speed of 5.4 m/s. The monthly and hourly average wind speeds of Thala city are presented in and , respectively.
Figure 6. Annual mean wind speed (Elamouri et al. Citation2008).
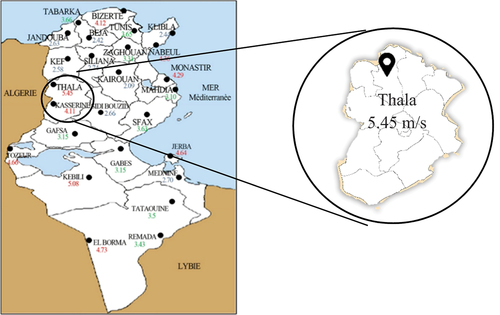
Figure 7. Hourly wind speed in Thala city over 30 years (1990‒2020).
The mean power density of the region is represented in at 10 m, 40 m, and 50 m above ground level. The maximum power density is recorded in March, at 477 W/m2, while the lowest is recorded in August, at 280 W/m2 at 10 m height, varying between 600 W/m2 and 350 W/m2 at 40 m height and between 690 W/m2 and 480 W/m2 at 50 m height. Investigation of the wind speed distribution and mean power density of the study area is a fundamental step before implementing any wind energy project, to increase efficiency and reduce investment costs (Attig-Bahar et al. Citation2021).
Figure 8. Monthly average wind speed variation with elevation.
2.2.2. Olive mills waste potential
On January 6, 2023, the National Oil Office (ONH) revealed that olive production in Tunisia will be 900,000 tons for the 2022‒2023 season, which extends over 120 days from November to February and will allow the production of 180,000 tons of olive oil. In 2020,
there were 1517 olive oil working mills in Tunisia, distributed as follows in the country: 32% in the North, 46% in the center, and 22% in the south. The number of olive mills in Kasserine is 31, most of which are modern with a storage capacity of 2275 tons of olives. Thala produces 5% of the national olive production, i.e., 5000 tons/season in 2020, with an average of 50 tons/day during the harvest season. The three-phase process shown in is used by most olive mills in Tunisia (Gargouri et al. Citation2013).
Figure 9. Modern three-phase extraction process of olive oil.
This process yields three phases: 20% olive oil, 30% solid residue: olive cake (olive pulp, leaves, and stones), and 50% olive oil water waste, which indicates that four times more waste ‒, with high humidity and high organic load ‒ is produced than olive oil (Tekin and Dalgıç Citation2000). The olive wastes produced in Thala city are shown in . The average heating value of the olive biomass is 19,000 kJ/kg (Calorimeters Citation2020), and due to excessive contamination, olive mill waste (OMW) has a low efficiency; dark hue, strong disagreeable odor, high acidity, and high chemical oxygen demand, high electrical conductivity (Azbar et al. Citation2004), high values of solid matter (Eusebio et al. Citation2002) and high treatment costs. Therefore, OMW is gathered and dried in evaporation ponds. This is harmful to the environment and can be a serious pollution risk for surface and underground waters. Olive mill waste should be valorized through an energy recovery process such as anaerobic digestion (AD).
Table 6. Properties of olive mill by-products (Al-Najjar et al. Citation2022).
Anaerobic digestion has been described as a promising technology for effectively generating value from olive mill wastes through the production of biogas (Al Afif et al. Citation2022; Al Afif and Linke Citation2019; Arvanitoyannis and Kassaveti Citation2007; Al Afif Citation2018; Roig, CR, and SM Citation2006), and the most potent technology for treating waste derived from olive mills (Battista et al. Citation2013), especially for small- scale projects with a relatively high organic content of biomass. Several studies (Afilal, Belkhadir, and Merzak Citation2013; Kheybari et al. Citation2019; Krishnamoorthy et al. Citation2020), have been conducted to use this waste as a renewable resource for the production of green fuel, and these confirm the promising performance for biogas generation from olive waste due to its high volatile solids (VS) percentage of organic waste, incorporating a significant amount of electrical energy, estimated as 770 kWh/ton generated per ton of olive pomace (Abu-Ashour, Qdais, and Al-Widyan Citation2010). The biomass feedstock used in this paper is olive mill waste, including wastewater, olive pomace, and olive leaves.
2.2.2.1. Olive leaves
Olive leaves are a plentiful by-product of the olive oil industry, characterized by high quantities of phenols. From the total pruning residues, olive leaves constitute 25% of the dry weight and for every liter of olive oil produced, 6.32 kg of olive leaves are generated (Espeso et al. Citation2021). The total amount of olive leaves that could be generated in Thala city is 1300 tons/season. However, the pruning process contributes to 23% of the total CO2 emitted in the elaboration of 1 L of olive oil, i.e., 909 g of CO2/1 L of olive oil (Avraamides and Fatta Citation2008).
2.2.2.2. Olive mill wastewater (OMWW)
OMWW constitutes the liquid fraction of the olive mill by-product and is characterized by a dark red to black color, obtained from mechanical olive processing during olive oil production. The main properties of OMWW are the presence of organic compounds such as organic acids, lipids, alcohols, and polyphenols that turn it into phytotoxic materials, which are potentially harmful to the environment and represent a great environmental hazard if not properly managed. For a three-phase system, 100 kg of processed olives generates more than 100 L of OMWW.
2.2.2.3. Olive pomace (OP)
Olive pomace is composed of fruit matter (olive skins, flesh, seeds, and stone fragments), and it represents the main residue of the olive oil extraction process by weight (Romero-García et al. Citation2014). The three-phase separation mode is the common process used in Thala city and generates OP with lower moisture content (40‒45%) than the two-phase process (Dermeche et al. Citation2013; Vassilev et al. Citation2010) and a high heating value (HHV) of 22.5 MJ/kg. Furthermore, OP contains a high chemical and biological oxygen demand due to its high organic charge. presents the main characteristics of the olive mill by-products.
The feedstock availability and biogas yield are calculated based on Eq. (1), and the energy potential generated from the biogas produced follows Eq. (2) (Al-Najjar et al. Citation2022).
is the annual production of OMW in Thala city,
is the residues factor,
is the dry weight factor and
is the availability factor.
is organic content,
is the methane yield (m3kg−1),
is the higher heating value of the residues, and
is methane heating value. Numerical results for Thala city are presented in .
Table 7. Biomass availability and biogas yield production in Thala city (Milanese et al. Citation2014; Shakeri et al. Citation2017).
2.3. Mathematic modeling
2.3.1. Modeling of the proposed system
Mathematical modeling is an important step for optimal sizing of the system components to provide its performance under several scenarios. Mathematic modeling of the proposed renewable energy system is developed below.
2.3.1.1. Wind turbine
The choice of wind turbine is based on the optimal wind speed of the case study. The optimal wind speed is estimated based on Eq. (3). In this study, the optimal wind speed is 10 m/s. Based on this value, we selected the Eocycle 100 kW (EOX M-21) wind turbine.
and
are the Weibull parameters, where
= 1.75 m/s and
= 6.65 m/s.
Eq. (4) is used to predict the rated power of the wind turbine selected.
where is the swept area of the wind turbine rotor, the air density is characterized by
, the power coefficient of the proposed wind turbine is given by
, and the generator efficiency is
. The total energy generated by the wind turbine system
is expressed by Eq. (5).
where is the total number of machines used.
2.3.1.2. Lead-acid battery
Lead-acid batteries are widely used in various applications, including renewable energy integration, electric vehicles, and backup power systems (May, Davidson, and Monahov Citation2018). Despite their relatively lower energy density, moderate efficiency, and higher maintenance demands, lead-acid batteries offer the advantage of a prolonged lifespan, cost-effectiveness, and a well-established, mature technology foundation compared to other battery types (Townsend and Gouws Citation2022). A lead-acid battery consists of a negative electrode made of porous lead and a positive electrode made of lead oxide. These electrodes are immersed in a sulfuric acid and water electrolyte solution and are separated by a chemically permeable membrane. The battery stores energy through a reversible chemical reaction, expressed by Eq. (6).
, depicts a simplified battery charging profile with five operating modes: Pre-charge (Activate), Bulk, Absorption, Equalization, and Maintenance (Musavi et al. Citation2013). Pre-charge mode activates the batteries with a small current, about 20% of IMAX, while Bulk mode charges them with a constant current IMAX. The absorption mode uses a constant voltage VABS for charging, and the Equalization mode equalizes cell voltages with an overvoltage when the current reaches IMIN. Maintenance mode offsets internal soft discharge by supplying a small current after full charge.
Figure 10. Simplified lead-acid battery charging profile.
Lead-acid batteries were selected for Thala based on careful consideration of its moderate temperature conditions. With a sensitivity to temperature increases, resulting in a capacity reduction of around 1% per degree below 20°C, lead-acid batteries are well-suited for Thala’s climate. This choice ensures optimal system performance, reliable energy storage, and accurate capacity estimations, meeting the location’s specific environmental requirements.
2.3.1.3. Pumped-storage hydro-plant
A pumped storage hydro plant can be mathematically modeled by considering key equations that describe the system’s energy balance. The energy storage equation relates the stored energy in the upper reservoir to the mass of water (), the acceleration due to gravity (
), and the height difference between the reservoirs (
), which is expressed by Eq. (7).
The pumping power equation determines the power required for pumping water from the lower to the upper reservoir., expressed by Eq. (8), calculates the power generated by the plant, incorporating, water density (ρ), flow rate (Q), the high difference (), and the efficiency (Ƞ), knowing that for small hydropower plants, the value is estimated between 0.5 and 0.7; for bigger facilities, it starts at 0.75–0.85 (Walczak Citation2018).
The capacity of storage in a pumped storage hydro plant is calculated based on Eq. (9). The capacity of storage in a pumped storage hydro plant is typically calculated based on the volume of water that can be stored in the upper reservoir. The formula to calculate the capacity is as follows:
Where is the surface area of the upper reservoir (m2),
is the maximum height or depth of the upper reservoir (m), and
is the average volume of water stored in the upper reservoir (m3).
2.4. Economic modelling
The Net Present Cost (NPC) and the Levelized Cost of Energy (LCOE) are the crucial macroeconomic metrics considered in this study. The LCOE is defined as the lifetime costs divided by the electrical energy produced by the power plant, and NPC as the power system expenditure during the lifetime of the plant, minus the present value of the revenues earned over the lifetime. These values are calculated using Eq. (10) and Eq. (11) (Amutha et al. Citation2016; Das et al. Citation2017).
where ,
,
are the primary load served in kWh/year, deferrable load served in kWh/year, and total grid sales (kWh/year), respectively.
where denotes the net present cost in US$,
denotes the total annualized cost in US$/year, CRF is the capital recovery factor,
denotes the interest rate
is the project’s lifetime in years. The main economic variables considered are the nominal discount rate (NDR) set to 8%, the expected inflation rate at 2%, and the project lifetime at 25 years. To convert from one-time costs and annualized costs, the real discount rate is considered. The capital recovery factor used to estimate the NPC is represented in Eq. (12) (HOMERpro3.14. HOMER Generates Load Profiles According to LoadData Citation2020).
where is the nominal discount rate and
is the expected inflation rate.
In evaluating energy system configurations is important to move beyond the technical aspect and delve into the financial metrics to determine the economic feasibility and long-term sustainability of the selected system. The integration of RE and energy storage devices represents a significant investment and understanding the financial implications is key to making informed decisions. This is where financial metrics such as Return on Investment (ROI), Internal Rate of Return (IRR), Simple payback, and Discounted Payback come into significance. The ROI, calculated based on Eq (13), quantifies the investment profitability, signaling financial soundness when positive returns exceed the initial capital outlay.
The IRR assesses the project’s attractiveness. A higher IRR implies a more favorable investment, often compared to the project’s required rate of return to assess its viability, as indicated in Eq (14).
Where is the total number of periods,
is the net cash inflow during period n,
is the total initial investment cost and IRR is the internal rate of return.
The simple payback represents the time of the initial investment to be recouped through savings or revenue, indicating when the project breaks even. Discounted payback extends this by accounting for the time value of money, offering a more precise view of financial viability considering future cash flows ‘present value.
2.5. Environmental criteria
Carbon emissions are one of the critical problems in any hybrid device configuration. The amount of CO2 emissions can be calculated based on EquationEquation (15)(15)
(15) and the carbon footprint of the olive oil extraction process is illustrated in (Ladide et al. Citation2019).
Figure 11. Carbon footprint from different processes within the olive oil production cycle (Feliciano, Maia, and Gonçalves Citation2014).
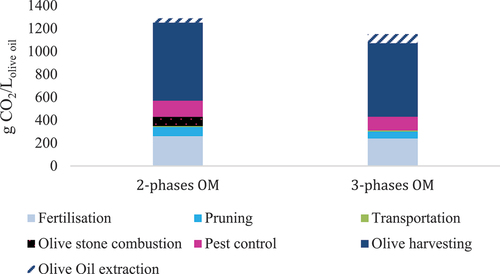
where is the total amount of
emissions,
is the fuel consumption in liters,
is the heating value of the fuel (MJ/L),
is the carbon emission factor (tons of carbon/TJ), and
is the oxidized carbon fraction. The optimal configuration is characterized by the lowest NPC and LCOE and a high renewable fraction. The fraction of electricity production from renewables is termed the renewable fraction. Using Eq. (16), HOMER estimates the renewable fraction (Sawle and Gupta Citation2014).
where is the renewable fraction,
is the electricity produced from nonrenewable sources (kWh/year),
is the nonrenewable thermal energy production (kWh/year),
is the total electricity produced (kWh/year)) and
is the total thermal load served (kWh/year).
3. System modeling and component selection
The hybrid system components were selected based on the RES available in the selected region. Wind and biomass are the main sources to be integrated with the system design: a wind turbine generator (WTG), biogas generator (BG), storage technology, and bi-directional converter. Alternating current is generated by the wind turbine and the biomass gasifier and can be distributed directly. However, to store the electricity in electrical storage, the technology should be converted to direct current (DC) by the converter. regroups the technical properties of the selected components.
Table 8. Technical properties of the selected components.
3.1. Wind turbine
Several wind turbines are available in the HOMER Pro database. For this study, we selected the Eocycle EOX M-21 100 kW horizontal axis wind turbine, designed and built for the most extreme climates in the most remote locations and 100% hurricane-proof (Eocycle), which generates 100 kW at a cutout speed of 10 m/s. The capital cost of one unit is 100,000 US$, whilst replacement and O&M (operation and maintenance) costs are 80,000 US$ and 40 US$/year, respectively (Stehly & Duffy, Citation2022). The lifetime of the EOX M-21 is 25 years. The power curve of the selected WT is represented in .
Figure 12. The power curve of the selected wind turbine (eocycle Citation2023).
3.2. Biogas gasifier
Biomass gasification (BG) technology is combined with wind turbines to generate electricity with a high renewable fraction. The generator’s fuel is olive oil mill waste, and the gasification process follows three major operational phases: pyrolysis, gasification, and combustion. The estimated fuel price for the biomass used in the biogas gasifier is 20 US$/ton, including transport. With a carbon content of 42% and a gasification ratio of 0.032 kg gas/kg biomass, the rated capacity of the biogas gasifier, which is 120 m3 of biogas/day, can be used to estimate the potential biogas production and associated value based on the fuel price. The biogas gasifier costs 40,000 US$/kW, and replacements and O&M costs are 12,000 US$/kW and 2 US$/operational hour, respectively (IRENA Citation2012). The BG has a minimum load ratio of 20% and a lifetime of 15,000 hours.
3.3. Converter
Since the power output of the wind turbine is in alternating current (AC), the application of a power conversion system is essential to convert the wind power output to direct current (DC) power to be stored in the batteries (Maatallah, Ghodhbane, and Nasrallah Citation2016). The selected converter is the XTM 1500–12. The cost of this converter model is 2,300 US$, and its lifetime is 15 years with an average efficiency of 93% (Studer Citation2023).
3.4. Storage devices
The power output of the power plant can fluctuate widely as wind is a fluctuating and unpredictable resource. This variable output could lead in turn to frequency and voltage fluctuations which adversely affect grid stability. In an On-grid scenario, storage devices play a crucial role in maximizing the utilization of RES, they enable the storage of energy excess during low demand and release it during peak periods, reducing intermittency, ensuring stable power supply, and minimizing fossil fuel backup reliance. Storage enables grid integration, managing stability and frequency regulation. In an off-grid setting, the inclusion of storage devices becomes even more imperative, as they allow the accumulation of surplus renewable energy during peak generation periods. This stored energy is then used during low or no-generation periods, ensuring a reliable power supply, minimizing shortages, and improving system efficiency. Within this paper, the simulation will be developed using two different storage technologies and, according to the results, the optimum one in terms of cost and efficiency will be selected.
3.5. Pumped hydropower storage
Thala is a region rich in geohydrological resources. Exploiting these resources and building pumped storage facilities, also called pumping power transfer stations (PHS), will be beneficial for the region and optimize the energy cost. As shown in , pumped storage projects (PSP) store electricity by moving water between two water reservoirs with different elevations. Pumped hydropower storage systems are used to pump water uphill into storage basins and release it at times of low renewable output or peak demand. PSP is a well-proven reliable technology. The most common form of energy storage in the world is hydro-pumped projects (Limb Citation2022). Technical and cost parameters of the PHS are regrouped in (IRENA. Citation2017).
Figure 13. Pumped storage hydropower technology.
3.6. Battery
A battery is a crucial device for a renewable energy system to store extra electricity produced and provide it during hours of maximum electricity consumption. The selected battery model is PowerSafe OPzV 250, a lead acid battery. The nominal voltage is 2 V for one string, and the nominal capacity is 0.7 kWh. The battery’s lifetime is 20 years. The cost of this battery is 1000 US$ Aegmarket. Citation2023.
3.7. Electric grid
In Thala, Tunisia, the cost of purchasing electricity from the grid is measured in euros per kilowatt-hour (€/kWh). For households with a monthly consumption ranging from 300 to 500 kWh, the cost per unit of electricity is approximately 0.063 US$. This price reflects the tariff structure set by the local utility or energy provider. The electricity is supplied through the 150 kV simple terne line transmission line, which plays a crucial role in delivering power from the generation sources to Thala and the surrounding areas. The 150 kV voltage level ensures efficient and reliable transmission of electricity over long distances, supporting the energy needs of the community. provides an overview of the technical properties of the selected components.
4. Results and discussion
HOMER Pro simulated all the possible configurations to achieve the most cost-effective system. Cost, electrical, and environmental analyses were performed. The grid-only system was selected as the reference case. For the simulation, first, it was defined if the system was feasible and satisfied the electric load of the selected location, and, second, the lifetime cost of the system including the total cost of installation (initial cost, replacement cost, and O&M costs) over its lifetime was estimated. This paper explored the optimum configurations grouped into two different scenarios as presented in .
Table 9. Simulation scenarios.
Following the simulation, a list of feasible plans was organized and stored by the minimum net present cost, to compare the options for the system design. The optimization findings are reported in this section and regrouped in , which includes architecture, costs, and environmental impacts, followed by sensitivity analysis results.
Table 10. Optimization results - architecture, costs, and environmental impacts.
4.1. On-grid
4.1.1. On-grid + batteries
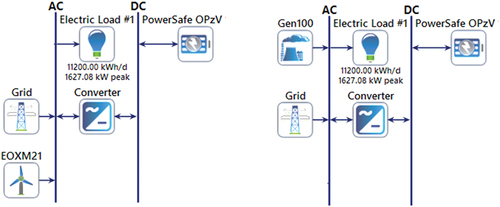
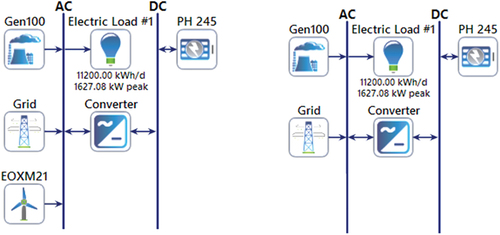
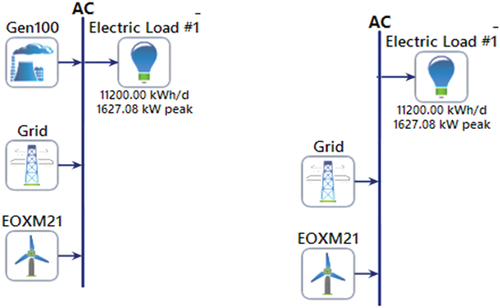
This section evaluates two optimal configurations, illustrated in , for and electricity generation system in Thala, Tunisia, within the On-Grid_batteries scenario. serves a multifaceted purpose crucial for enhancing the efficiency, reliability, and sustainability of the power infrastructure. Integrating storage devices in a grid-connected system is essential for grid stability, swiftly responding to supply fluctuations and ensuring a reliable energy supply. They enhance resilience during grid interruptions, offer cost savings through peak demand management, and optimize RES use. The first configuration, Wind/Batteries/Grid/Converter, was found to be the least costly option with NPC equal to 530,100 US$, and 0.0525 US$ LCOE, while the second configuration, BG/Batteries/Grid/Converter, offered slightly higher costs.
Figure 14. Cost-optimal configurations design for the On-grid_BATT scenario: left (Wind/Batteries/Grid/Converter); right (Wind/BG/Batteries/Grid/converter).
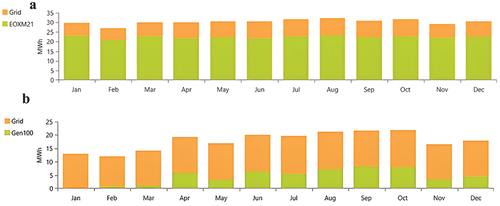
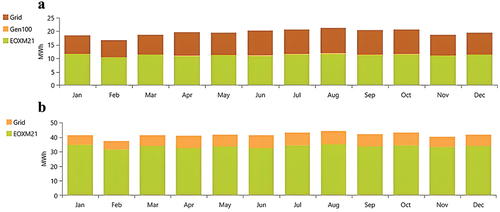
The Wind/Batteries/Grid/Converter configuration relied heavily on wind turbines, which generated 73% of the total electricity per year, while grid purchases accounted for 26.2%. This highlights the significance of wind energy in Thala’s renewable energy mix. In contrast, the BG/Batteries/Grid/Converter configuration utilized a biogas generator, contributing 26.6% of the monthly electric production, as illustrated in . Although this configuration showed potential for utilizing biogas as a renewable resource, it also indicated a higher dependence on the grid. Further optimization of biogas generation and storage may be necessary to enhance self-sufficiency in Thala’s energy system.
Figure 15. Monthly average electric production: (A) Wind/Batteries/Grid/converter, (B) Biomass/Batteries/Grid/converter.
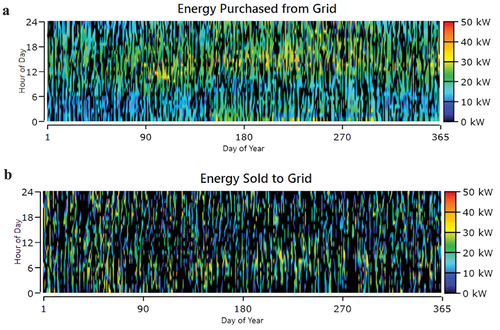
. (A, B) and (back to the grid. Notably, the peak electricity purchases occurredA, B) showcased the energy dynamics of these configurations, highlighting the peak hours of electricity purchased from the grid and the excess energy sold back to the grid. Notably, the peak electricity purchases occurred from 7h to 12h and 18h to 23h, aligning with the periods of high consumption. The energy sold back to the grid peaked during specific months and hours, coinciding with favorable wind speeds or the olive season harvesting.
Figure 16. (A) energy purchased from the grid and (B) energy sold to the grid for the first configuration of Wind/Batteries/grid/Converter.
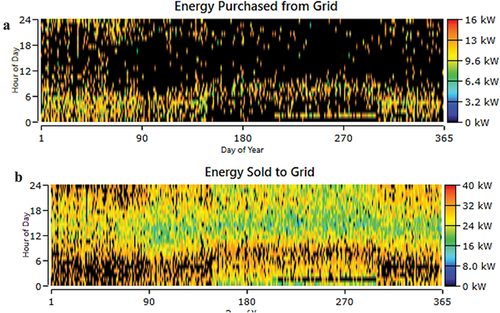
Figure 17. (A) energy purchased from the grid and (B) energy sold to the grid for the second scenario BG/Batteries/grid/Converter.
The calculation of the energy purchase and sold rate, as outlined in Eq. (17), offers valuable insights into the efficiency of different system configurations.
Notably, the first configuration Wind/Batteries/Grid/Converter exhibits a remarkable rate surpassing 100%, reaching 270%. This signifies a high degree of self-sufficiency, suggesting that the system generates more energy than it consumes and can potentially sell the excess back to the grid. Such findings open opportunities for electricity exportation and align with policy strategies, particularly those related to feed-in tariffs. In contrast, the BG/Batteries/Grid/Converter system, with an energy purchase and sold rate of 53%, underscores its reliance on the grid to meet the electricity demand of the region. This highlights the pivotal role of the grid in ensuring a stable and consistent power supply.
In terms of environmental impact, both configurations made significant strides in reducing CO2 emissions compared to a grid-only system. The Wind/Batteries/Grid/Converter configuration achieved a remarkable 68% reduction in CO2 emissions, equivalent to 380.27 tons/year. Similarly, the BG/Batteries/Grid/Converter configuration demonstrated a 25.5% reduction, translating to 1000.80 tons/year. These reductions signify the substantial positive influence of integrating renewable resources and batteries, paving the way for a more sustainable and eco-friendly energy landscape in Thala.
4.1.2. On-grid + PHS
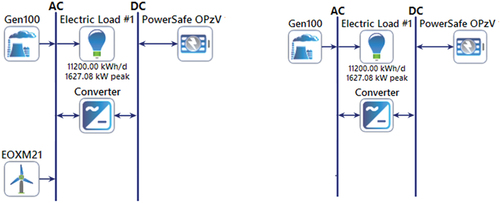
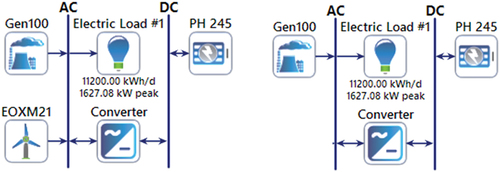
In the grid-connected scenario with pumped hydro storage, the Wind/BG/PHS/Grid/Converter configuration emerged as the most cost-effective combination, with an NPC of 501,540 US$ and an LCOE of 0.042 US$. This system integrated a 100-kW biogas generator, a 5.08 kW converter, two EOX M-21 wind turbines, and a 245-kW pumped hydro storage unit, as represented in . On the other hand, the BG/PHS/Grid/Converter configuration featured a 25-kW converter and a 245 kW pumped hydro storage unit, with an NPC of 671,623 US$ and an LCOE of 0.065 US$.
Figure 18. Cost-optimal configurations design for the On-grid_PHS scenario left (Wind/BG/PHS/Grid/Converter); right (Bg/phs/grid/converter).
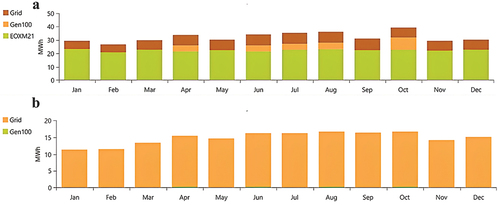
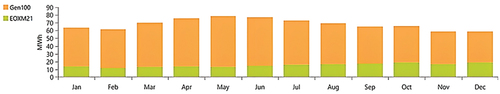
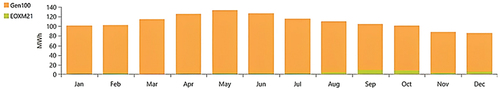
Examining the monthly electricity production of these configurations, illustrated in , the Wind/BG/PHS/Grid/Converter setup demonstrated that the EOX M-21 wind turbines contributed 69% of the total electricity generated per month. The biogas generator accounted for 7%, while 23.6% was purchased from the grid. Conversely, in the BG/PHS/Grid/Converter configuration, the 100-kW biogas generator generated a mere 1.5% of the monthly electricity, with the remaining 98.6% being purchased from the grid at 0.063 US$.
Figure 19. Monthly average electric production: (A) Wind/Biomass/PHS/Grid/converter (B) Biomass/PHS/Grid/converter.
illustrates the remarkable achievement of high renewable energy integration, resulting in a substantial proportion of renewable energy sources (RES) within the optimum configuration. The renewable energy fraction in this configuration surpasses 70%, highlighting the significant contribution of renewable sources toward the overall energy generation.
Figure 20. Renewable energy integration: Wind/BG/PHS/Grid/Converter.
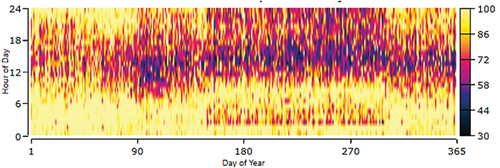
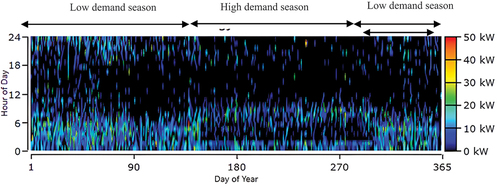
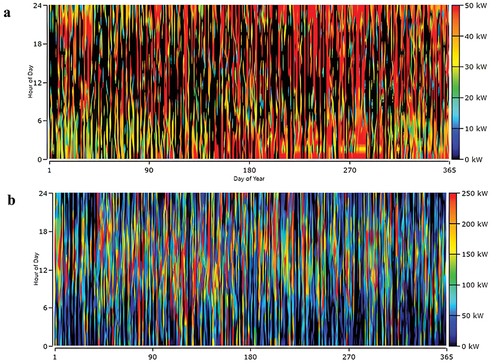
The Wind/BG/PHS/Grid/Converter configuration exhibits a significant electricity production peak from 7 h to 17 h, particularly during the initial four months of the year. This trend gradually diminishes during the summer and toward the end of the year. This pattern directly correlates with the exceptional wind potential during this period, reaching speeds of up to 6 m/s. The substantial integration of renewables in Thala’s electricity production underscores the promising role of wind energy in meeting the region’s energy demands. This remarkable integration of renewables in Thala’s energy mix has yielded substantial environmental benefits, particularly in terms of reducing CO2 emissions compared to the grid-only system. The results highlight an impressive reduction of more than 70% in total CO2 emissions, showcasing the significant positive impact of renewable energy adoption on mitigating greenhouse gas emissions.
4.1.3. On-grid without a storage system
This scenario does not include any storage technology. Therefore, the difference between electricity generated by renewable sources and the load will be filled by grid interaction. This raises the question of an electricity pricing agreement with the grid. Energy pricing includes the cost of purchasing electricity from the grid and the sellback price to the grid. The sellback price is 0.072 US$/kWh. The simulation results of this scenario are illustrated in .
Figure 21. Cost-optimal configurations designed for the On-grid without storage scenario, left (Wind/BG/Grid/Converter); right (Wind/Grid/converter).
We discussed several scenarios with all the possibilities for grid-connected scenarios with and without storage technology, and we found that a system without any storage was more cost-effective, where the lowest NPC and LCOE were recorded as 298,681 US$ and 0.035 US$/kWh, respectively. The monthly average electric production of the optimal combination for ON-Grid without the storage system is illustrated in .
Figure 22. Monthly average electric production: (A) Wind/BG/Grid, (B) Wind/Grid.
To fulfill the region’s electricity demand, 42.1% and 19.1% of the power is acquired from the grid, for the Wind/BG/Grid and Wind/Grid configurations, respectively, and the rest is generated from renewable sources. As shown in , an important share of the electricity generated is sold to the grid, for the WT/BG/Grid configuration, during the period of midnight to 06:00, when the demand is low. However, the integration of significant amounts of intermittent renewable energy presents several technical and control issues that threaten grid stability. Among these challenges is generation uncertainty. Although it provides the lowest NPC and an attractive energy price, this scenario is technically unrealistic.
Figure 23. Electricity sold to the grid.
4.2. Off-grid
4.2.1. Off-grid + batteries
The simulation outputs showed that to ensure 100% of electricity generated from renewable sources, the NPC will be relatively high compared to the on-grid scenario. represents the most cost-effective configurations of this scenario.
Figure 24. Cost-optimal configurations design for the off-grid _BATT scenario, left (Wind/BG/Batteries/Converter); right (Bg/batteries/converter).
The Wind/BG/Batteries/Converter was the least cost-effective system of the OFF-Grid_ BATT scenario. The NPC of the optimal configuration increased by 12% compared to the ON-Grid_BATT, to reach 596,007 US$ and an LCOE of 0.098 US$, 34% more than the grid- connected scenario. The monthly production of each component for the most cost-effective configuration is presented in .
Figure 25. Monthly average electric production of Wind/BG/Batteries/converter.
The generic 100 kW biogas gasifier produced 27% of the monthly electricity produced by the selected system. It consumed 1000 L of olive mill waste during 4752 hours of operation per year.
The EOX M-21 wind turbine contributed 73% of the total electricity production, with 7525 hours of operation per year. The maximum output of this machine is 100 kW, recorded in the first three months of the year, because of the high wind speed in the region, which can reach 7 m/s. (A,B) illustrates the hourly production of the Wind/BG//Batteries/Converter configuration.
Figure 26. Hourly electric production, (A) generic 100 kW biogas gasifier, (B) EOX M-21 kW wind turbine.
4.2.2. Off-grid + PHS
As in the previous scenario, the off-grid scenario provided a 100% renewable fraction on the one hand, but with high NPC and LCOE. In this context, the most cost-effective configuration of the OFF-Grid_PHS scenario is composed of 2 EOX M-21 wind turbines, 100 kW BG, and a 245 kWh PHS station. The optimization results are presented in .
Figure 27. Cost-optimal configurations design for the off-grid _PHS scenario, left (Wind/BG/PHS/Converter); right (Bg/phs/converter).
Compared to the ON-Grid_PHS, the NPC increased by 32% and, the LCOE is 3 times more than the grid-connected scenario. The monthly electric production of the first configuration is presented in .
Figure 28. Monthly average electric production of Wind/BG/PHS/Converter configuration.
The generic 100 kW biogas gasifier contributed 8.8% of the monthly electrical production and consumed 800 L of olive mill waste during 2200 hours of operation per year.
The EOX M-21 wind turbine contributed 91.2% of the total electricity production, with 7525 hours of operation per year.
4.3. Economic comparison
summarizes the NPC and LCOEs, respectively, of all the configurations analyzed above. The lowest LCOE and NPC were obtained by aggregating the cost-effective hybrid system design.
Figure 29. NPC (left) and LCOE (right) comparison of all the studied systems.
The results revealed that configuration_3 and configuration_5 were the most cost-effective systems in terms of NPC and LCOE, among the ten configurations analyzed. The renewable fraction of both configurations exceeded 50%. However, the high integration of renewables can threaten the stability of the system without any storage technology. Therefore, configuration 3, Wind/BG/PHS/Grid/Converter was selected as more realistic technically and more stable. To compare the economics of the Wind/BG/PHS/Grid/Converter configuration to the base system, grid-only, is summarized in .
Table 11. Economic comparison with the base system.
The financial analysis of the eight configurations compared to the base system, which represents the grid-only option, provides valuable insights into the economic viability of each scenario. Among these configurations, the lowest ROI, a negative value of −6%, is associated with configuration 10, this setup is an off-grid system incorporating biogas generation and PHS. The negative ROI indicates that the returns from this configuration do not surpass the initial investment, which raises concerns about its financial feasibility. However, a close examination reveals a significant twist as the IRR for this configuration is not positive but surpasses that of the ten studied configurations. This seemingly paradoxical outcome underscores the importance of considering the timing and magnitude of cash flows. In the case of BG/PHS, it suggests that while the initial costs may be substantial, the project’s financial attractiveness lies in the future cash flows, which are robust enough to generate positive IRR over the long term. Furthermore, this configuration boasts the longest payback period, requiring 18 years to recoup the initial investment. This suggests an extended investment horizon with associated risks.
Conversely, excluding configuration 5, configuration 3 in the On-Grid with PHS scenario showcases the highest ROI and IRR, reflecting the strongest financial performance with a positive return. Additionally, it boasts the lowest simple payback period among all configurations, indicating a quicker return on investment. A positive ROI signifies that this configuration generates returns exceeding the initial investment, making it a financially attractive choice. Moreover, it’s worth noting that the Wind/BG/Grid configuration emerges as the cost-optimal choice, boasting the lowest Net Present Cost (NPC) and Levelized Cost of Electricity (LCOE) among all configurations. This aligns with the financial findings, reinforcing its appeal as a compelling and financially sound option.
The average energy costs resulting from this paper can be considered to be in full agreement with those published in the open literature for the region, e.g., Jordan (Rafat et al. Citation2023), Saudi Arabia (Makbul 2016), considering fluctuation in local circumstances such as wind speed and olive mill waste availability. Given the technological advances and attempts to manage and reduce GHG emissions caused by the excessive use of fossil fuels, the LCOE and NPC were predicted to decrease in the future.
4.4. Sensitivity analysis
In this section, a sensitivity analysis was performed on the most cost-effective configuration, Wind/BG/PHS/Grid/Converter. This analysis was performed based on the variables listed in .
Table 12. Sensitivity analysis variables.
To explore the capability of the designed hybrid system in different scenarios, the effects of variation of the nominal discount rate (NDR), scaled annual average electric load, and project lifetime were analyzed. Two project lifetimes were considered, the NDRs were set, as well as the values of the annual average electric load with average biomass availability, and the average wind speed. The impacts of the NDR and project lifetime on the NPC and LCOE of the optimal Wind/BG/Battery/Grid/Converter configuration are listed in .
Table 13. Impacts of NDR and project lifetime on the optimal configuration.
The impact of the nominal discount rate (NDR) on the economic evaluation of an energy system cannot be overstated. As represented in Table … , when the NDR increased from 8% to 10%, the consequences for the LCOE and NPC were noteworthy. Specifically, the LCOE saw a rise of 26%, from 0.042 US$ to 0.057 US$. Similarly, the NPC experienced an 8% increase of 0.02 million US$. A higher NDR, 10% in this case, effectively amplifies the cost of capital, accentuating the significance of the time value of money in financial assessments, it elevates the present value of project costs, making initial investments and operating expenditures more burdensome. Moreover, it diminishes the present value of future revenue streams especially critical in long-term energy projects. These findings highlight the critical role of the discount rate in energy project economics. Careful selection of the nominal discount rate (NDR) is vital, as it strongly impacts the financial viability and competitiveness of energy projects, shaping energy system planning and evaluation.
The biomass availability and load demand were modified to investigate the economic variation in the selected system. The impact of the biomass resources on the NPC and LCOE is illustrated using surface plots with the fixed project lifetime and NDR at 25 years and 8% respectively. As shown in , the NPC of the Wind/BG/PHS/Grid/Converter configuration is displayed on the surface plot with the LCOE, with the yearly load demand along the x-axis and biomass availability along the y-axis.
Figure 30. Sensitivity analysis: electric load average vs. biomass availability, NDR= 8%, project lifetime=25 years, surface plot: NPC, superimposed: LCOE.
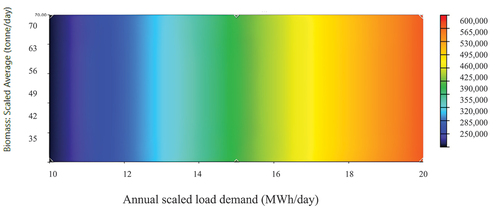
As depicted in the surface plot, an intriguing relationship between load demand, biomass availability and project economics (NPC, LCOE) emerges. When the load demand increased from 11 MWh/day to 13 MWh/day, holding the biomass availability constant, the LCOE, and NPC, exhibited substantial increases, surging by 42% and 60% respectively. This result suggests that higher load demand, without a corresponding increase in biomass availability, can significantly impact project financial performance, making it less economically attractive. However, when the quality of available biomass doubled, leading to a surge in biogas generation, both NPC and LCOE decreased, indicating improved economic viability. This observation can be attributed to factors such as economies of scale, where doubling biomass input let to proportionally reduced costs, as well as enhanced energy conversion efficiencies and lower operational expenses.
5. Conclusion
This study has explored the feasibility of harnessing the abundant wind and olive mill waste biomass resources in a rural region of Tunisia, namely Thala, to generate electricity through a hybrid system. The analysis has underscored the remarkable potential of this location in terms of renewable energy sources. By exploring four distinct scenarios and employing the Hybrid Optimization of Multiple Energy Resources (HOMER) model, the main findings are the following:
Efficiently meeting electricity demand, the study identified the Wind/BG/PHS/Grid/Converter configuration as the optimal solution, ensuring economic viability with 76.2% renewable energy fraction, 0.042 US$/kWh electricity cost, and favorable financial metrics: 7.2-year payback, 501,540 US$ net present cost.
Sensitivity analysis highlighted the pivotal role of the nominal discount rate (NDR) in project economics, showing that lower NDR values resulted in more optimal outcomes. Lower NDR values led to better outcomes. Higher NDRs increased NPC and LCOE, stressing the need for a careful NDR section. Also, the chosen system exhibited a substantial environmental benefit, decreasing greenhouse gas emissions by 76% compared to the existing system.
The study offers insights for decision-makers and investors to propel sustainable energy solutions. Advocates for broader-scope simulations, crucial for comprehensive decarbonization strategies in North Africa. Calls for deeper exploration of the selected system’s control strategy to optimize energy performance.
Acknowledgements
The authors would like to thank the Portuguese foundation for Science and Technology – FCT which financed this work under the Ph.D. scholarship of Yasmine AYED [UI/BD/150894/2021], as well as the Center for Environmental and Sustainability Research (CENSE) (UID/04085/2020), Patricia Fortes research (2020.00038.CEECIND) and the Institute of Chemical and Energy Engineering, University of Natural Resources and Life Sciences, Vienna, for providing the HOMER license.
Disclosure statement
No potential conflict of interest was reported by the author(s).
References
- Aboelfetoh, M., A. Hassanein, M. Ragab, M. El-Kassas, and E. R. Marzouk. 2022. Olive mill waste-based anaerobic digestion as a source of local renewable energy and nutrients. Sustainability (Switzerland) 14 (3):1–33. doi:10.3390/su14031402.
- Abu-Ashour, J., H. A. Qdais, and M. Al-Widyan. 2010. Estimation of animal and olive solid wastes in Jordan and their potential as a supplementary energy source: An overview. Renewable and Sustainable Energy Reviews 14 (8):2227–31. doi:10.1016/j.rser.2010.03.001.
- Aegmarket. 2023. Your specialized provider for photovoltaics and energy saving. https://aegmarket.com/en/
- Afilal, M. E., N. Belkhadir, and Z. Merzak. 2013. Biogas production from anaerobic digestion of manure waste: Moroccan case. Global Journal of Science Frontier Research Biological Sciences 13 (4):1–4.
- Agyekum, E. B., J. D. Ampah, S. Afrane, T. S. Adebayo, and E. Agbozo. 2022. A 3E, hydrogen production, irrigation, and employment potential assessment of a hybrid energy system for tropical weather conditions – combination of HOMER software, Shannon entropy, and TOPSIS. International Journal of Hydrogen Energy 47 (73):31073–97. doi:10.1016/j.ijhydene.2022.07.049.
- Akbas, B., A. S. Kocaman, D. Nock, and P. A. Trotter. 2022. Rural electrification: An overview of optimization methods. Renewable and Sustainable Energy Reviews 156 (June 2021):111935. doi:10.1016/j.rser.2021.111935.
- Al Afif, R. P. C. 2022. Biochemical methane potential of three-phase olive mill solid waste: Influence of temperature and supplemental enzymes. Carbon Resources Conversion 3 (3):248–54. doi:10.1016/j.crcon.2022.07.002.
- Al Afif, R., Y. Ayed, and O. N. Maaitah. 2023. Feasibility and optimal sizing analysis of hybrid renewable energy systems: A case study of Al-Karak, Jordan. Renewable Energy 204 (April 2022):229–49. doi:10.1016/j.renene.2022.12.109.
- Al Afif, R., and B. Linke. 2019. Biogas production from three-phase olive mill solid waste in lab-scale continuously stirred tank reactor. Energy 171:1046–52. doi:10.1016/j.energy.2019.01.080.
- Al-Najjar, H., H. El‐Khozondar, C. Pfeifer, and R. Al Afif. 2022. Hybrid grid-tie electrification analysis of bio-shared renewable energy systems for domestic application, sustainable cities and society. Sustainable Cities and Society 77:103538. doi:10.1016/j.scs.2021.103538.
- Al-Najjar, H., C. Pfeifer, R. A. Afif, and H. J. El-Khozondar. 2020. Estimated view of renewable resources as a sustainable electrical energy source, case study. Designs 4 (3):1–18. doi:10.3390/designs4030032.
- Alsafasfeh, Q. H. 2015. Performance and feasibility analysis of a grid interactive large scale Wind/PV hybrid system based on smart grid methodology case study south part – Jordan. International Journal of Renewable Energy Development 4 (1):39–47. doi:10.14710/ijred.4.1.39-47.
- Amole, A. O., S. Oladipo, O. E. Olabode, K. A. Makinde, and P. Gbadega. 2023. Analysis of grid/solar photovoltaic power generation for improved village energy supply: A case of ikose in Oyo State Nigeria. Renewable Energy Focus 44:186–211. doi:10.1016/j.ref.2023.01.002.
- Amutha, W. M., and V. Rajini. 2016. Cost-benefit and technical analysis of rural electrification alternatives in southern India using HOMER. Renewable and Sustainable Energy Reviews 62:236–46. doi:10.1016/j.rser.2016.04.042.
- A.R.C, bureau d’étude. 2009. Final report of the engineering office A.R.C: Atlas du gouvernorat de Kasserine. 89. Ministere du transport et de l’equipement direction generale de l’amenagement du territoire. http://www.mehat.gov.tn/fileadmin/user_upload/Amenagement_Territoire/AtlasKasserineFrv2.pdf.
- Arvanitoyannis, I. S., and A. Kassaveti. 2007. Current and potential uses of composted olive oil waste. International Journal of Food Science and Technology 42 (3):281–95. doi:10.1111/j.1365-2621.2006.01211.x.
- Attig-Bahar, F., U. Ritschel, P. Akari, I. Abdeljelil, and M. Amairi. 2021. Wind energy deployment in Tunisia: Status, drivers, barriers and research gaps—A comprehensive review. Energy Reports 7:7374–89. doi:10.1016/j.egyr.2021.10.087.
- Avraamides, M., and D. Fatta. 2008. Resource consumption and emissions from olive oil production: A life cycle inventory case study in Cyprus. Journal of Cleaner Production 16 (7):809–21. doi:10.1016/j.jclepro.2007.04.002.
- Azbar, N., A. Bayram, A. Filibeli, A. Muezzinoglu, F. Sengul, and A. Ozer. 2004. A review of waste management options in olive oil production. Critical Reviews in Environmental Science and Technology 34 (3):209–47. doi:10.1080/10643380490279932.
- Aziz, A. S., M. F. N. Tajuddin, M. R. Adzman, A. Azmi, and M. A. M. Ramli. 2019. Optimization and sensitivity analysis of standalone hybrid energy systems for rural electrification: A case study of Iraq. Renewable Energy 138:775–92. doi:10.1016/j.renene.2019.02.004.
- Battista, F., B. Ruggeri, D. Fino, F. Erriquens, L. Rutigliano, and D. Mescia. 2013. Toward the scale-up of agro-food feed mixture for biogas production. Journal of Environmental Chemical Engineering 1 (4):1223–30. doi:10.1016/j.jece.2013.09.008.
- Ben Jebli, M., and S. Ben Youssef. 2015. The environmental kuznets curve, economic growth, renewable and non-renewable energy, and trade in Tunisia. Renewable and Sustainable Energy Reviews 47:173–85. doi:10.1016/j.rser.2015.02.049.
- Bettaieb, H. 2018. Rationalisation de la consommation d ’ énergie et qualité de développement durable : étude de la relation consommation d ’ énergie - croissance économique (cas de la Tunisie). Economies et finances. Université Paris Saclay (COmUE); Universite de Sousse (Tunisie). Faculte des sciences economiques et de gestion, 2015. Français. NNT: 2015SACLV005ff.HAL open science.
- Brini, R., M. Amara, and H. Jemmali. 2017. Renewable energy consumption, international trade, oil price, and economic growth inter-linkages the case of Tunisia. Renewable and Sustainable Energy Reviews 76 (January):620–27. doi:10.1016/j.rser.2017.03.067.
- Calorimeters- Scientific analytical calorimeter solutions D. 2020 Analyzing Olive Residues as an Alternative Fuel 24 July. https://ddscalorimeters.com/analyzing-olive-residues-as-an-alternative-fuel/.
- Dahmouni, A. W., M. Ben Salah, F. Askri, C. Kerkeni, and S. Ben Nasrallah. 2011. Assessment of wind energy potential and optimal electricity generation in borj-cedria, Tunisia. Renewable and Sustainable Energy Reviews 15 (1):815–20. doi:10.1016/j.rser.2010.07.020.
- Das, B. K., N. Hoque, S. Mandal, T. K. Pal, and M. A. Raihan. 2017. A techno-economic feasibility of a stand-alone hybrid power generation for remote area application in Bangladesh. Energy 134:775–88. doi:10.1016/j.energy.2017.06.024.
- Deb, S., D. Li, S. Sinha, P. Malik, G. Raina, and J. Wang. 2023. Local energy system: A comprehensive review of modelling, tools and Pilot projects. Proceedings - 2nd International Conference on Power Electronics and Energy, ICPEE 2023, Chengdu, China, 1–6.
- Dermeche, S., M. Nadour, C. Larroche, F. Moulti-Mati, and P. Michaud. 2013. Olive mill wastes: Biochemical characterizations and valorization strategies. Process Biochemistry 48 (10):1532–52. doi:10.1016/j.procbio.2013.07.010.
- Elamouri, M., and F. B. Amar. 2008. Wind energy potential in Tunisia wind energy potential in Tunisia. Renewable Energy 33:758–768. doi:10.1016/j.renene.2007.04.005.
- Espeso, J., A. Isaza, J. Y. Lee, P. M. Sörensen, P. Jurado, R. D. J. Avena-Bustillos, M. Olaizola, and J. C. Arboleya. 2021. Olive Leaf Waste Management. Frontiers in Sustainable Food Systems 5 (May):1–13. doi:10.3389/fsufs.2021.660582.
- Eusebio, A., E. Almeida-Vara, G. Sena-Martins, M. Mateus, and J. Cardoso Duarte. 2002. Microbial treatment of olive oil wastewater. In Proceedings of the International Workshop on Water in the Mediterranean Basin. Resources and Sustainable Development, Monastir, Tunisia, 210–017.
- Fakih, A., P. Ghazalian, and N. Ghazzawi. 2020. The effects of power outages on the performance of manufacturing firms in the MENA region. Review of Middle East Economics and Finance 16 (3):1–28. doi:10.1515/rmeef-2020-0011.
- Feliciano, M., F. Maia, and A. Gonçalves. 2014. An analysis of eco co-efficiency and GHG emission of olive oil production in northeast of Portugal. Int. J. Environ. Ecol. Eng. 8:347–52.
- Fernández-Rodríguez, M. J., J. Cubero-Cardoso, D. de la Lama-Calvente, Á. Fernández-Prior, G. Rodríguez-Gutiérrez, and R. Borja. 2022. Anaerobic digestion of the residue (combination of wastewater and solid waste) from a new olive-oil manufacturing process based on an olive cold-pressing system: Kinetic approach and Process performance. Processes 10 (12):2552. doi:10.3390/pr10122552.
- Gargouri, K., Ben Rouina, B., Rhouma, A., Ayadi, M., Abichou, M., and Bentaher H. 2013. Case study of an integrated system for olive mill by-products management in Sfax region in central Tunisia. In: Present and future of the Mediterranean olive sector, Arcas, N., Arroyo López, F.N., Caballero , J., D’Andria, R., D’Andria, R., Fernández, M., Fernandez Escobar R., Garrido A., López-Miranda J., Msallem , M., Rallo, L., and Parras, M. (Eds.). Zaragoza: CIHEAM/IOC, pp. 75–84.
- Güven, A. F., and E. POYRAZ. 2021. Feasibility Study and Techno-Economic Analysis of Stand-Alone Hybrid Energy System for Muğla Province Köyceğiz. Karadeniz Fen Bilimleri Dergisi 11 (1):70–85. doi:10.31466/kfbd.880437.
- HOMER-ENERGI. 2016. HOMER Pro Version 3.7 User Manual. HOMER Energy 416.
- HOMERpro3.14. HOMER Generates Load Profiles According to LoadData. 2020.
- International Energy Agency (IEA). Online data service. Electricity Market Report. Retrieved July 19, 2023 on
- IRENA. 2012. Renewable energy technologies cost analysis series: Biomass for power generation. IRENA Working Paper 119 (June):1–20.
- IRENA. 2017. Electricity Storage and Renewables: Costs and Markets to 2030. Abu Dhabi: International Renewable Energy Agency. https://www.irena.org/publications/2017/Oct/Electricity-storage-and-renewables-costs-and-markets.
- Jebli, B., and B. Youssef. 2013. Energy consumption, output and trade nexus in North Africa. Munich Personal RePec Archive 47965.
- Karadöl, İ., C. Yıldız, and M. Şekkeli. 2021. Determining optimal spatial and temporal complementarity between wind and hydropower. Energy 230:120790. doi:10.1016/j.energy.2021.120790.
- Khan, M. A., T. A. Al-Attas, N. G. Yasri, H. Zhao, S. Larter, J. Hu, and M. G. Kibria. 2020. Techno-economic analysis of a solar-powered biomass electrolysis pathway for coproduction of hydrogen and value-added chemicals. Sustainable Energy and Fuels 4 (11):5568–77. doi:10.1039/D0SE01149E.
- Kheybari, S., F. M. Rezaie, S. A. Naji, and F. Naja. 2019. Evaluation of energy production technologies from biomass using analytical hierarchy process: The case of Iran. 232 232:257–65. doi:10.1016/j.jclepro.2019.05.357.
- Krishnamoorthy, M., A. D. V. R. Periyanayagam, C. Santhan Kumar, B. Praveen Kumar, S. Srinivasan, and P. Kathiravan. 2020. Optimal sizing, selection, and techno-economic analysis of battery storage for PV/BG-based hybrid rural electrification system. IETE Journal of Research 68 (6):4061–76. doi:10.1080/03772063.2020.1787239.
- Ladide, S., A. E. L. Fathi, M. Bendaoud, H. Hihi, and K. Faitah. 2019. Flexible design and assessment of a stand-alone hybrid renewable energy system: A case study Marrakech, Morocco. International Journal of Renewable Energy Research 9 (4):2003–22.
- Limb, L. 2022. The race for renewable batteries: What’s the future of solar and wind storage? Euronews.
- Llc, K. A. 2022. Data Collection Survey On Power Sector In Tunisia Final Report. Republic Tunisia Ministry of Industry, Energy and Mines Société Tunisenne de I ’ Electricite et du Gaz.
- Maatallah, T., N. Ghodhbane, and S. B. Nasrallah. 2016. Assessment viability for hybrid energy system (Pv/wind/diesel) with storage in the northernmost city in Africa, Bizerte, Tunisia. Renewable and Sustainable Energy Reviews 59:1639–52. doi:10.1016/j.rser.2016.01.076.
- Ma, L., T. Hu, Y. Liu, J. Liu, P. Zhou, J. Wang, M. Yang, B. Chen, and L. Li. 2020. Jo u a of. Journal of Hazardous Materials 124086:124086. doi:10.1016/j.jhazmat.2020.124086.
- Mandelli, S., J. Barbieri, R. Mereu, and E. Colombo. 2016. Off-grid systems for rural electrification in developing countries: Definitions, classification, and a comprehensive literature review. Renewable and Sustainable Energy Reviews 58:1621–46. doi:10.1016/j.rser.2015.12.338.
- May, G. J., A. Davidson, and B. Monahov. 2018. Lead batteries for utility energy storage: A review. Journal of Energy Storage 15:145–57. doi:10.1016/j.est.2017.11.008.
- Milanese, M., A. De Risi, A. De Riccardis, and D. Laforgia. 2014. Numerical study of anaerobic digestion system for olive pomace and mill wastewater. Energy Procedia 45:141–49. doi:10.1016/j.egypro.2014.01.016.
- Mohsen Moarefdoost, M. 2015. Optimization models for electricity networks and renewable energy under uncertainty. Lehigh Preserve Theses and Dissertations: Lehigh University.
- Mulenga, E., A. Kabanshi, H. Mupeta, M. Ndiaye, E. Nyirenda, and K. Mulenga. 2023. Techno-economic analysis of off-grid PV-Diesel power generation system for rural electrification: A case study of Chilubi district in Zambia. Renewable Energy 203:601–11. doi:10.1016/j.renene.2022.12.112.
- Musavi, F., M. Craciun, D. S. Gautam, W. Eberle, and W. G. Dunford. 2013. An LLC resonant DC-DC converter for wide output voltage range battery charging applications. IEEE Transactions on Power Electronics 28 (12):5437–45. doi:10.1109/TPEL.2013.2241792.
- National Institute of Statistics (INS)Population 2030 Retrieved September 23, 2023.
- National renewable energy laboratory (NREL). 2021. Cost of wind energy review. Nrel (December):68.
- Power Consumption table. 2003. Retrieved September 20, 2023.
- Rafat A. A., Ayed, Y., and Maaitah, O. N. 2023. Feasibility and optimal sizing analysis of hybrid renewable energy systems: A case study of Al-karak, Jordan. Renewable Energy 204:229–49. DOI:10.1016/j.renene.2022.12.109.
- Rahmat, M. A. A., A. S. Abd Hamid, Y. Lu, M. A. A. Ishak, S. Z. Suheel, A. Fazlizan, and A. Ibrahim. 2022. An analysis of renewable energy technology integration investments in Malaysia using HOMER pro. Sustainability (Switzerland) 14 (20):13684. doi:10.3390/su142013684.
- R Al Afif, T. A. 2018. Mesophilic anaerobic co-digestion of cow manure with three-phase olive mill solid waste. Energy Sources, Part A: Recovery, Utilization, and Environmental Effects 41 (15):1800–08. doi:10.1080/15567036.2018.1549157.
- Ramli, M. A. M., A. Hiendro, and Y. A. Al-Turki. 2016. Techno-economic energy analysis of wind/solar hybrid system: A case study for the western coastal area of Saudi Arabia. Renewable Energy 91:374–85. doi:10.1016/j.renene.2016.01.071.
- Rehman, A., H. Ma, M. Radulescu, C. I. Sinisi, L. M. Paunescu, M. S. Alam, and R. Alvarado. 2021. The energy mix dilemma and environmental sustainability: Interaction among greenhouse gas emissions. Nuclear Energy Urban Agglomeration and Economic Growth Energies 14 (22):7703. doi:10.3390/en14227703.
- Roig, A., M. L. CR, and M. SM. 2006. An overview of olive mill wastes and their valorization methods. Waste Management, 26, 960–69.
- Romero-García, J. M., Niño, L., Martínez-Patiño, C., Álvarez, C., Castro, E., and Negro, M. J. 2014. Biorefinery based on olive biomass. State of the art and future trends, Bioresour. Technol. 159:421–32. doi:10.1016/j.biortech.2014.03.062.
- Romero-García, J. M., L. Niño, C. Martínez-Patiño, C. Álvarez, E. Castro, and M. J. Negro. 2014. Biorefinery based on olive biomass. State-of-the-art and future trends. Bioresource Technology 159:421–32. doi:10.1016/j.biortech.2014.03.062.
- Rubio, J. A., L. A. Fdez-Güelfo, L. I. Romero-García, A. C. Wilkie, and J. L. García-Morales. 2022. Start-up of the mesophilic anaerobic co-digestion of two-phase olive-mill waste and cattle manure using volatile fatty acids as a process control parameter. Fuel 325:124901. doi:10.1016/j.fuel.2022.124901.
- Sawle, Y., and S. C. Gupta. 2014. Optimal sizing of photo voltaic/wind hybrid energy system for rural electrification. Proceedings of 6th IEEE Power India International Conference, PIICON 2014, Delhi, India, 19–22.
- Shakeri, P., Z. Durmic, J. Vadhanabhuti, and P. E. Vercoe. 2017. Products derived from olive leaves and fruits can alter in vitro ruminal fermentation and methane production. Journal of the Science of Food and Agriculture 97 (4):1367–72. doi:10.1002/jsfa.7876.
- Spark W. 2023 Climate and average weather year round in thala 9September
- Stehly, T., and Duff, P. 2022 National Renewable Energy Laboratory (NREL) report (Cost of Wind Energy Review. https://www.nrel.gov/docs/fy23osti/84774.pdf
- Studer 2023 Xtender datasheet March 27 November.
- Suresh, V., M. Muralidhar, and R. Kiranmayi. 2020. Modeling and optimization of an off-grid hybrid renewable energy system for electrification in rural areas. Energy Reports 6:594–604. doi:10.1016/j.egyr.2020.01.013.
- Tekin, A. R., and A. Dalgıç. 2000. Biogas production from olive pomace. Resources, Conservation & Recycling 30 (4):301–13. doi:10.1016/S0921-3449(00)00067-7.
- Townsend, A., and R. Gouws. 2022. A comparative review of lead-acid, lithium-ion and ultra-capacitor technologies and their degradation mechanisms. Energies 15 (13):4930. MDPI AG. doi:10.3390/en15134930.
- United Nations Development Programme (UNDP). 2023. Ensuring access to affordable, reliable, sustainable and modern energy for all.
- Ur Rashid, M., I. Ullah, M. Mehran, M. N. R. Baharom, and F. Khan. 2022. Techno-economic analysis of grid-connected hybrid renewable energy system for remote areas electrification using homer pro. Journal of Electrical Engineering and Technology 17 (2):981–97. doi:10.1007/s42835-021-00984-2.
- Vassilev, S. V., D. Baxter, L. K. Andersen, and C. G. Vassileva. 2010. An overview of the chemical composition of biomass. Fuel 89 (5):913–33. doi:10.1016/j.fuel.2009.10.022.
- Vendoti, S., M. Muralidhar, and R. Kiranmayi. 2020. Techno-economic analysis of off-grid solar/wind/biogas/biomass/fuel cell/battery system for electrification in a cluster of villages by HOMER software. Environment Development and Sustainability 123456789 (1):351–72. doi:10.1007/s10668-019-00583-2.
- Walczak, N. 2018. Operational evaluation of a small hydropower plant in the context of sustainable development. Water (Switzerland) 10 (9): doi:10.3390/w10091114.
- The wind power eocycle. the EOX M-21 data sheet. Retrieved July 15, 2023.
- World Bank. 2021. Power outages in firms in a typical month (number) - sub-saharan africa. The World Bank group. https://data.worldbank.org/indicator/IC.ELC.OUTG
- Zisos, A., G. Sakki, and A. Efstratiadis. 2023. Mixing renewable energy with pumped hydropower storage: Design optimization under uncertainty and other challenges. Sustainability 15 (18):13313. doi:10.3390/su151813313.