
 ?Mathematical formulae have been encoded as MathML and are displayed in this HTML version using MathJax in order to improve their display. Uncheck the box to turn MathJax off. This feature requires Javascript. Click on a formula to zoom.
ABSTRACT
The “Energy Transition Promotion Scheme: Promote Green Energy, Increase Nature Gas, Reduce Coal-fired, Achieve Nuclear-free” (The Policy) was launched in 2016 and was legally tied to the “Renewable Energy Development Act” (REDA) after its revision in 2019 in Taiwan. The “Regulations for the Management of Setting up Renewable Energy Power Generation Equipment of Power Users above a Certain Contract Capacity” (The Regulations) were released in late 2020 and represent the first regulations requiring physical renewable energy infrastructure in building construction. The Regulations focus on the group that consumes the most energy, energy-heavy industries (EHIs), and force them to reach a certain energy self-sufficiency. However, there was no information about the implementation of these regulations, and The Regulations had limited scientific support. This research aims to simulate the energy potential of following The Regulations through a case study to evaluate if the use of The Regulations reaches the target of The Policy. The results show that the energy generation potential can only reach 5% of energy self-sufficiency at the peak load hours through a rooftop solar energy system, which is the first option in The Policy. This would be worse if the annual energy consumption is considered as the comparison target or if the amount of installation is decreased by following the deduction rules. The simulation results show that the rules concerning deducting the renewable energy infrastructure should be revised and should instead encourage more installation to at least raise the energy self-efficiency condition.
1. Introduction
1.1. Introduction to the policy and regulations
The promotion of renewable energy is one of the most important missions for governments. Based on this core value, acts, as well as policies, are being established. Many countries have developed relative regulations or certificates to pursue this concept (Chastas, Theodosiou, and Bikas Citation2016; Crawford and Stephan Citation2013; Crawford et al. Citation2016; Famuyibo, Duffy, and Strachan Citation2013). Some of them tried to encourage the use of renewable energy infrastructure (Famuyibo, Duffy, and Strachan Citation2013) and see it as one of the methods for reaching energy self-sufficiency. As for the conditions in Taiwan, the first guiding act, the “Renewable Energy Development Act” (REDA), was launched in 2009 (Ministry of Economic Affairs Taiwan Citation2019), and it was revised in 2019; this was inspired by “Erneuerbare-Energien-Gesetz” (EEG), which was launched and revised in 2014 and 2017 in Germany, respectively. The 2019 version added “improving energy structure” and “reducing emission of greenhouse gases” to Article 1 to diversify and extend the power hierarchy of REDA for future regulations about greenhouse gases and energy management. Meanwhile, this revision established the year for the renewable energy target (Article 6) and removed the restriction of installing renewable energy infrastructure on diverse land use categories. Policies, as well as regulations, under REDA were proclaimed after this.
The core renewable energy policies in Taiwan are based on the “Energy Transition Promotion Scheme: Promote Green Energy, Increase Nature Gas, Reduce Coal-fired, Achieve Nuclear-free” (The Policy), which was launched in 2016. The first section of this scheme sets a target share of 20% of the total energy generation by 2025 (Bureau of Energy Taiwan Citation2016), which is the target year fixed in Article 6 of REDA. The core value of this section required that 20% of the energy use in 2025 should come from any sort of renewable energy facilities to decrease the dependency on traditional forms of energy generation. Among various types of renewable energy facilities, solar photovoltaic (PV) technology is considered the first priority of this policy.
According to the “National Electricity Supply and Demand Report 2021,” the installed capacity (IC) of renewable energy reached 19.5% (11.58 GW) for the whole country by the end of May in 2022, and two-thirds of this energy was contributed by solar energy (Bureau of Energy Taiwan Citation2022). Although the target of The Policy seems achievable based on the percentage of IC, the energy output in the same report indicated different conditions. In the energy generation report, solar energy and renewable energy only accounted for 2.7% and 6.0% of the energy generation, respectively (Bureau of Energy Taiwan Citation2022), indicating that the renewable energy output still needs significant improvement to reach the stage target in 2025.
The first act, “Regulations for the Management of Setting up Renewable Energy Power Generation Equipment of Power Users above a Certain Contract Capacity” (The Regulations), was released on 31 December 2020 to not only increase the renewable energy portion of the total energy demand but also to force energy-heavy industries (EHIs) to reach a certain level of energy self-sufficiency. This 15-article regulation solidifies The Policy scheme into practical action by binding the installation of renewable energy facilities to actual construction. It states that EHIs, which are energy users that have signed an electricity consumption agreement with an electricity retailing utility enterprise with a reserve capacity of more than 5,000 kW (Article 3, The Regulations), would be obligated, as legal entities, to install a renewable energy plant with a capacity totaling 10% of the user’s average chartered capacity (contract capacity, CC) over the previous year (Article 4, The Regulations) (Ministry of Economic Affairs Taiwan Citation2020). This act is considered the first direct act in Taiwan to push the private sector, following The Policy, to install renewable energy facilities to reach energy self-sufficiency. To encourage EHIs to start construction early and achieve the target in 2025, Article 7 of The Regulations sets up 20% and 10% deductions for EHIs that complete the installation of the required renewable energy facility within three and four years, respectively. At the same time, the renewable energy generation is required to be efficient. Article 10 of The Regulations indicates that a compulsory user of renewable energy that fails to reach 80% would be excluded from the compulsory IC. The appendix of The Regulations (Appendix. A) sets up a parameter of annual energy generation per IC for all types of renewable energy. For solar energy, the parameter is set to 1,250 kWh. This indicates that when the IC area of energy generation in the solar PV system is lower than 1000 kWh annually, this IC area will be excluded from The Regulations, in order to make EHIs maintain their renewable energy facilities. The connections between these articles are illustrated in .
Figure 1. The connections between the articles.
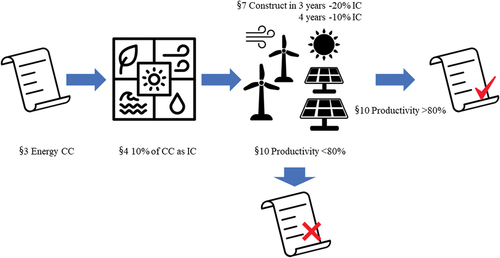
Overall, to follow The Regulations, 10% of the CC would be the compulsory IC. There will be a reduction of 20% or 10% if the installation is finished within three or four years after the requirement was announced by the government. Meanwhile, there is an 80% threshold to validate the efficiency of renewable energy equipment. The 2025 renewable energy target considers solar PV energy as the first priority to promote renewable energy, and the Appendix. A sets the parameter of annual energy generation per IC to 1,250 kWh. However, the authors of (Ko et al. Citation2015; Yue and Huang Citation2011) pointed out that the distribution of solar irradiance is uneven throughout Taiwan. The Taiwan Photovoltaic Industry Association (Taiwan Photovoltaic Industry Association Citation2018) summarized the average annual energy generation data from 2011 to 2014 released by the Bureau of Energy. The productivity is around 850 to 1,300 kWh per IC annually by county/municipality. This indicates that the number in The Regulations may not be precise and lacks scientific support. Hence, this study aims to quantify the energy potential through scientific evaluation to validate the proposed energy generation under The Regulations and consider the viability of making renewable energy reach 20% of the total energy generation for self-sufficiency according to the 2025 policy target.
1.2. Introduction to the solar energy simulation
Solar energy is one of the most common forms of power in the world. In urban areas, where space is limited and property values are high, solar PV systems are a popular option because they can be applied to existing structures without additional space being occupied at various scales (Jurasz, Dąbek, and Campana Citation2020; Kouhestani et al. Citation2019). To enable EHIs to comply with these regulations, the simulation of solar irradiation and its energy potential is necessary. In urban areas, rooftops and façades are the two main areas for installing such systems (Desthieux et al. Citation2018) on buildings. Although the area of a façade is larger than that of a rooftop, the energy potential is about 40% lower for a given area of a building (Redweik, Catita, and Brito Citation2013). In addition, the energy potential of a façade is invariably significantly overestimated due to its vertical structure, which can be covered by shadows from surrounding vegetation or construction (Willenborg, Pültz, and Kolbe Citation2018). Hence, although the regulations only consider the IC rather than the energy potential, a rooftop solar PV system may be a better choice than the façade system in order to achieve the requirements of The Policy.
When working on the simulation of solar energy potential, data on solar irradiance are crucial. Meteorological data vary over time and are commonly collected and combined into typical meteorological year (TMY) data for solar energy evaluation (Choi et al. Citation2011; Gagnon et al. Citation2016; Melius, Margolis, and Ong Citation2013). Long-term meteorological conditions, which are mainly those that occur for longer than 10 years, are recorded to build up the TMY data. By taking the most stable typical meteorological month (TMM) data as the representation, the inaccuracy that might have resulted from extreme weather conditions could be prevented. These data are mainly obtained from local meteorological stations (Biljecki et al. Citation2015; Ko et al. Citation2015) or satellite images (Han and Vohnicky Citation2022b; Perez et al. Citation2002; Pfeifroth et al. Citation2018; Urraca et al. Citation2017). Meteorological stations can provide precise local data, but it has been argued that these data may not be applicable to areas that are far from the station. Accuracy is another factor that should be taken into consideration since equipment at local stations needs to be regularly calibrated to prevent the data output from becoming inaccurate (Lin Citation2003). Although satellite-based solar radiation data are typically accurate, it is necessary to introduce several other parameters to simulate the amount of radiation reaching the ground (Han and Vohnicky Citation2022b). Therefore, the use of data collected from local stations is still inevitable. This approach is applied to calibrate satellite radiation data, and this calibrating correlation is adopted in each grid of a satellite image (Mazorra Aguiar et al. Citation2019) to calculate the localized solar radiation.
The use of satellite-based radiation data can improve the precision at the scale of a resolution grid. In a built environment, there will be further differentiation of the solar energy potential of each piece of land. Numerous tools, such as ESRI ArcGIS (Choi et al. Citation2011; Han, Chen, and Li Citation2022; Hong et al. Citation2017; Melius, Margolis, and Ong Citation2013), R.sun (Hofierka and Kaňuk Citation2009; Nguyen and Pearce Citation2010), Daysim (Jakubiec and Reinhart Citation2013), and Solar3Dcity (Biljecki et al. Citation2015), are widely used to simulate the solar potential in the built environment and build up an analysis of the shadow impact of each building model in the simulated area. The authors of (Han, Chen, and Li Citation2022) and (Li and Han Citation2022) aimed to determine the impact of the shadowing effect on building rooftops. They confirmed that a shorter building will suffer more serious shadowing effects than a taller one in general, but they found no correlation between the building height and the level of the shadowing effect. The impact of the shadowing effect may vary from building to building (Willenborg, Pültz, and Kolbe Citation2018); it is not strong on average. It has been shown through simulation that the solar irradiance of a rooftop system in an urban area could reach 95% to 100% of all (Han, Chen, and Li Citation2022). This total solar radiation is known as the global horizontal irradiance (GHI), and it is the sum of the direct normal irradiance (DNI), accounting for the solar zenith angle, and the diffuse horizontal irradiance (DHI) (Eq. 1). Although the determination of shadowing effects in building models is precise and close to reality, it is challenging to work at the scale of a region or country. Several studies have therefore introduced parameters for large-scale prediction (Izquierdo, Rodrigues, and Fueyo Citation2008; Wiginton, Nguyen, and Pearce Citation2010):
Apart from increasing the renewable energy generation, decreasing the energy consumption is an alternative way to reach energy self-sufficiency (Schimschar et al. Citation2011). Some industries pursue this target by performing better energy management. The reduction of energy usage for heating, lighting, fans, and some supporting facilities is applied (Bertoldi and Rezessy Citation2006; Ozturk Citation2005). Others prefer to perform equipment or technical renewal; this can be done, for example, through motor replacement (Tallini and Cedola Citation2016) or variable speed drive installation (Edgar et al. Citation2013; Nel et al. Citation2019). However, to reach energy self-sufficiency, many obstacles, including economic, regulatory, technological, organizational, behavioral, informational, and competence obstacles, should be faced (Leinauer et al. Citation2022).
1.3. Research barriers and research aims
From the perspective of government, the regulatory obstacle is the one that can be overcome, and the rest of the obstacles should be conquered mainly by industries. Throughout these types of regulations, covering energy consumption using renewable energy generation is common. As mentioned in Article 3, the energy consumption of a legal entity is charged based on the CC agreement. This means that the payment of the energy bill is based on the number of kilowatts specified in the agreement for each quarter of an hour (15 minutes). When the actual energy consumption exceeds the CC, there is an additional penalty charge (Chen and Liao Citation2011; Ke et al. Citation2015; Lee and Chen Citation2007). The legal entities entering into these electricity consumption agreements are mainly manufacturing EHIs (Chen and Liao Citation2011), whose daily energy consumption has a peak load period (Lee and Chen Citation2007). This means that the use of the CC to calculate the energy consumption for a whole day may be inappropriate, especially for some EHIs whose energy consumption is almost zero during off-peak hours (Schulz, Scharmer, and Zaeh Citation2020). In other words, CC cannot represent the real energy consumption and although the legal entities are mainly manufacturing, the energy consuming types are different.
Hence, the main barrier to this research has become clear. Due to the various industrial types and the lack of information about real energy consumption data, this research can only propose a simulation based on limited information on the CC and previous research (Lee and Chen Citation2007). Several EHI cases in are selected in order to study the possible conditions and to observe potential consistencies since EHIs are different and each of them cannot represent one another. While the CC is certainly linked to the peak load energy consumption within 15 minutes rather than the monthly total energy consumption, there is no strong connection between the IC and the energy generation. In other words, The Policy, whose target is to generate 20% of all energy using renewable energy infrastructure, may provide no guidance on the energy generation of the IC required by Article 3.
Therefore, to solidify the efficiency of The Regulations, there are two aims in this research. The first is to evaluate whether the IC of a rooftop solar PV system can reach the requirements set by Article 4. The second is to estimate how much of the energy consumption during the peak load period could be covered by solar energy by using TMY GHI data in all scenarios according to Article 7. There is a gap between the IC and energy generation (Bureau of Energy Taiwan Citation2022), and energy generation is the most helpful in terms of reaching the energy policy requirements for 2025. After evaluating the energy coverage conditions based on the individual rooftop solar energy potential, the possible connection between The Policy and this act could be discussed.
2. Methodology
The EHIs covered by Article 3 of the regulations are the target of this study. The list of EHIs, which includes all of the EHIs whose CC exceeds 5,000 kW in Taiwan, contains 450 legal entities. Industrial land use not only occupies a huge amount of area but also has the strongest potential for a rooftop solar system (Lukanov and Krieger Citation2019; Yue and Huang Citation2011). These EHIs are distributed across the country. Due to this research object, the simulation of the case study is based on parameters with Level of Detail 1 (LOD1) building models, which represent buildings as cubes using each building’s actual height. The rooftop area in an LOD1 building model would be the same as the actual building area since the majority of industrial buildings in the country have flat rooftops, and it will minimize the available area for the rooftop solar PV system.
To calculate the solar radiation, satellite-based TMY data on a grid with a spatial resolution of 2 km were used. The data are contributed by (Han and Vohnicky Citation2022b), and the output is illustrated in . This hourly-based solar irradiance data was constructed using satellite data from 2010 to 2021, and it was determined that the TMY GHI in Taiwan was between 970 and 1,700 kWh (). The distribution of the solar radiation generally depends on the latitude and terrain: northern areas have a lower GHI than southern ones, and the mountainous area in the middle of the island has the highest GHI, especially compared with the rift valley to the right side.
Figure 2. TMY-GHI map for Taiwan with the distribution of selected EHIs and ground stations.
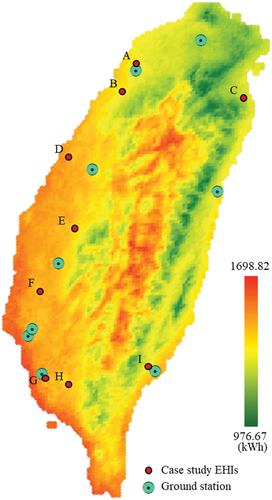
Of the 450 EHIs with the contract mentioned in The Regulations, nine EHIs scattered in different counties/cities were selected as case studies, and information about these EHIs, such as the building area, contract capacity, required installed capacity, and satellite-based GHI of the location, is shown in . The research mainly followed the structure of (Han, Chen, and Li Citation2022), and the flowchart of this research is presented in .
Figure 3. The flowchart of this research.
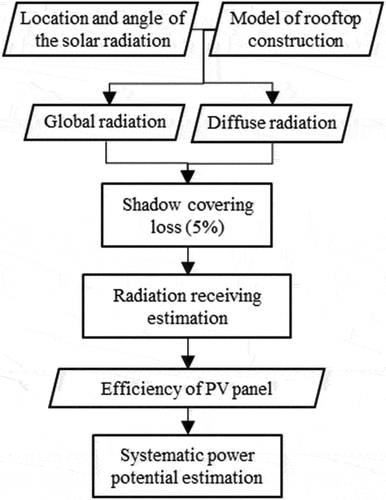
Since the methodology of (Han, Chen, and Li Citation2022) was designed for the LOD2 building model, and this research uses the LOD1 model, this research therefore only adopted the following calculation for the solar irradiance, as well as the solar energy potential calculation. For the country or municipality scale, the impact of the shadow effect is always replaced by a constant percentage (Izquierdo, Rodrigues, and Fueyo Citation2008). The case study area in (Han, Chen, and Li Citation2022) showed that the shadow effect is less than 5% of the energy potential loss. This research therefore assumed 5% as the energy potential loss for the shadow covering instead of applying Hillshade for the precise simulation, as (Han, Chen, and Li Citation2022) has done. To summarize the annual solar irradiance, the hourly DNI and DHI would be calculated individually. Therefore, the equation of solar irradiance is adopted (Eq. 2). In this equation, is the annual solar irradiance that the EHIs received on the rooftop per m2:
When calculating the energy self-sufficiency, the energy potential can be estimated by Eq. 3. It shows the relationship between the power (), transfer rate of power efficiency (
), received solar radiation (
), and area of the PV panel (
). The transfer rate of the power efficiency is a fixed constant that depends on the design of the PV panel and ranges from 8% to 29% depending on the material and manufacturing technique (Green et al. Citation2022). The most common rate used for research simulations is 15%, due to its high market share (Brito et al. Citation2012; Kanters and Davidsson Citation2014; Kouhestani et al. Citation2019). However, the transfer rate is validated based on the global AM1.5 spectrum (1000 W/m2) at 25°C (Green et al. Citation2022). As the panel temperature increases, the transfer rate will drop. It will reach about 12% when the temperature of the panel is maintained in the maximum heating condition (Amelia et al. Citation2016). To develop a conservative simulation,
is assumed to be 12% in this research:
Information on the EHIs used for the case study is given in . It shows that there is no direct connection between the area and CC. Based on the most common size of regular standard panels, reaching 1 IC would require a surface area of nearly 7 m2 (BrightstarSolar Citation2014). The ratio of IC achievement in percentage could be calculated by Eq. 4. 7 m2 is imported to standardize the unit between area and IC.
Table 1. Information on the nine EHIs selected for the case study.
Due to the unknown energy consumption conditions in EHIs, this research assumed that the energy consumption during the peak load period defined in Lee and Chen (Citation2007) would be the amount of the CC. Based on this assumption, this research therefore takes the energy consumption during this peak load period as a reference to consider the condition of energy self-sufficiency. In Lee and Chen (Citation2007), the peak load hours are from 10 am to 12 pm and from 1 pm to 5 pm from Monday to Saturday during the summer season. Although the energy consumption would be checked each quarter hour according to the CC rule, the actual energy consumption was recorded each hour. This research hence set the value of the CC as the hourly energy consumption during the peak load hours () (Eq. 5). Since there are 1,877 hours in the range defined by Lee and Chen (Citation2007) as the peak load hours, this amount is a threshold to see if the solar energy potential of EHIs could at least reach this energy requirement:
3. Results
The results of this study, which indicate the possible percentage of installing the IC for each case study company, are listed in . It can be seen that all of the case study EHIs have sufficient rooftop space for the installation of solar PV systems. 7 m2 (BrightstarSolar Citation2014) is applied to unify the unit between rooftop area and IC. It shows that the rooftop areas are affordable for the required IC, and some case studies can provide more than 10 times the required area. Due to the sufficient rooftop area, EHIs located in places with serious shadow effects, such as urban areas, may still have extra space, making it possible to select a space with a lower shadowing effect from the surroundings. In addition to our simulation of the requirements for Article 4, we also considered a scenario in which IC solar PV systems were installed in all of the possible areas to study the total energy generation potential for these EHIs.
Table 2. Possible percentages of the required IC for the case study EHIs.
By applying Equationequation (1)(1)
(1) , the potential energy generation could be estimated. lists the results. There are four scenarios in this table, which are the requirements for Article 4, the possible IC on the full rooftop area, and 10% and 20% reductions under Article 7, respectively. Case D had the highest energy potential. In terms of the requirements of Article 4, this result was due to the high CC of the company, while in the second scenario, case D had the highest potential due to the large area for rooftop PV installation.
Table 3. IC (units: kW) and annual solar energy potential (units: kWh) in scenarios for the case study EHIs.
When the values of the nine case study EHIs in the four columns in were ranked (), a relationship between the energy demand, area, and energy potential could be observed. Two scenarios concerning the compulsory reduction under Article 7 are not ranked in because they directly come from the first scenario. The required IC in can be considered to represent the energy consumption, as it is directly calculated from the CC, whereas the possible IC is linked to the area of the building. The ranking of the required IC energy potential showed the impact of the GHI in each area. For EHIs with an improvement in ranking between the requirements scenario and the possible generation scenario, this was mainly due to the huge proportional gap between the scale of the building area and the CC.
Table 4. Ranking of the solar energy potential based on the requirements of article 4 and the possible IC area for the case study EHIs.
The ranking numbers that are underlined in indicate that the rankings of five case study EHIs changed. Of these five cases, case A moved down in the rankings and case B moved up in the scenario of the required IC. The only variable between these two sections is the GHI, showing the importance of local solar irradiance. If the satellite-based data are not applied, these two cases will be grouped within the same ground station area due to the low geographical distance between them. This indicates the importance of applying data based on satellites to replace the data based on the local station. In the second scenario, in which we assumed solar PV panels would be installed over all possible rooftop areas, the results for the total potential energy generation are similar to those for the first scenario. The ones with the largest area will move up in the rankings compared with the simulation results for the required IC. The only switch happened between the possible IC section and its energy potential in cases F and I (shown in italics and underlined); this was due to the GHI. This indicates that although the GHI has an impact on the generation potential, the effect is not strong. The available area for installing the solar PV system can act as a substitute option to obtain a better energy generation performance.
To estimate the energy self-sufficiency, the values for the nine EHIs are listed in . It is clear that the energy generation from rooftop solar PV systems is limited in terms of industrial energy consumption in general. When we considered the whole area of the building to maximize the possible IC, the rooftop area became an important variable. EHIs with large or more numerous factory buildings could generally reach a higher IC. In case G, for example, if the entire rooftop area were covered by a solar PV system, the total energy generated could offset energy consumption for about 1,924 hours annually. It reaches the highest self-sufficiency. However, among the nine case studies, case D occupied the largest area with the highest
for the required IC;
for the possible IC falls to the middle rank, with only 591 quarter-hours annually. This indicates that a company with more buildings may have a higher potential for installing a rooftop solar PV system, but this does not mean that better energy self-sufficiency can be achieved. contains the values of divided by the total peak load hours. It shows that the required IC in fact only covers about 5% of all peak load hours. While this value is lower than the value for the full peak load hours, it would be much lower than the annual energy consumption. The differences between each case study are clear when the value of the coverable peak load hours for the possible IC is calculated as a percentage. The range is from less than 10% to over 100%. It shows that the density of energy consumption would be the barrier for promoting the installation of PV panel systems on the whole rooftop area because some case studies present limited improvement.
Table 5. Estimated in scenarios (requirements of Article 4 and maximum possible IC) (units: hours).
Table 6. Estimated by percentage in scenarios divided by the percentage of peak load periods (units: hours).
4. Discussion
There are two aims in this research, and an additional scenario, which assumed that the IC should cover the whole rooftop area, was introduced as an extension of the first aim. The research findings pointed out that based on the case studies, the rooftops of these EHIs would have sufficient space to meet the requirements of Article 4 in various scale of building areas and CCs. On the other hand, this result shows that the regulation is achievable without multi-renewable energy infrastructure. While the rooftop area is sufficient for satisfying the regulation, a suitable area with a smaller shadow effect can be found to reach a better energy performance. In the additional scenario for simulating the use of the entire rooftop area for installing a solar PV system, space would be a stronger factor for energy self-sufficiency than the local solar irradiance. It might be an alternative way for the government to convince EHIs to install more solar PV systems. This research simulated a 5% reduction in solar irradiance due to the shadow impact caused by the built environment surroundings. This reduction value may vary case by case. The CC in general would be the upper limit (or close to the upper limit) of energy consumption due to the serious penalty for exceeding the energy consumption. This is not a measure of the general energy consumption and will lose the accuracy of estimation, but the actual energy consumption will be close to this threshold occasionally during peak load hours. This simulation based on the requirements of Article 4 showed that only a limited proportion of the energy consumption at peak load hours could be covered. The value would be more limited while considering reaching energy self-sufficiency in the scale of annual energy consumption. While the values for the required IC in the case studies are much lower than 20% of the peak load hours, energy generation would be challenging for the total energy demand. Hence, the renewable energy requirement under existing regulations is less efficient when it comes to satisfying the policy requiring 20% of energy generation to be renewable in 2025. Meanwhile, Article 7 of The Regulations is meant to make EHIs start the installation of renewable energy facilities early, but the weak energy self-sufficiency result based on existing articles indicates that the compulsory reduction rules are unhelpful in pursuing The Policy. In the scenario in which the possible IC was maximized, the coverage of the energy consumption showed a strong improvement for most of the EHIs. However, some case studies show a weak improvement in that scenario, making it hard to make a solid recommendation for establishing this scenario based on the following guidance. In general, a lack of area is not an issue for the IC requirements under Article 4, and the energy generated in this way could never match the demand. From the perspective of applying the rooftop area for solar PV system analysis, the simulated results show that the requirements of Article 4 would only be a baseline for the required responsibility for renewable energy. Additional solar PV systems on spare rooftop areas are suggested, and the rules about required installation reduction should be reconsidered.
5. Conclusion
In this research, we simulated the renewable energy potential of rooftop PV systems for listed legal entities under Articles 3 and 4 of the “Regulations for the Management of Setting up Renewable Energy Power Generation Equipment of Power Users above a Certain Contract Capacity.” In this simulation, the area of the building and the CC, IC, and TMY-based GHI were the main indices. The results showed that the potential annual energy generation in all case study areas could only cover the peak energy consumption for about 100 hours. As this is merely 5% of the peak load hour coverage, The Policy, which has a goal of replacing 20% of the annual energy consumption with renewable energy, is hard to achieve. The simulation based on CC and peak load hour may be inaccurate but this conclusion would be the same since the gap is too huge. The compulsory reduction rules in Article 7 will make the result even worse. With these relatively weak results for power self-sufficiency, the idea of applying a rooftop solar system on every inch of a building is considerable. One of the cases in this research can provide more power than required during the peak load hours. This means that as long as the IC area is large enough, there is the potential to cover the energy consumption for the peak load hours. Although the results for energy coverage were poor compared with the total energy demand, as well as the core policy for generating 20% of the total energy through renewable energy, the output can certainly provide additional energy and still be helpful for pursuing renewable energy development. Hence, to pursue the core values of The Policy in view of applying rooftop solar PV systems, the installation of additional IC is suggested. Article 4 in the regulation should be a minimum requirement and should encourage legal entities to install additional renewable energy infrastructure. Meanwhile, the reduction of the compulsory renewable energy in Article 7 should be reviewed to prevent the extension of the gap between the policy and future energy generation. This research pointed out the gap between the policy, regulation, and the simulation result. Further research will focus on the comparison of energy policies between Taiwan and other countries to improve the current system and study this issue in different perspective, such as economic, finance, environmental impact, to mitigate the gap between the target and achievable result.
Acknowledgements
This work was funded by the TASA, Taiwan Space Agency, Taiwan under Grant TASA-1120450.
Disclosure statement
No potential conflict of interest was reported by the author(s).
Additional information
Funding
References
- Amelia, A. R., Y. M. Irwan, W. Z. Leow, M. Irwanto, I. Safwati, and M. Zhafarina. 2016. Investigation of the effect temperature on photovoltaic (PV) panel output performance. International Journal on Advanced Science, Engineering and Information Technology 6 (5):682–15. doi:10.18517/ijaseit.6.5.938.
- Bertoldi, P., and S. Rezessy. 2006. Tradable Certificates for Energy Savings (White Certificates).
- Biljecki, F., G. B. M. Heuvelink, H. Ledoux, and J. Stoter. 2015. Propagation of positional error in 3D GIS: Estimation of the solar irradiation of building roofs. International Journal of Geographical Information Science 29 (12):2269–94. doi:10.1080/13658816.2015.1073292.
- BrightstarSolar. 2014. Common sizes of solar panels. https://brightstarsolar.net/common-sizes-of-solar-panels/.
- Brito, M. C., N. Gomes, T. Santos, and J. A. Tenedório. 2012. Photovoltaic potential in a Lisbon suburb using LiDAR data. Solar Energy 86 (1):283–88. doi:10.1016/j.solener.2011.09.031.
- Bureau of Energy Taiwan. 2016. Energy transition promotion scheme: Promote green energy, increase nature gas, reduce coal-fired, achieve nuclear-free. Ministry of Economic Affairs. https://www.moea.gov.tw/MNS/english/Policy/Policy.aspx?menu_id=32904&policy_id=19.
- Bureau of Energy Taiwan. 2022. National electricity supply and demand report 2021. https://www.moeaboe.gov.tw/ECW/populace/content/wHandMenuFile.ashx?menu_id=20851&file_id=10995.
- Chastas, P., T. Theodosiou, and D. Bikas. 2016. Embodied energy in residential buildings-towards the nearly zero energy building: A literature review. Building and Environment 105:267–82. doi:10.1016/j.buildenv.2016.05.040.
- Chen, C. Y., and C. J. Liao. 2011. A linear programming approach to the electricity contract capacity problem. Applied Mathematical Modelling 35 (8):4077–82. doi:10.1016/j.apm.2011.02.032.
- Choi, Y., J. Rayl, C. Tammineedi, and J. R. S. Brownson. 2011. PV analyst: Coupling ArcGIS with TRNSYS to assess distributed photovoltaic potential in urban areas. Solar Energy 85 (11):2924–39. doi:10.1016/j.solener.2011.08.034.
- Crawford, R. H., E. L. Bartak, A. Stephan, and C. A. Jensen. 2016. Evaluating the life cycle energy benefits of energy efficiency regulations for buildings. Renewable and Sustainable Energy Reviews 63:435–51. doi:10.1016/j.rser.2016.05.061.
- Crawford, R. H., and A. Stephan. 2013. The significance of embodied energy in certified passive houses. Engineering and Technology 78:473–79.
- Desthieux, G., C. Carneiro, R. Camponovo, P. Ineichen, E. Morello, A. Boulmier, N. Abdennadher, S. Dervey, and C. Ellert. 2018. Solar energy potential assessment on rooftops and facades in large built environments based on lidar data, image processing, and cloud computing. Methodological background, application, and validation in Geneva (solar cadaster). Frontiers in Built Environment 4 (14). doi: 10.3389/fbuil.2018.00014.
- Edgar, G., D. Plessis, L. Liebenberg, and E. H. Mathews. 2013. The use of variable speed drives for cost-effective energy savings in South African mine cooling systems. Applied Energy 111:16–27. doi:10.1016/j.apenergy.2013.04.061.
- Famuyibo, A. A., A. Duffy, and P. Strachan. 2013. Achieving a holistic view of the life cycle performance of existing dwellings. Building and Environment 70:90–101. doi:10.1016/j.buildenv.2013.08.016.
- Gagnon, P., R. Margolis, J. Melius, C. Phillips, and R. Elmore. 2016. Rooftop solar photovoltaic technical potential in the united states. A detailed assessment. In National Renewable Energy Lab.(NREL). Golden: CO (United States).
- Green, M. A., E. D. Dunlop, J. Hohl-Ebinger, M. Yoshita, N. Kopidakis, K. Bothe, D. Hinken, M. Rauer, and X. Hao. 2022. Solar cell efficiency tables (version 60). Progress in Photovoltaics: Research and Applications 30 (7):687–701. doi:10.1002/pip.3595.
- Han, J.-Y., Y.-C. Chen, and S.-Y. Li. 2022. Utilising high-fidelity 3D building model for analysing the rooftop solar photovoltaic potential in urban areas. Solar Energy 235:187–99. doi:10.1016/j.solener.2022.02.041.
- Han, J.-Y., and P. Vohnicky. 2022a. Estimation of global and diffuse horizontal irradiance by machine learning techniques based on variables from the heliosat model. Journal of Cleaner Production 371 (July):133696. doi:10.1016/j.jclepro.2022.133696.
- Han, J.-Y., and P. Vohnicky. 2022b. An optimized approach for mapping solar irradiance in a mid-low latitude region based on a site-adaptation technique using Himawari-8 satellite imageries. Renewable Energy 187:603–17. doi:10.1016/j.renene.2022.01.027.
- Hofierka, J., and J. Kaňuk. 2009. Assessment of photovoltaic potential in urban areas using open-source solar radiation tools. Renewable Energy 34 (10):2206–14. doi:10.1016/j.renene.2009.02.021.
- Hong, T., M. Lee, C. Koo, K. Jeong, and J. Kim. 2017. Development of a method for estimating the rooftop solar photovoltaic (PV) potential by analyzing the available rooftop area using hillshade analysis. Applied Energy 194:320–32. doi:10.1016/j.apenergy.2016.07.001.
- Izquierdo, S., M. Rodrigues, and N. Fueyo. 2008. A method for estimating the geographical distribution of the available roof surface area for large-scale photovoltaic energy-potential evaluations. Solar Energy 82 (10):929–39. doi:10.1016/j.solener.2008.03.007.
- Jakubiec, J. A., and C. F. Reinhart. 2013. A method for predicting city-wide electricity gains from photovoltaic panels based on LiDAR and GIS data combined with hourly daysim simulations. Solar Energy 93:127–43. doi:10.1016/j.solener.2013.03.022.
- Jurasz, J. K., P. B. Dąbek, and P. E. Campana. 2020. Can a city reach energy self-sufficiency by means of rooftop photovoltaics? Case study from Poland. Journal of Cleaner Production 245:118813. doi:10.1016/j.jclepro.2019.118813.
- Kanters, J., and H. Davidsson. 2014. Mutual shading of PV modules on flat roofs: A parametric study. Energy Procedia 57:1706–15. doi:10.1016/j.egypro.2014.10.160.
- Ke, B. R., T. T. Ku, Y. L. Ke, C. Y. Chuang, and H. Z. Chen. 2015. Sizing the battery energy storage system on a university campus with prediction of load and photovoltaic generation. 2015 IEEE/IAS 51st Industrial and Commercial Power Systems Technical Conference, I and CPS 2015 52 (2):1136–47. doi:10.1109/ICPS.2015.7266406.
- Ko, L., J. C. Wang, C. Y. Chen, and H. Y. Tsai. 2015. Evaluation of the development potential of rooftop solar photovoltaic in Taiwan. Renewable Energy 76:582–95. doi:10.1016/j.renene.2014.11.077.
- Kouhestani, F. M., J. Byrne, D. Johnson, L. Spencer, P. Hazendonk, and B. Brown. 2019. Evaluating solar energy technical and economic potential on rooftops in an urban setting: The city of Lethbridge, Canada. International Journal of Energy and Environmental Engineering 10 (1):13–32. doi:10.1007/s40095-018-0289-1.
- Lee, T. Y., and C. L. Chen. 2007. Effects of photovoltaic generation system on the contract capacity selection of time-of-use rate industrial users. 2007 International Conference on Intelligent Systems Applications to Power Systems, ISAP. doi:10.1109/ISAP.2007.4441642.
- Leinauer, C., P. Schott, G. Fridgen, R. Keller, P. Ollig, and M. Weibelzahl. 2022. Obstacles to demand response: Why industrial companies do not adapt their power consumption to volatile power generation. Energy Policy 165 (112876):112876. doi:10.1016/j.enpol.2022.112876.
- Li, S. Y., and J. Y. Han. 2022. The impact of shadow covering on the rooftop solar photovoltaic system for evaluating self-sufficiency rate in the concept of nearly zero energy building. Sustainable Cities and Society 80 (September 2021):103821. doi:10.1016/j.scs.2022.103821.
- Lin, P.-H. 2003. Calibration and analysis of surface solar radiation of CWB station, Taiwan.
- Lukanov, B. R., and E. M. Krieger. 2019. Distributed solar and environmental justice: Exploring the demographic and socio-economic trends of residential PV adoption in California. Energy Policy 134 (April):110935. doi:10.1016/j.enpol.2019.110935.
- Mazorra Aguiar, L., J. Polo, J. M. Vindel, and A. Oliver. 2019. Analysis of satellite derived solar irradiance in islands with site adaptation techniques for improving the uncertainty. Renewable Energy 135:98–107. doi:10.1016/j.renene.2018.11.099.
- Melius, J., R. Margolis, and S. Ong. 2013. Estimating rooftop suitability for PV: A review of methods, patents, and validation techniques. NREL Technical Report 35. December. www.nrel.gov/publications.
- Ministry of Economic Affairs Taiwan. 2019. Renewable energy development act. Legislative Yuan of the Republic of China.
- Ministry of Economic Affairs Taiwan. 2020. Regulations for the management of setting up renewable energy power generation equipment of power users above a certain contract capacity. Legislative Yuan of the Republic of China.
- Nel, A. J. H., D. C. Arndt, J. C. Vosloo, and M. J. Mathews. 2019. Achieving energy efficiency with medium voltage variable speed drives for ventilation-on-demand in South African mines. Journal of Cleaner Production 232:379–90. doi:10.1016/j.jclepro.2019.05.376.
- Nguyen, H. T., and J. M. Pearce. 2010. Estimating potential photovoltaic yield with r.Sun and the open source geographical resources analysis support system. Solar Energy 84 (5):831–43. doi:10.1016/j.solener.2010.02.009.
- Ozturk, H. K. 2005. Energy usage and cost in textile industry: A case study for Turkey. Energy 30 (13):2424–46. doi:10.1016/j.energy.2004.11.014.
- Perez, R., P. Ineichen, K. Moore, M. Kmiecik, C. Chain, R. George, and F. Vignola. 2002. A new operational model for satellite-derived irradiances: Description and validation. Solar Energy 73 (5):307–17. doi:10.1016/S0038-092X(02)00122-6.
- Pfeifroth, U., A. Sanchez-Lorenzo, V. Manara, J. Trentmann, and R. Hollmann. 2018. Trends and variability of surface solar radiation in Europe based on surface- and satellite-based data records. Journal of Geophysical Research: Atmospheres 123 (3):1735–54. doi:10.1002/2017JD027418.
- Redweik, P., C. Catita, and M. Brito. 2013. Solar energy potential on roofs and facades in an urban landscape. Solar Energy 97:332–41. doi:10.1016/j.solener.2013.08.036.
- Schimschar, S., K. Blok, T. Boermans, and A. Hermelink. 2011. Germany’s path towards nearly zero-energy buildings-Enabling the greenhouse gas mitigation potential in the building stock. Energy Policy 39 (6):3346–60. doi:10.1016/j.enpol.2011.03.029.
- Schulz, J., V. M. Scharmer, and M. F. Zaeh. 2020. Energy self-sufficient manufacturing systems - Integration of renewable and decentralized energy generation systems. Procedia Manufacturing 43:40–47. doi:10.1016/j.promfg.2020.02.105.
- Taiwan Photovoltaic Industry Association. 2018. Average solar output in Taiwan. https://www.tpvia.org.tw/index.php?do=tech&pid=4&id=543.
- Tallini, A., and L. Cedola. 2016. Evaluation methodology for energy efficiency measures in industry and service sector. Energy Procedia 101:542–49. doi:10.1016/j.egypro.2016.11.069.
- Urraca, R., A. M. Gracia-Amillo, T. Huld, F. J. Martinez-de-Pison, J. Trentmann, A. V. Lindfors, A. Riihelä, and A. Sanz-Garcia. 2017. Quality control of global solar radiation data with satellite-based products. Solar Energy 158 (September):49–62. doi:10.1016/j.solener.2017.09.032.
- Wiginton, L. K., H. T. Nguyen, and J. M. Pearce. 2010. Quantifying rooftop solar photovoltaic potential for regional renewable energy policy. Computers, Environment and Urban Systems 34 (4):345–57. doi:10.1016/j.compenvurbsys.2010.01.001.
- Willenborg, B., M. Pültz, and T. H. Kolbe. 2018. Integration of semantic 3D city models and 3D mesh models for accuracy improvements of solar potential analyses. International Archives of the Photogrammetry, Remote Sensing and Spatial Information Sciences - ISPRS Archives 42 (4/W10):223–30. doi:10.5194/isprs-archives-XLII-4-W10-223-2018.
- Yue, C. D., and G. R. Huang. 2011. An evaluation of domestic solar energy potential in Taiwan incorporating land use analysis. Energy Policy 39 (12):7988–8002. doi:10.1016/j.enpol.2011.09.054.